Embed Size (px)
Citation preview
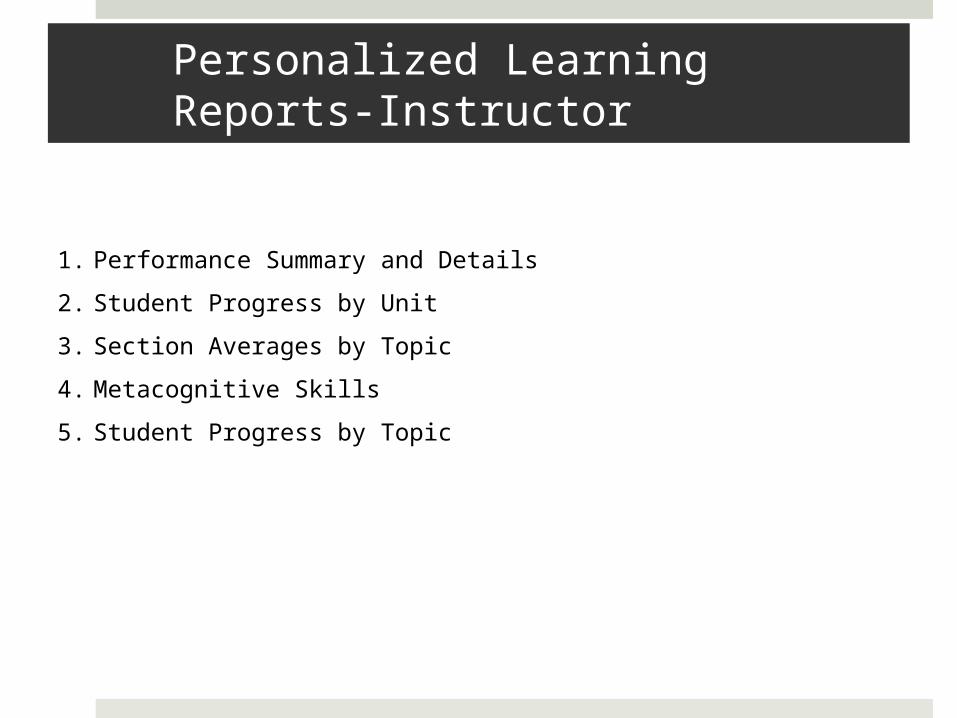
Personalized Learning Reports-Instructor
1. Performance Summary and Details
2. Student Progress by Unit
3. Section Averages by Topic
4. Metacognitive Skills
5. Student Progress by Topic
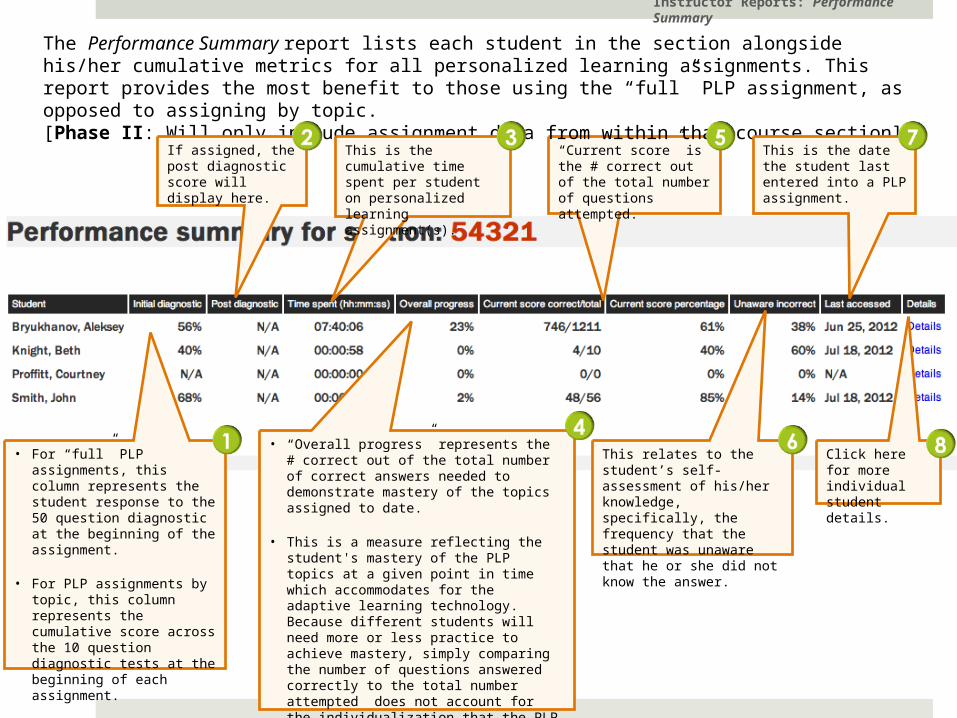
“Current score” is the # correct out of the total number of questions attempted.
The Performance Summary report lists each student in the section alongside his/her cumulative metrics for all personalized learning assignments. This report provides the most benefit to those using the “full” PLP assignment, as opposed to assigning by topic.[Phase II: Will only include assignment data from within that course section]
• For “full” PLP assignments, this column represents the student response to the 50 question diagnostic at the beginning of the assignment.
• For PLP assignments by topic, this column represents the cumulative score across the 10 question diagnostic tests at the beginning of each assignment.
If assigned, the post diagnostic score will display here.
This is the cumulative time spent per student on personalized learning assignment(s).
This relates to the student’s self-assessment of his/her knowledge, specifically, the frequency that the student was unaware that he or she did not know the answer.
This is the date the student last entered into a PLP assignment.
Click here for more individual student details.
Instructor Reports: Performance Summary
• “Overall progress” represents the # correct out of the total number of correct answers needed to demonstrate mastery of the topics assigned to date.
• This is a measure reflecting the student's mastery of the PLP topics at a given point in time which accommodates for the adaptive learning technology. Because different students will need more or less practice to achieve mastery, simply comparing the number of questions answered correctly to the total number attempted does not account for the individualization that the PLP affords. The next column (Current Score) provides such a “raw score” for each student.
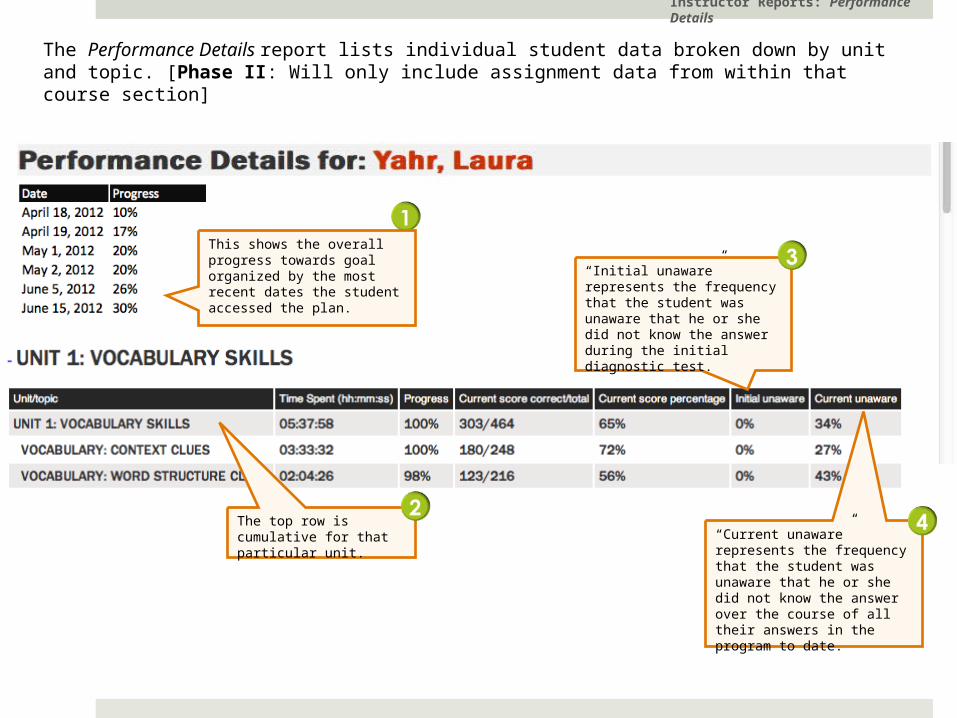
The Performance Details report lists individual student data broken down by unit and topic. [Phase II: Will only include assignment data from within that course section]
The top row is cumulative for that particular unit.
“Initial unaware” represents the frequency that the student was unaware that he or she did not know the answer during the initial diagnostic test.
“Current unaware” represents the frequency that the student was unaware that he or she did not know the answer over the course of all their answers in the program to date.
Instructor Reports: Performance Details
This shows the overall progress towards goal organized by the most recent dates the student accessed the plan.

The Student Progress by Unit report lists each student in the section alongside his/her cumulative progress for each unit, and overall. [Phase II: Will only include assignment data from within that course section]
This is the cumulative time spent per student on personalized learning assignment(s).
Phase I: This represents the overall progress toward mastery of all learning objectives available in all units.
Phase II: This progress will be measured against mastery of what was assigned to date.
Phase I: This represents the overall progress toward mastery of all learning objectives available in that unit.
Phase II: This progress will be measured against mastery of what was assigned to date from that unit.
Instructor Reports: Student Progress by Unit
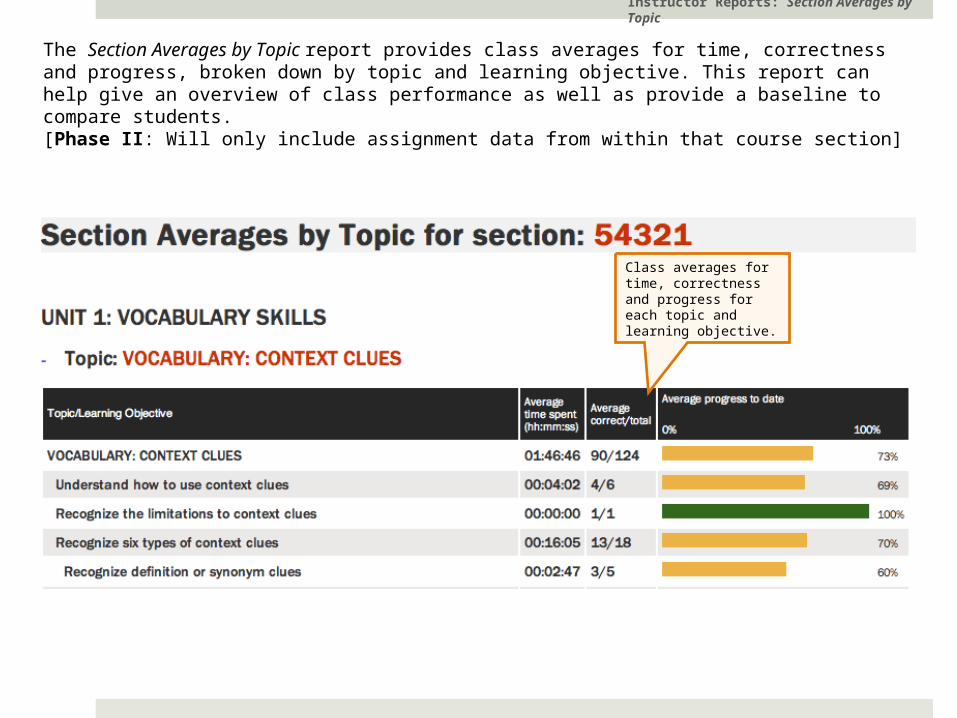
The Section Averages by Topic report provides class averages for time, correctness and progress, broken down by topic and learning objective. This report can help give an overview of class performance as well as provide a baseline to compare students.[Phase II: Will only include assignment data from within that course section]
Class averages for time, correctness and progress for each topic and learning objective.
Instructor Reports: Section Averages by Topic
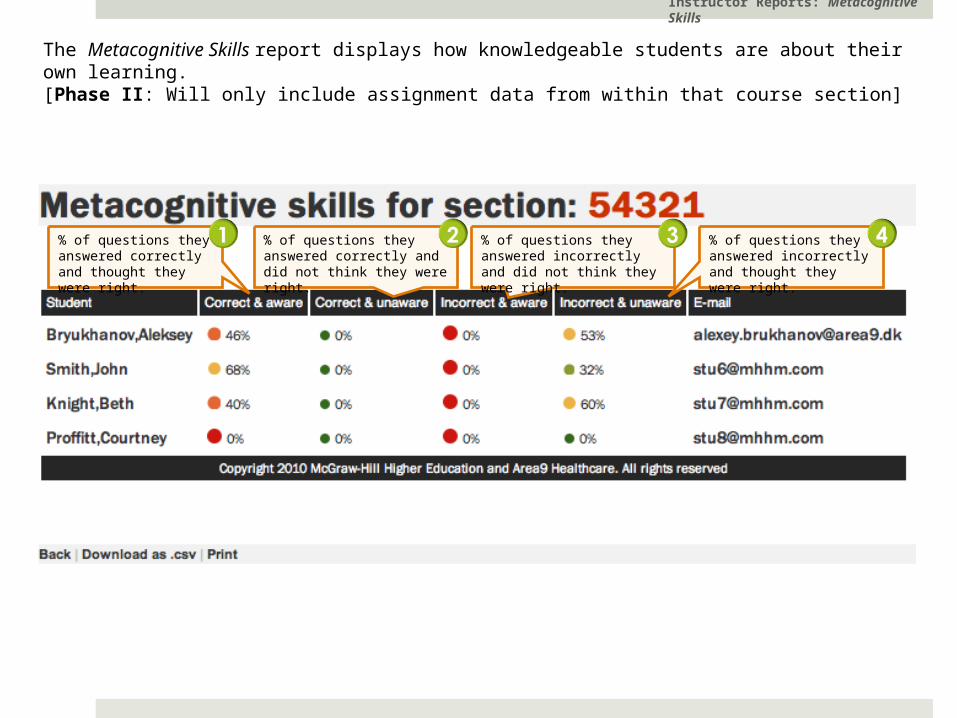
The Metacognitive Skills report displays how knowledgeable students are about their own learning. [Phase II: Will only include assignment data from within that course section]
% of questions they answered correctly and thought they were right.
% of questions they answered correctly and did not think they were right.
% of questions they answered incorrectly and did not think they were right.
% of questions they answered incorrectly and thought they were right.
Instructor Reports: Metacognitive Skills
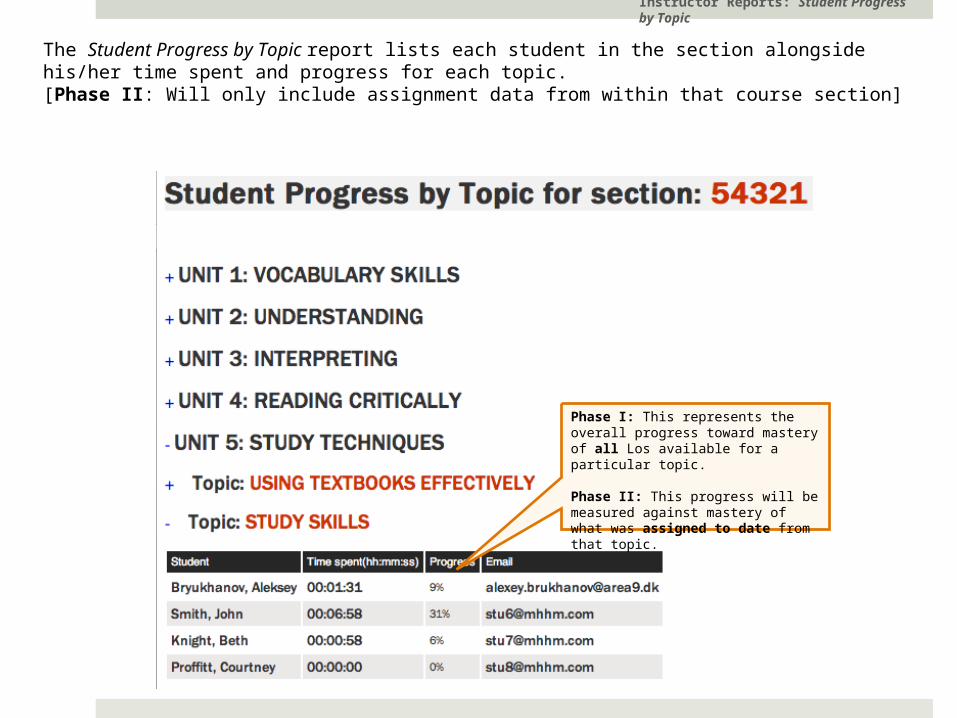
The Student Progress by Topic report lists each student in the section alongside his/her time spent and progress for each topic. [Phase II: Will only include assignment data from within that course section]
Phase I: This represents the overall progress toward mastery of all Los available for a particular topic.
Phase II: This progress will be measured against mastery of what was assigned to date from that topic.
Instructor Reports: Student Progress by Topic
Personalized Learning Reports-Student
1. Personalized Learning Assignment Main Page
2. Topic Scores
3. Most Challenging Learning Objectives
4. Missed Questions
5. Self-Assessment
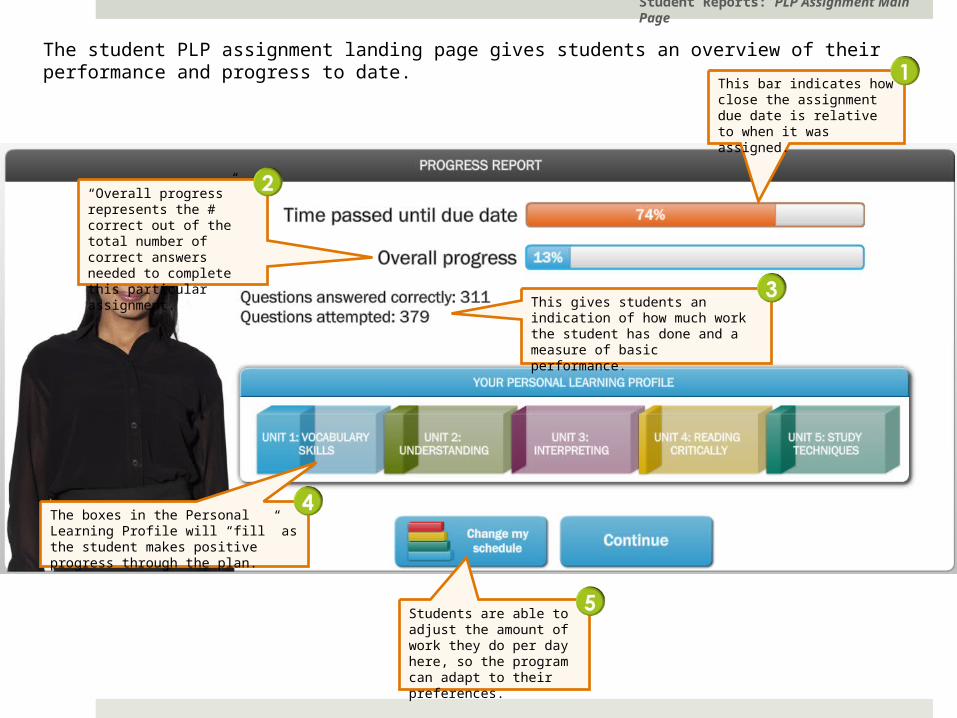
The student PLP assignment landing page gives students an overview of their performance and progress to date.
The boxes in the Personal Learning Profile will “fill” as the student makes positive progress through the plan.
This gives students an indication of how much work the student has done and a measure of basic performance.
This bar indicates how close the assignment due date is relative to when it was assigned.
“Overall progress” represents the # correct out of the total number of correct answers needed to complete this particular assignment.
Students are able to adjust the amount of work they do per day here, so the program can adapt to their preferences.
Student Reports: PLP Assignment Main Page
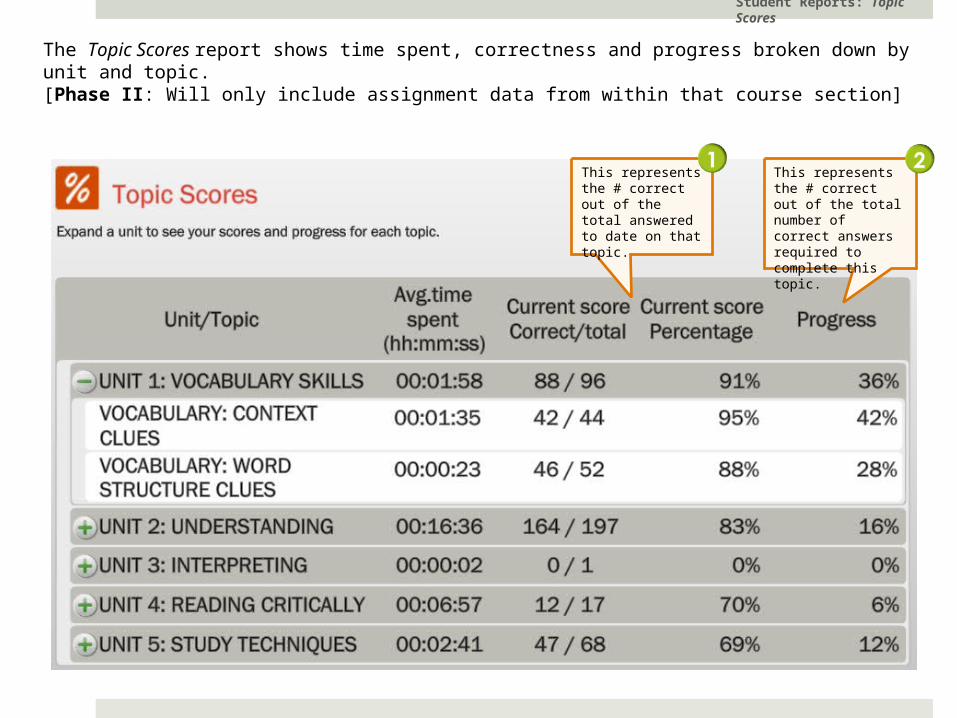
This represents the # correct out of the total answered to date on that topic.
This represents the # correct out of the total number of correct answers required to complete this topic.
The Topic Scores report shows time spent, correctness and progress broken down by unit and topic.[Phase II: Will only include assignment data from within that course section]
Student Reports: Topic Scores
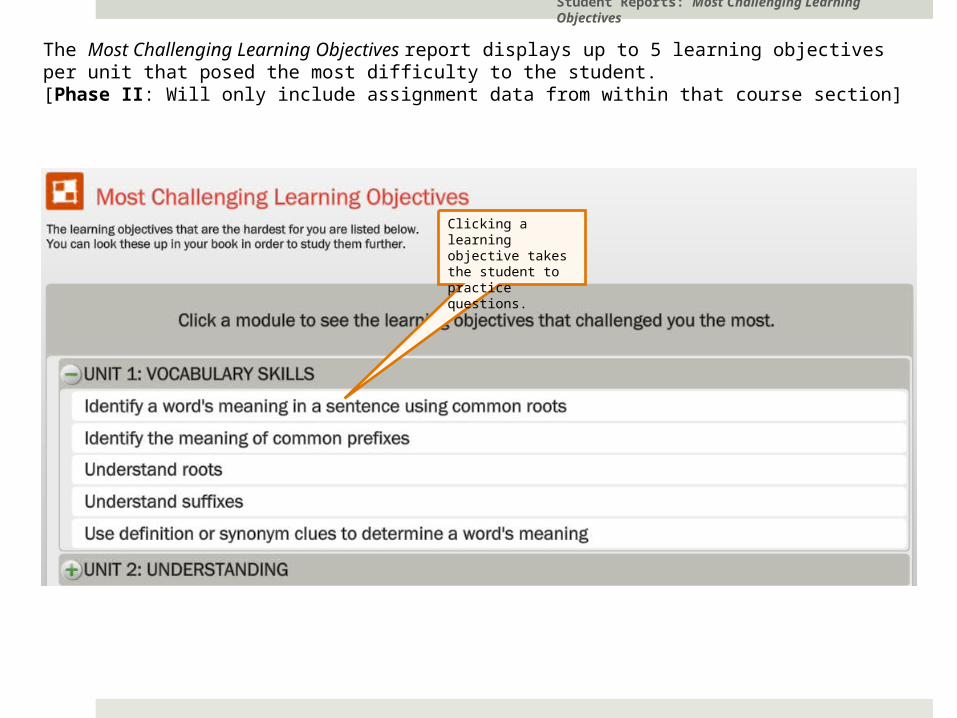
Clicking a learning objective takes the student to practice questions.
The Most Challenging Learning Objectives report displays up to 5 learning objectives per unit that posed the most difficulty to the student.[Phase II: Will only include assignment data from within that course section]
Student Reports: Most Challenging Learning Objectives
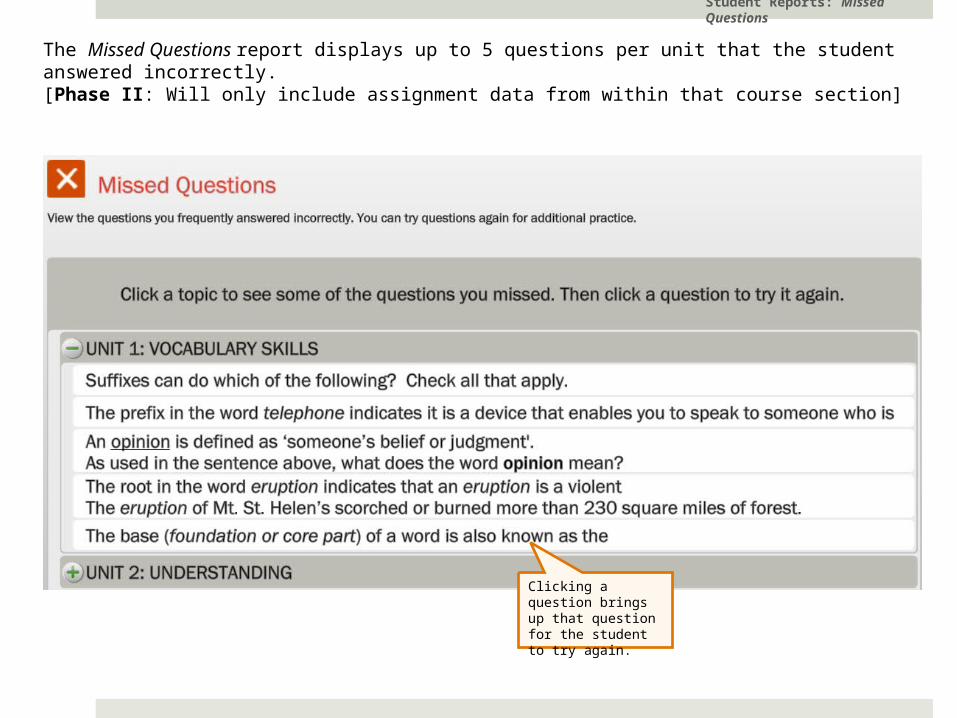
Clicking a question brings up that question for the student to try again.
The Missed Questions report displays up to 5 questions per unit that the student answered incorrectly.[Phase II: Will only include assignment data from within that course section]
Student Reports: Missed Questions
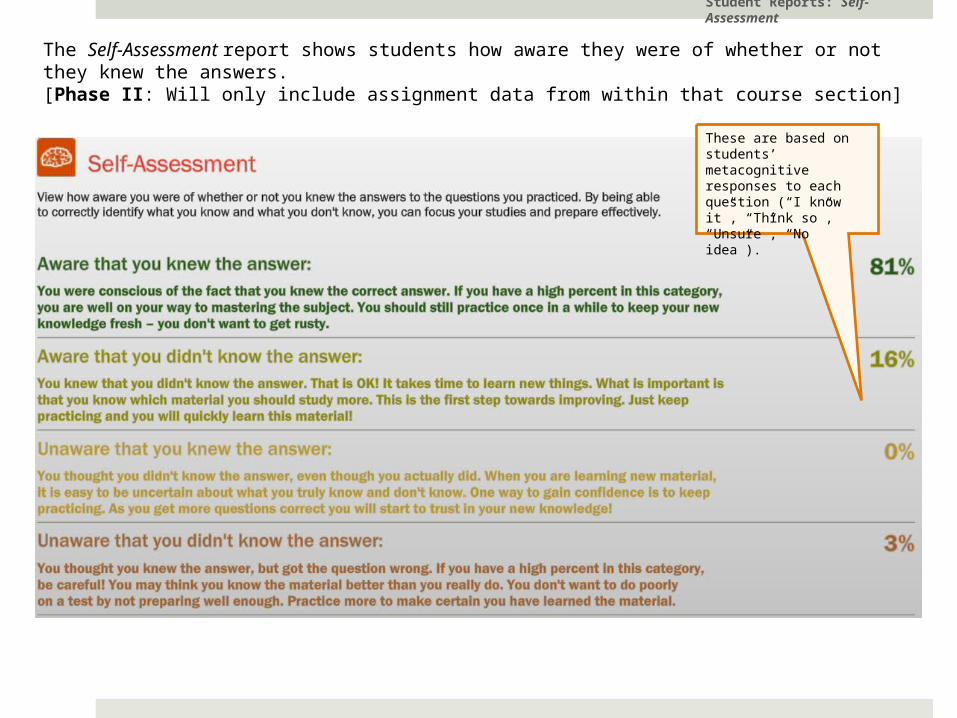
The Self-Assessment report shows students how aware they were of whether or not they knew the answers.[Phase II: Will only include assignment data from within that course section]
Student Reports: Self-Assessment
These are based on students’ metacognitive responses to each question (“I know it”, “Think so”, “Unsure”, “No idea”).
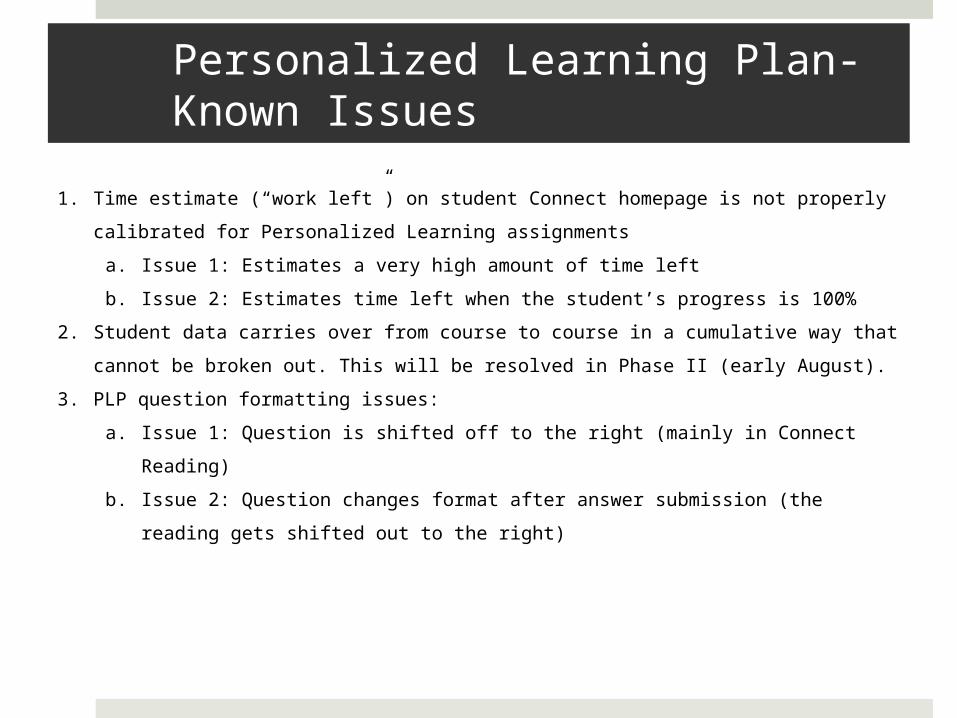
Personalized Learning Plan-Known Issues
1. Time estimate (“work left”) on student Connect homepage is not properly calibrated
for Personalized Learning assignments
a. Issue 1: Estimates a very high amount of time left
b. Issue 2: Estimates time left when the student’s progress is 100%
2. Student data carries over from course to course in a cumulative way that cannot be
broken out. This will be resolved in Phase II (early August).
3. PLP question formatting issues:
a. Issue 1: Question is shifted off to the right (mainly in Connect Reading)
b. Issue 2: Question changes format after answer submission (the reading gets
shifted out to the right)
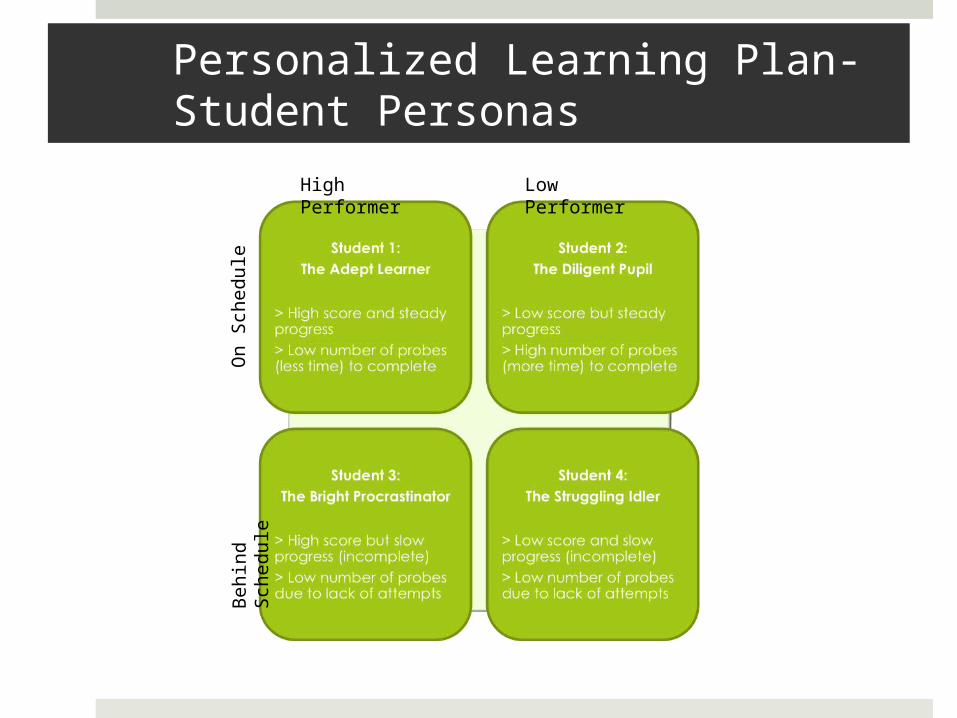
Personalized Learning Plan-Student Personas
High Performer
Low Performer
On
Sch
edule
Beh
ind S
chedule
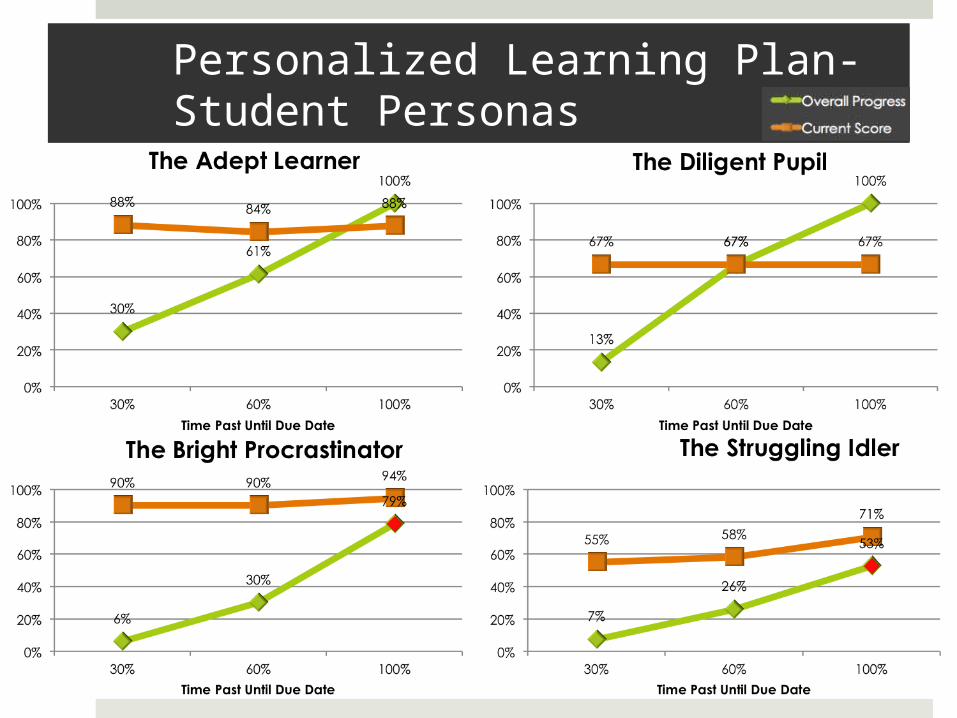
Personalized Learning Plan-Student Personas
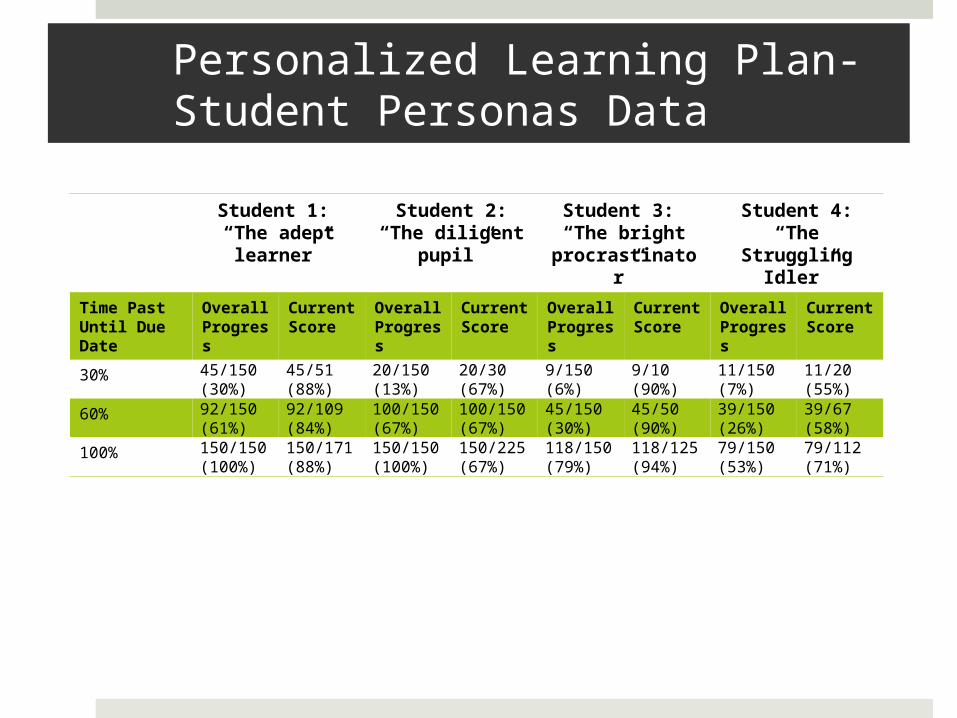
Personalized Learning Plan-Student Personas Data
Student 1: “The adept
learner”
Student 2:“The diligent
pupil”
Student 3: “The bright
procrastinator”
Student 4:“The
Struggling Idler”
Time Past Until Due Date
Overall Progress
Current Score
Overall Progress
Current Score
Overall Progress
Current Score
Overall Progress
Current Score
30% 45/150 (30%)
45/51 (88%)
20/150 (13%)
20/30 (67%)
9/150 (6%)
9/10 (90%)
11/150 (7%)
11/20 (55%)
60% 92/150 (61%)
92/109 (84%)
100/150 (67%)
100/150 (67%)
45/150 (30%)
45/50 (90%)
39/150 (26%)
39/67 (58%)
100% 150/150 (100%)
150/171(88%)
150/150 (100%)
150/225 (67%)
118/150 (79%)
118/125 (94%)
79/150 (53%)
79/112 (71%)