Embed Size (px)
Citation preview

PERSPECTIVEDecember 2019
The latest insights into global dairy markets
Your regular global overview of the dairy industry along with trends in milk production, commodity prices and dairy trade.
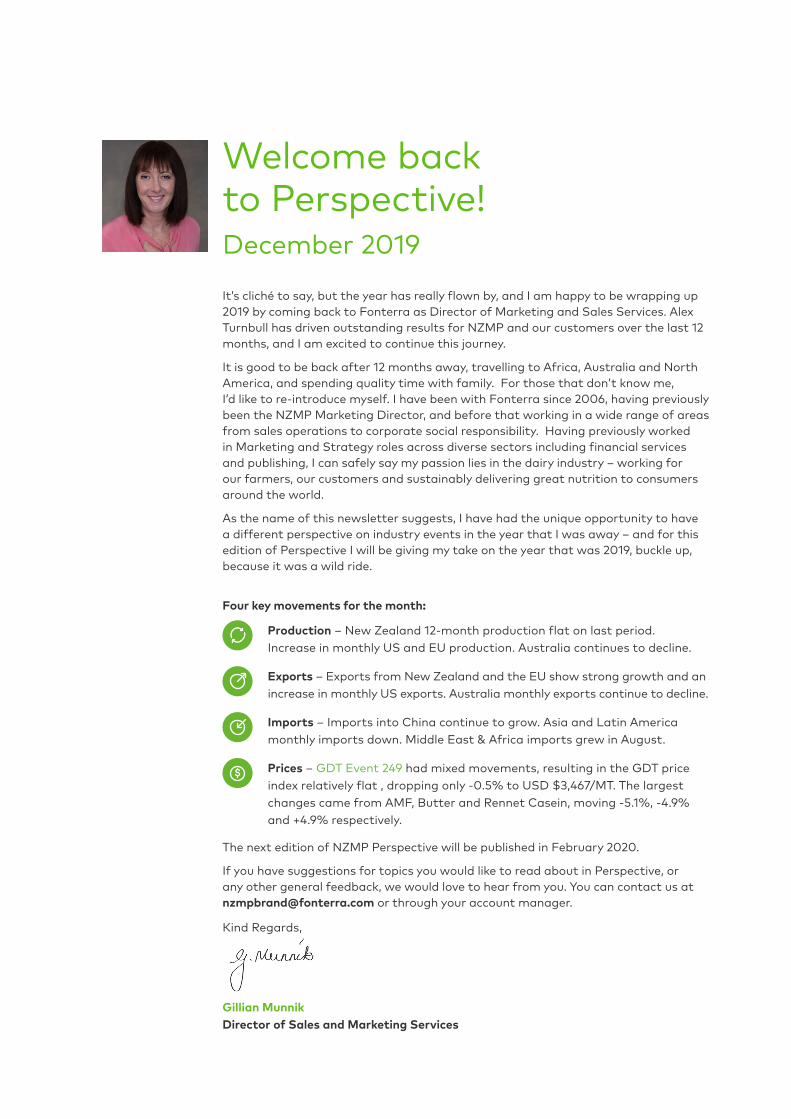
Welcome back to Perspective!December 2019
It’s cliché to say, but the year has really flown by, and I am happy to be wrapping up 2019 by coming back to Fonterra as Director of Marketing and Sales Services. Alex Turnbull has driven outstanding results for NZMP and our customers over the last 12 months, and I am excited to continue this journey.
It is good to be back after 12 months away, travelling to Africa, Australia and North America, and spending quality time with family. For those that don’t know me, I’d like to re-introduce myself. I have been with Fonterra since 2006, having previously been the NZMP Marketing Director, and before that working in a wide range of areas from sales operations to corporate social responsibility. Having previously worked in Marketing and Strategy roles across diverse sectors including financial services and publishing, I can safely say my passion lies in the dairy industry – working for our farmers, our customers and sustainably delivering great nutrition to consumers around the world.
As the name of this newsletter suggests, I have had the unique opportunity to have a different perspective on industry events in the year that I was away – and for this edition of Perspective I will be giving my take on the year that was 2019, buckle up, because it was a wild ride.
Four key movements for the month:
Production – New Zealand 12-month production flat on last period. Increase in monthly US and EU production. Australia continues to decline.
Exports – Exports from New Zealand and the EU show strong growth and an increase in monthly US exports. Australia monthly exports continue to decline.
Imports – Imports into China continue to grow. Asia and Latin America monthly imports down. Middle East & Africa imports grew in August.
Prices – GDT Event 249 had mixed movements, resulting in the GDT price index relatively flat , dropping only -0.5% to USD $3,467/MT. The largest changes came from AMF, Butter and Rennet Casein, moving -5.1%, -4.9% and +4.9% respectively.
The next edition of NZMP Perspective will be published in February 2020.
If you have suggestions for topics you would like to read about in Perspective, or any other general feedback, we would love to hear from you. You can contact us at [email protected] or through your account manager.
Kind Regards,
Gillian Munnik Director of Sales and Marketing Services
In this issueFeature article 4
Global production 8
Fonterra milk collection 9
Global exports 10
Global imports 11
Tracking the global dairy market 12
Global indicators 13
Commodity prices 14
GDT results 15
Industry commentary 16
Glossary 20
3

FEATURE ARTICLE
Gillian MunnikDirector of Sales & Marketing Services AMENA, Fonterra
A highly experienced marketing leader, Gillian Munnik joined Fonterra in 2006 and has held senior marketing and operational roles in the business during this time including NZMP Marketing Director from 2014 – 2018. In her new role as Director of Sales & Marketing Services, Gillian and her team manages the global NZMP brand and support the global ingredients teams with insights, tools, services and marketing.
Gillian aims to create sustainable value for our customers through sharing research, insights and ideas, and working together to take concepts through to commercial delivery.
Gillian has held a number of senior marketing and management roles in Publishing and Financial Services, particularly in the Agribusiness sector with a focus on introducing new services and risk management solutions into the sector.
Top 8 observations from 2019
To step outside of Fonterra for a year allowed me to take a different perspective on the industries of dairy, nutrition and agriculture. The year that was 2019 was one of extremes, innovations, global impact and the consumer voice reverberating above it all one clear message – short term thinking is for the past, time to look to the future, to long-term health, innovation and to protecting our environment.
To wrap up 2019, I have compiled my top 8 observations for the year (in no particular order), many of which we have covered in Perspective.
1 Brexit is still unresolved
Promises were made by many leaders in 2018 that Brexit would well and truly be resolved in the next year – so its very interesting that we have not seen the conclusion to this political rollercoaster. This has made the possibility of a no-deal Brexit increase in many forecasts.
However, these delays have allowed for the dairy industry to spend more time analysing the potential outcomes. In August we spoke to Andrew Kuyk, Director General of the Provision Trade Federation, about how a no-deal Brexit could impact the UK. Andrew stated
“If we leave without a deal, it is our food and farming industries that are going to be the most vulnerable…[the
EU] provides a third of all the food [the UK] eats…an unmitigated no deal
would be an unmitigated disaster”
The Brexit saga will continue into 2020 as the deadline was extended to the 31st of January 2020.
NZMP PERSPECTIVE DECEMBER 20194
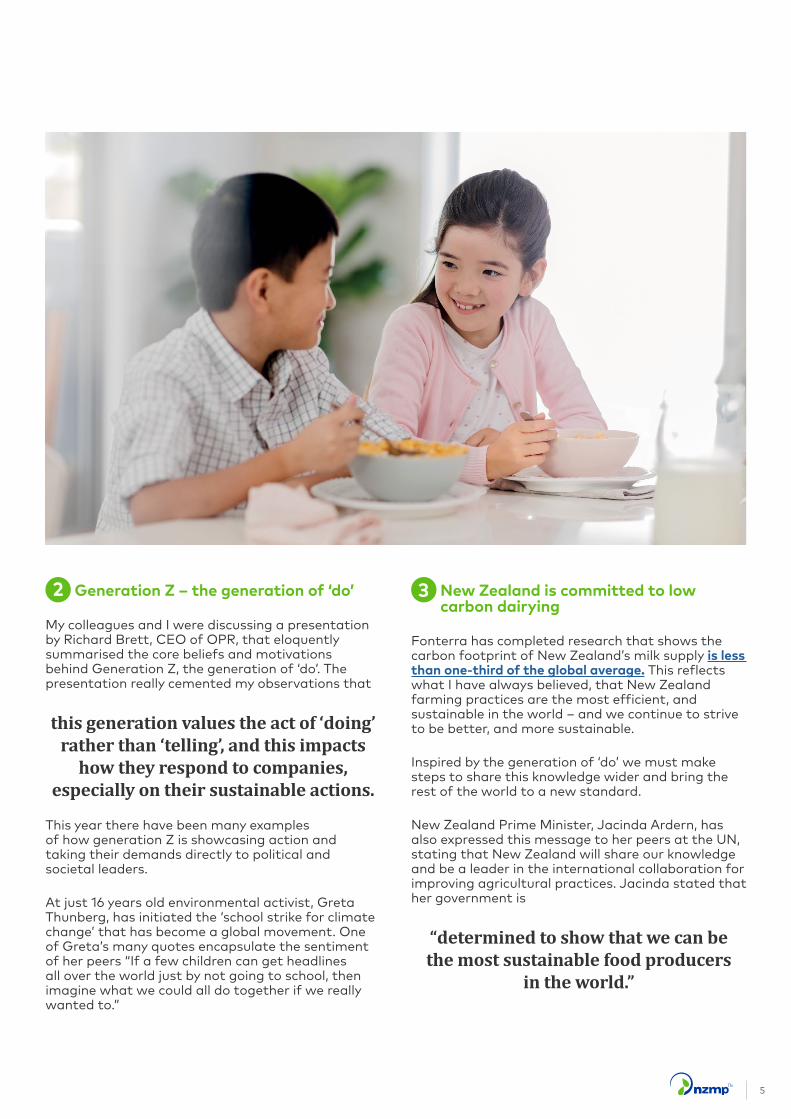
2 Generation Z – the generation of ‘do’
My colleagues and I were discussing a presentation by Richard Brett, CEO of OPR, that eloquently summarised the core beliefs and motivations behind Generation Z, the generation of ‘do’. The presentation really cemented my observations that
this generation values the act of ‘doing’ rather than ‘telling’, and this impacts
how they respond to companies, especially on their sustainable actions.
This year there have been many examples of how generation Z is showcasing action and taking their demands directly to political and societal leaders.
At just 16 years old environmental activist, Greta Thunberg, has initiated the ‘school strike for climate change’ that has become a global movement. One of Greta’s many quotes encapsulate the sentiment of her peers “If a few children can get headlines all over the world just by not going to school, then imagine what we could all do together if we really wanted to.”
3 New Zealand is committed to low carbon dairying
Fonterra has completed research that shows the carbon footprint of New Zealand’s milk supply is less than one-third of the global average. This reflects what I have always believed, that New Zealand farming practices are the most efficient, and sustainable in the world – and we continue to strive to be better, and more sustainable.
Inspired by the generation of ‘do’ we must make steps to share this knowledge wider and bring the rest of the world to a new standard.
New Zealand Prime Minister, Jacinda Ardern, has also expressed this message to her peers at the UN, stating that New Zealand will share our knowledge and be a leader in the international collaboration for improving agricultural practices. Jacinda stated that her government is
“determined to show that we can be the most sustainable food producers
in the world.”
5
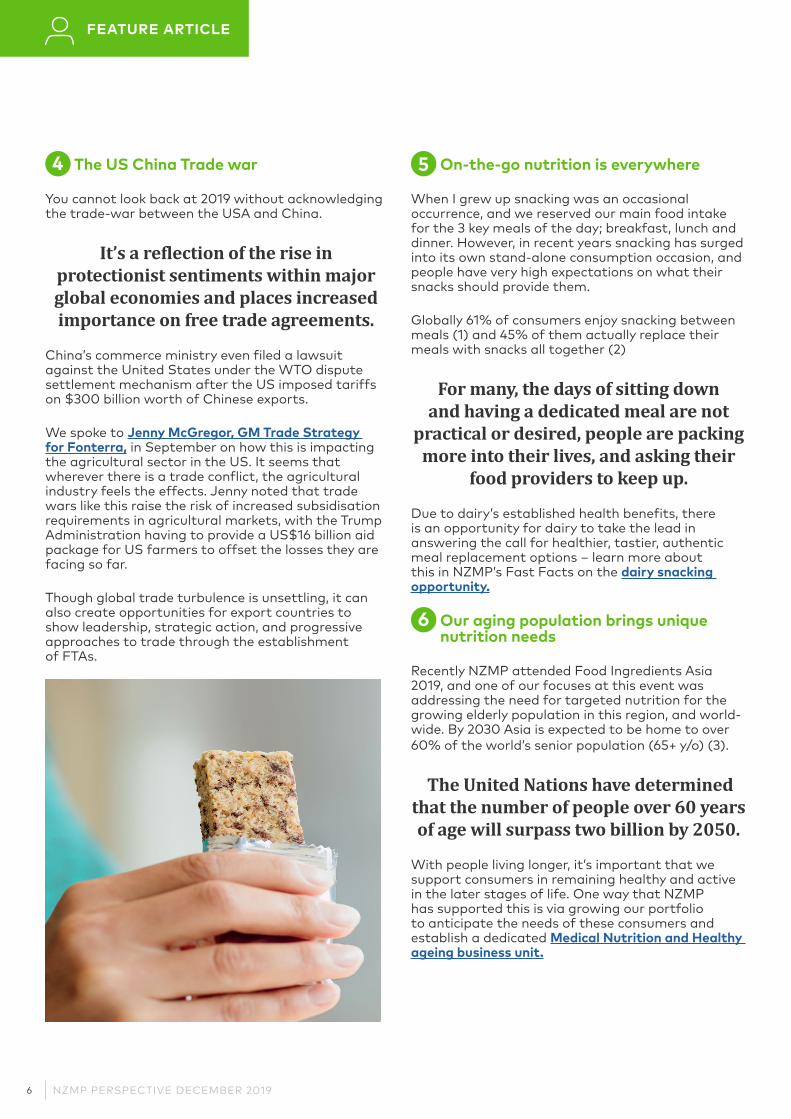
4 The US China Trade war
You cannot look back at 2019 without acknowledging the trade-war between the USA and China.
It’s a reflection of the rise in protectionist sentiments within major global economies and places increased importance on free trade agreements.
China’s commerce ministry even filed a lawsuit against the United States under the WTO dispute settlement mechanism after the US imposed tariffs on $300 billion worth of Chinese exports.
We spoke to Jenny McGregor, GM Trade Strategy for Fonterra, in September on how this is impacting the agricultural sector in the US. It seems that wherever there is a trade conflict, the agricultural industry feels the effects. Jenny noted that trade wars like this raise the risk of increased subsidisation requirements in agricultural markets, with the Trump Administration having to provide a US$16 billion aid package for US farmers to offset the losses they are facing so far.
Though global trade turbulence is unsettling, it can also create opportunities for export countries to show leadership, strategic action, and progressive approaches to trade through the establishment of FTAs.
FEATURE ARTICLE
5 On-the-go nutrition is everywhere
When I grew up snacking was an occasional occurrence, and we reserved our main food intake for the 3 key meals of the day; breakfast, lunch and dinner. However, in recent years snacking has surged into its own stand-alone consumption occasion, and people have very high expectations on what their snacks should provide them.
Globally 61% of consumers enjoy snacking between meals (1) and 45% of them actually replace their meals with snacks all together (2)
For many, the days of sitting down and having a dedicated meal are not
practical or desired, people are packing more into their lives, and asking their
food providers to keep up.
Due to dairy’s established health benefits, there is an opportunity for dairy to take the lead in answering the call for healthier, tastier, authentic meal replacement options – learn more about this in NZMP’s Fast Facts on the dairy snacking opportunity.
6 Our aging population brings unique nutrition needs
Recently NZMP attended Food Ingredients Asia 2019, and one of our focuses at this event was addressing the need for targeted nutrition for the growing elderly population in this region, and world-wide. By 2030 Asia is expected to be home to over 60% of the world’s senior population (65+ y/o) (3).
The United Nations have determined that the number of people over 60 years of age will surpass two billion by 2050.
With people living longer, it’s important that we support consumers in remaining healthy and active in the later stages of life. One way that NZMP has supported this is via growing our portfolio to anticipate the needs of these consumers and establish a dedicated Medical Nutrition and Healthy ageing business unit.
NZMP PERSPECTIVE DECEMBER 20196
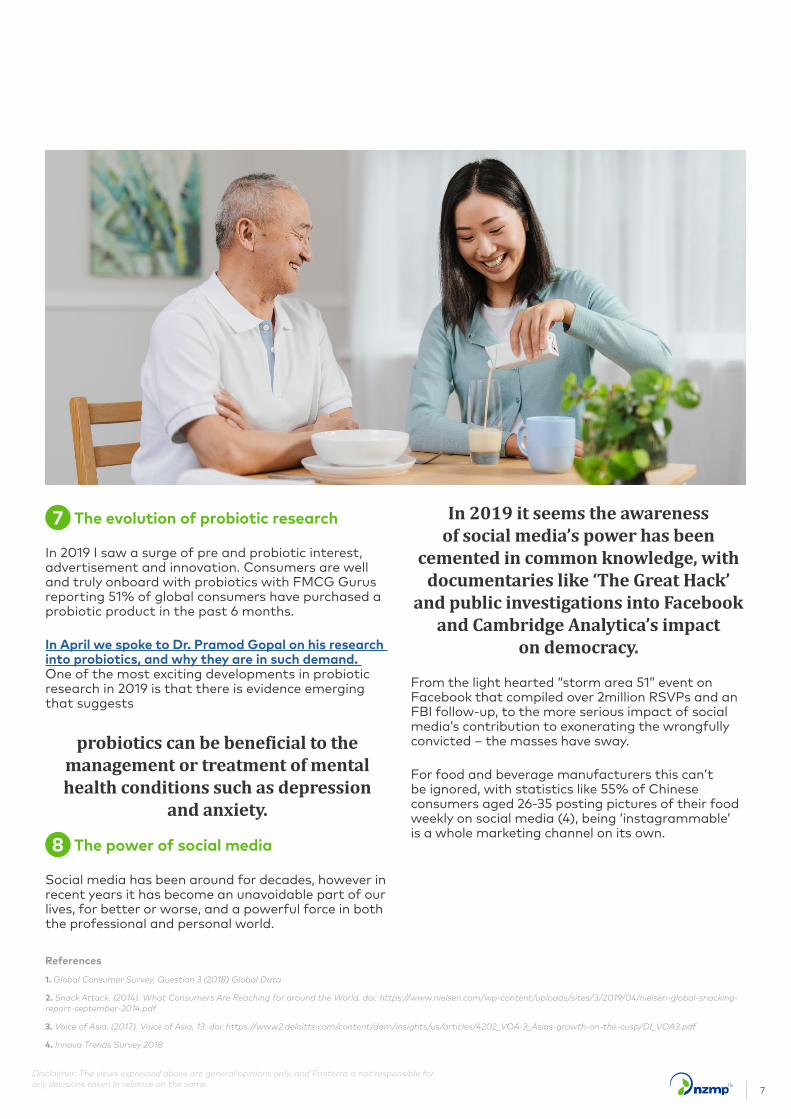
7 The evolution of probiotic research
In 2019 I saw a surge of pre and probiotic interest, advertisement and innovation. Consumers are well and truly onboard with probiotics with FMCG Gurus reporting 51% of global consumers have purchased a probiotic product in the past 6 months.
In April we spoke to Dr. Pramod Gopal on his research into probiotics, and why they are in such demand. One of the most exciting developments in probiotic research in 2019 is that there is evidence emerging that suggests
probiotics can be beneficial to the management or treatment of mental health conditions such as depression
and anxiety.
8 The power of social media
Social media has been around for decades, however in recent years it has become an unavoidable part of our lives, for better or worse, and a powerful force in both the professional and personal world.
In 2019 it seems the awareness of social media’s power has been
cemented in common knowledge, with documentaries like ‘The Great Hack’
and public investigations into Facebook and Cambridge Analytica’s impact
on democracy.
From the light hearted “storm area 51” event on Facebook that compiled over 2million RSVPs and an FBI follow-up, to the more serious impact of social media’s contribution to exonerating the wrongfully convicted – the masses have sway.
For food and beverage manufacturers this can’t be ignored, with statistics like 55% of Chinese consumers aged 26-35 posting pictures of their food weekly on social media (4), being ‘instagrammable’ is a whole marketing channel on its own.
Disclaimer: The views expressed above are general opinions only, and Fonterra is not responsible for any decisions taken in reliance on the same.
References
1. Global Consumer Survey, Question 3 (2018) Global Data
2. Snack Attack. (2014). What Consumers Are Reaching for around the World. doi: https://www.nielsen.com/wp-content/uploads/sites/3/2019/04/nielsen-global-snacking-report-september-2014.pdf
3. Voice of Asia. (2017). Voice of Asia, 13. doi: https://www2.deloitte.com/content/dam/insights/us/articles/4202_VOA-3_Asias-growth-on-the-cusp/DI_VOA3.pdf
4. Innova Trends Survey 2018
7
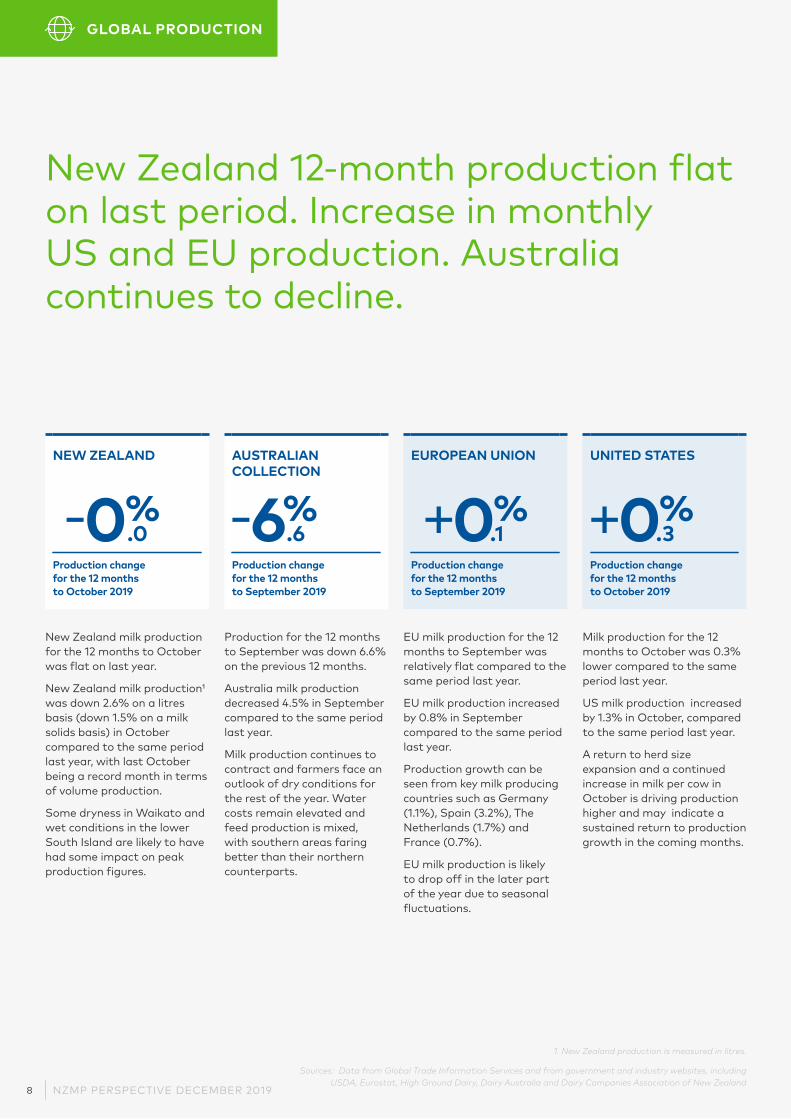
New Zealand 12-month production flat on last period. Increase in monthlyUS and EU production. Australia continues to decline.
1. New Zealand production is measured in litres.
Sources: Data from Global Trade Information Services and from government and industry websites, including USDA, Eurostat, High Ground Dairy, Dairy Australia and Dairy Companies Association of New Zealand
GLOBAL PRODUCTION
EUROPEAN UNION
+0%Production change for the 12 months to September 2019
EU milk production for the 12 months to September was relatively flat compared to the same period last year.
EU milk production increased by 0.8% in September compared to the same period last year.
Production growth can be seen from key milk producing countries such as Germany (1.1%), Spain (3.2%), The Netherlands (1.7%) and France (0.7%).
EU milk production is likely to drop off in the later part of the year due to seasonal fluctuations.
NEW ZEALAND
-0%Production change for the 12 months to October 2019
New Zealand milk production for the 12 months to October was flat on last year.
New Zealand milk production¹ was down 2.6% on a litres basis (down 1.5% on a milk solids basis) in October compared to the same period last year, with last October being a record month in terms of volume production.
Some dryness in Waikato and wet conditions in the lower South Island are likely to have had some impact on peak production figures.
UNITED STATES
+0%Production change for the 12 months to October 2019
Milk production for the 12 months to October was 0.3% lower compared to the same period last year.
US milk production increased by 1.3% in October, compared to the same period last year.
A return to herd size expansion and a continued increase in milk per cow in October is driving production higher and may indicate a sustained return to production growth in the coming months.
AUSTRALIAN COLLECTION
-6%Production change for the 12 months to September 2019
Production for the 12 months to September was down 6.6% on the previous 12 months.
Australia milk production decreased 4.5% in September compared to the same period last year.
Milk production continues to contract and farmers face an outlook of dry conditions for the rest of the year. Water costs remain elevated and feed production is mixed, with southern areas faring better than their northern counterparts.
.6 .1 .3.0
NZMP PERSPECTIVE DECEMBER 20198
JUN JUL AUG SEP OCT NOV DEC JAN FEB MAR APR MAY
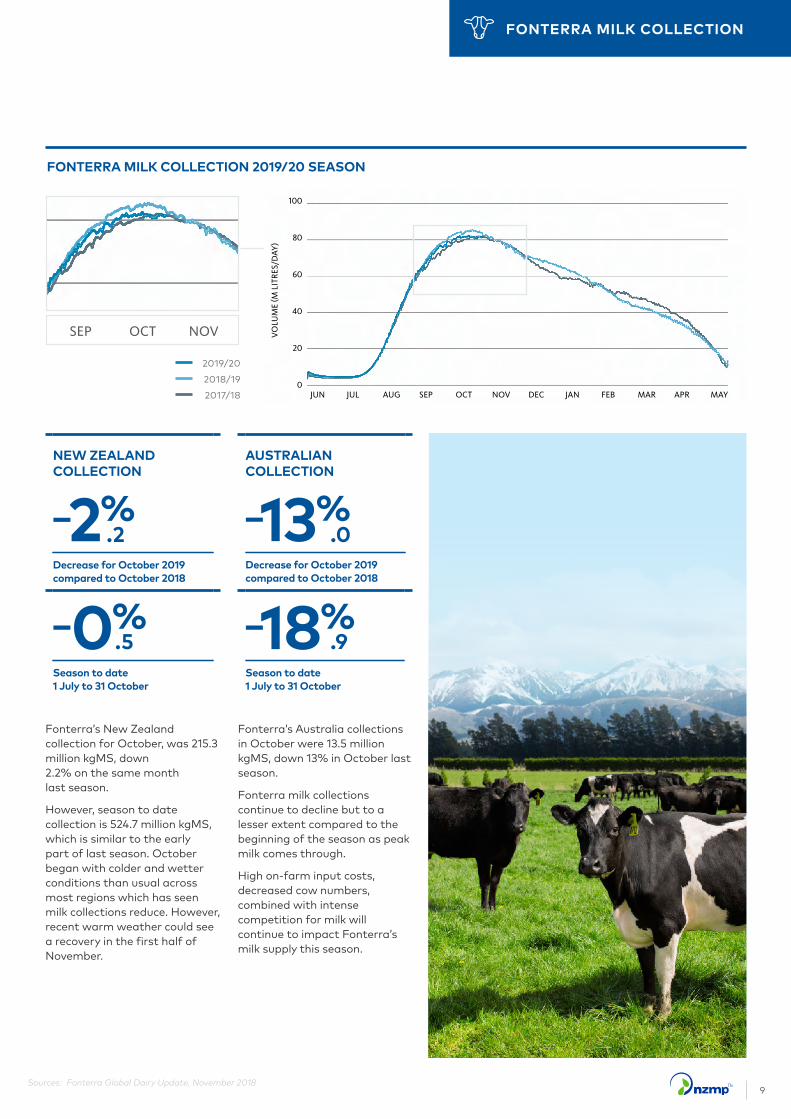
FONTERRA MILK COLLECTION 2019/20 SEASON
Sources: Fonterra Global Dairy Update, November 2018
FONTERRA MILK COLLECTION
AUSTRALIAN COLLECTION
-13%Decrease for October 2019 compared to October 2018
-18%Season to date 1 July to 31 October
NEW ZEALAND COLLECTION
-2%Decrease for October 2019 compared to October 2018
-0%Season to date 1 July to 31 October
2019/20
2018/19
2017/18
Fonterra’s Australia collections in October were 13.5 million kgMS, down 13% in October last season.
Fonterra milk collections continue to decline but to a lesser extent compared to the beginning of the season as peak milk comes through.
High on-farm input costs, decreased cow numbers, combined with intense competition for milk will continue to impact Fonterra’s milk supply this season.
Fonterra’s New Zealand collection for October, was 215.3 million kgMS, down 2.2% on the same month last season.
However, season to date collection is 524.7 million kgMS, which is similar to the early part of last season. October began with colder and wetter conditions than usual across most regions which has seen milk collections reduce. However, recent warm weather could see a recovery in the first half of November.
.9
.2 .0
JUN JUL AUG SEP OCT NOV DEC JAN FEB MAR APR MAY
.5
JUN JUL AUG SEP OCT NOV DEC JAN FEB MAR APR MAY
9
Sources: Data from Global Trade Information Services, US Dairy Export Council, EU Milk Market Observatory, Dairy Australia, High Ground Dairy and Eucolait
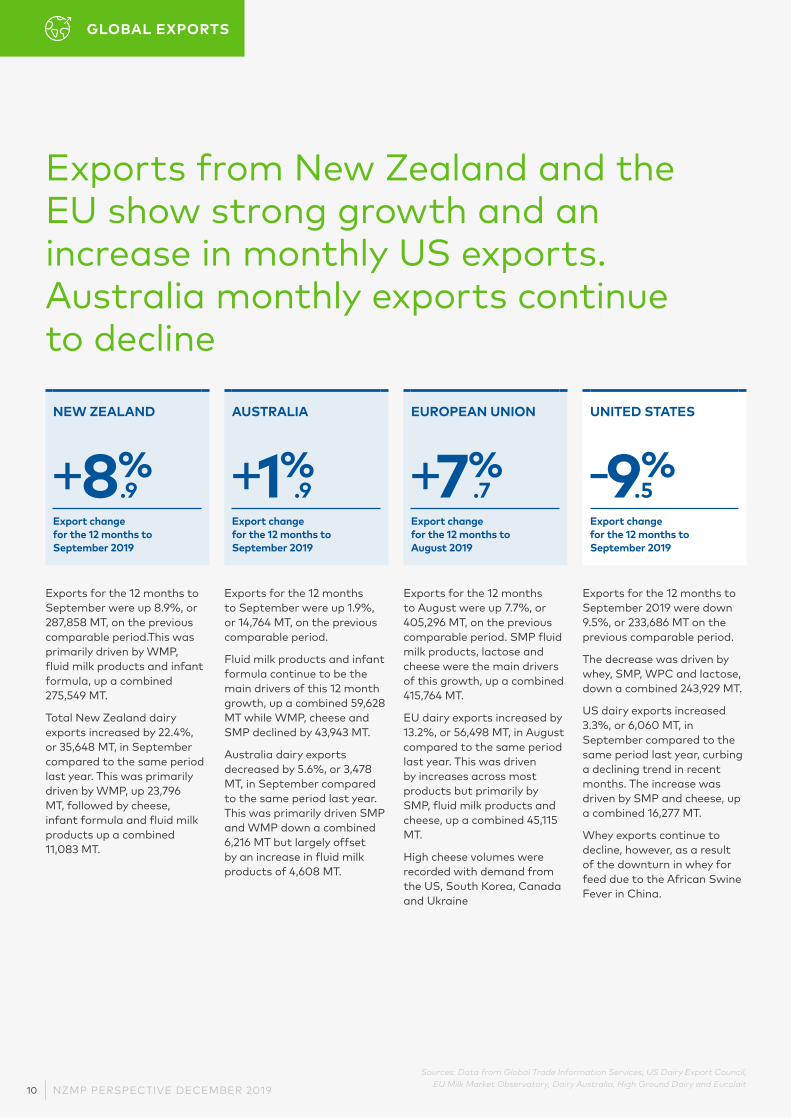
Exports from New Zealand and the EU show strong growth and an increase in monthly US exports. Australia monthly exports continue to decline
GLOBAL EXPORTS
AUSTRALIA
+1%Export change for the 12 months to September 2019
Exports for the 12 months to September were up 1.9%, or 14,764 MT, on the previous comparable period.
Fluid milk products and infant formula continue to be the main drivers of this 12 month growth, up a combined 59,628 MT while WMP, cheese and SMP declined by 43,943 MT.
Australia dairy exports decreased by 5.6%, or 3,478 MT, in September compared to the same period last year. This was primarily driven SMP and WMP down a combined 6,216 MT but largely offset by an increase in fluid milk products of 4,608 MT.
EUROPEAN UNION
+7%Export change for the 12 months to August 2019
Exports for the 12 months to August were up 7.7%, or 405,296 MT, on the previous comparable period. SMP fluid milk products, lactose and cheese were the main drivers of this growth, up a combined 415,764 MT.
EU dairy exports increased by 13.2%, or 56,498 MT, in August compared to the same period last year. This was driven by increases across most products but primarily by SMP, fluid milk products and cheese, up a combined 45,115 MT.
High cheese volumes were recorded with demand from the US, South Korea, Canada and Ukraine
UNITED STATES
-9%Export change for the 12 months to September 2019
Exports for the 12 months to September 2019 were down 9.5%, or 233,686 MT on the previous comparable period.
The decrease was driven by whey, SMP, WPC and lactose, down a combined 243,929 MT.
US dairy exports increased 3.3%, or 6,060 MT, in September compared to the same period last year, curbing a declining trend in recent months. The increase was driven by SMP and cheese, up a combined 16,277 MT.
Whey exports continue to decline, however, as a result of the downturn in whey for feed due to the African Swine Fever in China.
NEW ZEALAND
+8%Export change for the 12 months to September 2019
Exports for the 12 months to September were up 8.9%, or 287,858 MT, on the previous comparable period.This was primarily driven by WMP, fluid milk products and infant formula, up a combined 275,549 MT.
Total New Zealand dairy exports increased by 22.4%, or 35,648 MT, in September compared to the same period last year. This was primarily driven by WMP, up 23,796 MT, followed by cheese, infant formula and fluid milk products up a combined 11,083 MT.
.9.9 .7 .5
NZMP PERSPECTIVE DECEMBER 201910
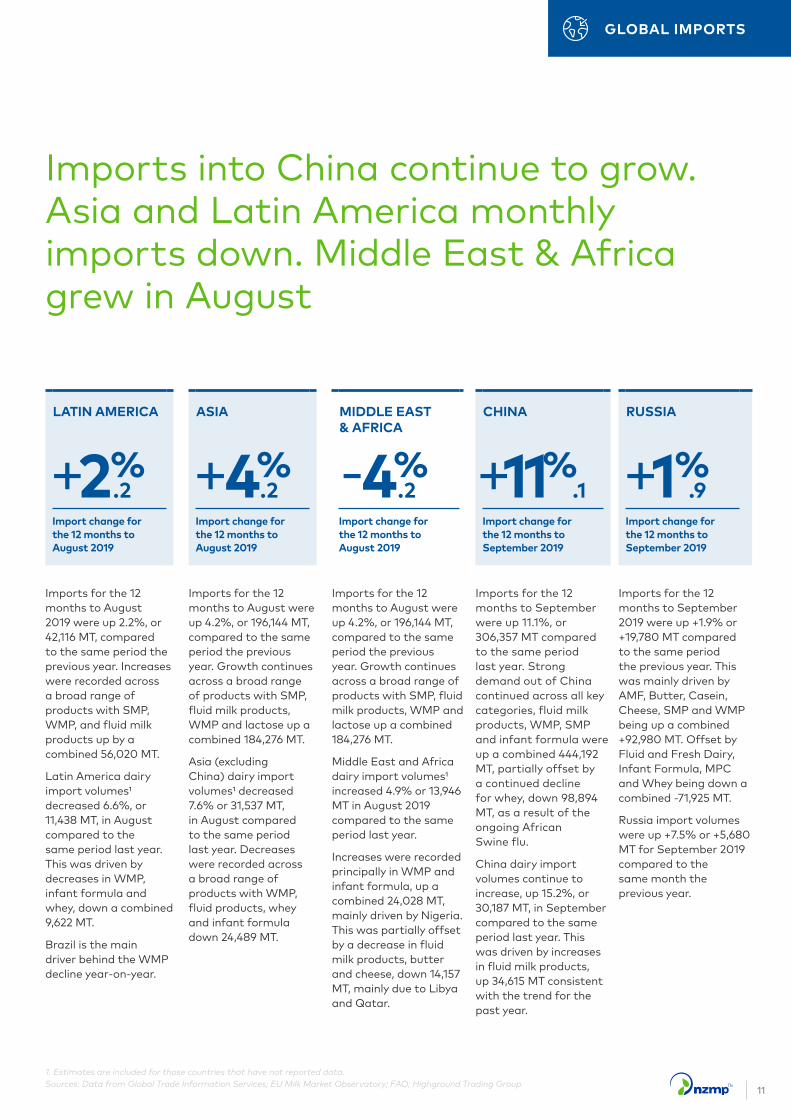
Imports into China continue to grow. Asia and Latin America monthly imports down. Middle East & Africa grew in August
GLOBAL IMPORTS
ASIA
+4%Import change for the 12 months to August 2019
Imports for the 12 months to August were up 4.2%, or 196,144 MT, compared to the same period the previous year. Growth continues across a broad range of products with SMP, fluid milk products, WMP and lactose up a combined 184,276 MT.
Asia (excluding China) dairy import volumes¹ decreased 7.6% or 31,537 MT, in August compared to the same period last year. Decreases were recorded across a broad range of products with WMP, fluid products, whey and infant formula down 24,489 MT.
CHINA
+11%Import change for the 12 months to September 2019
Imports for the 12 months to September were up 11.1%, or 306,357 MT compared to the same period last year. Strong demand out of China continued across all key categories, fluid milk products, WMP, SMP and infant formula were up a combined 444,192 MT, partially offset by a continued decline for whey, down 98,894 MT, as a result of the ongoing African Swine flu.
China dairy import volumes continue to increase, up 15.2%, or 30,187 MT, in September compared to the same period last year. This was driven by increases in fluid milk products, up 34,615 MT consistent with the trend for the past year.
RUSSIA
+1%Import change for the 12 months to September 2019
Imports for the 12 months to September 2019 were up +1.9% or +19,780 MT compared to the same period the previous year. This was mainly driven by AMF, Butter, Casein, Cheese, SMP and WMP being up a combined +92,980 MT. Offset by Fluid and Fresh Dairy, Infant Formula, MPC and Whey being down a combined -71,925 MT.
Russia import volumes were up +7.5% or +5,680 MT for September 2019 compared to the same month the previous year.
MIDDLE EAST & AFRICA
-4%Import change for the 12 months to August 2019
Imports for the 12 months to August were up 4.2%, or 196,144 MT, compared to the same period the previous year. Growth continues across a broad range of products with SMP, fluid milk products, WMP and lactose up a combined 184,276 MT.
Middle East and Africa dairy import volumes¹ increased 4.9% or 13,946 MT in August 2019 compared to the same period last year.
Increases were recorded principally in WMP and infant formula, up a combined 24,028 MT, mainly driven by Nigeria. This was partially offset by a decrease in fluid milk products, butter and cheese, down 14,157 MT, mainly due to Libya and Qatar.
1. Estimates are included for those countries that have not reported data.Sources: Data from Global Trade Information Services; EU Milk Market Observatory; FAO; Highground Trading Group
LATIN AMERICA
+2%Import change for the 12 months to August 2019
Imports for the 12 months to August 2019 were up 2.2%, or 42,116 MT, compared to the same period the previous year. Increases were recorded across a broad range of products with SMP, WMP, and fluid milk products up by a combined 56,020 MT.
Latin America dairy import volumes¹ decreased 6.6%, or 11,438 MT, in August compared to the same period last year. This was driven by decreases in WMP, infant formula and whey, down a combined 9,622 MT.
Brazil is the main driver behind the WMP decline year-on-year.
.9.2 .2 .1.2
11
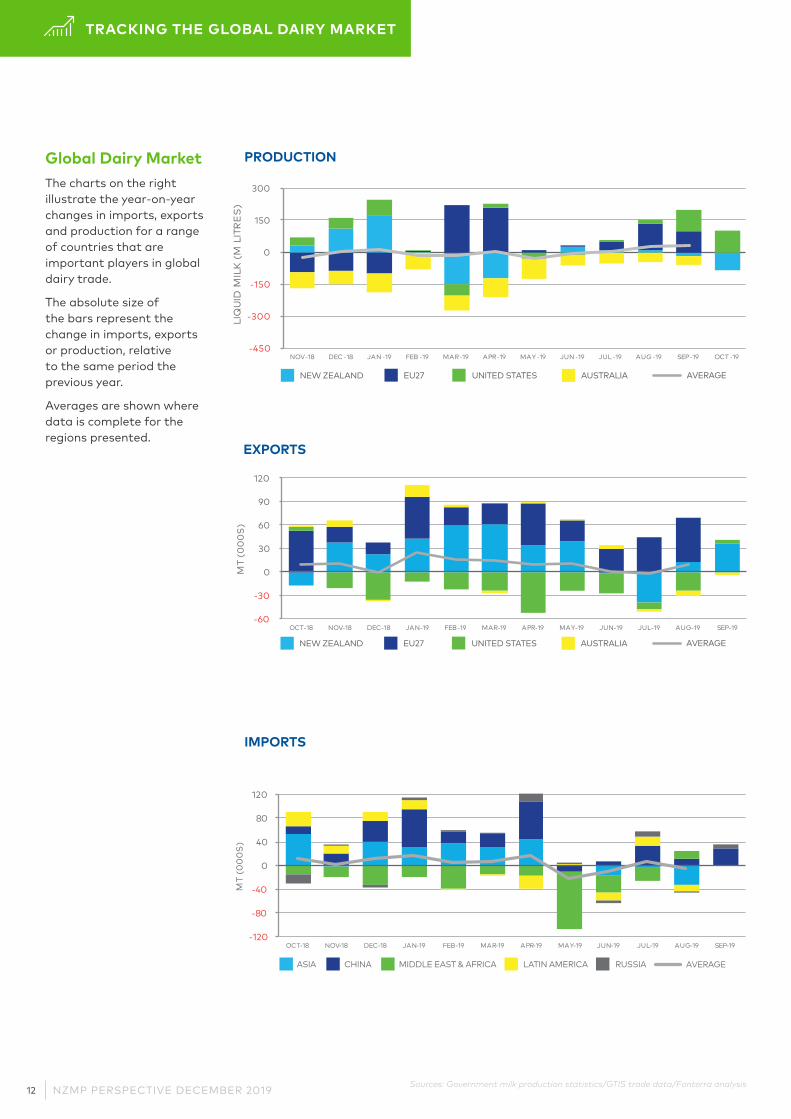
Global Dairy MarketThe charts on the right illustrate the year-on-year changes in imports, exports and production for a range of countries that are important players in global dairy trade.
The absolute size of the bars represent the change in imports, exports or production, relative to the same period the previous year.
Averages are shown where data is complete for the regions presented.
TRACKING THE GLOBAL DAIRY MARKET
Sources: Government milk production statistics/GTIS trade data/Fonterra analysis
PRODUCTION
EXPORTS
IMPORTS
-450
-300
-150
0
150
300
NOV-18 DEC -18 JAN -19 FEB -19 MAR-19 APR-19 MAY-19 JUN -19 JUL-19 AUG-19 SEP-19 OCT-19
LIQ
UID
MIL
K (
M L
ITR
ES
)
NEW ZEALAND EU27 UNITED STATES AUSTRALIA AVERAGE
NEW ZEALAND EU27 UNITED STATES AUSTRALIA AVERAGE
-60
-30
0
30
60
90
120
OCT-18 NOV-18 DEC-18 JAN-19 FEB-19 MAR-19 APR-19 MAY-19 JUN-19 JUL-19 AUG-19 SEP-19
MT
(00
0S
)
ASIA CHINA MIDDLE EAST & AFRICA LATIN AMERICA RUSSIA AVERAGE
-120
-80
-40
0
40
80
120
OCT-18 NOV-18 DEC-18 JAN-19 FEB-19 MAR-19 APR-19 MAY-19 JUN-19 JUL-19 AUG-19 SEP-19
MT
(00
0S
)
NZMP PERSPECTIVE DECEMBER 201912
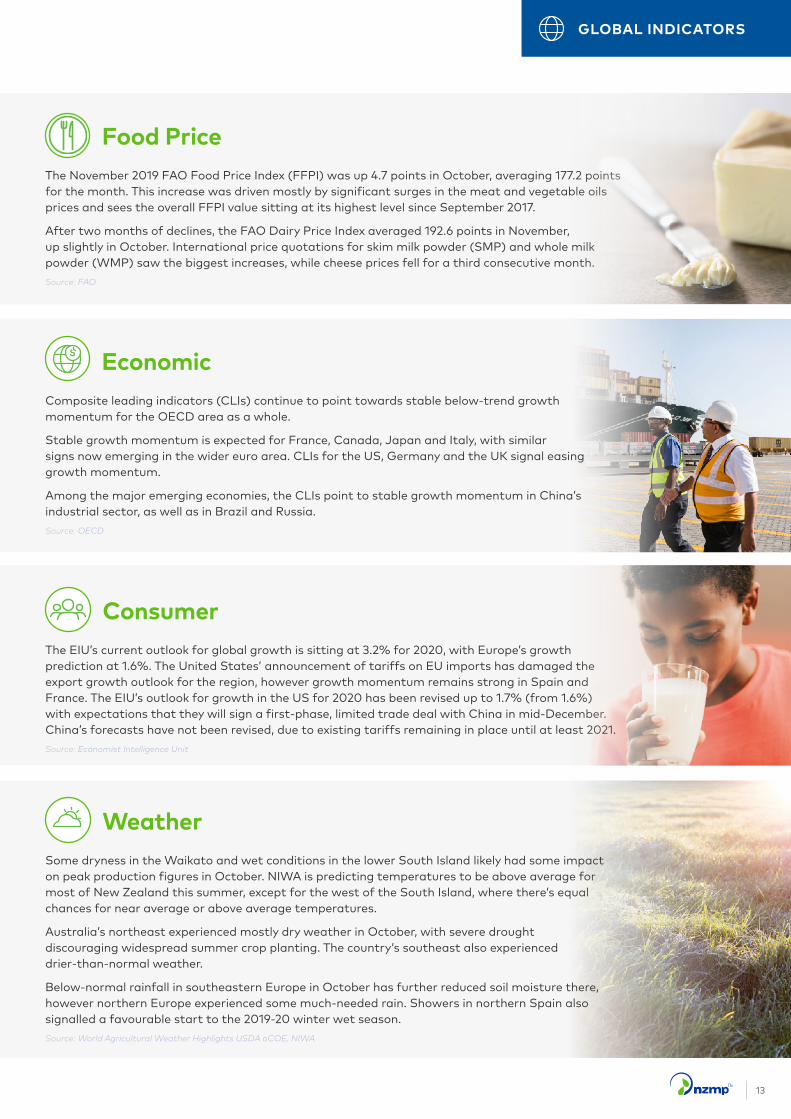
WeatherSome dryness in the Waikato and wet conditions in the lower South Island likely had some impact on peak production figures in October. NIWA is predicting temperatures to be above average for most of New Zealand this summer, except for the west of the South Island, where there’s equal chances for near average or above average temperatures.
Australia’s northeast experienced mostly dry weather in October, with severe drought discouraging widespread summer crop planting. The country’s southeast also experienced drier-than-normal weather.
Below-normal rainfall in southeastern Europe in October has further reduced soil moisture there, however northern Europe experienced some much-needed rain. Showers in northern Spain also signalled a favourable start to the 2019-20 winter wet season.
Source: World Agricultural Weather Highlights USDA oCOE, NIWA
Food PriceThe November 2019 FAO Food Price Index (FFPI) was up 4.7 points in October, averaging 177.2 points for the month. This increase was driven mostly by significant surges in the meat and vegetable oils prices and sees the overall FFPI value sitting at its highest level since September 2017.
After two months of declines, the FAO Dairy Price Index averaged 192.6 points in November, up slightly in October. International price quotations for skim milk powder (SMP) and whole milk powder (WMP) saw the biggest increases, while cheese prices fell for a third consecutive month.
Source: FAO
EconomicComposite leading indicators (CLIs) continue to point towards stable below-trend growth momentum for the OECD area as a whole.
Stable growth momentum is expected for France, Canada, Japan and Italy, with similar signs now emerging in the wider euro area. CLIs for the US, Germany and the UK signal easing growth momentum.
Among the major emerging economies, the CLIs point to stable growth momentum in China’s industrial sector, as well as in Brazil and Russia.
Source: OECD
ConsumerThe EIU’s current outlook for global growth is sitting at 3.2% for 2020, with Europe’s growth prediction at 1.6%. The United States’ announcement of tariffs on EU imports has damaged the export growth outlook for the region, however growth momentum remains strong in Spain and France. The EIU’s outlook for growth in the US for 2020 has been revised up to 1.7% (from 1.6%) with expectations that they will sign a first-phase, limited trade deal with China in mid-December. China’s forecasts have not been revised, due to existing tariffs remaining in place until at least 2021.
Source: Economist Intelligence Unit
GLOBAL INDICATORS
13
Actuals
GDT Fonterra Dutch Dairy Board USDA Oceania
USDA NASS CME Spot EU Commission
Forecasts
NZX Futures CME Futures
Rabobank Oceania
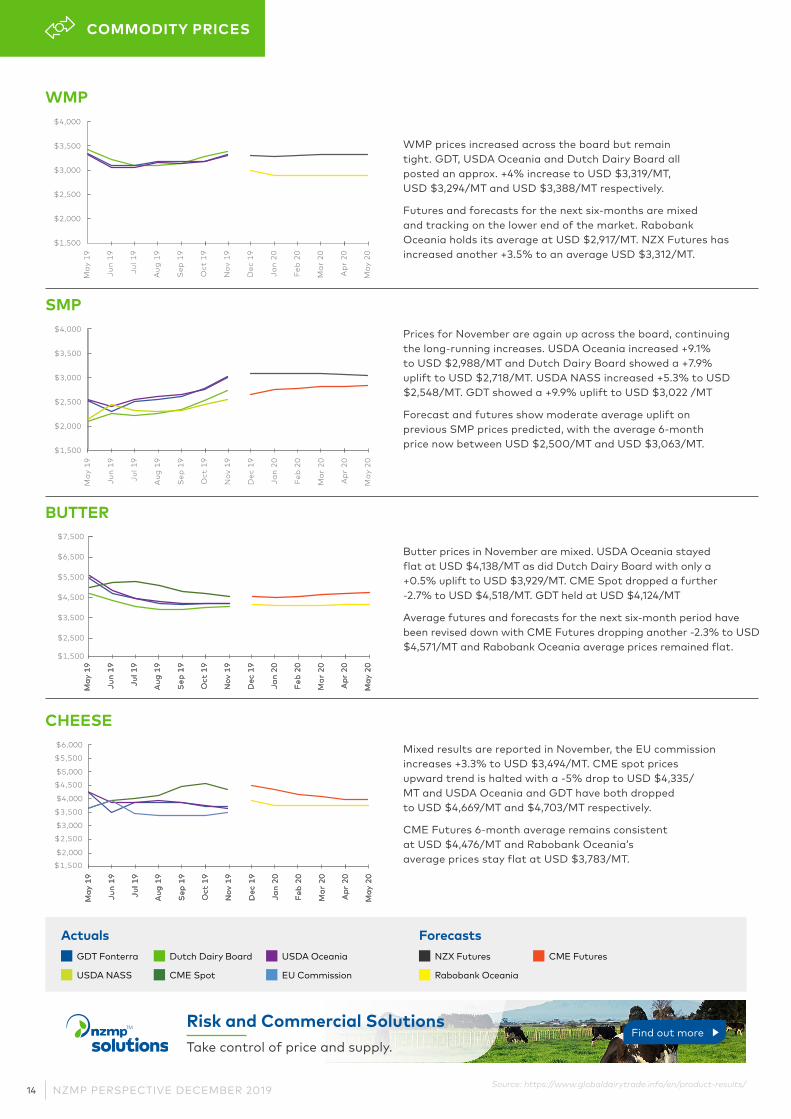
WMP prices increased across the board but remain tight. GDT, USDA Oceania and Dutch Dairy Board all posted an approx. +4% increase to USD $3,319/MT, USD $3,294/MT and USD $3,388/MT respectively.
Futures and forecasts for the next six-months are mixed and tracking on the lower end of the market. Rabobank Oceania holds its average at USD $2,917/MT. NZX Futures has increased another +3.5% to an average USD $3,312/MT.
Butter prices in November are mixed. USDA Oceania stayed flat at USD $4,138/MT as did Dutch Dairy Board with only a +0.5% uplift to USD $3,929/MT. CME Spot dropped a further -2.7% to USD $4,518/MT. GDT held at USD $4,124/MT
Average futures and forecasts for the next six-month period have been revised down with CME Futures dropping another -2.3% to USD $4,571/MT and Rabobank Oceania average prices remained flat.
Mixed results are reported in November, the EU commission increases +3.3% to USD $3,494/MT. CME spot prices upward trend is halted with a -5% drop to USD $4,335/MT and USDA Oceania and GDT have both dropped to USD $4,669/MT and $4,703/MT respectively.
CME Futures 6-month average remains consistent at USD $4,476/MT and Rabobank Oceania’s average prices stay flat at USD $3,783/MT.
Prices for November are again up across the board, continuing the long-running increases. USDA Oceania increased +9.1% to USD $2,988/MT and Dutch Dairy Board showed a +7.9% uplift to USD $2,718/MT. USDA NASS increased +5.3% to USD $2,548/MT. GDT showed a +9.9% uplift to USD $3,022 /MT
Forecast and futures show moderate average uplift on previous SMP prices predicted, with the average 6-month price now between USD $2,500/MT and USD $3,063/MT.
Source: https://www.globaldairytrade.info/en/product-results/
COMMODITY PRICES
WMP
BUTTER
CHEESE
$1,500
$2,000
$2,500
$3,000
$3,500
$4,000
May
19
Jun
19
Jul 1
9
Aug
19
Sep
19
Oct
19
Nov
19
Dec
19
Jan
20
Feb
20
Mar
20
Apr
20
May
20
May
19
Jun
19
Jul 1
9
Aug
19
Sep
19
Oct
19
Nov
19
Dec
19
Jan
20
Feb
20
Mar
20
Apr
20
May
20
$1,500
$2,000
$2,500
$3,000
$3,500
$4,000
$1,500
$2,000
$2,500
$3,000
$3,500
$4,000
$4,500
$5,000
$5,500
$6,000
May
19
Jun
19
Jul 1
9
Aug
19
Sep
19
Oct
19
Nov
19
Dec
19
Jan
20
Feb
20
Mar
20
Apr
20
May
20
May
19
Jun
19
Jul 1
9
Aug
19
Sep
19
Oct
19
Nov
19
Dec
19
Jan
20
Feb
20
Mar
20
Apr
20
May
20
May
19
Jun
19
Jul 1
9
Aug
19
Sep
19
Oct
19
Nov
19
Dec
19
Jan
20
Feb
20
Mar
20
Apr
20
May
20
May
19
Jun
19
Jul 1
9
Aug
19
Sep
19
Oct
19
Nov
19
Dec
19
Jan
20
Feb
20
Mar
20
Apr
20
May
20
May
19
Jun
19
Jul 1
9
Aug
19
Sep
19
Oct
19
Nov
19
Dec
19
Jan
20
Feb
20
Mar
20
Apr
20
May
20
May
19
Jun
19
Jul 1
9
Aug
19
Sep
19
Oct
19
Nov
19
Dec
19
Jan
20
Feb
20
Mar
20
Apr
20
May
20
May
19
Jun
19
Jul 1
9
Aug
19
Sep
19
Oct
19
Nov
19
Dec
19
Jan
20
Feb
20
Mar
20
Apr
20
May
20
May
19
Jun
19
Jul 1
9
Aug
19
Sep
19
Oct
19
Nov
19
Dec
19
Jan
20
Feb
20
Mar
20
Apr
20
May
20
$1,500
$2,500
$3,500
$4,500
$5,500
$6,500
$7,500
Risk and Commercial SolutionsTake control of price and supply.
Find out more
SMP
NZMP PERSPECTIVE DECEMBER 201914
GDT SALES BY DESTINATION
TRADING EVENT 249
GDT Results
Financial Year to DateLatest Auction
North Asia (including China)
South East Asia
Middle East and Africa
Latin America
Other
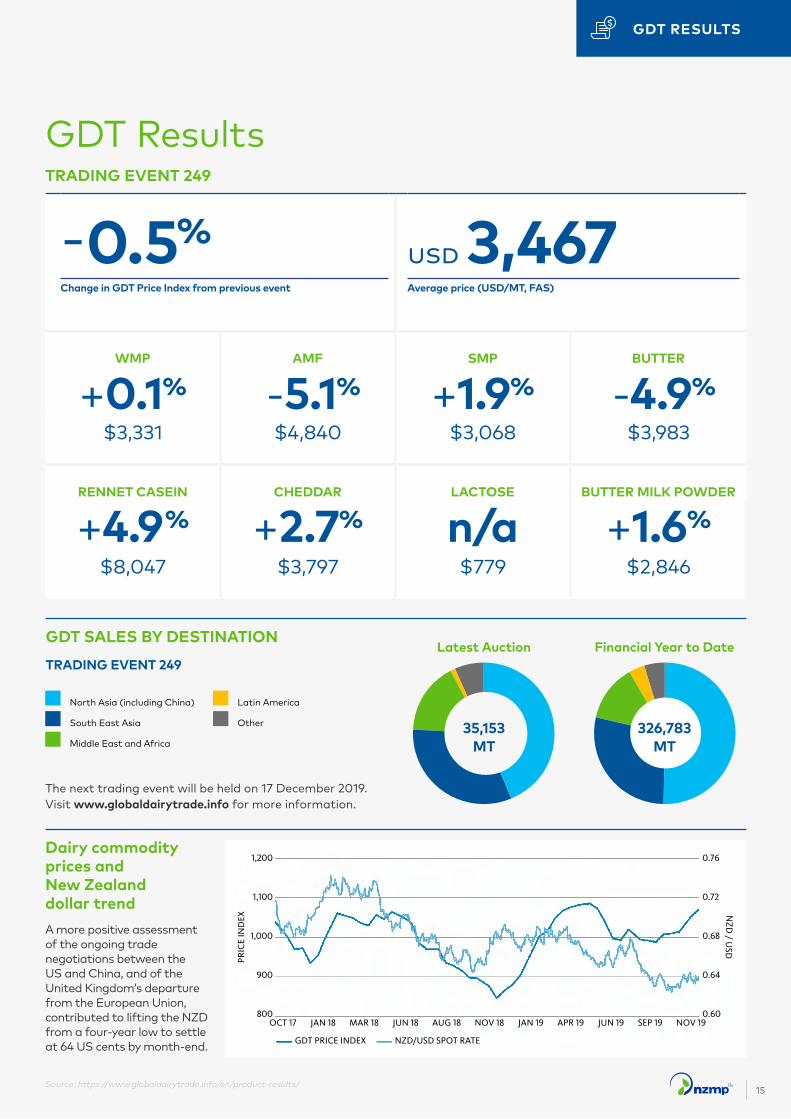
A more positive assessment of the ongoing trade negotiations between the US and China, and of the United Kingdom’s departure from the European Union, contributed to lifting the NZD from a four-year low to settle at 64 US cents by month-end.
Source: https://www.globaldairytrade.info/en/product-results/
GDT RESULTS
TRADING EVENT 249
-0.5%usd 3,467
Change in GDT Price Index from previous event Average price (USD/MT, FAS)
WMP AMF SMP BUTTER
+0.1% -5.1% +1.9% -4.9%
$3,331 $4,840 $3,068 $3,983
RENNET CASEIN CHEDDAR LACTOSE BUTTER MILK POWDER
+4.9% +2.7% n/a +1.6%
$8,047 $3,797 $779 $2,846
Dairy commodity prices and New Zealand dollar trend
The next trading event will be held on 17 December 2019. Visit www.globaldairytrade.info for more information.
35,153 MT
326,783MT
GDT PRICE INDEX
PRIC
E IN
DEX
15
USDA, Dairy OutlookPublished November 2019
INDUSTRY COMMENTARY
Recent developments
Total milk production for 2019 is now forecast at 217.9 billion pounds, down 0.3 billion on the previous forecast. Meanwhile, the all-milk price for 2019 is up 10 cents to $18.30 per cwt, with the all-milk price forecast for 2020 unchanged at $18.85 per cwt.
NZMP PERSPECTIVE DECEMBER 201916
Price directions were mixed from the week ending October 5 to the week ending November 2. The nonfat dry milk (NDM) price was up 6.6 cents to $1.1335 per pound, while prices for butter ($2.1197) and dry whey ($0.3085) both fell.
The most significant change was seen in 500-pound barrels of cheddar cheese (adjusted to 38% moisture), with prices up 29.7 cents to $2.0791 per pound. This contrasted with a drop of 1.5 cents to $2.0789 per pound for 40-pound blocks of cheddar cheese. The week ending November 2 represented the first week since January 6, 2018, where the barrel price was higher than the block price.
USDA, National Agricultural Statistics Service (NASS) estimated September US milk production at 17.616 billion pounds, up 1.3 percent on the same time last year. Milk cow numbers for September were estimated at 9.315 million head in September, down 2,000 on August, however year-over-year growth in yield per cow has been growing in recent months.
Dairy exports on a milk-fat milk-equivalent basis totalled 742 million pounds in September, down 36 million on the previous month and down 97 million in September 2018. September exports on a skim-solids milk-equivalent basis were 3.555 billion pounds, up 170 million in August. Of note, NDM/SMP exports sat at 144 million pounds in September, up 32 million in August and 28 million more than September last year.
Source: USDA
Imports of dairy products on a milk-fat basis were 698 million pounds in September, an increase of 63 million on the previous month. On a skim-solids basis, September imports were 423 million pounds, down 25 million in August, but up 67 million in September 2018. Cheese imports for September were 34 million pounds, 8 million pounds more than August and 8 million pounds more than the same time last year. Imports of milk protein products (milk protein concentrate and casein products) totalled 12 million pounds in September, down 4 million in August.
September ending stocks for many dairy products were much higher than September 2018. On a milk-fat basis, September ending stocks were 17.258 billion pounds, up 159 million pounds on the same time last year. This compares with a year-over-year increase of 21 million pounds in August. On a skim-solids basis, September ending stocks were 10.775 billion pounds, up 250 million on September 2018. This compares with a year-over-year decline of 75 million pounds in August. September ending stocks for butter, dry whey, whey protein concentrate, and lactose all exceeded September 2018 by 7.0 percent, 14.0 percent, 5.9 percent, and 38.8 percent, respectively.
17
Dairy forecasts for 2019The forecast for the milking herd in 2019 has been lowered 5,000 head to 9.335 million. Due to a lower than expected number for milk per cow in June, the milk per cow estimate for the year has been lowered 15 pounds to 23,350. With these changes, total milk production for 2019 is now forecast at 217.9 billion pounds, down 0.3 billion on the previous forecast.
Imports on a milk-fat basis are now forecast at 7.2 billion pounds for the year, up 0.3 billion pounds on last month’s predictions, with recent strength in imports of butter from the EU (particularly Ireland) expected to continue through year end. The export forecast on a milk-fat basis has been lowered 0.1 billion pounds to 9.4 billion. Ending stocks for 2019 are now forecast at 13.0 billion pounds, down 0.1 billion pounds. Domestic use on a milk-fat basis for the year is forecast slightly higher than the previous month at 215.2 billion pounds.
On a skim-solids basis, the import forecast for 2019 has risen 0.1 billion pounds to 5.5 billion, due to higher expected imports of milk protein products. The outlook for skim-solids exports is dimmer, following a weaker Chinese yuan, continued trade tensions with China, and strong competition for NDM exports.
Exports are now forecast at 40.6 billion pounds, down 0.7 billion pounds. Ending stocks for 2019 are unchanged, with a forecast of 10.0 billion pounds. Domestic use is now forecast at 182.3 billion pounds for 2019, up 0.6 billion pounds.
Slight changes in dairy product price forecasts have been made for the rest of 2019. Recent strength in cheese prices and growth in domestic use have seen an increase of 2.5 cents in the Cheddar cheese price to $1.685 per pound. The dry whey price has also been increased slightly to $0.380 per pound for the year. The US butter price forecast has been raised slightly to $2.320 per pound, off the back of continued domestic demand. In contrast, weakening shipments of NDM in recent months have seen the NDM price forecast lowered 1.5 cents to $1.005 per pound for the year.
With slightly higher prices for cheese and whey, the Class III price for 2019 has increased 25 cents to $16.30 per cwt. The lower NDM price forecast has seen a decrease of 15 cents in the Class IV price forecast to $16.30 per cwt. The all-milk price for 2019 is now forecast at $18.30 per cwt, up 10 cents on the previous forecast.
INDUSTRY COMMENTARY
Source: USDANZMP PERSPECTIVE DECEMBER 201918
For the first time since May 2015, the nonfat dry milk market pushed butter out of the way and hit centre stage with its contribution to the Class IV price.
Butter’s extended run in that leading role had been unusual, with such circumstances last seen in 2004. Blimling’s forecasts have NDM narrowly leading Class IV for the next year.
This shift could matter from a producer perspective. After five years of the market emphasis being on fat, skim is now leading the way. Between that and a fall in butter prices, producers may start to shift their focus. Blimling says the climb in NDM prices will also see buyers needing to direct more attention to the skim complex.
Meanwhile, cheese prices are expected to remain supported into early 2020, however those prices will likely be knocked back by the second quarter, with more milk and less export demand.
More fat off the farm and imported AMF supply will keep cream heavy and domestic butter supplies growing. Butter prices will likely find support from budget buyers as the year progresses.
NDM/SMP prices are expected to rise into early 2020, however increased milk production across the US and EU will mean price moderation by the middle of the year.
Finally, the whey market is finding more stability as low prices and high NDM values help build demand interest. However, supply remains heavy, likely limiting upside.
Blimling, Forecast UpdatePublished December, 2019
Source: Blimling19
AMF Anhydrous Milk Fat
BMP Butter Milk Powder
CME Chicago Mercantile Exchange
DDB Dutch Dairy Board
EIU Economist Intelligence Unit
FAO United Nations Food and Agriculture Organisation
Farmgate Milk Price The price for milk supplied in New Zealand to Fonterra by farmer shareholders
Fluid and Fresh Dairy The Fonterra grouping of fluid milk products (skim milk, whole milk and cream pasteurised or UHT processed), concentrated milk products (evaporated milk and sweetened condensed milk) and yoghurt
FTA Free Trade Agreement
GDI Global Dairy Intelligence group, Fonterra Cooperative Group Limited. GDI provides insights to Fonterra management based on a model of the global dairy market developed by GDI and populated with publicly available data. The model outputs referenced in this report do not reflect Fonterra’s non-public production or sales data
GDP Gross Domestic Product
GDT Global Dairy Trade auction platform
GDT Price Index is an index that provides a measure of the weighted average percentage change in the movement in price of all products sold on GDT. This provides a simple measure of changes in dairy price between trading events
IMF International Monetary Fund
Informa Informa Economics Inc., Dairy Group, Global Dairy Market Report
LME Liquid Milk Equivalent
MAT Moving Annual Total (this is data averaged across the 12 month period)
MEA Middle East and Africa
NDM Non-fat Dry Milk
NZX NZ Stock Exchange
OECD Organisation for Economic Co-operation and Development
Q[1] [First] Quarter
Reference Products The dairy products used in the calculation of the Farmgate Milk Price, which are currently WMP, SMP, BMP, butter and AMF
SEA South East Asia
Season New Zealand: A period of 12 months to 31 May in each year. Australia: A period of 12 months to 30 June in each year
SMP Skim Milk Powder
TE GDT Trading Event
USDA NASS US Department of Agriculture National Agricultural Statistics Service
USDA Oceania US Department of Agriculture Agricultural marketing service price series for specific products in the Oceania region
WMP Whole Milk Powder
YOY Year-on-year
YTD Year to date
Fonterra draws the information in this update from a variety of principally external sources listed below. Also included are defined acronyms for better understanding.
GLOSSARY
NZMP PERSPECTIVE DECEMBER 201920
Tracking the global dairy market Production, Export and Import chartsThe production, export and import charts illustrate year-on-year changes in production, exports and imports for a range of countries that are important players in global dairy trade.
The absolute size of the bars represents the change in production, exports or imports compared to the same month the previous year. The portion of the bar below zero represents a year-on-year decrease and the portion above the line shows the year increase for that country. Where countries are not shown this is likely due to the data not yet being available.
Weather Source (Page reference – 13)Comments on weather are obtained from various government weather sites as well as independent reports including Martell Crop Projections. Global milk production data is sourced from government and industry websites including US Department of Agriculture (USDA), EuroStat, Dairy Australia, Dairy Companies Association of New Zealand (DCANZ) and others.
REFERENCES
21

Important note: The information and commentary contained in this ‘Perspective from NZMP’ is based on publicly available official government statistics; industry association reports; other published industry reports together with data and insights developed by Fonterra’s Global Dairy Intelligence group (‘GDI’). These sources are identified as appropriate in this ‘Perspective from NZMP’. GDI insights and data are derived from a global dairy market model populated by publicly available data. The model inputs and outputs do not reflect Fonterra’s non-public production, pricing or sales data. Fonterra Co-operative Group Limited and its group members involved in the manufacture or sale of NZMP branded products (‘Fonterra’) has provided this ‘Perspective from NZMP’ for informational purposes only. It does not constitute recommendations or advice for the purposes of making financial decisions regarding trading in dairy products or commodities, or dealing in financial instruments relating to dairy commodities. Although every effort is made to ensure the accuracy of reproducing and interpreting such information, no warranty or representation of such is made and Fonterra shall have no liability in respect of any reliance placed on such information in the formulation of any business decision.