Embed Size (px)
Citation preview
Pertanika J. Sci. & Technol. 25 (3): 759 - 766 (2017)
SCIENCE & TECHNOLOGYJournal homepage: http://www.pertanika.upm.edu.my/
ISSN: 0128-7680 © 2017 Universiti Putra Malaysia Press.
Article history:Received: 27 May 2016Accepted: 14 November 2016
E-mail addresses: [email protected] (Samat, N. A.), [email protected] (Pei Zhen, W.) *Corresponding Author
Relative Risk Estimation for Dengue Disease Mapping in Malaysia based on Besag, York and Mollié Model
Samat, N. A.* and Pei Zhen, W.Department of Mathematics, Faculty of Science and Mathematics, Universiti Pendidikan Sultan Idris, 35900 Tanjung Malim, Perak, Malaysia
ABSTRACT
In the study of disease mapping, relative risk estimation is the focus of analysis. Many methods have been introduced to estimate relative risk. In this paper, one of the common spatial models known as Besag, York and Mollié (BYM) model is discussed, and its application to dengue data for epidemiology weeks 1 to 52 of the year 2013 for 16 states in Malaysia is studied. Findings show that Selangor has the highest relative risk of dengue in comparison with other states. Data on the estimated relative risks are presented in the form of risk maps which can be used as a tool for the prevention and control of dengue.
Keywords: Relative risk estimation, disease mapping, dengue disease, BYM model
INTRODUCTION
Disease mapping is the visual representation of the spatial and geographic distribution of specified diseases and the corresponding risk. In recent years, disease mapping has become an important tool and technique of epidemiologists, biostatisticians, medical demographics and academics working on disease epidemiology and health services. A disease map displays the geographic areas with high and low incidence, prevalence or mortality rates of a specific diseases. In this paper, dengue is the disease of interest.
Dengue is a major global health problem in which the viruses are transmitted by the infective bite of female mosquito of species genus Aedes. This paper investigates the dengue disease mapping in Malaysia. In this research, Besag, York and Mollié (BYM) model is used as the
alternative method to estimate the relative risk of dengue occurrence in human populations in Malaysia.
First, a brief introduction to the BYM method will be discussed. Data on dengue cases in Malaysia are used to estimate relative risk using WinBUGS software to carry out Markov chain Monte Carlo (MCMC)
Samat, N. A. and Pei Zhen, W.
760 Pertanika J. Sci. & Technol. 25 (3): 759 - 766 (2017)
computations of Bayesian models. Expected disease risk is presented and analysed using graph and risk map. The disease risk map will display the high and low disease risk incidences of the dengue diseases in 16 states of Malaysia.
BESAG, YORK AND MOLLIÉ (BYM) MODEL
In this paper, the Besag, York and Mollié model is applied to the observed dengue disease data to estimate the relative risks for the 16 states in Malaysia. This model was first introduced by Clayton & Kaldor (1987) as an empirical Bayesian and later developed to a fully Bayesian setting by Besag, York and Mollie (Besag, York, & Mollié, 1991).
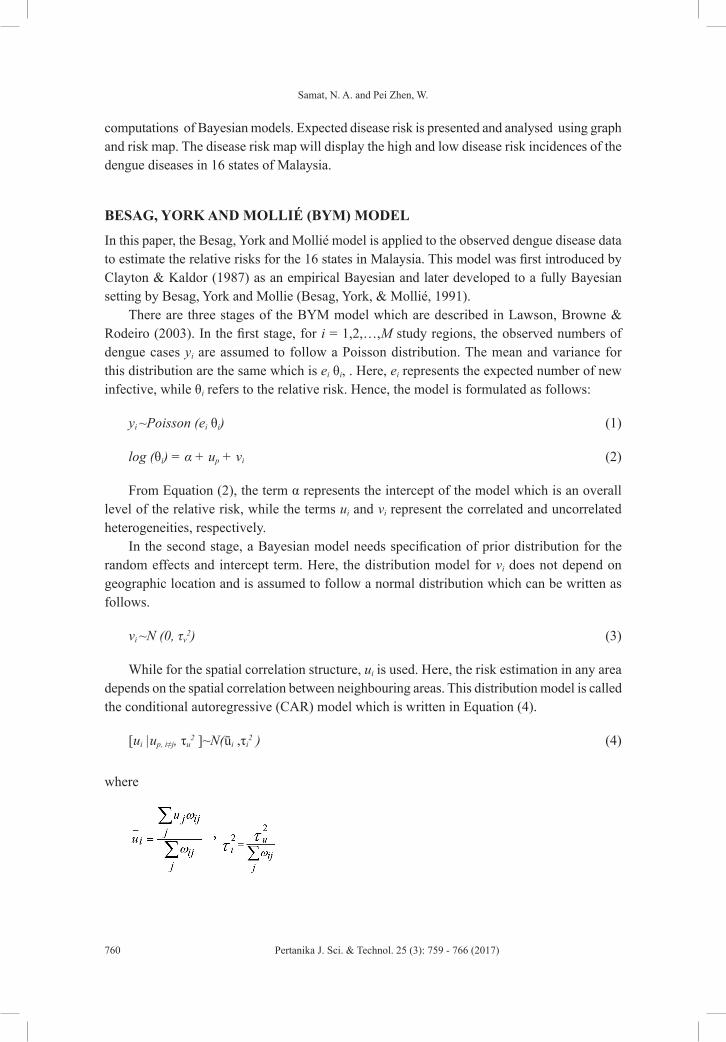
There are three stages of the BYM model which are described in Lawson, Browne & Rodeiro (2003). In the first stage, for i = 1,2,…,M study regions, the observed numbers of dengue cases yi are assumed to follow a Poisson distribution. The mean and variance for this distribution are the same which is ei θi, . Here, ei represents the expected number of new infective, while θi refers to the relative risk. Hence, the model is formulated as follows:
yi ~Poisson (ei θi) (1)
log (θi) = α + up + vi (2)
From Equation (2), the term α represents the intercept of the model which is an overall level of the relative risk, while the terms ui and vi represent the correlated and uncorrelated heterogeneities, respectively.
In the second stage, a Bayesian model needs specification of prior distribution for the random effects and intercept term. Here, the distribution model for vi does not depend on geographic location and is assumed to follow a normal distribution which can be written as follows.
vi ~N (0, τv2) (3)
While for the spatial correlation structure, ui is used. Here, the risk estimation in any area depends on the spatial correlation between neighbouring areas. This distribution model is called the conditional autoregressive (CAR) model which is written in Equation (4).
[ui |up, i≠j, τu2 ]~N(ūi ,τi
2 ) (4)
where
Relative Risk Estimation for Dengue Disease Mapping in Malaysia
761Pertanika J. Sci. & Technol. 25 (3): 759 - 766 (2017)
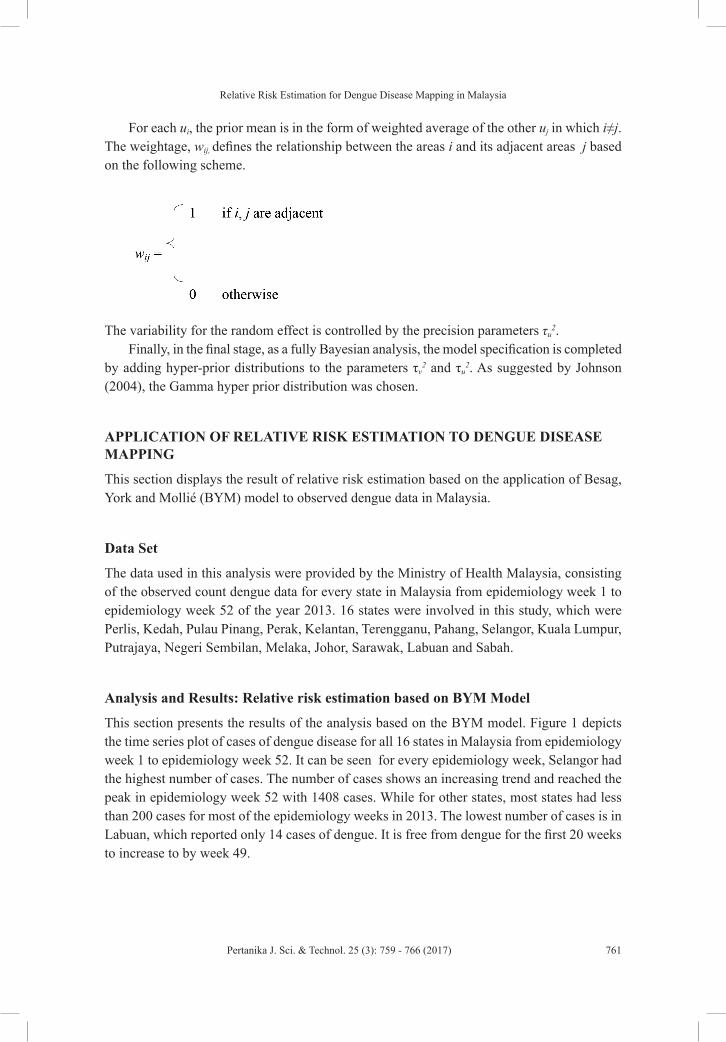
For each ui, the prior mean is in the form of weighted average of the other uj in which i≠j. The weightage, wij, defines the relationship between the areas i and its adjacent areas j based on the following scheme.
The variability for the random effect is controlled by the precision parameters τu2.
Finally, in the final stage, as a fully Bayesian analysis, the model specification is completed by adding hyper-prior distributions to the parameters τv
2 and τu2. As suggested by Johnson
(2004), the Gamma hyper prior distribution was chosen.
APPLICATION OF RELATIVE RISK ESTIMATION TO DENGUE DISEASE MAPPING
This section displays the result of relative risk estimation based on the application of Besag, York and Mollié (BYM) model to observed dengue data in Malaysia.
Data Set
The data used in this analysis were provided by the Ministry of Health Malaysia, consisting of the observed count dengue data for every state in Malaysia from epidemiology week 1 to epidemiology week 52 of the year 2013. 16 states were involved in this study, which were Perlis, Kedah, Pulau Pinang, Perak, Kelantan, Terengganu, Pahang, Selangor, Kuala Lumpur, Putrajaya, Negeri Sembilan, Melaka, Johor, Sarawak, Labuan and Sabah.
Analysis and Results: Relative risk estimation based on BYM Model
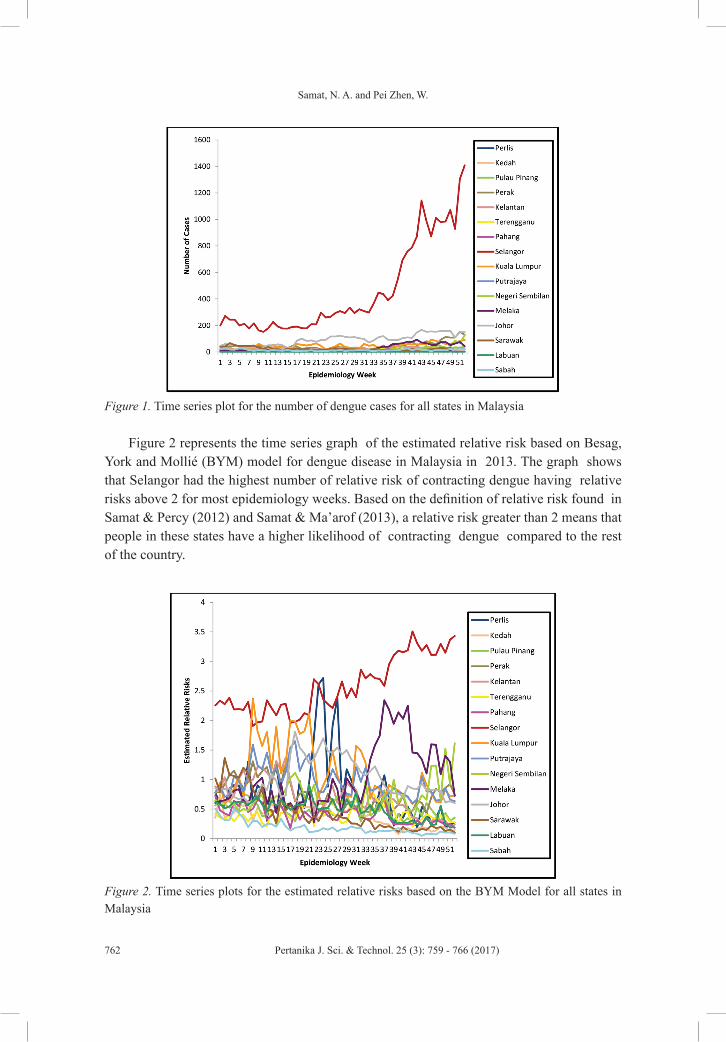
This section presents the results of the analysis based on the BYM model. Figure 1 depicts the time series plot of cases of dengue disease for all 16 states in Malaysia from epidemiology week 1 to epidemiology week 52. It can be seen for every epidemiology week, Selangor had the highest number of cases. The number of cases shows an increasing trend and reached the peak in epidemiology week 52 with 1408 cases. While for other states, most states had less than 200 cases for most of the epidemiology weeks in 2013. The lowest number of cases is in Labuan, which reported only 14 cases of dengue. It is free from dengue for the first 20 weeks to increase to by week 49.
Samat, N. A. and Pei Zhen, W.
762 Pertanika J. Sci. & Technol. 25 (3): 759 - 766 (2017)
Figure 1. Time series plot for the number of dengue cases for all states in Malaysia
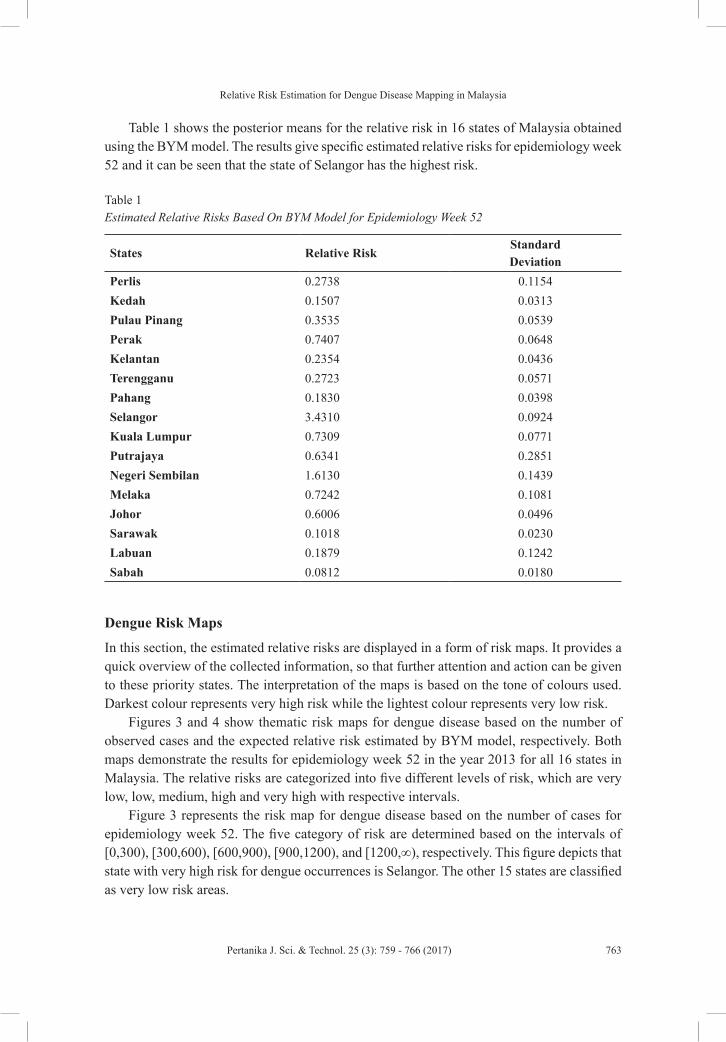
Figure 2 represents the time series graph of the estimated relative risk based on Besag, York and Mollié (BYM) model for dengue disease in Malaysia in 2013. The graph shows that Selangor had the highest number of relative risk of contracting dengue having relative risks above 2 for most epidemiology weeks. Based on the definition of relative risk found in Samat & Percy (2012) and Samat & Ma’arof (2013), a relative risk greater than 2 means that people in these states have a higher likelihood of contracting dengue compared to the rest of the country.
Figure 2. Time series plots for the estimated relative risks based on the BYM Model for all states in Malaysia
Relative Risk Estimation for Dengue Disease Mapping in Malaysia
763Pertanika J. Sci. & Technol. 25 (3): 759 - 766 (2017)
Table 1 shows the posterior means for the relative risk in 16 states of Malaysia obtained using the BYM model. The results give specific estimated relative risks for epidemiology week 52 and it can be seen that the state of Selangor has the highest risk.
Table 1Estimated Relative Risks Based On BYM Model for Epidemiology Week 52
States Relative RiskStandardDeviation
Perlis 0.2738 0.1154Kedah 0.1507 0.0313Pulau Pinang 0.3535 0.0539Perak 0.7407 0.0648Kelantan 0.2354 0.0436Terengganu 0.2723 0.0571Pahang 0.1830 0.0398Selangor 3.4310 0.0924Kuala Lumpur 0.7309 0.0771Putrajaya 0.6341 0.2851Negeri Sembilan 1.6130 0.1439Melaka 0.7242 0.1081Johor 0.6006 0.0496Sarawak 0.1018 0.0230Labuan 0.1879 0.1242Sabah 0.0812 0.0180
Dengue Risk Maps
In this section, the estimated relative risks are displayed in a form of risk maps. It provides a quick overview of the collected information, so that further attention and action can be given to these priority states. The interpretation of the maps is based on the tone of colours used. Darkest colour represents very high risk while the lightest colour represents very low risk.
Figures 3 and 4 show thematic risk maps for dengue disease based on the number of observed cases and the expected relative risk estimated by BYM model, respectively. Both maps demonstrate the results for epidemiology week 52 in the year 2013 for all 16 states in Malaysia. The relative risks are categorized into five different levels of risk, which are very low, low, medium, high and very high with respective intervals.
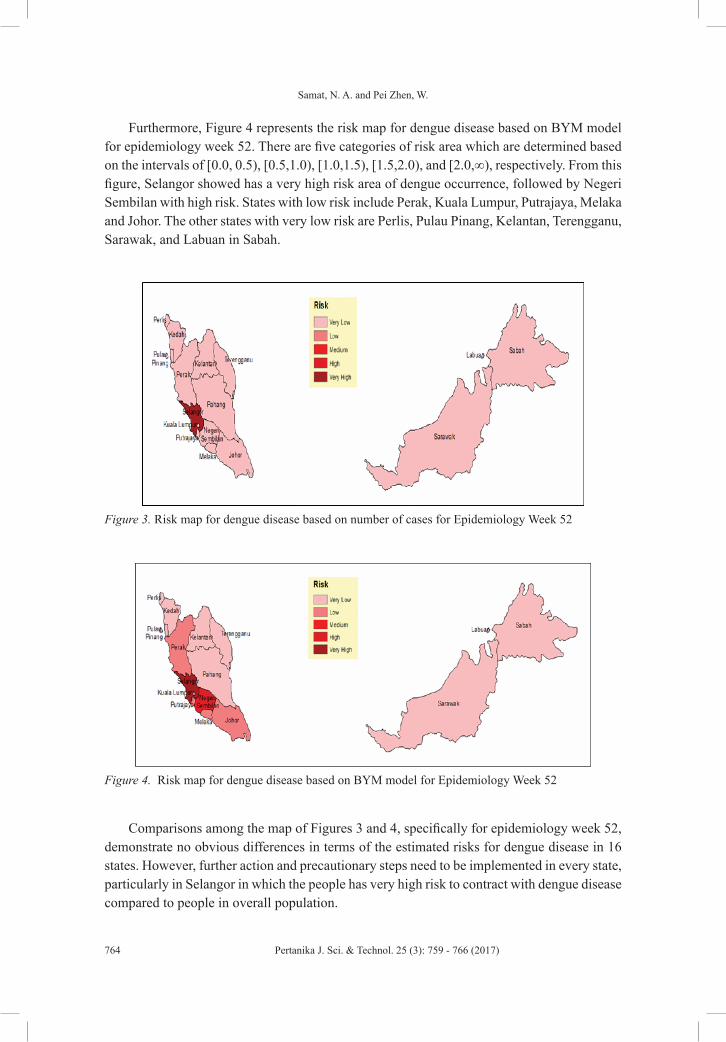
Figure 3 represents the risk map for dengue disease based on the number of cases for epidemiology week 52. The five category of risk are determined based on the intervals of [0,300), [300,600), [600,900), [900,1200), and [1200,∞), respectively. This figure depicts that state with very high risk for dengue occurrences is Selangor. The other 15 states are classified as very low risk areas.
Samat, N. A. and Pei Zhen, W.
764 Pertanika J. Sci. & Technol. 25 (3): 759 - 766 (2017)
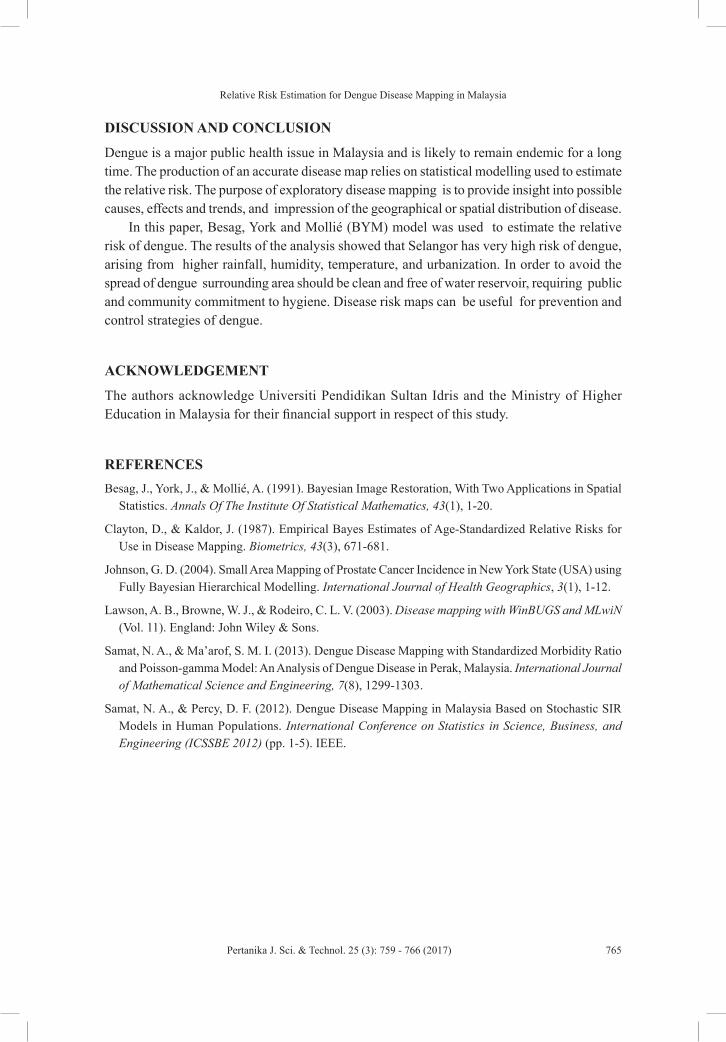
Furthermore, Figure 4 represents the risk map for dengue disease based on BYM model for epidemiology week 52. There are five categories of risk area which are determined based on the intervals of [0.0, 0.5), [0.5,1.0), [1.0,1.5), [1.5,2.0), and [2.0,∞), respectively. From this figure, Selangor showed has a very high risk area of dengue occurrence, followed by Negeri Sembilan with high risk. States with low risk include Perak, Kuala Lumpur, Putrajaya, Melaka and Johor. The other states with very low risk are Perlis, Pulau Pinang, Kelantan, Terengganu, Sarawak, and Labuan in Sabah.
Figure 3. Risk map for dengue disease based on number of cases for Epidemiology Week 52
Figure 4. Risk map for dengue disease based on BYM model for Epidemiology Week 52
Comparisons among the map of Figures 3 and 4, specifically for epidemiology week 52, demonstrate no obvious differences in terms of the estimated risks for dengue disease in 16 states. However, further action and precautionary steps need to be implemented in every state, particularly in Selangor in which the people has very high risk to contract with dengue disease compared to people in overall population.
Relative Risk Estimation for Dengue Disease Mapping in Malaysia
765Pertanika J. Sci. & Technol. 25 (3): 759 - 766 (2017)
DISCUSSION AND CONCLUSION
Dengue is a major public health issue in Malaysia and is likely to remain endemic for a long time. The production of an accurate disease map relies on statistical modelling used to estimate the relative risk. The purpose of exploratory disease mapping is to provide insight into possible causes, effects and trends, and impression of the geographical or spatial distribution of disease.
In this paper, Besag, York and Mollié (BYM) model was used to estimate the relative risk of dengue. The results of the analysis showed that Selangor has very high risk of dengue, arising from higher rainfall, humidity, temperature, and urbanization. In order to avoid the spread of dengue surrounding area should be clean and free of water reservoir, requiring public and community commitment to hygiene. Disease risk maps can be useful for prevention and control strategies of dengue.
ACKNOWLEDGEMENT
The authors acknowledge Universiti Pendidikan Sultan Idris and the Ministry of Higher Education in Malaysia for their financial support in respect of this study.
REFERENCESBesag, J., York, J., & Mollié, A. (1991). Bayesian Image Restoration, With Two Applications in Spatial
Statistics. Annals Of The Institute Of Statistical Mathematics, 43(1), 1-20.
Clayton, D., & Kaldor, J. (1987). Empirical Bayes Estimates of Age-Standardized Relative Risks for Use in Disease Mapping. Biometrics, 43(3), 671-681.
Johnson, G. D. (2004). Small Area Mapping of Prostate Cancer Incidence in New York State (USA) using Fully Bayesian Hierarchical Modelling. International Journal of Health Geographics, 3(1), 1-12.
Lawson, A. B., Browne, W. J., & Rodeiro, C. L. V. (2003). Disease mapping with WinBUGS and MLwiN (Vol. 11). England: John Wiley & Sons.
Samat, N. A., & Ma’arof, S. M. I. (2013). Dengue Disease Mapping with Standardized Morbidity Ratio and Poisson-gamma Model: An Analysis of Dengue Disease in Perak, Malaysia. International Journal of Mathematical Science and Engineering, 7(8), 1299-1303.
Samat, N. A., & Percy, D. F. (2012). Dengue Disease Mapping in Malaysia Based on Stochastic SIR Models in Human Populations. International Conference on Statistics in Science, Business, and Engineering (ICSSBE 2012) (pp. 1-5). IEEE.