Embed Size (px)
Citation preview

Pertussis surveillance in SwedenNineteen-year report

Pertussis surveillance in SwedenNineteen-year report

Bindningar och jävFör Folkhälsomyndighetens egna experter och utredare som medverkati rapporter bedöms eventuella intressekonflikter och jäv inom ramen föranställningsförhållandet.
När det gäller externa experter och utredare som deltar iFolkhälsomyndighetens arbete med rapporter kräver myndigheten attde lämnar skriftliga jävsdeklarationer för potentiella intressekonfliktereller jäv. Sådana omständigheter kan föreligga om en expert t.ex. fått ellerfår ekonomisk ersättning från en aktör med intressen i utgången av denfråga som myndigheten behandlar eller om det finns ett tidigare ellerpågående ställningstagande eller engagemang i den aktuella frågan påett sådant sätt att det uppkommer misstanke om att opartiskheten inte kanupprätthållas. Folkhälsomyndigheten tar därefter ställning till om det finnsnågra omständigheter som skulle försvåra en objektiv värdering av detframtagna materialet och därmed inverka på myndighetens möjligheter attagera sakligt och opartiskt. Bedömningen kan mynna ut i att experten kananlitas för uppdraget alternativt att myndigheten föreslår vissa åtgärderbeträffande expertens engagemang eller att experten inte bedöms kunnadelta i det aktuella arbetet.
De externa experter som medverkat i framtagandet av denna rapporthar inför arbetet i enlighet med Folkhälsomyndighetens krav lämnat endeklaration av eventuella intressekonflikter och jäv. Folkhälsomyndighetenhar därefter bedömt att det inte föreligger några omständigheter somskulle kunna äventyra myndighetens trovärdighet. Jävsdeklarationernaoch eventuella kompletterande dokument utgör allmänna handlingar somnormalt är offentliga handlingarna finns tillgängliga på Folkhälsomyndigheten.
Denna titel kan laddas ner från: www.folkhalsomyndigheten.se/publicerat-material
Citera gärna Folkhälsomyndighetens texter, men glöm inte att uppgekällan. Bilder, fotografier och illustrationer är skyddade av upphovsrätten.Det innebär att du måste ha upphovsmannens tillstånd att använda dem.
© Folkhälsomyndigheten, 2017Artikelnummer: 01206-2017

Förord (preface)
Folkhälsomyndigheten har en förstärkt övervakning av kikhosta sedande acellulära vaccinerna mot kikhosta introducerades i det nationellabarnvaccinationsprogrammet i Sverige år 1996. Övervakningen innefattarincidens av rapporterade fall av kikhosta per åldersgrupp samt en uppföljningvia strukturerade telefonintervjuer av alla rapporterade fall 0-20 år gamla.Denna rapport innehåller resultaten för år 2016 samt analys av studiensuppföljning under de senaste nitton åren.
Kikhosta är en särskilt allvarlig och ibland livshotande sjukdom för ovaccineradespädbarn under sex månader är. Både sjukdomen kikhosta och vaccinationmot kikhosta ger ett bra, men relativt kortvarigt skydd mot sjukdom. Desenaste tre årens ökade incidens av kikhosta i Sverige, trots hög vaccinationstäckning,och ökningen av kikhosta i andra länder har aktualiserat vikten av fortsattförstärkt uppföljning av kikhosta i Sverige.
Syftet med uppföljningen av kikhosta är att ge underlag för ändringarav vaccinationsprogrammet eller andra interventioner som kan skyddaspädbarn mot kikhosta. Kunskap från uppföljningen om sjukdomensepidemiologi och allvarliga förlopp, vikten av provtagning och förebyggandeantibiotikabehandling för de minsta barnen, sprids regelbundet via vetenskapligapublikationer, på Folkhälsomyndighetens webbplats och i samband medutbildningsdagar och kurser riktade till hälso- och sjukvårdspersonal.
Målgruppen för årsrapporten är hälso- och sjukvårdspersonal, och dåsärskilt personal inom mödravård, barnhälsovård och barnsjukvård samtprimärvård och smittskyddsenheter.
Rapporten har skrivits av Bernice Aronsson (projektledare), Henrik Källberg,Emma Byström och Kerstin Drakes-Jämtberg. I den slutliga utformningenhar enhetschef Ann Lindstrand och avdelningschef Anders Tegnell deltagit.
Folkhälsomyndigheten
Johan Carlsson, Generaldirektör

Preface
The Public Health Agency of Sweden has conducted enhanced surveillanceof pertussis since 1996, when acellular vaccines were introduced in Sweden´snational immunisation programme for children. The surveillance includesthe incidence of reported pertussis cases per age group and follow-upof all reported cases of pertussis among those 0-20 years of age throughstructured telephone interviews. This report includes results for 2016, aswell analyses from the past 19 years of surveillance.
Pertussis is particularly serious and sometimes life threatening for unvaccinatedinfants under the age of 6 months. Both pertussis infection and vaccinationprovide good, but relatively short-lived protection against the disease. Theincreased incidence of pertussis in Sweden during the last three years –despite high vaccination coverage – and the increase in pertussis in othercountries has accentuated the importance of enhanced follow-up of pertussiscases.
The aim of the surveillance of pertussis is to provide knowledge to makeinformed changes in the national immunisation programme or other interventionsto protect infants. Surveillance data on pertussis epidemiology and onsevere disease progression, as well as the importance of laboratory testingand prophylactic antibiotic treatment of infants, are disseminated regularlythrough scientific articles, on the website of the Public Health Agency, andat conferences and in courses aimed at health care professionals.
This report is written for health care professionals, particularly those workingin maternal and child health care, school health care (elevhälsan), andprimary care as well as those working at the counties´ Department ofCommunicable Disease Control and Prevention.
The report was written by Bernice Aronsson (project leader), Henrik Källberg,Emma Byström, and Kerstin Drakes-Jämtberg. Head of Unit Ann Lindstrandand Anders Tegnell, Head of the Department of Monitoring and Evaluation,participated in the final revisions of the report.
The Public Health Agency of Sweden
Johan Carlsson, General Director

Table of contents
Förord (preface) . . . . . . . . . . . . . . . . . . . . . . . . . . . 5
Abbreviations . . . . . . . . . . . . . . . . . . . . . . . . . . . . . 12
Summary . . . . . . . . . . . . . . . . . . . . . . . . . . . . . . . 13
Introduction of the Swedish Surveillance study of pertussis 14
1 Material and Methods 15
1.1 Data sources . . . . . . . . . . . . . . . . . . . . . . . . . . 15
1.1.1 SmiNet - mandatory reporting of pertussis cases inSweden . . . . . . . . . . . . . . . . . . . . . . . . . 15
1.1.2 Enhanced surveillance study of pertussis . . . . . . . 15
1.1.3 Gothenburg study area . . . . . . . . . . . . . . . . . 18
1.1.4 Trial I and Trial II . . . . . . . . . . . . . . . . . . . . 20
1.1.5 Collection of data in the enhanced surveillance studyof pertussis . . . . . . . . . . . . . . . . . . . . . . . 21
1.2 Diagnostics . . . . . . . . . . . . . . . . . . . . . . . . . . . 23
1.2.1 Methods of diagnostics . . . . . . . . . . . . . . . . . 23
1.2.2 Case definition . . . . . . . . . . . . . . . . . . . . . . 27
1.3 Vaccination . . . . . . . . . . . . . . . . . . . . . . . . . . . . 27
1.3.1 Vaccination registration . . . . . . . . . . . . . . . . . 27
1.3.2 Vaccination schedule included in the National ImmunisationProgramme since 1953 . . . . . . . . . . . . . . . . . 27
1.3.3 Vaccines used . . . . . . . . . . . . . . . . . . . . . . 30
Vaccines during the first year of life . . . . . . . . . . . . . . 30
Acellular pertussis containing booster vaccines after the firstyear of age . . . . . . . . . . . . . . . . . . . . . . . 31
Vaccine studies in Sweden in the enhanced surveillance study 31

1.3.4 Vaccination coverage . . . . . . . . . . . . . . . . . . 32
1.4 Sample size considerations and the calculation of incidences. . . . . . . . . . . . . . . . . . . . . . . . . . . . . . . . . . 33
2 Results 35
2.1 Incidences and cases of pertussis in all age groups . . . . . 35
2.1.1 Number and incidence of pertussis cases in 2016 . . 35
2.1.2 Incidence and cases over time . . . . . . . . . . . . . 35
2.1.3 Incidence and cases of pertussis, distributed by ageand time intervals . . . . . . . . . . . . . . . . . . . . 38
Incidence of pertussis in defined age-groups, before andafter the introduction of DTaP vaccination . . . . . . . 42
Incidence of pertussis at 1-20 years of age presented intime intervals . . . . . . . . . . . . . . . . . . . . . . 42
Pertussis in fully vaccinated children . . . . . . . . . . . . . . 45
Incidences and cases of pertussis for -all age groups . . . . 47
2.2 Pertussis in infants . . . . . . . . . . . . . . . . . . . . . . . 48
2.2.1 Number of pertussis cases in 2016 in infancy byvaccination status . . . . . . . . . . . . . . . . . . . . 49
2.2.2 Timing of vaccinations . . . . . . . . . . . . . . . . . 50
2.2.3 Incidence and cases of pertussis among the 0–20years of age, distribution by age and vaccinationstatus . . . . . . . . . . . . . . . . . . . . . . . . . . 51
2.2.4 Incidence of pertussis in infancy by date and afterchanges to the national immunisation programme . . 53
2.2.5 Incidence of pertussis during and after the first yearof life presented in time intervals . . . . . . . . . . . 55
Pertussis in infants in different years and in relation to otherage groups . . . . . . . . . . . . . . . . . . . . . . . . 56
2.3 Severity of pertussis in infants . . . . . . . . . . . . . . . . . 58
2.3.1 Hospitalization . . . . . . . . . . . . . . . . . . . . . . 59
The rate of hospital admission for pertussis by age . . . . . 59

Hospital stay by age and vaccination status at the pertussisepisode . . . . . . . . . . . . . . . . . . . . . . . . . . 60
2.3.2 Complications due to pertussis . . . . . . . . . . . . . 61
The rate of complications due to pertussis and by age . . . . 62
Complication in relation to age and vaccination status atthe pertussis episode . . . . . . . . . . . . . . . . . . 63
2.3.3 Spasmodic cough . . . . . . . . . . . . . . . . . . . . 63
Cases of spasmodic cough due to pertussis . . . . . . . . . . 63
Duration of spasmodic cough, age and vaccination status atepisode start . . . . . . . . . . . . . . . . . . . . . . . 64
2.3.4 Deaths . . . . . . . . . . . . . . . . . . . . . . . . . . 66
In conclusion: Severity of pertussis in infants . . . . . . . . 66
2.4 Treatment of pertussis . . . . . . . . . . . . . . . . . . . . . 69
2.5 Case contact study of pertussis in infants . . . . . . . . . . . 70
2.6 Geographic differences in Sweden for laboratory-confirmedpertussis cases . . . . . . . . . . . . . . . . . . . . . . . . . 70
2.7 The effects of catch-up and booster vaccination schedules . 71
2.7.1 Immunisations during the 1990s . . . . . . . . . . . 71
2.7.2 Immunisations during the 1990s in pertussis vaccinetrials . . . . . . . . . . . . . . . . . . . . . . . . . . . 72
2.7.3 Booster vaccination in children born from 1995 andfrom 2002 (see also chapter 1.3) . . . . . . . . . . . 72
2.7.4 Effectiveness of the preschool booster vaccination . . 72
2.8 Follow up of vaccine studies and immunisation 1996-97 . . 72
2.8.1 Trials I and II . . . . . . . . . . . . . . . . . . . . . . 72
2.8.2 Surveillance of children immunised Jan 1, 1996, toSep 30, 1997 . . . . . . . . . . . . . . . . . . . . . . 74
2.9 Pertussis incidence in Västra Götaland and the evaluation ofseverity of pertussis in the Gothenburg study area . . . . . 76
2.9.1 Incidences and cases of pertussis in Västra Götaland 77

2.9.2 Severity of pertussis in the enhanced surveillancestudy for children in the Gothenburg study area incomparison with rest of Sweden . . . . . . . . . . . . 81
3 Discussion 86
4 Plan for continued work 96
4.1 Scientific publications and presentations . . . . . . . . . . . 97
4.2 Limitations . . . . . . . . . . . . . . . . . . . . . . . . . . . . 97
5 Administration 99
6 Reports from published peer-reviewed papers 100
6.1 Published reports based on the enhanced surveillance data . 100
7 References 102
8 Appendix 115
8.1 Information . . . . . . . . . . . . . . . . . . . . . . . . . . . 115
8.2 Tables referring to Chapter 2.1 to 2.9 . . . . . . . . . . . . . 115
8.3 Severity of pertussis . . . . . . . . . . . . . . . . . . . . . . 135
8.3.1 Severity of pertussis in Sweden including the Gothenburgstudy area (from 2003) and excluding the Gothenburgstudy area (from 1997) . . . . . . . . . . . . . . . . . 135
8.3.2 Cases of hospitalization due to pertussis for all ofSweden . . . . . . . . . . . . . . . . . . . . . . . . . 135
8.3.3 The rate of hospital admission for pertussis by agefor all of Sweden . . . . . . . . . . . . . . . . . . . . 135
8.3.4 Incidence of hospital admission and age at the onsetof pertussis episode for Sweden without Gothenburgstudy area . . . . . . . . . . . . . . . . . . . . . . . . 135
8.3.5 Duration of hospital stay by age and vaccinationstatus at the start of the pertussis episode . . . . . . 135
8.4 Complications in the enhanced surveillance study . . . . . . 144
8.4.1 Cases of complications due to pertussis for all ofSweden . . . . . . . . . . . . . . . . . . . . . . . . . 144
8.4.2 2 The correlation between the rate of complicationsdue to pertussis and age for all of Sweden . . . . . . 144
8.4.3 Incidence of complications and age for all of Sweden 144
8.4.4 Complications, age, and vaccination status at thestart of the pertussis episode for all Sweden . . . . . 145
8.4.5 Spasmodic cough in Sweden with and without Gothenburgstudy area . . . . . . . . . . . . . . . . . . . . . . . . 151
8.5 Updated tables with incidence data from the onset of theenhanced studies in Sweden and in the Gothenburg studyarea, respectively . . . . . . . . . . . . . . . . . . . . . . . . 159

Abbreviations
aP acellular pertussis (vaccine)
CHC Child health care
DTaP Full dose vaccine against diphtheria-, tetanus- and acellularpertussis vaccine
DTap Full dose tetanus toxoid and reduced dose of accelular pertussisantigens and reduced dose of diphtheria toxoid
EPS Enhanced pertussis surveillance
FHA Filamentous haemagglutinin
Hib Haemophilus influenzae type b
IPV Inactivated polio vaccine
NIP National immunisation programme
PCR Polymerase chain reaction
PHAS Public Health Agency of Sweden
PRN Pertactin
PT Pertussis toxoid
SHC School health care
SMI Smittskyddsinstitutet, in English: Swedish Institute for CommunicableDisease Control
SmiNet Computer-linked reporting system for reports of notifiablediseases, including pertussis infections
wP whole-cell pertussis (vaccine)

Summary
For several decades there has been a 97–98% coverage of the vaccinationsrecommended in the National Immunisation Programme (NIP) in infancy,delivered through Sweden’s well-established Child Health Clinic (CHC)system. This 19-year enhanced pertussis surveillance (EPS) has reportedon the epidemiology of pertussis in Sweden at the population level sinceacellular pertussis (aP) was introduced in 1996. This report shows thatsince the introduction of aP vaccine, there has been a dramatic decline inthe overall pertussis incidence in the Swedish population. However, afteryears of low pertussis incidence there has been an increase in the numberof reported pertussis cases in almost all age groups during the last threeyears, which might be an indicator of waning immunity. The increase ofpertussis in 2014 was difficult to predict because it was neither preceded bya decrease in vaccination coverage nor by an obvious increase of pertussisin any age group. With the current situation, it is reasonable to believethat Sweden has passed the honeymoon period as described by de Celle‘s(2016).In the present 19-year report, 647 labortory-confirmed cases of pertussiswere reported to SmiNet during 2016, of which 87 cases were among infantsyounger than 1 year of age. As in previous years, infants had the highestincidence (74.1 cases/100,000 person years) out of all age groups in 2016.The high incidence and high rate of hospitalisation among infants waslargely in infants who contracted pertussis before they received one or twodoses of vaccine. The results in this report suggest that even after one doseof a pertussis vaccine there is some protection against severe pertussis,indicating the importance of timely vaccination in infants.Sweden has had a relatively late resurgence of pertussis, which might bedue to the stable and high vaccination coverage since the introduction ofaP vaccine in 1996 and to a long period without pertussis vaccine in theNIP, generating cohorts with naturally acquired immunity with longerduration of disease protection. The booster vaccination (4th dose) wasadministered during 2007–2012 to two birth cohorts, and this might haveextended the period with low incidence among children of school age.Other age groups associated with increased and higher incidences in 2016compared to 2015 were the 11, 13, and 17 year olds. Future EPS reports willprovide data on the effectiveness of the booster dose introduced in 2016for 14–16 year olds. Despite the existing preventive strategies for reducingpertussis cases in infants, many infants still contract the disease. Infants tooyoung for vaccination are at the greatest risk of life-threatening pertussis,and thus effective strategies to protect the youngest infants are needed.In the case of a further increase of pertussis in infants, other preventiveinterventions, including recommendation of maternal vaccination, will bere-evaluated when more data on safety and interference are available, andcomplementary strategies might be recommended in the future.
13

Introduction of the Swedish enhanced surveillancestudy of pertussis
The main aims of the EPS are to evaluate the impact of the NIP againstpertussis on the epidemiology of the disease and its severity, to followup on the long-term protection after vaccinations with acellular pertussis(aP)-containing combination vaccines, and to document potential effects ofchanges in the NIP. The results and experiences from the annual enhancedfollow-up in Sweden have been published in scientific reports by the PublicHealth Agency of Sweden (PHAS) (formerly the Swedish Institute forCommunicable Disease Control (SMI)) and in reviewed papers, amongwhich the following are the most important (Olin 1999, 2003, Trollfors2001, Gustafsson 2006, Carlsson 2009, Nilsson 2012, and Carlsson 2015).Further scientific papers are described in Chapter 6. The results from thepertussis serology and other laboratory studies have been published inseveral papers (Advani 2004, 2007, 2009, Hallander 2005, Elomaa 2007,Hallander & Andersson 2009, Hallander & Gustafsson 2009, and Zeddeman2014) and in pertussis serology reports with analyses from 1997 and 2007(reports from the SMI).The EPS includes laboratory-confirmed pertussis cases 0–20 years of ageborn from 1996 onwards in Sweden, excluding the Gothenburg studyarea until 2003 and whose parents/caregivers have been interviewed onthe duration of cough, complications, treatments, etc., from Oct 1, 1997,onwards. One area of Sweden, called the Gothenburg study area, locatedwithin the region of Västra Götaland, was excluded from the enhancedfollow-up until 2003 because pertussis surveillance was conducted within aclinical trial setting, including a mass vaccination project, in this study area.In the Gothenburg study area different vaccines was used compared to theNIP as described in 1.3.3. The results and experiences from the follow-upin the Gothenburg study area have been published in scientific journals(Trollfors 1995, Taranger 1997, and Taranger 2001) and also as reportspublished on the PHAS website (reference in report list: 14-year report,Pertussis Surveillance, Pertussis in the Gothenburg study area). Childrenfrom the Gothenburg study area have thereby been reported within the EPSfrom Jan 1, 2003, onwards and are also included in this report. Childrenfrom the Gothenburg study area was reported within the EPS from Jan 12003, when the vaccination schedule in this area was alligned to the rest ofSweden (according to NIP).The group with the highest incidence of pertussis – infants – is describedin separate sections in the current report. The severity of the pertussisdisease is described with regard to vaccination status, hospitalisation,complications, spasmodic cough, duration of cough, etc.Tables presenting age-stratified incidences separating data for the Gothenburgstudy area and the rest of Sweden appear in the appendix.
14
1 Material and Methods
1.1 Data sources
1.1.1 SmiNet - mandatory reporting of pertussis cases in Sweden
Pertussis was included as a notifiable disease in the new CommunicableDisease Act in 1997 (Figure 1). Since Oct 1997, all cases of pertussis, includingclinically suspected and/or laboratory-confirmed by culture, polymerasechain reaction (PCR), or serology, should be reported to the PHAS (fomerSMI until 2013) through a computer-linked reporting system called SmiNet(see (Rolfhamre 2006) for a description of SmiNet). Although clinicallysuspected cases are reporterd to Sminet, only laboratory-confirmed casesare presented in this report. The SmiNet database contains information onpatients of all ages. During 1980 to 1996, laboratory-confirmed pertussiswas voluntarily reported from all bacteriological laboratories with fullpersonal identifiers. Also, there has been a long-standing Swedish traditionof pertussis reporting by county medical officers since early in the 20thcentury.
1.1.2 Enhanced surveillance study of pertussis
The EPS in Sweden started in Oct 1, 1997, which was 1 year and 9 monthsafter the introduction of aP vaccines at the ages of 3, 5, and 12 months inthe NIP. Cases 0-20 yeras of age are included in the EPS based on culture-positiveor PCR-positive reports of pertussis, (and from 2008 also including serology-positivecases), in the SmiNet data base. Hence, only laboratory-confirmed cases ofpertussis are included in the EPS report. In the EPS, additional informationabout these cases is then collected through structured telephone interviewswith the parents of children diagnosed with pertussis. Complementaryinformation is also collected from medical records (described in Section 1.1.5).
Figure 1: Reporting of pertussis cases to SmiNet and further to theenhanced surveillance study.
The surveillance period is somewhat different depending on the area of
15

residence, with a shorter surveillance period in the Gothenburg studyarea (Figure 2). The Gothenburg study area differed in relation to thevaccines that were used in this study area during the initial years (Oct1, 1997–Dec 31, 2002) and the type of vaccination program (there was acatch-up campaign in Gothenburg study area) as further described below.
Inclusion criteria in the EPS are as follows:
1. Being born Jan 1, 1996, or later or being included in the pertussisvaccine trial cohorts (described in more detail below) and followed-upuntil 20 years of age.
2. Episode start: a) outside the Gothenburg study area and having apertussis episode starting Oct 1, 1997, or later or b) in the Gothenburgstudy area (described in more detail below) and having a pertussisepisode starting Jan 1, 2003, or later.
For ease of interpretation, the pertussis vaccine trial cohorts (Trial I andTrial II, described in section 1.1.4) have been excluded from most analysesin the current report. Furthermore, persons included in Trial I and Trial IIwere born in 1992 and 1993-1994 respectively, and are thereby not includedin the EPS report that includes pertussis cases born Jan 1, 1996, or later(0-20 years of age).
Gothenburg study area data according to the enhanced surveillance study
Sweden excluding Gothenburg study area data according to the enhanced surveillancestudy
Oct 1997 Jan 2003 Now
Gothenburg study Area Vaccine data only
Figure 2: The enhanced surveillance study in Sweden.
16

Time period Length ofevaluation
Type of data Area
Oct 1, 1997,until Dec 312016
19 years Prospectiveclinical andvaccine data
SwedenexcludingGothenburg
Oct 1, 1997,until Dec 31,2002
5 years Retrospectivevaccine data
Gothenburgstudy area
Jan 1, 2003,until Dec 312016
14 years Prospectiveclinical andvaccine data
Gothenburgstudy area
Table 1: Description of the available data. See below for a more detaileddescription of the surveillance study in the Gothenburg study area.
The situation in Sweden is unique, being a European country withoutpertussis vaccination in the NIP from 1979 to 1996 and with a well-implementedNIP and a long-standing tradition of quality in the reporting of laboratory-confirmedcases. This long-term EPS study has been ongoing for over 19 years asof Dec 31, 2016 (Table 1). The mandatory case-based reporting system(SmiNet) was used to identify cases confirmed by culture (and later alsoby PCR in children born from Jan 1, 1996 onwards, and by serology from2008).
In the present 19-year report, 647 laboratory-confirmed pertussis caseswere reported to SmiNet during 2016. For the EPS study, 298 new cases(including 14 in the Gothenburg study area) with disease onset in 2016were included in the enhanced analysis (pertussis cases among those 0–20years of age). For the Gothenburg study area, the enhanced surveillancestarted in Jan 1, 2003. Accumulated data during the EPS from Jan 1, 2003till Dec 31, 2016, show that there were a total of 3,446 cases (706 from theGothenburg study area) in cohorts that were followed up for pertussis inSweden.
Also, previous pertussis trial cohorts of around 10,000 infants in 1992–1995and 82,000 infants in 1993–1996 (Trial I and Trial II, respectively) have beenevaluated (Gustafsson 1996, Olin 1997). In these trials, both the wholecell pertussis (wP) and aP vaccines were used in the era before the aPvaccine was approved and introduced in the NIP. Data from these trialswith lengthier investigative protocols and more thorough evaluations anddiagnoses of the children have been evaluated in previous surveillance
17

studies and have been followed up and reported on (Gustafsson 1996, Olin1997). The changes over time in age-specific rates of pertussis have beenconsidered as the main outcome, and we have also linked clinical outcometo vaccination status.
Total number of cases, data sources, and vaccination status: When includingcases from Trials I and II, the total number of pertussis cases followedup is currently at 4,890. The database comprises Sweden excluding theGothenburg study area, the Gothenburg study area, and vaccine Trial I andTrial II. The number of cases for each sub-cohort is presented in Table 2. Inthe present 19-year report, 298 new laboratory-confirmed pertussis casesamong those 0–20 years of age with vaccination and clinical data wereincluded in the analyses of the EPS data.
Pertussis cases
Sweden excluding the Gothenburg study area 3460Gothenburg study area 706Trials I and II 724Total 4890
Table 2: The number of pertussis cases among those 0-20 years ofage followed up in the EPS in Sweden excluding the Gothenburgstudy area, the Gothenburg study area, and Trials I and II. Data arefrom laboratory-confirmed case reports of pertussis with episodesstarting between Oct 1, 1997 and Dec 31, 2016, in Sweden excluding theGothenburg study area and Trials I and II. For the Gothenburg study areathe data are from case reports of pertussis with episodes starting betweenJan 1, 2003, and Dec 31, 2016.
1.1.3 Gothenburg study area
Gothenburg was initially not part of the EPS because the vaccination scheduleand vaccines used in Gothenburg (monovalent aP (see chapter 1.3.3)) weredifferent from the rest of Sweden. During the years 1996–1999, the Gothenburgmass vaccination project offered free catch-up vaccination with three dosesto all children born in the 1990s (Taranger, 2001). There was no free catch-upoffered in the rest of the country, but monovalent aP vaccine was availableuntil the year 2000, and many children in the rest of the country werevaccinated at their parents’ expense during these years. Children fromthe Gothenburg study area have thereby been reported within the EPSonly from Jan 1, 2003, onwards, when the vaccination schedule in this
18

Gothenburg study area was aligned to the rest of Sweden (according toNIP). The Gothenburg study area comprised about 10% of the Swedishpopulation.
Previously, a separate report for the Gothenburg study area was publishedevery year (reference report: 14-year report, Pertussis Surveillance in theGothenburg study area).The differences between the Gothenburg studyarea and the rest of Sweden have levelled out since 2005, and thus theprevious approach with two separate reports is no longer needed. Data onpertussis cases among those 0–20 years of age from the Gothenburg studyarea are collected and included in the EPS database, and when relevantissues are formulated, separate data from the Gothenburg study area andthe rest of Sweden will be reported.
In the SmiNet database on mandatory reporting data, detailed informationabout area of residence is not available. When using this data set, theVästra Götaland county area is used as an approximation of the Gothenburgstudy area (see Figure 3, for the size and geographic make-up of the Gothenburgstudy area).
19

County of Västra Götaland
(1,671,783)
Kungsbacka within Halland
(80,442)
Gothenburg study area within Västra Götaland
(863,231)
Västra Götaland without Gothenburg
study area (808,552)
Gothenburg study area (943,673)
Figure 3: Description of the Gothenburg study area in relation to the twocounties Västra Götaland and Halland. The number of inhabitants in 2016is given in parentheses.
1.1.4 Trial I and Trial II
Children born in 1992 and in 1993–94 who participated in the two nationwidepertussis vaccine trials of 1992–1993 and 1993–96, Trial I and Trial II (Gustafsson1996, Olin 1997), respectively, have also since then been identified throughthe national register of communicable disease reports and entered into aseparate study database. The cases of pertussis have also been followed-upin detail by study nurses who documented the vaccination history andclinical course through structured telephone interviews according to thesame procedures carried out during Trial II (Olin, 1997). Pertussis Trial Iwith a 2-4-6 month schedule included 9,829 infants born in 1992. In TrialII with either a 3-5-12 month schedule (72,698 infants) or a 2-4-6 monthschedule (10,194 infants), the pertussis vaccine was administered to childrenborn from June 1993 to May–June 1994 (Gustafsson 1996, Olin 1997). Childrenparticipating in Trials I and II have been followed up in the EPS databasefrom Oct 1, 1997. As mentioned above, these cohorts have been excluded
20

from most analyses in the current report. Some results are presented inSection 2.8.1, and more detailed analyses have been presented previously(Gustafsson 1996, Olin 1997). Moreover, the EPS only includes pertussiscases among those 0–20 years of age, and thus persons included in TrialI and Trial II are now too old to be included in the enhanced surveillancestudy report. However, historical data on pertussis cases included in thesetrials can be analysed and reported on demand. Furthermore, if personsincluded in these trials were reported as pertussis cases, they were followedup by the SmiNet reporting system and are possible to identify.
1.1.5 Collection of data in the enhanced surveillance study ofpertussis
All data in this report encompass information obtained in two ways: A)within the regular Swedish surveillance of communicable diseases (SmiNet 1.1.1)and B) within the EPS study.
A Within the regular Swedish surveillance of communicable diseases:In Sweden, pertussis has been a notifiable disease since 1996, and itis one of the diseases with mandatory contact tracing. Laboratoriesreport laboratory-confirmed cases by notifications both to the PHASand to the County Medical Officer of Communicable Disease Preventionand Control. A confirmed case is a case with a positive culture, PCR,or serology result (seroconversion or significant increase in IgG againstpertussis toxin (PT)). The notifications are immediately available atboth the national and regional level through the web-based SmiNetregistry based on disease and personal identifiers. There is limitedor no information in the reports on vaccination status or clinicaldetails, including case contacts, but age-specific incidence rates canbe calculated from the age at the reporting date. In this report, theannual number of cases notified to SmiNet are based on date ofnotification of the case.
B Within the EPS: The EPS in Sweden was established in Oct 1997.Every case of laboratory-reported pertussis among those 0–20 years ofage, born in 1996 or later, is identified in SmiNet for detailed follow-up,except for those occurring from Oct 1, 1997, to Dec 31, 2002, in theGothenburg study area where a local surveillance project was inplace.
All identified reports are matched against the population registryfor parental contact details and to check that there has been no deathnotification. A research nurse performs structured telephone interviewswith the parents of each case using a standardized questionnaire.The clinical questions include the type and duration of cough, the
21

presence of apnoea and other complications, the number and lengthof hospital admissions, the timing of antibiotic treatment if given, andthe vaccination dates. If medical records are needed for complementarymedical information, the parents are contacted to provide consent.The families of deceased children are not contacted, but their ChildHealth Care (CHC) records provide vaccination status, and informationon gestational age is obtained from the medical birth register. Theindividual vaccination history allows for the calculation of age-specificincidence rates in vaccinated and non-vaccinated children. Withaccess to clinical information, data from the EPS study are basedon the age at onset of symptoms, which is important when analysingthe age-specific severity of disease in infants. Date of onset is used asbasis for analysis in EPS instead of date of notification of case (as inSmiNet registry), in order to improve data quality.
Vaccination history: The detailed vaccination histories of pertussis casesborn since 1996 were obtained from the medical records of the CHC orSchool Health Care (SHC) Centers by a telephone call to the nurse attendingthe individual child.
Severity of disease: Parameters reflecting severity of disease includedduration of spasmodic cough and total duration of cough and hospitaladmissions.
Data on respiratory complications, neurological complications, dehydrationwith >5% of weight loss, or other serious complications during the pertussisepisode were collected and registered in the database.
Antibiotic treatment: Information on antibiotic use was collected in pertussiscases among those 0-20 years of age, born from Jan 1, 1996, with episodesstarting between Jan 1, 2003 and Dec 31, 2016. Data on the time betweenthe onset of an episode and the start of antibiotic treatment were collectedalong with data on the length of treatment and the type of antibiotics.
Source of transmission This has been included in the EPS study since2009. A structured questionnaire was added to the telephone interviewin the enhanced surveillance study with questions concerning the source oftransmission. This information was added to the pertussis cases in infantsyounger than 1 year. All parents/caregivers were asked if someone whohad been coughing for more than a week had been in close contact with theinfant with confirmed pertussis disease in the month prior to the start ofthe episode in the infant. Questions were also asked whether it was none,one, two, or up to three contacts who had had a cough for more than aweek.
Database: All clinical data and the unique Swedish personal identificationnumbers were entered into a database. Progress reports have summarized
22

the database information for all episodes up to the end of the previousproject year, with the present 19-year report updating the information fromOct 1, 1997, until Dec 31, 2016.
The numbers of pertussis cases with cough characteristics available fromthe whole country and from the cohorts (the Gothenburg study area andSweden excluding the Gothenburg study area) are described in Figure 7Appendix and Figure 9 Appendix.
1.2 Diagnostics
1.2.1 Methods of diagnostics
A confirmed case of pertussis is a case with a positive isolation of Bordetellapertussis (culture), positive PCR for pertussis, or positive result by serology(seroconversion or significant increase in IgG against PT) and these are thecase definitions used for notification under the Communicable DiseasesAct as detailed in Figures 4 and 5, and Table 3. PCR was the most commondiagnostic method used in 2016 (82.3% of the cases).During 2016, all new cases included in the EPS were laboratory-confirmedcases (Table 3).
Starting Jan 1, 2014, the PHAS began to collect data from all laboratories inSweden on the total number of samples that were analysed for B pertussis(PCR, culture and/or serology). During 2016, a total of 14,306 sampleswere tested for pertussis, 214 samples by culture, 12,898 by PCR-, and 1,194by serology. A total of 13,358 samples were tested for pertussis in 2014, and13,167 samples were tested in 2015. There was no significant differencebetween the total number of samples tested in 2015 compared to 2016. Theyearly collection and reporting of these data will help us to further analysethe level of awareness and the epidemiology of pertussis.
The diagnostic methods used have changed over time and in the differentage groups. Up to 2003, confirmation of B. pertussis by culture was thedominant laboratory method in all age groups. In children, PCR is now themost common method for diagnosing pertussis. In the older age group, theuse of serology and PCR testing has increased. Thus, since 2006 serologyand PCR have been the most common methods used for diagnosing pertussisin patients older than 10 years of age (Figures 4 and 5).
In 1997 the proportion of PCR-confirmed cases was less than 5% and in2003 around 20% of all laboratory reports were based on PCR. Nowadaysless than 5% of the pertussis reports are based on culture (Table 3). It iswell known that PCR has a higher sensitivity in comparison with culture,especially in milder cases and later stage of the disease but at cost of a
23

higher risk of false-positivity. The increasing use of PCR might thus increasethe reporting of cases. Serology has the advantage of higher sensitivity incases where diagnosis is performed late in the disease. However, serologyhas a lower specificity than culture and PCR.
1997 1999 2001 2003 2005 2007 2009 2011 2013 2015
CulturePCRSerology
Year
Cas
es
0
500
1000
1500
Figure 4: Laboratory methods used for verification of cases in childrenaged 0-10 years. Data are based on laboratory-confirmed cases reported toSmiNet, according to the Communicable Disease Act.
24

1997 1999 2001 2003 2005 2007 2009 2011 2013 2015
CulturePCRSerology
Year
Cas
es
0
100
200
300
400
Figure 5: Laboratory methods used for verification of cases in childrenand adults aged 11 years or older. Data are based on laboratory-confirmedcases, reported to SmiNet, according to the Communicable Disease Act.
25

Age
(yea
rs)
Met
hod
9798
9900
0102
0304
0506
0708
0910
1112
1314
1516
Age
(yea
rs)
0-10
Cul
ture
607
959
1553
1699
564
763
255
336
231
7832
2119
63
53
11
2PC
R59
5876
632
2763
514
242
138
161
102
6092
5285
7620
015
816
7Se
rolo
gy15
00
2810
147
1217
2142
2616
112
68
122
311
-C
ultu
re37
8720
128
010
619
611
518
515
856
269
2014
38
03
99
PCR
52
122
38
2314
812
510
610
389
5167
4787
8936
630
536
4Se
rolo
gy7
00
67
76
1545
7215
911
382
5362
7847
9710
510
0
Tabl
e3:
Lab
orat
ory
met
hod
su
sed
for
veri
fica
tion
ofca
ses
inch
ildre
n0-
10ye
ars
and
adu
lts
aged
11ye
ars
orol
der
.D
ata
are
from
case
s,re
por
ted
toSm
iNet
,acc
ord
ing
toth
eC
omm
uni
cabl
eD
isea
seA
ct.
Dat
ap
rese
nted
onca
ses
wit
hsp
efci
fied
info
rmat
ion
onla
bora
tory
met
hod
used
.
26
1.2.2 Case definition
For the cases in SmiNet with a pertussis diagnosis, a pertussis case isdefined by detection of B. pertussis by culture or PCR in a sample regardlessof symptoms. From 2008 onward, positive serology has been included.Only positive samples that are taken more than 6 months after a previouspositive sample are considered to be a new episode of pertussis. By thisdefinition, every pertussis case in persons 0–20 years of age with laboratory-confirmedpertussis is defined as a case and can potentially be included in the EPSstudy except for those occurring from Oct 1, 1997, to Dec 31, 2002, in theGothenburg study area.
Clinical data were analysed according to several cough definitions, including14 days of coughing corresponding to the current case definitions for surveillancefrom the European Union (EU 2012) and from the World Health Organization(WHO 2016) and 21 days of paroxysmal cough according to a previousWHO definition established for use in efficacy trials (WHO 1991).
1.3 Vaccination
1.3.1 Vaccination registration
Since many years, Sweden has a well-established and internationally renownedCHC system covering >99% of all children in the country from new-bornsto 6 years of age. Health care is provided by the SHC system for childrenfrom 6 to 18 years of age. CHC and SHC nurses vaccinate children andregister the vaccinations in an individual medical record and report thevaccine doses given within the NIP to the regional health authorities. Vaccinationcoverage is then estimated at a national level by the PHAS. Since Jan 2013,all vaccinations should also be reported to the national immunisationregister. This mandatory reporting directly to PHAS will in coming yearsreplace the current reporting system on vaccination coverage from theregions.
1.3.2 Vaccination schedule included in the National ImmunisationProgramme since 1953
The vaccination schedules used in the NIP are outlined in Figure 6 a-e.
Vaccination with full dose diphtheria-tetanus-acellular pertussis (DTaP)vaccines started in Jan 1996 after a 17-year period of no pertussis vaccinebeing included in the NIP following the withdrawal of the wP vaccine dueto concerns about its safety and efficacy (Romanus 1987) (Figure 6 b-c). TheDTaP vaccine was registered in 1995 based on the results of several large aP
27

vaccine trials conducted in Sweden (Gustafsson 1996, Olin 1997, Trollfors1995, Greco 1996). Due to the delayed start of ordinary vaccination or tocatch-up vaccination, many children born in 1995 were vaccinated againstpertussis with monovalent pertussis (aP) vaccine.
Children that for some reason had delayed vaccination were until thespring of 2002 vaccinated according to the same principle during the secondyear of life, i.e. two doses with a 2 month interval, followed by a thirddose after 6 months, and from the age of 2 years according to a two-doseschedule (except in Gothenburg, where a three-dose schedule was usedregardless of age).
As mentioned above, the Gothenburg mass vaccination project offeredfree catch-up vaccination with three doses to all children born in the years1996–1999 (Taranger 2001). There was no free catch-up offered in the restof the country, but monovalent aP vaccine was available until the year 2000,and many children were vaccinated at their parents´ expense during theseyears.
Acellular pertussis vaccine was administered to children from 1996 at 3,5, and 12 months of age (Figure 6 d). Some years after their introduction,data showed that aP vaccines induced protection for a limited time only.Therefore, in 2005 a revision of the national immunisation schedule wasinitiated. As a first step, a booster dose was recommended to children inschool year 4 (age 10 years) from autumn 2005 (Figure 6 d). The first cohortrecommended for this fourth dose of DTaP were children born in 1995,i.e. the year before the formal introduction of DTaP in infancy, becausethis cohort was to a large extent (59%) immunised before 2 years of age.As a decay in antibody levels to non-protective levels was observed 4–5years after vaccination with aP vaccine, with a corresponding declinein vaccine effectiveness and increase in pertussis incidence (Olin 2003,Gustafsson 2006) a second step was taken in Jan 2007, when the schedulewas changed to include a fourth dose at 5–6 years and a fifth dose at 14–16years in children born from 2002 onwards (Figure 6 e). This means thatfrom 2007, the NIP has included a preschool and a 14–16-year boosterdose against diphtheria, tetanus, and pertussis for children born from 2002onwards (Regulation HSLF-FS 2015:6). The teenage booster dose (dTap)was implemented in 2016 (Figure 6 e).
28

Figure 6: Pertussis vaccinations in childhood for those born from 1953onwards in Sweden. During the time period from 1953 to 1979, wPvaccines was used in the NIP (a). During the time from 1979 to 1994, theuse of pertussis vaccines in NIP was interrupted (b). Large pertussis trialswith aP vaccines were conducted in Sweden from 1979 to 1994 (b). Afterapproval of the new vaccines in 1995, children born in 1995 received onedose at 10 years of age (c). In 1996, primary immunisation against pertussiswas reintroduced in the NIP, and infants received the aP vaccines (DTaP)at 3 and 5 months of age and an early booster at 12 months followed bya fourth dose (DTaP) at 10 years of age (d). The booster-dose in the NIPwas changed in 2007 with the fourth dose moved to preschool age and afifth dose (dTap) introduced at 14-16-years of age (teenage booster) (e). Inchildren born from 2002 the booster doses are administered at 5 years ofage and from 2016 at 14-16 years of age (e).
29
1.3.3 Vaccines used
Acellular pertussis containing vaccines during the first year oflife
In the beginning of 1996, when aP vaccine was introduced in the NIP, onlyone DTaP vaccine (Infanrix®, GlaxoSmithKline (GSK)) was used in all partsof Sweden except in the Gothenburg area. Infanrix®is a three-componentaP vaccine containing 25 µg (PT), 25 µg filamentous haemagglutinin (FHA),and 8 µg Pertactin (PRN), see also chapter 2.8.2. In the Gothenburg studyarea, a one-component DTaP vaccine containing 40 µg of PT (DiTeKik®,Statens Seruminstitut, Denmark) was used.
Starting in September 1998 and continuing through 1999, some counties inSweden switched to the first licensed combined pentavalent DTaP-Hib-IPVvaccine (Pentavac®, Sanofi Pasteur MSD), a two-component aP vaccinecontaining 25 µg PT and 25 µg FHA. From the year 2000, another pentavalentcombination vaccine (Infanrix-Polio+Hib®, GSK) was licensed and cameinto use. In Gothenburg and surrounding communities, an area covering11.4% of Swedish new-borns during the follow-up period, the Di-Te-Kik®vaccinewas used (Statens Serum Institut, SSI). In the year 2000 these communitiesswitched to Pentavac®. From 2000-2001, the vaccination programme inSweden has recommended the use of the pentavalent combination vaccines(DTaP-Hib-polio) for all infants.
Due to county-based procurements of vaccines, the use of the aP-containingvaccines within the NIP has varied over time and county, ranging from theinitial use of trivalent vaccines (DTaP) containing one or three pertussiscomponents to the later use of five or six-valent vaccines containing two orthree pertussis components.
In Sweden, vaccination against hepatitis B is recommended for infantsand children at risk, but it is not yet included in the NIP for all children.However, all counties have since 2016 offered hepatitis B vaccines to allchildren. According to information from GSK Sweden, based on the numberof sold doses of Infanrix®hexa related to annual birth cohorts (data fromStatistics Sweden, http://www.scb.se), 67% of all children are estimatedto have received Infanrix®hexa in January 2014 with corresponding ratesof 78% and 90% in January 2015 and December 2015, respectively. During2016, almost all counties used Infanrix®hexa, and more than 90% of thechildren are estimated to have received Infanrix®hexa.
30

Acellular pertussis containing booster vaccines after the firstyear of age
The booster dose in the NIP was changed in 2007 with the fourth dosemoved to preschool age and a fifth dose introduced at 14-16-years of age(teenage booster). In children born from 2002, the booster doses are administeredat 5–6 years of age and from 2016 at 14–16 years of age. Children born from1995 have received a DTaP vaccine as a booster at 10 years of age. This waschanged for children born from 2002 who were offered a DTaP vaccine at5–6 years of age. The two vaccines available are Infanrix-polio®, from GSK(diphtheria toxoid ≥30 IE, tetanus toxoid ≥40 IE, PT 25 µg, FHA 25 µg,PRN 8 µg and polio vaccine) and Tetravac® from Sanofi (diphtheria toxoid≥30 IE, tetanus toxoid ≥40 IE, PT 25 µg, FHA 25 µg and polio vaccine).A fifth booster dose with a reduced dose vaccine against diphtheria, andpertussis (dTap-vaccine) at 14–16-years of age, was introduced during 2016(diTekiBooster®, SSI).
Vaccines used in efficacy studies in Sweden: Trials I and II andthe Gothenburg area study.
Children in two randomized double-blind vaccine efficacy trials in Swedenperformed in 1992–1995 were vaccinated according to the following:
1. Trial I included 9,829 infants in 1992. They were vaccinated at 2, -4,and -6 months of age with a five-component DTaP vaccine (ConnaughtLaboratories Limited (CLL)), a two-component DTaP vaccine (GSK),or a DTwP vaccine (CLL) (Gustafsson 1996).
2. Trial II included 82,892 infants in 1993–1994. They were vaccinatedwith a five-component vaccine (CLL), a two-component vaccine(GSK), a three-component vaccine (Chiron), or a DTwP vaccine (Evans)(Olin 1997).
3. In the Gothenburg study area during the 1990s, infants were offeredvaccination with a vaccine containing diphtheria, tetanus, and pertussistoxoids (DTP-toxoids) at 3, 5, and 12 months of age. Children aged 1year were offered three doses of PT alone. Finally, for children whohad been incompletely vaccinated with wP vaccine or with otheraP vaccines, the vaccination series was completed with PT. Each0.5-mL dose of pertussis vaccine contained 40 µg of PT inactivatedby hydrogen peroxide. Each 0.5-mL dose of DTP-toxoids vaccinecontained 40 µg of PT. The PT vaccine was produced by North AmericanVaccine, and the diphtheria and tetanus toxoids were produced byStatens Seruminstitut (Trollfors 1995, Taranger 1997, Taranger 2001).
31

1.3.4 Vaccination coverage
In the pertussis vaccine studies (Trial I and Trial II) performed in the 1990s,a large proportion of Swedish children were enrolled. The largest study,Trial II, comprised 46.9% of the infants born in 1993, and 42.0% of thoseborn in 1994. The NIP with aP vaccine started in 1996, but 59.3% of thechildren born in 1995 were vaccinated in a catch-up programe (Table 4).
For several decades there has been a well-established CHC system in Swedenwith a 98–99% coverage of the vaccinations recommended in the NIP ininfancy. With the introduction of a DTaP vaccine, the three-dose coveragefor pertussis vaccination at 3, 5, and 12 months of age rapidly reached thislevel in 1996 (98.7%). The national vaccination coverage has remained atthe same level during the subsequent switch to multivalent combinationvaccines, including aP (Årsrapport 2016) (Table 4).
32

Year of birth aP coverage with 3 doses (%)
1993 46.91994 42.01995 59.31996 98.71997 98.61998 98.71999 98.52000 98.32001 98.42002 98.62003 98.72004 98.62005 98.32006 98.42007 98.02008 98.32009 98.32010 98.42011 98.22012 98.12013 97.5
Table 4: Vaccination coverage of three doses of vaccination with acellularpertussis containing vaccines for children born 1993 to 2013. The childrenshould have had their second birthday before the evaluation of coveragein January each year. At two years of age years 99.3-99.4% of the childrenwere vaccinated with three doses of DT vaccines.
1.4 Sample size considerations and the calculation of incidences
Formal a priori sample size calculations are not meaningful in a post-marketingfollow-up of the NIP and the observational studies included in this report.Age-specific incidence rates of pertussis cases per 100,000 person years arebased on the number of laboratory-confirmed reported pertussis casesduring the study period from Oct 1, 1997, to Dec 31, 2016. In addition,annual overall incidences and age-specific incidences of pertussis in Swedenare based on the number of notified culture-confirmed or PCR-confirmedcases of pertussis, and from 2008 also serology-confirmed cases, in thewhole population and in all age groups. Furthermore, annual incidencesare based on age at the notification of cases and on the corresponding
33

mid-year populations derived from the mean of population numbers intwo consecutive years divided by two http://www.scb.se).
To simplify the calculations of person time of follow-up, we assumed anequal number of new-born infants each month of a calendar year i.e. 7,212children per month during 1996 and 6,842 children per month during 1997.In addition, it was assumed that all children were born in the middle ofthe month and that vaccination took place according to the recommendedschedule, i.e. at 3, 5, and 12 months of age. Only person time since Oct 1,1997, was included because the collection of laboratory-confirmed cases ofpertussis started from that date. With these simplifications, we calculatedthe number of person months for each monthly cohort of new-borns in thefollowing age/vaccination-intervals:
• Person months from birth to 3 months of age (before dose 1).
• Person months between 3 and 5 months of age (between dose 1 anddose 2).
• Person months between 5 and 12 months of age (between dose 2 anddose 3).
• Person months after 12 months of age (after dose 3) until Dec 31,2016.
34

2 Results
2.1 Incidences and cases of pertussis in all age groups
2.1.1 Number and incidence of pertussis cases in 2016
In the present 19-year report, 647 labortory-confirmed cases of pertussiswere reported to SmiNet during 2016, and the greatest number of reportedcases was among infants younger than 1 year of age (n = 87).
In 2016, the incidences were still increased in all age groups comparedto 2009–2013, although a small decrease was seen in most age groupscompared to 2014, except for the 4, 7, 8, 9, 11, 12, 13, 14, 19, 40–44, and45–49 year age groups. As in previous years, infants had the highest incidencerate (74.1/100,000 person years) out of all age groups in 2016 comparedto 105.3/100,000 person years in 2014 and 73.4/100,000 person years in2015. Other age groups associated with high incidences in 2016 were the11, 13, and 17-year-old teenagers with incidence rates of 16.0/100,000,15.6/100,000, and 14.4/100,000 person years, respectively.
2.1.2 Incidence and cases over time
The overall annual incidence of pertussis during the period when no pertussisvaccine was included in the NIP (before 1996) reached more than 100cases/100,000 person years. Infant vaccination with aP vaccines was thusintroduced in an endemic setting. Since the introduction of aP vaccinationat 3, 5, and 12 months of age during 1996, there has been a dramatic declinein the overall pertussis incidence in the Swedish population (Figures 7-12and Tables 5 and 6). There was a rapid drop from 121/100,000 personyears in 1995–1997 to an overall annual incidence of 10–27/100,000 personyears in 1998–2001, with a further reduction to 6.7/100,000 person yearsand 2.3/100,000 person years in 2006 and 2013, respectively. The overallincidences have been 2.8, 2.7, 1.8, 2.8, and 2.3/100,000 person years in2009–2013, respectively (Table 6).These incidences are lower compared towhen the Swedish wP vaccine was still effective during the late 1960s andearly 1970s (9.4–12.2/100,000 person years).During 2014, 2015, and 2016, incidences were higher as mentioned earlier(7.1/100,000 person years, 5.9/100,000 person years, and 6.5/100,000 personyears, respectively).The decline in incidence after 1996 has been more rapid than when DTwPwas introduced during the 1950s. One explanation might be that vaccinationcoverage in those days was only gradually rising over decades until reaching90% of the infants, whereas the coverage for DT in the 1990s already wasmore than 98% and remained so after the reintroduction of pertussis vaccination
35

by adding aP to the DT vaccine.
Figure 7: Overall pertussis incidence in Sweden. Case reports fromgeneral practitioners until the mid-1980s, from lab-reports since 1980, andaccording to the Communicable Disease Act from 1997.
The annual incidence of laboratory-confirmed pertussis cases was around120–150/100,000 person years during 1989–1995, before the introductionof aP vaccines, with a peak in 1994 with 148/100,000 person years (Table 6and Figure 7). Peaks occurred every third winter: 1987–1988, 1990–1991(continuing into 1992), and 1993–1994 in the pre-vaccination period. Afterthe reintroduction of DTaP vaccine, the pattern of cyclic peaks every thirdyear changed, and there was a small peak at about 25/100,000 person yearsin the winter of 1999–2000 and thereafter additional minor peaks in 2002,2004–2005, and 2012.
After five years (2009–2013) with low incidence of reported cases of pertussis(2.5/100,000 person years on average), a significant three-fold increasein incidence was observed in the general population (7.1/100,000 personyears) in 2014 compared to 2013 (2.3/100,000 person years). This increasewas partly sustained during both 2015 (5.9/100,000 person years) and 2016(6.5/100,000 person years).
36

It is important to follow the number of reported cases on a monthly basisin order to detect potential seasonal patterns as well as the potential start ofan outbreak. In the first 6 months of 2014, about 2-5 infants with pertussiswere reported per month, whereas in the last 6 months of 2014, 10—26infants with pertussis per month were reported. From January to July in2016, 2—7 cases among infants were reported per month. The monthlycases later increased to 11—16 cases from August to December. The monthlynumber of reported cases in all ages showed a clear increase starting inAugust 2014, which lasted until February 2015 (66—156 reported cases eachmonth). Between March and July 2015, the monthly number of reportedcases decreased (31—41 reported cases per month). In 2015, the overallnumber of reported cases increased from August to October (53—69 reportedcases per month). Between January and July 2016, the monthly numberof reported cases decreased (18—-31 reported cases per month). FromAugust to December 2016, there was a clear increase (60—114 cases permonth), with the highest number of reported cases in December (114 casesper month), which might indicate a tendency for a seasonal pattern fromAugust to December that is easier to detect during years with high numbersof pertussis cases (Figure 8).
37

0
50
100
150
Year
Num
ber
of c
ases
per
mon
th
2004 2006 2008 2010 2012 2014 2016
Figure 8: Number of pertussis cases each month during 2004-2016 (allages). Data are based on laboratory-confirmed cases reported to SmiNet,according to the Communicable Disease Act.
2.1.3 Incidence and cases of pertussis, distributed by age andtime intervals
The peak age-specific incidence in the pre-1996 era was approximately1,600 cases/100,000 person years, and this occurred in children aged 2–4years. Pertussis incidence in the vaccinated cohorts born from 2009 wasbelow 10/100,000 person years (Table 6). However, the reduction of age-specificincidence was least marked in infants (Table 6). In this age group, incidencesvaried between 104 and 284/100,000 person years during the years 1997–2006.In 2006, the age-specific incidence in infancy was below 100/100,000 personyears for the first time since records started to be kept. In 2007, the incidencein infants was 85/100,000 person years, and from 2008 to 2013 the incidencein infants was stable at below 50/100,000 person years. In 2014, the incidencein infants increased by three-fold (105.3/100,000 person years) comparedto 2013 (34.3/100,000 person years), and the increased infant incidencecontinued, although at a slightly lower level, during 2015 (73.4/100,000
38

person years) and 2016 (74.1/100,000). There was no significant differencein infant incidence between 2015 and 2016 (p=0.83), but when comparing2015 and 2016 to 2014, respectively, the incidence was significant (2014 vs2015: p=0.004; 2014 vs 2016: p=0.002).The age-specific incidence for all reported cases in pre-school children (1–6years of age) dropped from >1,000/100,000 person years in the time periodbefore the aP vaccine was introduced to approximately 100/100,000 personyears in 1998–2000, to 50/100,000 person years in 2001, to approximately20/100,000 person years in 2003, and from 2009–2013 to fewer than 10/100,000person years. In 2014, 2015 and 2016, the incidence in pre-school childrenslightly increased while still remaining below 10/100,000 person years(9.6/100,000, and 7.4/100,000, 7.6/100,000 person years, respectively) (Table 6)In Figure 9, the incidences of pertussis from 1997 to Dec 31, 2016, are illustratedin the form of a heat map to help visualize the data in Table 6.
1990 1995 2000 2005 2010 2015
0
5
10
15
Age
0
500
1000
1500
Cas
es p
er y
ear
Figure 9: Illustration of incidences per age (1-year age groups) andcalendar year. Cases with episodes starting between 1997, and Dec 31,2016 were reported to SmiNet, according to the Communicable DiseaseAct. Data before 1997 are from voluntarily reports from bacteriologicallaboratories.
39

Age
1991
1992
1993
1994
1995
1996
1997
1998
1999
2000
2001
2002
2003
2004
2005
2006
2007
2008
2009
2010
2011
2012
2013
2014
2015
2016
011
9190
710
0781
590
654
817
093
165
219
115
217
112
285
154
9891
4743
4937
5139
121
8587
116
7914
8817
2517
8592
794
016
025
3476
3342
1953
2715
1817
102
25
519
97
219
8417
7820
4423
9317
4363
541
980
3236
3753
1950
1413
97
16
34
913
89
318
7216
3320
4721
4118
4313
2435
220
596
5229
378
3123
87
47
82
47
1211
114
1531
1336
1726
1960
1754
1415
654
157
294
155
2846
2050
2010
107
35
45
55
99
510
6197
812
1313
2912
6010
7460
824
418
828
147
5114
6726
2110
28
61
75
109
106
772
699
779
894
836
767
472
297
386
254
122
8625
7751
2225
84
53
65
86
87
391
337
447
464
432
432
289
175
313
345
9814
731
8355
2627
103
70
63
36
88
193
176
205
255
231
219
157
105
257
289
105
9245
105
5030
1912
66
02
37
88
911
010
614
011
714
213
264
5712
020
879
9934
8774
2428
245
93
52
87
1010
7274
5369
8172
5424
8313
143
7445
8610
323
1312
57
21
47
35
1150
3336
5538
3831
2239
6232
5843
7873
2810
13
32
13
1313
1812
1528
3533
2533
2419
4141
2436
2864
6428
155
14
10
27
1014
1317
1018
2319
135
1228
3014
2423
5146
3222
135
10
21
125
1714
1410
1314
710
96
2221
917
1344
2821
2519
112
21
07
1115
1510
710
1211
79
107
116
139
1225
1419
1323
106
77
1111
1016
85
67
96
46
711
210
1016
2014
1416
168
99
621
1114
176
27
25
32
47
141
63
99
413
1212
1013
73
1715
1518
66
29
30
34
47
06
19
69
76
94
67
710
147
198
33
45
46
02
52
13
29
74
24
31
55
139
1220
-24
4028
3251
2916
106
714
313
813
1210
1213
1211
1518
1350
3442
25-2
994
7395
113
6649
276
1614
78
1119
1616
1414
611
511
1240
3840
30-3
411
394
9913
575
6424
1215
2811
126
2421
118
139
116
2111
3633
3735
-39
5240
6190
5441
2310
1929
620
1033
3025
1819
1215
510
1647
4040
40-4
440
3235
5227
2120
48
148
118
1833
1529
197
165
1612
4540
4845
-49
1915
2423
287
73
87
110
27
2012
1812
58
49
723
3936
50-5
426
2028
2122
1812
72
44
93
812
1311
86
56
95
2623
2455
-59
2318
2529
2017
43
68
57
77
517
146
71
97
421
1417
60-6
432
1821
2228
1610
23
92
72
416
1714
106
85
75
1614
1465
+39
4439
7161
5221
914
142
1014
1526
2438
2211
1112
2617
6047
55Su
m11
468
9998
1197
512
988
1068
779
7336
5016
0722
2323
8987
512
2257
614
0710
6860
756
237
326
025
216
926
922
368
858
264
7
Tabl
e5:
Nu
mbe
rof
labo
rato
ry-r
epor
ted
case
sof
per
tuss
isin
defi
ned
age-
grou
ps
from
1991
toD
ec31
2016
For
labo
rato
ry-c
onfir
med
case
sre
port
edto
SmiN
etbe
twee
n19
97an
dD
ec31
,201
6.D
ata
befo
re19
97ar
efr
omvo
lunt
arily
repo
rts
from
bact
erio
logi
call
abor
ator
ies.
40

Age
1991
1992
1993
1994
1995
1996
1997
1998
1999
2000
2001
2002
2003
2004
2005
2006
2007
2008
2009
2010
2011
2012
2013
2014
2015
2016
096
3.0
737.
683
9.3
710.
784
2.6
553.
418
3.6
103.
718
5.8
244.
612
6.1
231.
211
4.7
284.
515
2.0
94.3
85.0
43.2
38.8
43.0
32.5
45.2
34.3
105.
373
.474
.11
1390
.811
96.6
1396
.714
84.2
806.
587
1.7
161.
126
.937
.784
.936
.545
.620
.053
.726
.714
.617
.115
.79.
11.
81.
74.
34.
416
.57.
75.
92
1718
.714
69.0
1639
.619
29.4
1446
.155
2.5
388.
680
.534
.339
.741
.158
.320
.552
.414
.112
.88.
76.
60.
95.
42.
73.
47.
711
.36.
97.
63
1695
.014
09.1
1684
.217
04.3
1478
.010
98.9
306.
519
0.0
96.4
55.5
31.8
40.9
8.7
33.3
24.0
8.0
6.8
3.8
6.5
7.3
1.8
3.5
6.0
10.2
9.4
9.3
414
43.6
1204
.714
82.6
1599
.213
88.5
1135
.354
3.2
136.
627
2.1
155.
129
.850
.222
.054
.421
.410
.49.
96.
82.
94.
63.
64.
54.
44.
27.
67.
65
1026
.091
8.6
1088
.711
31.5
1021
.784
9.9
487.
920
2.6
163.
425
9.3
46.8
54.0
15.2
73.3
28.2
22.4
10.3
2.0
7.7
5.7
0.9
6.3
4.4
8.6
7.5
8.3
677
4.1
672.
872
8.0
795.
170
7.1
621.
537
3.4
238.
132
0.0
220.
311
2.2
85.3
26.3
83.3
55.6
23.7
26.4
8.2
3.9
4.8
2.8
5.5
4.5
7.0
5.1
6.6
740
4.7
336.
442
8.2
429.
638
1.7
365.
123
4.0
138.
325
0.5
285.
384
.713
4.7
30.6
87.1
59.3
28.2
28.9
10.5
3.0
6.8
0.0
5.6
2.7
2.6
5.2
6.7
820
0.9
181.
320
3.5
242.
021
2.4
193.
313
2.5
84.9
202.
623
0.8
86.6
79.2
41.1
103.
452
.332
.220
.412
.76.
26.
10.
01.
92.
86.
37.
06.
89
113.
410
9.8
143.
411
5.0
133.
812
1.3
56.4
48.0
96.8
163.
662
.981
.329
.279
.172
.625
.029
.825
.65.
39.
33.
04.
81.
97.
36.
28.
610
72.8
75.9
54.6
70.0
79.1
67.8
49.5
21.1
69.8
105.
433
.758
.736
.873
.593
.422
.513
.412
.75.
37.
32.
01.
03.
86.
52.
74.
411
50.2
33.2
36.8
56.2
38.3
37.1
29.1
20.1
34.2
52.0
25.7
45.3
34.0
63.7
62.2
25.2
9.7
1.0
3.1
3.2
2.1
1.0
3.0
12.2
11.8
16.0
1215
.428
.035
.133
.425
.433
.223
.417
.837
.435
.920
.028
.821
.850
.452
.123
.813
.44.
81.
04.
21.
00.
02.
06.
89.
312
.613
17.5
10.2
17.9
22.9
19.1
13.2
5.0
11.7
26.2
27.3
12.2
20.0
18.3
39.6
36.2
25.9
18.6
11.6
4.8
1.0
0.0
2.1
1.0
11.9
4.8
15.6
1414
.010
.213
.213
.86.
910
.19.
16.
021
.319
.68.
214
.710
.834
.921
.716
.420
.115
.99.
71.
92.
01.
00.
07.
010
.814
.215
9.6
7.0
10.2
12.1
10.8
6.9
9.0
10.1
7.0
10.6
5.6
11.7
7.8
9.9
19.8
10.8
14.8
10.4
19.1
8.8
5.6
6.9
7.1
11.1
10.9
9.6
167.
34.
85.
97.
19.
05.
93.
96.
07.
011
.01.
99.
29.
013
.816
.511
.010
.712
.412
.76.
67.
88.
35.
820
.810
.913
.517
5.3
1.8
6.7
2.0
5.0
3.0
2.0
3.9
7.0
14.0
1.0
5.7
2.8
8.1
7.7
3.3
10.2
9.1
9.2
7.9
10.6
6.0
2.7
16.3
14.5
14.4
185.
35.
31.
88.
52.
90.
03.
03.
93.
97.
00.
05.
91.
08.
25.
37.
75.
74.
66.
83.
04.
75.
75.
99.
013
.16.
619
6.9
2.6
2.6
3.6
4.7
3.9
6.0
0.0
1.9
4.9
2.0
1.0
2.9
1.9
8.2
6.2
3.4
1.6
3.1
2.2
0.8
3.9
4.0
10.9
8.0
11.1
20-2
46.
74.
85.
58.
85.
02.
81.
81.
11.
32.
70.
62.
51.
52.
52.
31.
92.
22.
32.
01.
82.
32.
71.
97.
45.
16.
525
-29
15.0
11.4
14.6
17.6
10.5
8.0
4.5
1.0
2.7
2.4
1.2
1.4
2.0
3.4
2.9
2.9
2.5
2.5
1.1
1.9
0.8
1.8
1.9
6.2
5.7
5.7
30-3
419
.616
.317
.022
.512
.110
.03.
71.
82.
34.
41.
82.
01.
03.
93.
41.
81.
32.
21.
51.
91.
03.
61.
86.
05.
45.
935
-39
8.9
6.8
10.4
15.3
9.2
7.0
3.9
1.7
3.2
4.7
0.9
3.0
1.5
5.0
4.7
3.9
2.9
3.0
1.9
2.4
0.8
1.6
2.6
7.7
6.6
6.5
40-4
46.
25.
15.
78.
74.
63.
63.
40.
71.
42.
41.
41.
91.
43.
05.
32.
34.
42.
81.
02.
40.
82.
51.
97.
06.
17.
445
-49
3.0
2.3
3.6
3.4
4.3
1.1
1.1
0.5
1.3
1.2
0.2
1.7
0.3
1.2
3.4
2.1
3.1
2.0
0.8
1.3
0.6
1.3
1.0
3.4
5.9
5.4
50-5
45.
54.
15.
43.
83.
82.
91.
91.
10.
30.
60.
61.
50.
51.
42.
12.
21.
91.
41.
00.
91.
01.
50.
84.
33.
63.
755
-59
5.5
4.3
5.9
6.6
4.4
3.7
0.8
0.6
1.1
1.4
0.8
1.1
1.1
1.1
0.8
2.7
2.3
1.0
1.2
0.2
1.6
1.2
0.7
3.6
2.4
2.9
60-6
47.
64.
35.
15.
46.
94.
02.
50.
50.
72.
10.
41.
50.
40.
82.
92.
92.
31.
61.
01.
30.
81.
20.
92.
82.
52.
565
+2.
62.
92.
54.
64.
03.
41.
40.
60.
90.
90.
10.
70.
91.
01.
71.
52.
41.
40.
70.
60.
71.
40.
93.
22.
42.
8To
tal
133.
111
5.3
137.
414
7.9
121.
190
.241
.318
.225
.126
.99.
813
.76.
415
.611
.86.
76.
14.
02.
82.
71.
82.
82.
37.
15.
96.
5
Tabl
e6:
Inci
den
ceof
labo
rato
ry-r
epor
ted
case
sof
per
tuss
isin
defi
ned
age-
grou
ps
from
1991
toD
ec31
2016
For
labo
rato
ry-c
onfir
med
case
sre
port
edto
SmiN
etbe
twee
n19
97an
dD
ec31
,201
6.D
ata
befo
re19
97ar
efr
omvo
lunt
arily
repo
rts
from
bact
erio
logi
call
abor
ator
ies.
41

Incidence of pertussis in defined age-groups before and after theintroduction of DTaP vaccination
DTaP vaccine was introduced in 1996 into the NIP, and from 2007 a pre-schoolbooster was introduced. The incidences of pertussis for different age groupsduring 1997–2006 were much higher than during 2007-2016 for the correspondingage groups with the exception of the age group of 16-34 years (Figure 10).
1997−20062007−2016
Age (in years)
Inci
denc
e (p
er 1
00,0
00)
0
50
100
150
0 1 2 3 4 5 6 7 8 910 11 12 13 14 15 16 17 18 19
20−2
425
−29
30−3
435
−39
Figure 10: Mean incidence per 100,000 person years of pertussis in definedage groups during 1997-2006 (blue bars) and during 2007-2016 (redbars). Data are based on laboratory-confirmed cases reported to SmiNetaccording to the Communicable Disease Act.
Incidence of pertussis at 1-20 years of age presented in timeintervals
The incidence of pertussis from 1—20 years of age is presented in thischapter in 6- or 7-year intervals: 1997–2003, 2004–2010, and 2011–2016.Data collection was performed in the EPS, including these three data sets,
42

and presented both for Sweden excluding Gothenburg (Figures 11 A, B, D)and for the Gothenburg study area (Figures 11 C,E).Incidences from Oct 1, 1997, to Dec 2016 show a similar pattern in Swedenin both study areas. The incidence decreased from Oct 1, 1997, to Dec 31,2003, for the pre-school children, but in the next period of Jan 1, 2004, toDec 31, 2010, there was a higher incidence in 6-9 year-olds.
During the period of Oct 1, 1997, to 2003, there was a relatively high incidenceof pertussis in pre-school aged children (1–6 years of age, 13–21/100,000person years). During the next period, 2004–2010, a decreasing incidencewas seen in this age group (1–6 years of age, 10–16/100,000 person years),but a higher incidence in the first years in school (7–10 years of age, 18–28/100,000person years). During the period 2011-2016, the incidences in children upto 14 years of age were lower than the incidences in those 15-20 years ofage (Figures 11 D, E).
43

5 10 15 200
1020304050
Incidence Oct 1997−Dec 2003 in children older than one year of age Sweden excl. Gothenburg
●● ●
●
●●
● ● ● ●
A
Years of age
Cas
es p
er 1
00 0
00 p
erso
n ye
ars
5 10 15 200
1020304050
Incidence Jan 2004−Dec 2010 in children older than one year of age Sweden excl. Gothenburg
● ● ● ●●
●
● ●●
●
● ●● ● ●
B
Years of age
Cas
es p
er 1
00 0
00 p
erso
n ye
ars
5 10 15 200
1020304050
Incidence Jan 2004−Dec 2010 in children older than one year of age Sweden incl. Gothenburg
●● ●
●●
●
●
●
●
●
● ●● ● ●
C
Years of age
Cas
es p
er 1
00 0
00 p
erso
n ye
ars
5 10 15 200
1020304050
Incidence Jan 2011−Dec 2016 in children older than one year of age Sweden excl. Gothenburg
●●
●● ● ● ● ● ● ●
● ● ● ●●
● ●● ●
D
Years of age
Cas
es p
er 1
00 0
00 p
erso
n ye
ars
5 10 15 200
1020304050
Incidence Jan 2011−Dec 2016 in children older than one year of age Sweden incl. Gothenburg
● ● ●● ● ● ● ● ● ●
●● ● ●
●● ●
●●
E
Years of age
Cas
es p
er 1
00 0
00 p
erso
n ye
ars
Figure 11: Trend in the incidence of pertussis in those 0-20 years of ageduring 1997-2016 divided into three time intervals: Oct 1, 1997- Dec31, 2003; Jan 1, 2004- Dec 31, 2010; and Jan 1, 2011 - Dec 31, 2016. Datacollection was performed in the EPS with episodes starting between Oct, 1,1997, and Dec 31, 2016, including these three data sets and presented bothfor Sweden excluding the Gothenburg study area (Figures 11 A, B, D) andincluding the Gothenburg study area (Figures 11 C, E). Data are presentedon pertussis cases born from Jan 1, 1996 onwards.
44

Pertussis in fully vaccinated children 1-18 years of age
It is well known that immunity wanes after pertussis vaccination, but thereis limited information available about pertussis in fully vaccinated children.Therefore, the reported cases in the EPS study were analysed to identifypertussis in fully vaccinated individuals 1–18 years of age between 2007and 2016. The time period was set from 2007 as this corresponds to theyear where the booster dose in children aged 5-6 years was implemented.Fully vaccinated children were defined as children aged 1-5 years who hadreceived at least three doses of aP vaccine and children aged 6-18 yearswho had received at least four doses of aP vaccine. Children with onsetof pertussis less than 4 weeks after the last dose of pertussis vaccine wereexcluded.During the period 2007-2016, a total of 1,213 pertussis cases were reportedin children 1-18 years of age. Of these, 537 (44%) were fully vaccinated.Of the children included, the majority had laboratory-confirmed pertussis(Table 7).The proportion of children who were fully vaccinated in the different agegroups varied greatly, especially in the older age groups. In children aged1-5 years, the proportion of fully vaccinated varied between 60% and 73%,with the highest proportion in the 3 year olds. In the 6-18 year olds, theproportion of fully vaccinated varied between 12% and 55%. The 17-18year olds had the lowest proportion of fully vaccinated, 12%, but very fewcases were reported in this age group. The proportion of fully vaccinatedchildren considerably decreased when comparing the 5-year-old children(60%) to the 6-year-old children (22%) (Table 7).
45

Age/Agegroup
Number ofcases
Numberof fullyvaccinatedcases
Percentof fullyvaccinatedcases
Medianof diseaseduration(days)
Median ofdays withparoxysmalcough
mediannumber ofhospitalisationdays
1 81 51 63 48.5 32 0
2 71 45 63 44 31 0
3 77 56 73 55 45 0
4 69 45 65 56 42 0
5 60 36 60 43 32 0
6 79 17 22 50 42 0
7-9 233 58 25 53 33 0
10-13 230 127 55 59 47 0
14-16 196 88 45 63.5 53.5 0
17-18 117 14 12 60.5 52.5 0
Total 1213 537 44 - - -
Table 7: Number of reported pertussis cases with data on vaccinationstatus collected during the period 2007-2016. Data collection wasperformed in the EPS. Fully vaccinated children were defined as childrenaged 1-5 years who had received at least three doses of aP vaccine andchildren aged 6-18 years who had received at least four doses of aP vaccine.
Corresponding data for 2007-2015 published in the 18-year EPS reportshowed that out of all children 1-18 years of age, 32.4% were fully vaccinated,and in the 2-year-old age group 87% were fully vaccinated. Due to differencesin the proportion of fully vaccinated children, all data for this analysis havebeen re-evaluated and the methods have been improved. Therefore, datain the present 19-year EPS report are not comparable with the data forfully vaccinated children in the 18-year EPS report. More detailed data onpertussis in fully vaccinated children are described in Table 33 Appendix.
46

Incidences and cases of pertussis for -all age groups
The vaccinated birth cohorts born from 1996 had a lower age-specific incidenceof laboratory-confirmed pertussis in pre-school and early school age thanthe corresponding age groups prior to the implementation of aP vaccinationin 1996. The age-specific incidence for preschool children (exclusively0-–1 years) dropped from >1,000/100,000 person years to approximately100/100,000 person years in 1998–2000, to 50/100.000 in 2001, to approximately20/100,000 person years in 2003, and to fewer than 10/100,000 person yearsin 2009–2013.The incidences in 5–6-year-old children decreased after the introductionof the booster vaccine in 2007 (Figure 11). The effect of the booster at 5–6years of age introduced in 2007 was described in the Pertussis Surveillancereport for 2010 and was reported at the European Society for PaediatricInfectious Diseases (ESPID) meeting in 2010 (Rydevik, abstract 2010) (seealso chapter 2.8). The implementation of the booster at preschool agewas shown to have a strong effect, and the risk of pertussis decreased inchildren who had received the booster vaccination.The annual incidences decreased from Oct 1, 1997, to Dec 31, 2003, for thepre-school-aged children, but in the subsequent period of Jan 1, 2004, toDec 31, 2010, there was a higher incidence in 6–9 year olds. This increasewas not seen during the last interval of Jan 1, 2011, to Dec 31, 2016, likelydue to the 5–6 year booster that was incorporated in the vaccination schedulefrom 2007. The results are probably due to both a direct effect and anindirect effect (herd immunity) of the booster. From Jan 1, 2010, to Dec 31,2015, the incidence of pertussis increased significantly among 15—17 yearolds possibly due to waning immunity after the 10-year booster administeredin children born from 1995. In 2016, this increase levelled out, but if this isa result from booster vaccination of 14–16 year olds that started during2016 is too early to say.As in previous years, children who were younger than one year (infants)had the highest incidence in 2016 (74.1 cases/100,000 person years) (Figure12, Tables 5 and 6). In ages above 1 year, the number of cases is quite stablewith the exception of the years 2004, 2005, and 2008.
47

0 5 10 15
0
50
100
150
200
250
Age, in years
Num
ber
of c
ases
2004200520062007200820092010201120122013201420152016
Figure 12: Number of laboratory-confirmed pertussis cases,n 0-20 years ofage between 2004 and 2016 by age in years. Data collection was performedin the EPS
2.2 Pertussis in infants
There were 87 cases of laboratory-confirmed pertussis reported in infants(younger than 1 year of age) in 2016. As in previous years, the incidence ofpertussis was greatest among infants (74.1/100,000 person years), and thiswas a small increase in comparison with 2015 (73.4/100,000 person years)and a decrease compared to 2014 (105.3/100,000 person years).During the first 90 days of life, 37 infants had their first symptoms of pertussis,and another 23 infants had their first symptoms of pertussis before theywere 150 days of age, i.e. 60 of 87 (69%) of infants with pertussis contractedthe disease before 150 days of age (Figure 13). In 2016, infants had thehighest incidence of all age groups, and pertussis remains a serious andlife-threatening disease for infants, especially for the youngest. Therefore,the analysis and presentation in this report focus on data from cases ofpertussis reported in infants. In infants, markers of severity in relation toage at onset of disease and to individual vaccination history as well as to
48

scheduled ages of the NIP were evaluated.
2.2.1 Number of pertussis cases in 2016 in infancy by vaccinationstatus
In 2016, 43% of the pertussis cases in infants were infected within thefirst 90 days of age, and all of these cases were unvaccinated infants. In2015, 48% of the cases were infected within the first 90 days (p = 0.55 forcomparing 2016 and 2015). The number of cases reported in 2016 in unvaccinatedand vaccinated infants (one dose or more) for different ages (in days) isdisplayed in Figure 13. In 2016, 38 (44%) of all infants reported with pertussishad been vaccinated with at least one dose, which is slightly more than the34 cases (41%) reported in 2015.
0−30 days 91−120 days 181−210 days 271−300 days
Age in days
Num
ber
of c
ases
0
5
10
15
20Not vaccinatedVaccinated
Figure 13: Number of reported pertussis cases in infancy in 2016 byvaccination status (not vaccinated or vaccinated with at least one dose of aPvaccine) and age (days). Data are from case reports of pertussis, reportedto SmiNet, according to the Communicable Disease Act and controlled forvaccination status in the EPS.
49

2.2.2 Timing of vaccinations
The vaccination schedule according to the NIP is dose 1 at 3 months (90days), dose 2 at 5 months (150 days), and dose 3 at 12 months (365 days) ofage. In 2016, the median time between birth and the first vaccination was93 days for pertussis cases. The consistency in adhering to the recommendedNIP, from laboratory-confirmed case reports of pertussis with episodesstarting between Oct 1, 1997, and Dec 31, 2016, is illustrated in Figure14, and this shows only small deviations from scheduled day (Day 0) foradministration of the first three doses of aP vaccine. The median timeof actual vaccination was 3, 17, and 7 days after the recommended datefor dose 1, 2, and 3, respectively. The timeliness of the first dose of DTaPvaccine administration among infants who became infected with pertussiswas similar in 2016 compared to the median timeliness over the entirestudy period of 1997–2016.
50

−40 −20 0 20 40
0.0
0.2
0.4
0.6
0.8
1.0
Time difference in days compared with scheduled vaccination date
Cum
ulat
ive
prop
ortio
n va
ccin
ated
97%
91%
Dose 1 (n= 3157 ) Dose 2 (n= 2606 ) Dose 3 (n= 2198 )
Figure 14: Cumulative proportion of vaccinated children for the first threedoses of aP vaccination comparing actual vaccination dates with scheduledvaccination dates. Scheduled dates for doses 1, 2 and 3 are 3, 5, and 12months of age, respectively. Data are from laboratory-confirmed casereports of pertussis with episodes starting between Oct 1, 1997, and Dec31, 2016. Data collection was performed in the EPS.
2.2.3 Incidence and cases of pertussis among the 0–20 years ofage, distribution by age and vaccination status
A substantial proportion of pertussis cases reported in Sweden in theEPS study are in unvaccinated children who are too young to be fullyvaccinated with three doses of aP vaccine at 3, 5, and 12 months of age(90, 120, and 365 days of age) according to the NIP. The median ages ofpertussis cases with none, one, or two vaccinations were 97, 129, and 272days, respectively (Table 8). In contrast, for children who had receivedthree doses of aP vaccine during their first year of life, the median age foronset of pertussis was 2161 days (5.9 years of age) (range = 360, 8134 days).
51

Doses beforeepisode ofpertussis
Median age indays at onset ofpertussis
Cases in theGothenburgstudy area (n)
Cases inSwedenexcluding theGothenburgstudy area (n)
0 97 245 13831 129 145 4032 272 209 2013 2161 723 1473
Table 8: Median age in days at the onset of pertussis and the number ofaP vaccination doses prior to the onset of pertussis. Data collection wasperformed in the EPS, with episodes starting between Oct 1, 1997, and Dec31, 2016, and from 2003 in the Gothenburg study area. Data are presentedfor pertussis cases 0–20 years of age.
The proportion of pertussis cases in unvaccinated children during infancyand in pertussis cases 1-20 years of age in the EPS study is shown in Table9. Seventy-four per cent of the unvaccinated pertussis cases were less than1 year of age, and 63% were infants younger than 3 months of age.
Age Number of cases Per cent of cases (by age groups)
0-30 days 267 17.631-60 days 360 23.761-90 days 322 21.291-120 days 101 6.7121-150 days 28 1.8151-180 days 13 0.9180-365 days 39 2.6>365 days 388 25.6
Table 9: Age (days) at episode start for ,1518 unvaccinated cases withpertussis. Data collection was performed in the EPS, with episodes startingbetween Oct 1, 1997, and Dec 31, 2016. Data are presented for pertussiscases 0-20 years of age.
52
2.2.4 Incidence of pertussis in infancy by date and after changesto the national immunisation programme
The age-specific incidence among infants was around 700–800/100,000person years during the 10-year period prior to 1996 (Figure 15 and correspondingTable 6 and Table 16 Appendix). The incidence decreased rapidly after theintroduction of pertussis vaccination and oscillated around 200/100,000person years from 1996 to 2005, after which time the incidence decreasedfurther. This decrease could be due to the new vaccination schedule thatincluded preschool booster vaccinations for children born in 2002 anda booster vaccination at 10 years of age leading to a higher proportionof vaccinated children in the population during 2007–2012. In 2016, theincidence of pertussis in infants was 74.1/100,000 person years, and thiswas a decrease in comparison with 2014 (105.3/100,000 person years) andan increase in comparison to 2015 (73.4/100,000 person years), but thisincrease was not significant. In 2015 the incidence was more than threefoldgreater than the incidence in 2013 (p = 0.002) and slightly higher than thehighest incidence in 2005, which was when the vaccine booster in 10 yearolds was introduced.
53

1986 1989 1992 1995 1998 2001 2004 2007 2010 2013 2016
Year
Inci
denc
e (p
er 1
00,0
00)
0
200
400
600
800
1000
1200
Onset of aP−vaccine in infancy Jan 1, 1996
Booster at 10 years of age in 2005
Booster at 5.5 years of age in 2007
Figure 15: Incidence of pertussis in infants younger than 1 year ofage by year. Changes in the NIP are indicated. Data are from casereports of pertussis reported to SmiNet in 1997-2016 according to theCommunicable Disease Act. Data before 1997 are from voluntarily reportsfrom bacteriological laboratories
The decline in the incidence among infants after 1996 is to a large extentexplained by decreasing number of infant cases from the age of 5–12 months,i.e. from the scheduled age of the second dose of DTaP. The mean numberof infants with laboratory-reported pertussis per age (in months) duringinfancy is illustrated in Figure 16, and data are shown for the 10 yearsbefore and the 20 years after the introduction of aP vaccination in infancy.Most cases were reported in the youngest birth cohort in each calendarperiod, with a marked decline at about 5 months of age.
54

1986−19951997−2016
Age (in months)
Inci
denc
e (p
er 1
00,0
00)
0
200
400
600
800
1000
1200
14000 1 2 3 4 5 6 7 8 9
10 11
Figure 16: Mean incidence (per 100,000 person years) of pertussis in infantsin defined age groups during the 10 calendar years before (1986-1995)and during the 20 years after (1997-2016) the introduction of DTaP in1996. Before 1997, data are from voluntarily reports from bacteriologicallaboratories, and after 1997 the data are from case reports of pertussisreported to SmiNet according to the Communicable Disease Act.
2.2.5 Incidence of pertussis during and after the first year oflife presented in time intervals
The incidence of pertussis during and after the first year of life is presentedin this chapter in 6- or 7-year time intervals: 1997–2003, 2004–2010, and2011–2016 (Figures 17 A-E). Data collection was performed in the EPSstudy, including these three data sets and presented both for Sweden excludingGothenburg (Figures 17 A, B, and D) and including the Gothenburg studyarea (Figures 17 C and E).
In 1997–2003, high incidences of pertussis were observed in infants 0–90and 91–150 days of age. These levels decreased, however, for the subsequentperiod (2004–2010). Earlier reports evaluating the time period 2009–2013
55

showed a decrease in this time period, but when including the increasedincidences of the three years of 2014, 2015, and 2016 the incidences are atthe same levels for the youngest children when comparing the time periods2004–2010 and 2011–2016.
0
100
200
300
400
Incidence Oct 1997−Dec 2003 in Sweden excl. Gothenburg
● ●
●
●
239 248
5913
0−90 91−150 151−365 >365
A
Days of age
Cas
es p
er 1
00 0
00 p
erso
n ye
ars
0
100
200
300
400
Incidence Jan 2004−Dec 2010 in Sweden excl. Gothenburg
●
●
● ●
13796
18 10
0−90 91−150 151−365 >365
B
Days of age
Cas
es p
er 1
00 0
00 p
erso
n ye
ars
0
100
200
300
400
Incidence Jan 2004−Dec 2010 in Sweden incl. Gothenburg
●
●
●●
151110
31 13
0−90 91−150 151−365 >365
C
Days of age
Cas
es p
er 1
00 0
00 p
erso
n ye
ars
0
100
200
300
400
Incidence Jan 2011−Dec 2016 in Sweden excl. Gothenburg
●
●
● ●
169113
21 9
0−90 91−150 151−365 >365
D
Days of age
Cas
es p
er 1
00 0
00 p
erso
n ye
ars
0
100
200
300
400
Incidence Jan 2011−Dec 2016 in Sweden incl. Gothenburg
●
●
●●
167111
22 8
0−90 91−150 151−365 >365
E
Days of age
Cas
es p
er 1
00 0
00 p
erso
n ye
ars
Figure 17: Incidence of pertussis (point estimates and 95% confidenceintervals) during and after 1 year of age presented in three time intervals.Data collection was performed in the EPS with episodes starting betweenOct 1, 1997, and 2016. Days of age are the age at episode start.
Pertussis in infants in different years and in relation to other agegroups
Figure 18 shows the incidence for infants younger than 1 year of age. Comparedto 1996 when the aP vaccine was introduced, there has been a decreasein the total number of infant pertussis cases, but the age-specific patternremains with most infant cases occurring in the age group 0–5 months.
56

0 2 4 6 8 10 12
0
10
20
30
40
Age, in months
Num
ber
of c
ases
2004200520062007200820092010201120122013201420152016
Figure 18: Number of laboratory-confirmed pertussis cases in infantsbetween 2004 and 2016 , by age in months. Data collection was performedin the EPS of pertussis.
The relative importance of the first year in regard to incidence rates isshown in Figure 19. Pertussis in infancy accounts for 70–80% of all casesduring the first 4 years of life, as reported to SmiNet according to theCommunicable Disease Act.
57

2000 2005 2010 2015
0
20
40
60
80
100
Year
% o
f the
tota
l num
ber
of c
ases
in e
ach
age
grou
p
0 years old1 year old2 years old3 years old
Figure 19: Per cent of cases in ages 0–4 years old (new-born up to the 4thbirthday). Data are from case reports of pertussis reported to SmiNet,according to the Communicable Disease Act with episodes startingbetween 1997 and Dec 31 2016.
2.3 Severity of pertussis in infants
In the following sections (2.3.1–2.3.4), the data are presented for age-specificcomplication and hospitalisation rates in vaccinated (one dose or more)and unvaccinated infants, with information on length of hospital stay andthe relation between early or delayed onset of antibiotic treatment and theduration of cough in infants. In the EPS study, data on the first day withsymptoms are collected and described as the age at episode start.In 2016, there were higher numbers of reported infant cases having hadcomplications due to pertussis as compared to 2015 and to 2014. In total,50 (60%) of the infant cases in 2016 and 29 (35%) of the infant cases in 2015reported having complications. During the period from Jan 1, 2003, to Dec31, 2016, the age-specific incidence of any complication due to pertussiswas highest in children 0–<3 months of age at 81 and 70/100,000 personyears from the Gothenburg study area and the rest of Sweden, respectively
58

(Table 9). The incidence decreased thereafter to 2 and 1/100,000 personyears, respectively, for children above 1 year of age at the first pertussisepisode.
More detailed analyses of the data on the severity of pertussis disease andseparately for the geographic study areas and for different time periods arepresented in the appendix.
All pertussis cases 21 days of cough Hospital admission Complication
Age groups(month)
Gothenburg Rest ofSweden
Gothenburg Rest ofSweden
Gothenburg Rest ofSweden
Gothenburg Rest ofSweden
0-<3 265 160 174 142 141 117 81 70(217-321) (147-174) (135-220) (130-155) (107-183) (106-129) (55-114) (62-80)
3-<5 213 111 110 97 30 46 38 25(161-276) (98-126) (74-158) (85-111) (13-60) (38-56) (18-70) (19-32)
5-<12 113 20 48 15 2 3 8 3(93-137) (17-23) (35-64) (13-18) (0-8) (2-5) (3-16) (2-4)
+12 24 10 15 7 0 0 2 1(22-27) (9-10) (13-17) (7-8) (0-1) (0-0) (1-3) (1-1)
Table 10: Incidence of pertussis in relation to severity and age. Incidenceper 100,000 person years (95% CI). Incidences are presented for all reportedcases with pertussis, reported cases of pertussis with paroxysmal cough for21 days or more, hospital admissions due to pertussis and complicationsdue to pertussis. Data collection was performed in the EPS with episodesstarting between Jan 01 2003, and Dec 31 2016. Data are presented forpertussis cases 0-20 years of age.
2.3.1 Hospitalization
In 2016, 44 (51%) infants with pertussis were hospitalized and the correspondingnumbers were 43 (51%) in 2015 and 67 (55%) in 2014.
Accumulated data from 2003 on hospitalisation, defined as at least onenight in the hospital due to pertussis disease during the episode, wereavailable for 3,248 of 3,446 (94%) children in the EPS from Jan 1, 2003, toDec 31, 2016 (Figure 20 and Figure 5 Appendix). Altogether 638 of thechildren (20%) were admitted to the hospital during the pertussis episode(Table 11).
The rate of hospital admission for cases with pertussis by age
In the EPS study (Jan 1, 2003, to Dec 31, 2016), a total of 460 of 654 infants(70%) who were younger than 90 days of age at the start of the pertussis
59

episode were admitted to the hospital. The corresponding admission rates,regardless of vaccination status at the start of the episode, for the 310children in the age group 91—150 days of age, for the 263 children in theage group 151—365 days of age, and for the 2,021 children older than 365days of age at episode start were 37%, 11%, and 2%, respectively (Table 11).
Age at episode start (days)
Area 0-90 91-150 151-365 >365 Sum
Sweden excluding 404/549 106/254 26/159 30/1580 566/2542Gothenburg (74%) (42%) (16%) (2%) (22%)
Gothenburg 56/105 8/56 2/104 6/441 72/706(53%) (14%) (2%) (1%) (10%)
Total 460/654 114/310 28/263 36/2021 638/3248(70%) (37%) (11%) (2%) (20%)
Table 11: Hospital admissions by age at episode start (number and percent) in the Gothenburg study area compared with the rest of Sweden.Data collection was performed in the EPS with episodes starting betweenJan 01 2003, and Dec 31 2016. Data are presented for pertussis cases 0–20years of age.
Hospital admission by age and vaccination status
The rate of hospital admission among unvaccinated children aged 0—30days, 31—60 days, and 61—90 days at the beginning of the pertussis episodewas 83%, 71%, and 59% respectively, which dropped to only 2% for fullyvaccinated pertussis cases older than 1 year of age. For unvaccinated children91—150 days of age and 151—365 days of age, the rates of hospital admissionwere still 46% and 19%, respectively. The hospitalisation rate for vaccinated(one dose or more) children younger than 1 year of age was lower whencompared with those for the unvaccinated children (Table 12 and Figure 3Appendix). The downward trend by age was also observed for vaccinatedchildren, both for children vaccinated with only one dose and for childrenwho had received two or more vaccine doses before the pertussis episode.The majority of unvaccinated infants younger than 30 days of age werehospitalised for more than 7 days (Table 12).
60

Age at episode start (days)
Vaccinedosesbeforeepisode
Durationofhospitalstay
0-30 31-60 61-90 91-150 151-365 >365 Sum
0 0 32 71 87 36 26 404 656(16.6%) (29%) (41.4%) (53.7%) (81.2%) (98.3%)
1-7 65 95 82 20 5 6 273(33.7%) (38.8%) (39%) (29.9%) (15.6%) (1.5%)
>7 96 79 41 11 1 1 229(49.7%) (32.2%) (19.5%) (16.4%) (3.1%) (0.2%)
Sum 193 245 210 67 32 411 1158
1 0 4 159 44 12 219(66.7%) (65.7%) (89.8%) (92.3%)
1-7 1 64 3 1 69(16.7%) (26.4%) (6.1%) (7.7%)
>7 1 19 2 0 22(16.7%) (7.9%) (4.1%) (0%)
Sum 6 242 49 13 310
>1 0 1 165 1569 1735(100%) (90.7%) (98.2%)
1-7 16 24 40(0%) (8.8%) (1.5%)
>7 1 4 5(0%) (0.5%) (0.3%)
Sum 1 182 1597 1780
Table 12: Number of children admitted to the hospital due to pertussis,stratified by age and vaccination status at episode start. Data collection wasperformed in the EPS with episodeS starting between Jan 01 2003, and Dec31 2016. Data are presented for pertussis cases 0-20 years of age.
2.3.2 Complications due to pertussis
Data on respiratory complications, neurological complications, dehydrationwith >5% of weight loss, and other serious complications during the pertussisepisode were registered in the EPS study for 3,116 of the 3,248 cases (96%)born Jan 1, 1996, until Dec 31, 2016, with vaccination and follow-up informationfrom Jan 1, 2003, for all of Sweden. For the time period 2003–2016, respiratorycomplication (with apnoea, n = 224, or without apnoea, n = 217) was reportedin 441 (14%) of the children, and dehydration was reported in 94 (3%) ofthe children. Uncommon complications, ge. neurological and other seriouscomplications, were reported in 12 (0.4%) children (Table 13).
Altogether, almost all of the children with respiratory complications withapnoea were admitted to the hospital. The majority of the children withdehydration were also hospitalised (Table 13). For data from Sweden withoutthe Gothenburg study area and for data from the Gothenburg study areafrom 2003, see Table 22 Appendix and Table 23 Appendix.
61

Complication type Hospitalised Not hospitalised Total
Respiratory, with apnoea 204 (91%) 20 (9%) 224Respiratory, without apnoea 81 (37%) 136 (63%) 217Dehydration 58 (62%) 36 (38%) 94Other severe events 8 (67%) 4 (33%) 12No complication 285 (11%) 2284 (89%) 2569Sum 636 (20%) 2480 (80%) 3116
Table 13: Complications and hospitalizations in children with pertussis.Data collection was performed in the EPS with episodes starting betweenJan 01 2003 and Dec 31 2016. Data are presented for pertussis cases 0-20years of age.
The rate of complications due to pertussis by age
To analyse the association between complications during the pertussisepisode and age and/or vaccination status of the child at the start of theepisode, the subjects were grouped into those without any complicationduring the pertussis episode and those with at least one noted complication.
Of the 641 children who were younger than 90 days of age at the beginningof the pertussis episode, 43% (n = 273) had at least one complication. Thecorresponding rates for the 301 children in the age group of 91–150 daysof age, for the 254 children in the age group of 151–365 months, and forthe 1,920 children aged 365 days or older at the beginning of the pertussisepisode were lower (Table 14).
Age at episode start (days)
Area 0-90 91-150 151-365 >365 Total
Sweden excluding 242/537 57/245 20/153 146/1487 465/2422Gothenburg (45%) (23%) (13%) (10%) (19%)
Gothenburg 32/104 10/56 7/101 33/433 82/694(31%) (18%) (7%) (8%) (12%)
Total 274/641 67/301 27/254 179/1920 547/3116(43%) (22%) (11%) (9%) (18%)
Table 14: Numbers and proportions of children with at least onecomplication due to pertussis, by age at onset of disease. Data collectionwas performed in the EPS with episodes starting between Jan 01 2003, andDec 31 2016. Data are presented for pertussis cases 0-20 years of age.
62

Complications in relation to age and vaccination status at thestart of the pertussis episode
The events including "any complication" were studied in relation to ageas well as to vaccination status at the beginning of the pertussis episode.Detailed data are given in Table 15 and Figure 6 Appendix.
During the studied period 2003-2016, the overall rate of any complicationfor unvaccinated children was 31% (320/1,041). For unvaccinated childrenaged 0–30 days, 31-60 days, and 61–90 days at the beginning of the pertussisepisode, the complication rates were 56.4%, 38.2%, and 34.5%, respectively.For unvaccinated children between 91–150 days of age and 151–365 days ofage, the rates of any complication were 27.9% and 21.4%, respectively, anddropped to 8.8% for children above 1 year of age (Table 15).
Age at episode start (days)
Vaccinedosesbeforeepisode
Complicationsafter episode
0-30 31-60 61-90 91-150 151-365 >365 Sum
0 No 81 149 135 44 22 289 720(43.1%) (61.8%) (65.5%) (72.1%) (78.6%) (91.2%)
Yes 107 92 71 17 6 28 321(56.9%) (38.2%) (34.5%) (27.9%) (21.4%) (8.8%)
Sum 188 241 206 61 28 317 1041
1 No 2 189 44 11 246(33.3%) (79.1%) (89.8%) (84.6%)
Yes 4 50 5 2 61(66.7%) (20.9%) (10.2%) (15.4%)
Sum 6 239 49 13 307
>1 No 1 161 1441 1603(100%) (91%) (90.6%)
Yes 16 149 165(0%) (9%) (9.4%)
Sum 1 177 1590 1768
Table 15: The numbers and proportions of children with no or at leastone complication stratified by age and vaccination status at the start ofthe pertussis episode. Data collection was performed in the EPS, withepisodes starting between Jan 01 2003 and Dec 31 2016. Data are presentedfor pertussis cases 0-20 years of age
2.3.3 Spasmodic cough
Cases of spasmodic cough due to pertussis
Data on cough and spasmodic cough were available for all 3,248 pertussiscases from Jan 31, 2003, to Dec 31, 2016. Altogether 2,618 (80.6%) of the
63

children had at least one day of spasmodic cough during the pertussisepisode. Spasmodic cough for 21 days or more during the pertussis episodewas reported for 75% of the children. The rates for different age groupsvaried between 63% and 85%, with the lowest incidence in children aged151–365 days. During the study period 2003–2016, the rate for infants withspasmodic cough lasting 21 days or longer was 80% (976/1,227) (Table 16).For just 2016, the rate was 85% (74/87), and the youngest infants had thehighest rate of long-lasting spasmodic cough.
Age at episode start (days)
Area 0-90 91-150 151-365 >365 Total
Sweden excluding 489/549 222/254 123/159 1188/1580 2022/2542Gothenburg (89%) (87%) (77%) (75%) (80%)
Gothenburg 69/105 29/56 44/104 272/441 414/706(66%) (52%) (42%) (62%) (59%)
Total 558/654 251/310 167/263 1460/2021 2436/3248(85%) (81%) (63%) (72%) (75%)
Table 16: Numbers and proportions of children with spasmodic coughfor 21 days or longer, stratified by age at onset of pertussis disease, inGothenburg and the rest of Sweden. Data collection was performed in theSwedish enhanced surveillance, with episodes starting between Jan 01 2003and Dec 31 2016. Data are presented for pertussis cases 0-20 years of age.
Duration of spasmodic cough by age and vaccination status atepisode start
Regardless of age, of those children who were vaccinated but still contractedpertussis the rate of spasmodic cough for 21 days or more among thosevaccinated with one dose was 82% (253/310), and among those vaccinatedwith two or more doses the rate was 71% (1,265/1,780) (Table 17). Thisreduction in the rate of spasmodic cough by the number of doses of pertussisvaccine before the episode start was statistically significant (p < 0.001).
64

Age at episode start (days)
Vaccinedosesbefore theepisodestart
Durationofspasmodiccough(days)
0-30 31-60 61-90 91-150 151-365 >365 Total
0 0 21 19 23 10 6 115 194(10.9%) (7.8%) (11%) (14.9%) (18.8%) (28%)
1-20 8 17 8 6 0 7 46(4.1%) (6.9%) (3.8%) (9%) (0%) (1.7%)
>20 164 209 179 51 26 289 918(85%) (85.3%) (85.2%) (76.1%) (81.2%) (70.3%)
Sum 193 245 210 67 32 411 1158
1 0 0 25 7 1 33(0%) (10.3%) (14.3%) (7.7%)
1-20 0 17 7 0 24(0%) (7%) (14.3%) (0%)
>20 6 200 35 12 253(100%) (82.6%) (71.4%) (92.3%)
Sum 6 242 49 13 310
>1 0 52 351 403(0%) (28.6%) (22%)
1-20 1 24 87 112(100%) (13.2%) (5.4%)
>20 106 1159 1265(0%) (58.2%) (72.6%)
Sum 1 182 1597 1780
Table 17: Duration of spasmodic cough, stratified by age and vaccinationstatus at episode start. Data collection was performed in the EPS withepisodes starting between Jan 01 2003 and Dec 31 2016. Data are presentedfor pertussis cases 0-20 years of age.
In a complementary analysis, we compared any complication among unvaccinatedchildren with pertussis aged 3 and 12 months at the beginning of thepertussis episode with the same aged children with pertussis but who hadbeen given one dose of a pertussis vaccine before the start of the pertussisepisode. The following results are highlighted:
1. The median (mean) age at start of an episode was 114 (149) days forunvaccinated children and 125 (131) days for children vaccinated withone dose before the episode.
2. Overall 30% of the unvaccinated children aged 3-12 months and 20%of the children vaccinated with only one dose had a complicationduring the pertussis episode. This difference was statistically significant(p=0.034).
It can be concluded that in unvaccinated children there was a strong associationbetween age at the beginning of the pertussis episode and the risk of acomplication due to the disease. In vaccinated children, there was also an
65

inverse association between vaccination status, i.e. the greater the numberof vaccine doses before the episode of pertussis, the lower the risk of anycomplication.
As could be expected, there was also a strong association between anycomplication and a hospital stay during the pertussis episode. Altogether,56% (493 out of 877) of the children with at least one complication also hada hospital admission due to the disease during the pertussis episode. For3,426 children with pertussis without any complication, the hospitalizationrate was 12% (p < 0.001).
2.3.4 Deaths
During the 19-year study period, there were 12 deaths due to pertussisamong unvaccinated infants and one death in a vaccinated 2-year-old childwith severe underlying disease. The parents of these children were notcontacted within the project, and only limited information, which wasobtained from medical personnel, is available for these cases. Eight infantswere full term and four were born before gestational week 37. Ages atdeath were from 3 weeks to 3 months for the full term infants and from 3to 6 months for the premature infants. The one that died at 6 months fell illwith pertussis at about 3–4 months of age.
In conclusion: Severity of pertussis in infants
The data in the EPS showed that the incidences for hospital admissionsdue to pertussis were highest for the youngest infants (Figure 20 see alsoTable 10 for the Gothenburg study area and Sweden without the Gothenburgstudy area).
66

0
20
40
60
80
100
120
Days of age
Cas
es p
er 1
00 0
00 p
erso
n ye
ars
●
●
●●
0−90days 91−150days 151−365days >365days
119.9
44.7
3.2 0.2
Figure 20: Incidence of hospital admission per 100,000 person years due topertussis stratified by age at episode start. Data collection was performedin the EPS of pertussis, with episodes starting between Jan 1, 2003, and Dec31, 2016. Data are presented pertussis cases among those 0-20 years of age.
The age-specific incidence rate of hospitalisation due to pertussis washighest for children 0—90 days of age. The incidence decreased with increasingage to less than 1/100,000 person years for children older than 1 year ofage at the start of the pertussis episode. Although fewer children werehospitalised in 2016 (n = 44) and in 2015 (n = 43) compared with 2014 (n =67), the hospitalisation rate did not differ to a large extent at 55% in 2014vs. 51% in both 2015 and in 2016.
The overall rate of hospital admission for unvaccinated children was 43%for the study period of Jan 1, 2003, to Dec 31, 2016. However, in this group,91% were younger than 3 months of age and too young to be vaccinated.Regardless of age, the rate of hospitalisation for children vaccinated withone dose was 29%. For children vaccinated with two or more doses beforethe pertussis episode, 2.5% were hospitalised. This association between rateof hospital admission and vaccination status was confounded by age. Forexample, for children 12 months of age the rate of hospital admission was
67

low and independent of the vaccination status of the child.
With regard to any complication in unvaccinated children, there was anassociation between the rate of complication and the age of the child atthe beginning of the pertussis episode. Regardless of age, the rate of anycomplication for children vaccinated with one dose was 20% and for childrenvaccinated with two or more doses before the pertussis episode the ratewas 9% (p = 0.006). This statistically significant difference was confoundedby age. For children older than 12 months, the rate of any complicationwas about 9% for unvaccinated children and 9% for children vaccinatedwith two or more doses. In the age interval 5–<12 months, the complicationrate was 21% for unvaccinated children, 10% for children vaccinated withone dose, and 11% for those vaccinated with two or more doses prior tothe episode. This downward "trend" in rate by number of doses prior tothe pertussis episode was statistically significant (p < 0.001). These resultssuggest that there was some protection against "severe" pertussis, whichwas defined as any complication due to the disease, already after one doseof a pertussis vaccine. This finding was further evaluated in a paper fromthe PHAS (Nilsson 2012).
In all, 591 of 654 infants (90%) who were younger than 90 days of age atthe start of the pertussis episode had spasmodic cough, and for 558/654(85%) the cough lasted for 21 days or longer. The corresponding rates forthe 310 children in the age group of 91–150 days of age, for the 263 childrenin the age group 151–365 days, and for the 263 children aged 12 monthsor older were 81%, 63%, and 72%, respectively. The age-specific incidencerate of pertussis with spasmodic cough for 21 days or more was highestin children 0–90 days of age (356/100,000 person years) and decreased to44/100,000 person years for children older than 1 year of age at the start ofthe pertussis episode.
It can be concluded that there was a strong association between age at thebeginning of the pertussis episode and the risk of a complication due tothe disease for an unvaccinated child. In vaccinated children there was aninverse association between vaccination status, i.e. the number of vaccinedoses, before the start of the episode and the risk of any complication.
68
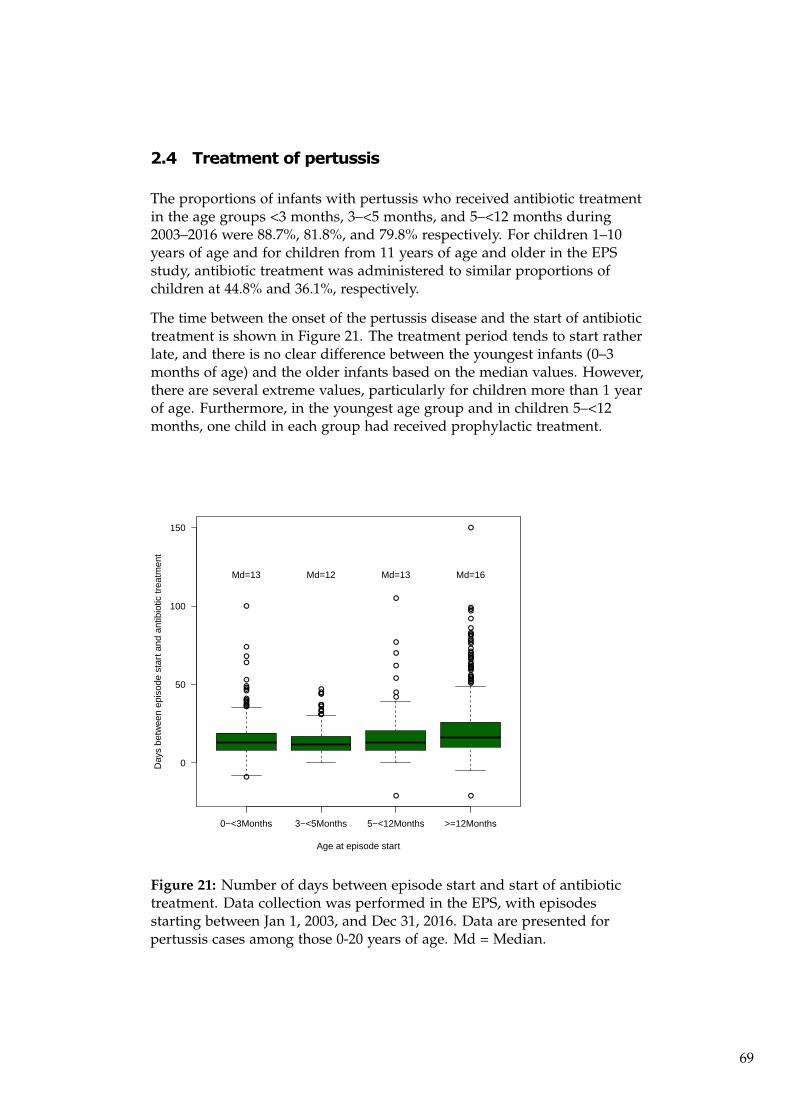
2.4 Treatment of pertussis
The proportions of infants with pertussis who received antibiotic treatmentin the age groups <3 months, 3–<5 months, and 5–<12 months during2003–2016 were 88.7%, 81.8%, and 79.8% respectively. For children 1–10years of age and for children from 11 years of age and older in the EPSstudy, antibiotic treatment was administered to similar proportions ofchildren at 44.8% and 36.1%, respectively.
The time between the onset of the pertussis disease and the start of antibiotictreatment is shown in Figure 21. The treatment period tends to start ratherlate, and there is no clear difference between the youngest infants (0–3months of age) and the older infants based on the median values. However,there are several extreme values, particularly for children more than 1 yearof age. Furthermore, in the youngest age group and in children 5–<12months, one child in each group had received prophylactic treatment.
●
●
●
●
●
●●●●●
●●
●
●
●
●
●
●
●
●
●
●●●●
●
●●●●
●●
●● ●
●
●
●
●
●
●
●
●
●
●●
●
●
●
●
●
●
●
●
●
●
●
●
●
●
●
●
●
●
●
●
●
●
●
●
●
●
●
●●
●
●
●
●
●
●
●
●
●
0−<3Months 3−<5Months 5−<12Months >=12Months
0
50
100
150
Age at episode start
Day
s be
twee
n ep
isod
e st
art a
nd a
ntib
iotic
trea
tmen
t
Md=13 Md=12 Md=13 Md=16
Figure 21: Number of days between episode start and start of antibiotictreatment. Data collection was performed in the EPS, with episodesstarting between Jan 1, 2003, and Dec 31, 2016. Data are presented forpertussis cases among those 0-20 years of age. Md = Median.
69

2.5 Case contact study of pertussis in infants
The ongoing EPS study was extended in January 2009 to also investigateinfant pertussis case contact. The aim of this study was to investigate themost common source of pertussis infection for the youngest infants, with afocus on identifying the outcome of severe disease in infant cases stratifiedby the contact source of infection.
A total of 345 infants with a mean age of 3.6 months were included in thecase-contact study during 2009–2016, and 117 of them were vaccinated.Persons with cough for 7 days or more who had been in contact withthe infants were categorized as mothers, fathers, siblings, other persons,and/or as unknown (if the parents had not noticed anyone with cough).
Mothers were the most commonly identified source, and a manuscript withmore detailed analyses regarding the case contact study is currently inpreparation.
2.6 Geographic differences in Sweden for laboratory-confirmedpertussis cases
The Swedish reporting system is based on data from counties, and at thislevel there are variations in the incidence in terms of time and betweendifferent areas of the country. Figure 22 illustrates the geographic variationsin reported pertussis cases (clinical and laboratory reported) during theyears 1997–2016.
During 2016, most of the pertussis cases (27%) were reported from thecounty of Stockholm followed by the county of Scania (Skåne) (18%) andthe county of Västra Götaland (17%). The county of Uppsala had the highestincidence of 17 reported cases per 100,000 person years followed by thecounties of Gotland and Södermanland with 16/100,000 and 12/100,000person years, respectively.
70

1997 1998 1999 2000 2001 2002
2003 2004 2005 2006 2007 2008
2009 2010 2011 2012 2013 2014
2015 2016
0
20
40
60
80
Figure 22: Incidence of reported pertussis cases (laboratory reports)in different counties of Sweden from 1997-2016 with episodes startingbetween Oct 1, 1997 and Dec 31, 2016 reported to SmiNet according tothe Communicable Disease Act. Colour changes indicate the 25%, 50%, and75% quartiles. Source: SmiNet.
2.7 The effects of catch-up and booster vaccination schedules
2.7.1 Immunisations during the 1990s
Infants born during the latter part of 1995 were vaccinated against pertussisin most parts of the country, with the start of vaccination taking place inJanuary 1996 when aP vaccines were introduced into the NIP. At the age of2 years, the overall three-dose coverage for the 1995 cohort was 59%. Sincethe restart of the NIP, including vaccination against pertussis with the aPvaccines in 1996, the coverage rate has been between 98% and 99%. Freecatch-up vaccinations to more than 65,000 children born in the 1990s wereoffered in the Gothenburg study area from 1997 to 1999 (Taranger 2001).Likewise, children in the rest of the country were also catch-up vaccinated
71

to some degree.
2.7.2 Immunisations during the 1990s in pertussis vaccine trials
Some study children from Trials I and II (Gustafsson 1996, Olin 1997) wereboosted in early childhood (almost all children vaccinated with DTwP inTrial I, and almost all children vaccinated with DTPa2 in the two trials).Within other studies, small groups of children were boosted at around 5–6years of age during the 1990s.
2.7.3 Booster vaccination in children born from 1995 and from2002 (see also chapter 1.3)
In 2005, a revision of the national vaccination schedule was initiated. As afirst step, a booster was recommended for children in school year 4 (age 10years) from autumn 2005. The first cohort for whom this fourth dose of aPvaccine was recommended was children born in 1995, i.e. the year beforethe formal introduction of DTaP in infancy, because this cohort was to alarge extent (59%) catch-up-vaccinated before 2 years of age. The booster at10 years of age was valid until 2011–2012. The next schedule revision wascompleted in Dec 2006 and included a fourth dose at 5–6 years of age and afifth dose at 14–16 years of age for children born from 2002.
2.7.4 Effectiveness of the preschool booster vaccination
The effectiveness of the booster at 5-–6 years was evaluated and was presentedin an international meeting in 2010 (Rydevik 2010). The results have alsobeen briefly presented in Chapter 4 of the 13-year report of the pertussissurveillance in Sweden. The presence of a preschool booster was shownto have a strong effect, with fewer than half the number of pertussis casesprior to the booster vaccination. An update of these results is now ongoingfor publication (manuscript in preparation). Also, an effect on herd immunityhas been evaluated and the results have been published (Carlsson, 2015).
2.8 Follow up of vaccine studies and immunisation 1996-97
2.8.1 Trials I and II
Two nationwide trials were performed during the 1990s. Pertussis Trial Iwith a 2-4-6 month schedule was performed in 9,829 infants during 1992–1995(Gustafsson 1996). In Trial II either a 3-5-12 month (72,698 infants) or a
72

2-4-6 month schedule (10,194 infants) was performed during 1993–1996(Olin 1997). Based on the study results, an extra dose of aP vaccine wasoffered in early childhood to children vaccinated with a DTPa2 vaccine(unregistered vaccine). The estimated incidence of pertussis in childrenvaccinated with the DTPa2 vaccine completed with a booster dose at theend of Trial II was lower than in cohorts vaccinated with three doses ofthe other study vaccines (DTPa3, DTPa5, or DTwP), all of which wereshown to be more efficacious in the trial. Among children vaccinatedaccording to the 3-5-12 month schedule, i.e. including an early boosterat 12 months of age, the long-term incidence of pertussis was higher inthe DTPa5 group than in the DTwP group, which was in contrast to whatwas estimated in the trial. These studies have been followed-up in detail bystudy nurses who documented the vaccination history and clinical coursein pertussis cases through structured telephone interviews according to thesame procedures carried out during Trial II.
Children participating in Trials I and II have been followed up in the enhancedsurveillance database from Oct 1, 1997. However, as mentioned above,these cohorts make up the Gothenburg study area and have been excludedfrom most analyses in this report. More detailed analyses have been presentedpreviously (Gustafsson 1996, Olin 1997) and in the technical reports. Theyare also described in Table 2 in chapter 1.1.2, Table 9 in chapter 2.2.3, andbelow.
Table 18 reports laboratory-confirmed cases of pertussis during the follow-upperiod from Oct 1, 1997, until Dec 31, 2016, among children vaccinatedwith three or four doses before the onset of cough. In all, there were 310cases of laboratory-confirmed pertussis cases among the participants inTrial I and Trial II who had received three trial doses.
The overall incidence of pertussis was 18 cases per 100,000 person years offollow-up (Table 18). The trial participants were between 4 and 18 years ofage during the follow-up period, and they had received the primary seriesof pertussis vaccine before 1 year of age.
Table 18 also shows the incidence figures during the 19-year follow up forchildren vaccinated at 3, 5, and 12 months of age in Trials I and II. Theoverall rate for Trial II children varied from 17/100,000 in the DTwP groupto 11–37/100,000 in the DTaP groups who had received three doses of apertussis vaccine.
Due to poor efficacy shown in Trial I for US DTwP, and in both trials forDTPa2 (unregistered vaccine), the recipients of these vaccines were offereda fourth dose of aP vaccines at 3–4 years of age. As expected, the estimatedincidence after four doses in the DTPa2 trial arm (11/100,000 person years)in Trial II was in the lower range of the DTPa3, DTPa5, and DTwP vaccines,all of which were shown to be efficacious in Trial II.
73

The former publications in the Gothenburg study area are mentioned inChapter 2.9.
Trial Vaccines Enrolledchildren
Person years Cases Incidence (95%confidenceinterval)
Trial I 3d CLIDTPwc+/-1d Cll Pa5
2,001 38,436 2 5 (1-19)
3d SKBDTPa2+/- 1dSKPB Pa3
2,538 48,751 6 12 (5-27)
3d CLLDTPa5 I
2,551 49,000 12 24 (13-43)
Trial II 3d EvansDTPwc
19,971 383,610 65 17 (13-22)
3d SKBDTPa2
6,444 123,778 46 37 (27-50)
3d SKBDTPa2, 1dSKB Pa3
13,731 263,750 30 11 (8-16)
3d ChironDTPa3
20,239 388,757 62 16 (12-20)
3d CLLDTPa5 II
20,230 388,585 87 22 (18-28)
Both trials All 87,705 1,684,667 310 18 (16-21)
Table 18: Number of laboratory-confirmed cases among participants inTrial I and Trial II, the number of fully vaccinated children (three doses ateither 2-4-6 or 3-5-12 months of age), estimated person years of follow up,and incidence per 100,000 person years of follow up. Data collection wasperformed in the EPS with episodes starting between Jan 01 2003 and Dec31 2016. Data are presented for pertussis cases 0-20 years of age.
2.8.2 Surveillance of children immunised Jan 1, 1996, to Sep30, 1997
In the beginning of 1996, when a pertussis vaccine was reintroduced inthe NIP, only one DTaP vaccine (Infanrix®, GSK) was used in all parts ofSweden except in the Gothenburg study area (see 1.3.3.).
The first 21 months (until Sept 30, 1997) cohort was regarded as a "pure"Infanrix®cohort, because that vaccine was the only pertussis vaccine usedfor this birth cohort in Sweden when the Gothenburg study area is excluded.However, most of these children have received one of the two DTaP vaccineat 10 years of age. Incidences and cases for this group are shown in Table 19.
74

Onset of pertussis relative tovaccination with Infanrix
Person years Number of cases Incidence 95% confidenceinterval
0-90days 2552.00 0 (5) 0 (196) 0-145 (64-457)91-150days 4537.00 4 (8) 88 (176) 24-226 (76-347)151-365days 33882.00 17 (19) 50 (56) 29-80 (34-88)After 1 year of age 2790664.00 470 (562) 17 (20) 15-18 (19-22)
Table 19: Incidence of pertussis in the cohort vaccinated withInfanrix®(vaccinated between January 1, 1996 and September 30, 1997).Data are from case reports of pertussis among those 0-20 years of age withepisodes starting between Oct 1, 1997, and Dec 31 2016. Data collectionwas performed in the EPS. The table shows the age groups at the onsetof the pertussis episode, the person-years of follow-up, the number oflaboratory-confirmed cases, the incidence per 100,000 person years andthe 95% confidence interval. The numbers in parentheses include theunvaccinated children of the respective age group (intent to treat).
75

2.9 Pertussis incidence in Västra Götaland and the evaluationof severity of pertussis in the Gothenburg study area
This chapter provides an overview of the Gothenburg study area. However,the Swedish reporting system is county-based and therefore we can onlypresent overall rates from the whole county of Västra Götaland. The Gothenburgstudy area is only a part of this county and represents about half of theVästra Götaland population. In addition, the study area includes onemunicipality within another county (Halland), which represents about onequarter of the county population (Figure 3). In other words, the nationalcommunicable disease reporting system does not allow comparisons ofthe Gothenburg study area with the rest of Sweden. Instead, data from thewhole county of Västra Götaland are used.
Despite the fact that the county of Västra Götaland is not a reasonableproxy for the ten Västra Götaland municipalities of the Gothenburg studyarea, we consider it valuable to present the overall number of 3,744 laboratory-confirmedcases from Västra Götaland during the 1997–2016 period compared to the15,923 laboratory-confirmed cases from the rest of Sweden during thesame time interval. We have also made some efforts to check indicatorsof different levels of awareness and reporting practices in Västra Götalandand in the rest of Sweden. In addition, data on some performance indicatorsfor the vaccination program were collected within the EPS and could becompared between the Gothenburg study area and the rest of Sweden.
Infants born during the latter part of 1995 were vaccinated against pertussisin most parts of the county of Västra Götaland when the aP vaccines werelicensed in January 1996. At 2 years of age, the overall three-dose coveragefor the 1995 cohort was close to 60%. The catch-up vaccination campaigncovered a large proportion of toddlers and school children in the VästraGötaland region, but only covered a smaller proportion in the rest of Sweden.In the Gothenburg study area, free catch-up vaccinations were offered from1997 to 1999 to more than 65,000 children born in the 1990s. By the springof 2000, about 56% of children born in the 1990s had been vaccinated withthree doses of aP vaccine (Taranger 2001).
The influence of the Gothenburg catch-up vaccination campaign on thelong-term circulation of pertussis is not known. The mass vaccinationstudy suggested the presence of herd immunity as reflected by a significantreduction in the number of pertussis cases in vaccinated and unvaccinatedindividuals in 1997–1999.
76

2.9.1 Incidences and cases of pertussis in Västra Götaland
During the years 2000-2005, it was obvious from the yearly national epidemiologicalreports that there were more laboratory–confirmed cases of pertussis in thecounty of Västra Götaland in relation to population size than in the restof Sweden (Figures 23 and 24). The incidence in this region was clearly inexcess of the expected incidences during 2001–2004 compared with the restof the country, with a marked peak in 2004.
Several reasons for the increased incidences have been evaluated in previousreports. One significant difference was the fact that 56% of the childrenin the area who were born in 1990 through 1995 were vaccinated withinthe Gothenburg study project during the years 1997–2000 (Taranger 2001)resulting in a large cohort with waning immunity after 4-6 years’ time.Other potential reasons that have been discussed include more pertussiscases being diagnosed (a greater proportion of mild cases in the Gothenburgstudy area) and the use of the mono-component vaccine (Carlsson 2009).
77

1998 2000 2002 2004 2006 2008 2010 2012 2014 2016
Year
%
0
20
40
60
80
100
Figure 23: Proportion of the laboratory-reported cases in SmiNet fromVästra Götaland. Data are from case reports of pertussis, reported toSmiNet, according to the Communicable Disease Act. The blue lineindicates the expected number of pertussis cases in relation to the incidencein the rest of Sweden.
78

0
20
40
60
80
Year
Inci
denc
e (p
er 1
00,0
00 p
erso
n ye
ars)
1998
1999
2000
2001
2002
2003
2004
2005
2006
2007
2008
2009
2010
2011
2012
2013
2014
2015
2016
Västra GötalandSweden excl. Västra Götaland
Figure 24: Incidence of pertussis (cases per 100,000 person years) permonth. Data are from case reports of pertussis, reported to SmiNet,according to the Communicable Disease Act.
Detailed data on the overall number of pertussis cases in Västra Götalandregion are presented in the Appendix. However, an illustration of theyearly pertussis incidence for the period 1986-2016 is shown below (Figure 25).See also Figure 7 and Figure 24 for incidences in the whole of Sweden.
79

1990 1995 2000 2005 2010 2015
0
5
10
15
Age
0
500
1000
1500
2000
2500
Cas
es p
er y
ear
Figure 25: Illustration of the incidence per age (1 year age groups) andcalendar year in Västra Götaland for cases with episodes starting between1997, and Dec 31, 2016. Cases were reported to SmiNet according to theCommunicable Disease Act. Data before 1997 are from voluntarily reportsfrom bacteriological laboratories.
Pertussis in infancy in the Västra Götaland region and the rest ofSweden
The difference in incidences of pertussis between the Västra Götalandregion and the rest of Sweden is especially marked in infants (younger than12 months of age). Figure 26 provides the age-specific incidence in infantsper calendar year in the Västra Götaland region and the rest of Swedenduring the 1986–2016 period.
The incidence rates in infants in the Västra Götaland region during theperiod 1999–2005 varied between 246 and 872/100,000 person years, i.e. atlevels seen in Sweden before the introduction of DTaP in 1996, whereas thecorresponding rates in the rest of Sweden during the same time periodwere 78–185/100,000 (Figure 26). In 2007, the age-specific incidence in
80

infancy was below 100/100,000 in the Västra Götaland region for the firsttime since 1985.
1985 1990 1995 2000 2005 2010 2015
0
200
400
600
800
1000
1200
1400
Year
Inci
denc
e (p
er 1
00,0
00)
Västra GötalandSweden excl. Västra Götaland
Figure 26: Age-specific incidence of laboratory-reported pertussis ininfants in the Västra Götaland region and in Sweden excluding VästraGötaland during the 10 calendar years before (1986–1995) and 20 years after(1997-2016) the introduction of the DTaP vaccine in 1996. Data are fromcase reports of pertussis, with episodes starting between 1997 and Dec 31,2016, reported to SmiNet according to the Communicable Disease Act orfrom voluntarily reports from bacteriological laboratories before 1997.
2.9.2 Severity of pertussis in the enhanced surveillance studyfor children in the Gothenburg study area in comparisonwith rest of Sweden
In this section we describe cases in the database as of Dec 31, 2016, thathave a reported onset of cough in the EPS study and were born from January1, 1996. For analytical purposes, they are split into two groups: those bornin the Gothenburg study area (706 pertussis cases including 414 with 21 or
81

more days of spasmodic cough) from Jan 1, 2003 (Table 20), and those bornin the rest of Sweden (3,460 and 2,793 cases, respectively) from Oct 1, 1997(Table 25 Appendix).
In Table 12 Appendix and Table 13 Appendix, laboratory-confirmed casesfrom Sweden excluding the Gothenburg study area and from the Gothenburgstudy area per year and birth cohort are shown.
Among 3,248 children with laboratory-confirmed pertussis, 1,158 (35.7%)had not received a pertussis vaccine prior to the illness, including 146(20.7%) from the Gothenburg study area and 1,012 (39.8%) from the restof Sweden. We also present data on all children from October 1997. Therewere 1,369 unvaccinated children with pertussis from Sweden excludingthe Gothenburg study area and 245 unvaccinated children from the Gothenburgstudy area (Table 14 Appendix and Table 15 Appendix).
The median durations of cough and spasmodic cough in children fromJanuary 1, 2003, among the 146 unvaccinated children from the Gothenburgstudy area were 45 and 32 days, respectively. The corresponding figuresfrom the rest of Sweden were 53 and 40 days. Spasmodic cough for 21 daysor more was reported for 65.1% of the Gothenburg study area children andfor 81.3% of the children from the rest of Sweden. No spasmodic coughwas reported for 27.4% and 15.2% of the episodes in the Gothenburg studyarea and the rest of Sweden, respectively. This difference is statisticallysignificant (p < 0.001).
The incidences of pertussis with 21 days of cough, hospital admission,and complications by age group and study region with episodes startingbetween Jan 1, 2003, and Dec 31, 2016, are presented in Table 10 in Chapter2.3.1. For infants younger than 3 months of age there were higher incidencesfor all parameters in the Gothenburg study area compared with the rest ofSweden. Likewise, the incidences were also mostly higher for the other agegroups included in Table 9.
Altogether 638 of the 3,248 children with pertussis (19.6%) had a hospitaladmission during the pertussis episode. Seventy-two (10.2%) of the childrenin the Gothenburg study area were hospitalised during the pertussis episodecompared to 566 (22.3%) children in the rest of the country (p < 0.001).Hospitalisation rates for children in the Gothenburg study area were significantlylower compared to the rates in the rest of Sweden in all age groups ininfancy. Hospital admissions were studied from Jan 1, 2003, to Dec 31, 2016(see Table 10 in chapter 2.3.1). The incidence of pertussis in children inthe Gothenburg study area was higher, and the proportion of hospitalizedchildren was lower before 2007 than in the rest of Sweden, but up to 2012the percentage of hospitalised cases was similar in the two areas. During2012–2016, the hospitalisation rate in the Gothenburg study area was higher(Figure 27).
82

2004 2006 2008 2010 2012 2014 2016
0
10
20
30
40
50
Year
Per
cent
age
hosp
italiz
ed
Sweden excluding GothenburgGothenburg
Figure 27: The rate (%) of hospitalisation among pertussis cases in theGothenburg study area and in the rest of Sweden. Data collection wasperformed in the EPS, with episodes starting between Jan 1, 2003, and Dec31, 2016. Data are presented for pertussis cases 0-20 years of age.
For data on complications of pertussis disease, see Chapter 2.3 and 8.4.
For the whole country since Jan 1, 2003, there was a greater likelihood of areported pertussis case to come from a child in the Gothenburg study areacompared to the rest of Sweden (Table 20), but since 2005 the differenceshave mostly disappeared. Approximately 17% of new-borns in Swedenduring the years 1996–2016 were born in the Gothenburg study area, andin the last column below, called "Index", the percentage of pertussis casesin the Gothenburg study area out of the total number of cases in Sweden istherefore divided by 17.
83

Severity Totalnumberof cases inSweden
Number ofcases in theGothenburgstudy area
Percentof totalnumber ofcases thatoccured inGothenburgstudy area.
Index.ProportioncontributedbyGothenburgstudyarea inrelation toproportionof newbornchildren
All reportedcases
3248 706 21.7 1.9
Cough<14 days -spasmodicornon-spasmodic
102 42 41.2 3.6
Nospasmodiccough
630 223 35.4 3.1
Spasmodiccough 21days
2436 414 17.0 1.5
Table 20: Number of pertussis cases of differing severity with regardto spasmodic cough. Comparison between the Gothenburg study areaand Sweden excluding Gothenburg. Data are from laboratory-confirmedcase reports of pertussis. Data collection was performed in the EPS, withepisodes starting between Jan 01 2003, and Dec 31 2016. Data are presentedfor children 0-20 years of age.
Some differences in incidences of pertussis between the Gothenburg studyarea and the rest of Sweden are found when comparing the two areas forchildren with 21 or more days of cough regardless of vaccination status.
84

0
50
100
150
200
Days of age
Cas
es p
er 1
00 0
00 p
erso
n ye
ars
●
●
●
●
0−90days 91−150days 151−365days >365days
●
●
●
●
142.1
97.1
15.47.4
174.1
110.1
48
15
GothenburgRest of Sweden
Figure 28: Age specific incidence of spasmodic cough for 21 days or more(WHO 1991) due to pertussis disease per 100,000 person years of follow up–regardless of vaccination status – in Gothenburg study area and in rest ofSweden. Data collection was performed in the EPS with episodes startingbetween Jan 1, 2003 and Dec 31, 2016. Data are presented for children 0-20years of age.
85

3 Discussion
Despite high vaccine coverage globally (86% coverage with three dosesof a pertussis-containing vaccine in 2015), pertussis remains endemic inall countries and continues to be a public health concern (WHO positionpaper, Pertussis vaccines 2015). In Sweden, pertussis is the least controlledof all vaccine-preventable bacterial diseases for which universal childhoodimmunisation is recommended (Årsrapport 2016) even though vaccinationcoverage for aP-containing vaccines has been 97–98% for decades. Theincidence of pertussis has increased in the last three years after many yearsof low incidence.
In the present 19-year report, 647 labortory-confirmed cases of pertussiswere reported to SmiNet during 2016, of which 87 infants were youngerthan 1 year of age. As in previous years, infants had the highest incidenceout of all age groups in 2016. Pertussis remains a serious and life-threateningdisease for infants, especially for the youngest. In 2016, no pertussis-relatedinfant deaths were reported in Sweden, but two infants died in 2014 andone infant died in 2015, and all three were younger than 1 month old andunvaccinated. As in previous years, age-specific incidence of hospitalisationassociated with pertussis was highest for infants younger than 3 monthsof age in 2016. A majority of infants (72%) had pertussis before the age of5 months, and 60% were unvaccinated. Consequently, the high incidenceof pertussis among infants is mainly represented by infants before theyreceived one or two doses of pertussis vaccine.
Increase of pertussis in Sweden since 2014 after years of low incidence
After a 5-year period with a low incidence of reported pertussis cases (2009to 2013), a significant increase was noticed in the general population in2014. The incidence increased by threefold to 7.1/100,000 person years in2014. This increase was partly sustained during both 2015 (5.9/100,000person years) and 2016 (6.5/100,000 person years). As in previous years,infants had the highest incidence out of all age groups in 2016. Otherage groups associated with high incidences in 2016 were the 11, 13, and17-year-old teenagers with an incidence of 14–16.0/100,000.
In Sweden, the resumption of aP vaccination in 1996, after a 17-year periodwithout any pertussis-containing vaccine, had a positive effect on theincidence of pertussis in infants and provided indirect protection of theunvaccinated population. A dramatic decline in pertussis incidence wasseen during the first years, with further reductions documented during thelong-term follow-up until 2013. The total incidence of pertussis decreasedfrom 90.4/100,000 in 1996 to 4.0/100,000 person years in 2008, with furtherdecreases in the incidence during the time period 2009–2013 to 1.8–2.8/100,000person years. The decrease started in infants and toddlers, and after the
86

pertussis booster vaccination was introduced at 10 years of age in 2006 andsubsequently moved to 5–6 years of age in 2007, the decrease continued ininfants and was also evident in early school age.
It has been clear for several years that protective immunity following aPvaccines wanes over time (Misegades 2010, Witt 2012, Klein 2012, Sheridan2012, Baxter 2013, Koepke 2014). Worldwide surveillance data suggestthat the use of aP vaccines will result in a resurgence of pertussis after anumber of years and that this resurgence might also lead to an increasedrisk of death in infants who are too young to be vaccinated (WHO positionpaper 2014, 89, 337–344). Future surveillance will tell if the increase inpertussis in Sweden is part of a renewed cyclic pattern of epidemic wavesor if the incidence will be sustained at a higher level. The increase of pertussisin 2014 was difficult to predict because it was neither preceded by a decreasein vaccination coverage nor by an obvious increase of pertussis in any agegroup. With the current situation, it is reasonable to believe that Swedenhas passed the honeymoon period as described by de Celle‘s (2016).
Pertussis in infants
In 2016, as in previous years, in the EPS study, infants had the highestincidence of pertussis of all age groups (74.1/100,000 person years), andmost of the infants had pertussis before they had received one or twodoses of pertussis vaccine. Long-term follow up shows high incidence ofpertussis in 1997–2003 in infants 0–90 and 91–150 days of age (239/100,000person years and 248/100,000 person years, respectively). These levelsdecreased, however, for the subsequent period of 2004-2010 (151/100,000person years for 0-90 days of age and 110/100,000 person years for 91–150days of age), and then increased again during the period 2011-2016 (167/100,000person years for 0-90 days of age and 111/100,000 person years for 91-150days of age).
In a recently published nationwide study from the US, the overall pertussisincidence rate among infants <12 months of age, born from 2005 to 2010,was 117.7/100,000 person years, with infants 3 months of age having thehighest incidence rate (247.7/100,000 person years). The incidence ratein the youngest infants was much higher in the US study compared tocorresponding Swedish data for the same time period, but a similar agedistribution and a similar steady decrease of incidence from the 4th throughthe 12th months of life was observed (Masseria 2017). However, this differencein incidence levels might be due to differences in clinical routines andsurveillance systems.
All children hospitalised in Sweden for pertussis in 2016 were youngerthan 12 month of age (n = 44). The hospitalisation rate in pertussis casesamong infants did not differ compared with 2015 (52% in 2016 vs. 51% in2015). In the study period between January 2003 and December 2016, the
87

age-specific incidence rate of hospitalisation due to pertussis was highestfor children 0—90 days of age (70% hospitalisation), and the overall rateof hospital admission for unvaccinated children was 43%. In this group,however, 91% were younger than 3 months of age and too young to bevaccinated.
In 2016, 51 out of 83 infants reported complications due to pertussis, and 36of these infants were hospitalised. All infants reported with complicationsin 2016 had respiratory complications; with apnoea (n=21) or withoutapnoea (n=30). The total rate of any complication was higher in 2016 (61%)compared to 2015 (35%) and 2014 (27%) but this can be explained by ahigher number of infants reported in 2016 with respiratory complicationwithout apnoea. The rate of respiratory complication with apnoea in 2016was 25% and corresponding rate in 2014 and in 2015 was 19% and 27%respectively. The higher number of infants reported with respiratory complicationswithout apnoea in 2016 warrants further close observation and analysis.Other studies have shown high rates of respiratory complications withapnoea (56%, Tanaka 2003; 34%, Sowdhamini 2011). In a previously publishedstudy based on the Swedish EPS data for 1998–2012, complications of anykind due to pertussis were reported in about a quarter to a third of theinfants with pertussis and were more frequent in unvaccinated infants.Respiratory distress, with or without apnoea, was the most frequent problem(Carlsson 2015). The complication rate in 2016 (57%) was higher thanreported in 2014 (27%) and 2015 (35%), but the higher rate of complicationsin 2016 was not associated with a higher hospitalization rate. In the long-termEPS study, with episodes starting between January 2003 and December2016, of the 641 children who were younger than 90 days of age at thebeginning of the pertussis episode, 43% (n = 273) had at least one complicationand 76% of children with any complications were younger than 1 year ofage.
The present report shows that the first dose of vaccine given at 3 monthsof age has reduced the risk of severe illness and thus reduced the ratesof hospitalisations and complications compared to unvaccinated infants.Ninety per cent of infants younger than 3 months had paroxysmal coughfor 21 days or more, and among those having received one dose or moreof pertussis vaccine a significantly reduced period of coughing (p < 0.001)was observed. In addition, this report shows that one dose of pertussisvaccine gives significant protection against other complications (includingrespiratory complications, neurological complications, dehydration with>5% of weight loss, or other serious complications) related to pertussis (p= 0.034) among infants aged 3–12 months compared with unvaccinatedinfants. These results suggest that already after one dose of a pertussisvaccine there is some protection against severe pertussis, which was definedhere as any complication due to the disease. This was previously shown ina US study (Tanaka 2003) and also further evaluated in an article based on
88

EPS data (Nilsson 2012).
Source of pertussis infection in infants
Pertussis is a highly contagious disease with attack rates reaching as highas 80% in susceptible individuals (Mertsola 1983). Numerous studies haveevaluated the source of pertussis transmission to infants, and for morethan half of all infant cases an unknown source of infection is reported(Bisgard 2004, Kowalzik 2007, Wendelboe 2007). In studies where a sourceof transmission is identified, mothers have been the most commonly citedsource of infection (Elliott 2004, Bisgard 2004, Wendelboe 2007, Kowalzik2007). Published data, however, from Canada, Australia, the Netherlands,and the US suggest that siblings have an increasingly important role inthe transmission of pertussis to infants (Halperin 1999, Jardine 2009, deGreefff 2010, Bertilone 2014, Skoff 2015). One previous study describedinfant and maternal characteristics as factors that might be associated withincreased pertussis-related death (Haberling 2009). None of the previousstudies, however, have stratified age at onset, severity, and time betweendiagnosis and onset of symptoms by contact source of individuals closeto the infant. Therefore, the ongoing EPS study was extended in January2009 to also investigate infant pertussis case contact. The aim of this studywas to investigate the most common source of pertussis infection for theyoungest infants and to identify the outcome of severe disease in infantcases stratified by the contact source of infection. The analysis of the EPSdata case contact data 2009-2015, showed that mothers were the mostcommonly identified source, and preliminary data indicate the importanceof early diagnosis and treatment of mothers with new-borns and the use ofpost-exposure antimicrobial prophylaxis in infants in order to decrease thedisease burden of pertussis in infants.
Pertussis incidence over time in children older than 1 year
Age groups associated with increased and higher incidences in 2016 incomparison to 2015 were the 11, 13, and 17-year-old teenagers. A boosterdose among 14–16 year olds was implemented within the NIP in 2016 inSweden. The vaccination of teenagers has been shown to reduce the spreadof infection among teenagers (Acosta 2015), but the available data implya limited or no herd immunity effect on pertussis incidence in infants(Quinn 2011, Auger 2013, Kandola 2005). Moreover, recently publisheddata indicate short-term protective effects after booster vaccination inadolescence (Tami 2016). The impact of low dose vaccine against tetanus,diphtheria, and acellular pertussis (dTdTap) vaccine among adolescentsin the US seemed promising following the introduction of the vaccine,but extended analysis revealed that the trend in adolescent disease wasreversed in 2010 when the reported incidence of pertussis among adolescentsbegan to increase at a faster rate than in any other age group. The benefitfrom ddTap vaccination was mostly seen in adolescents who, when they
89

were infants, received at least some doses of the wP pertussis vaccine.When those cohorts were replaced by younger ones who had receivedaP vaccines in infancy, pertussis made a comeback in the US (Tami 2016).Similar results were also shown in another study among a cohort of teenagersin the US who had exclusively received aP vaccines with the booster aPvaccination providing moderate protection one year after vaccination,after which protection waned rapidly (Klein 2016). The 14–16-year-oldadolescents who have been offered ddTap since 2016 were, according tothe NIP, vaccinated with aP vaccine in infancy in Sweden, and future EPSreports will provide data on the effects of this school-leaving booster dose.
Pertussis in fully vaccinated children
The resurgence of pertussis infections in Sweden and in several countrieswith high vaccination coverage has raised questions about the nature anddurability of vaccine-induced immunity (de Celle‘s 2016, Locht 2016).Epidemiological studies showed that aP vaccines are protective in the firstyears after vaccination (Bisgard 2005), but protection is temporary, withrapidly waning immunity (Plotkin 2014a, Plotkin 2014b). A recent studyin the state of Florida in the US suggested that there has been sustainedtransmission of B. pertussis in an aP-vaccinated cohort (Matthias 2016).
The proportion of children in the EPS data who were fully vaccinated inthe different age groups varied greatly, especially in the older age groups.In the age groups 1–5 years of age, the proportion of fully vaccinatedvaried between 60% and 73%, with the highest proportion in the 3 yearolds. Considering a vaccine efficacy of 80% after three doses of aP vaccines,the number of fully vaccinated cases among children 1–5 years old is reasonablein relation to the number of children vaccinated and the size of the vaccinatedcohorts in Sweden. In the age groups 6–18 years old, the proportion offully vaccinated varied between 12% and 55%. The 17–18 year olds had thelowest rate of fully vaccinated at 12%, but very few cases were reportedin this age group. The proportions of fully vaccinated decreased whencomparing the 5-year-old children (60%) to the 6-year-old children (22%).This might be an effect of the booster vaccine administered at 5 years of ageaccording to the NIP. In a pertussis outbreak in the state of Washington inthe US in 2012, a valid vaccination history was available for 1,829 of 2,006(91.2%) patients aged 3 months to 19 years. Overall, 758 of 1,000 (75.8%)patients aged 3 months to 10 years were up-to-date with the childhoodDTaP doses (CDC, 2012). A similar high rate of pertussis cases amongchildren who were fully vaccinated was observed in the California pertussisepidemic in 2010, with 66% of reported cases in fully vaccinated children inthe 7–10 year olds who had previously received only aP vaccine, which issuggestive of waning immunity (Winter et al 2012). Furthermore, in theCalifornia epidemic in 2014, 87% of pertussis cases in adolescents hadpreviously received the dTap booster vaccine, and the median length of
90

time since the prior dTap dose was 3 years (range = 0–7 years) (Winter2014).
In comparison to previous studies in the US, the proportion of fully vaccinatedpertussis cases in the EPS study are lower. Based on aP vaccine efficacy andthe observation that immunity for pertussis appears to wane over time aftervaccination, our data might be reasonable because pertussis vaccine uptakeis high and timely in Sweden. Nonetheless, the continued occurrence ofpertussis cases among fully vaccinated children warrants further closeobservation and analysis.
91

Strategies to protect infants from pertussis in other countries
Over the past few years, several countries have reported an increase inpertussis cases and pertussis-related deaths among infants. In most countries,infants receive their first pertussis vaccine between 6 weeks and 2 monthsof age, followed by additional immunisations given at 1- or 2-month intervals(WHO position paper, Pertussis vaccines 2015). Therefore, the most vulnerableage group is not sufficiently protected against the disease (Juretzko 2002).
Cocooning
To decrease the burden of disease among infants, recommendations varyand might include vaccination of children and adults surrounding thenew-born baby (known as “cocooning”), vaccination of the mother duringthe last trimester of pregnancy, and vaccination of health care workers.Moreover, some countries recommend regular vaccination with pertussis-containingvaccines of all adults every 10 years. The cocooning strategy, which wasfirst canvassed by the Global Pertussis Initiative in 2001 (Forsyth 2001), hasbeen recommended in the US since 2006 and at differing times in Germany,France, and Australia (Libster 2012, National Health and Medical Research2003). Implementation of the cocooning strategy was difficult in the USand other countries, with low uptake due to problems in both deliveryand funding of the vaccine (Amirthalingam 2013). The cocooning strategyis estimated to have an impact on disease prevention in some settings ifhigh coverage can be achieved (WHO 2016). However, in periods with lowincidence of pertussis in infants, e.g. 30–40/100,000 person years, it hasbeen estimated that the cocooning strategy would need large resources fora limited effect (Skowronski 2012). In addition, a recent US study (Winter2017) did not find evidence supporting the effectiveness of maternal postpartumcocooning with the dTap vaccine (Baxter 2017). Moreover, current aP vaccinesare estimated to have an inherent limitation because the effectiveness ofthe cocooning strategy relies on herd immunity, which is not sufficientlyinduced by the aP vaccines (Locht 2016).
Maternal Tdap immunisation
Immunising during pregnancy aims to sufficiently boost immunity tooptimise transplacental transfer of maternal antibodies to the babies, andthus mothers vaccinated during pregnancy are less likely to be a source ofinfection for their babies.
In 2015, the WHO stated that vaccination of pregnant women is likely tobe the most cost-effective additional strategy for preventing disease ininfants too young to be vaccinated and to be more effective and favourablethan cocooning (WHO position paper, Pertussis vaccines 2015). Maternalpertussis immunisation is currently recommended in Australia, Belgium,Spain, Ireland, Brazil, Columbia, Argentina, Portugal, the UK, and the
92

US in response to increased incidence. In the UK, a maternal pertussisimmunisation programme was introduced in October 2012 as a responseto an outbreak in which a large number of adult cases was seen among thepopulation, and immunisation was extended to all age groups, includinginfants aged <3 months in whom there was an incidence of 240 cases per100,000 person years. In 2012, there were 14 deaths among 429 infant casesinfected with pertussis, compared with 7 deaths among 178 infant casesduring 2008 (Cherry 2012, Amirthalingam 2013, Pinto 2013, Amirthalingam2014). Data from UK studies have shown that maternal pertussis immunisationgives a good immune response in the mother and in the child (Amirthalingam2014, Dabrera 2015), and the evidence of the effectiveness of maternalimmunisation programmes is growing. A retrospective cohort study inCalifornia (Winter 2017) concluded that dTap vaccination at 27–36 weeksduring pregnancy was 85% more effective than post-partum dTap vaccinationat preventing infant disease prior to 8 weeks of age. In addition to thefinding of high vaccine effectiveness in the first 2 months of life (91%),maternal dTap vaccination has also been demonstrated to confer a significantamount of protection against pertussis over the entire first year of life(69%), even after infants are vaccinated with DTaP (Baxter 2017). In addition,infants born to vaccinated mothers had lower risk of hospitalisation andintensive care unit admission and shorter hospital stays. The adjustedvaccine effectiveness for preventing hospitalisation among infants was 58%(Winter 2017).
Safety studies have not identified any serious adverse effects of maternalvaccination (Amirthalingam 2014, Donegan 2014, Dabrera 2015, Moro 2016).Whether vaccination during pregnancy leads to any clinically relevantimpairment of infant responses (such as blunting or interference) to primaryand booster vaccination in the NIP have been studied (Hardy-Fairbanks2013, Ladhani 2015, Maertens 2016(Vaccine), Maertens 2016(Clin Infect Dis),Hoang 2016, Voysey 2017), but the subsequent long-term epidemiologicaleffect remains the subject of debate (Munoz 2014, Bento 2016, Maertens2016, Bento 2017).
Strategies to protect infants from pertussis in Sweden
Due to the remaining cases of pertussis disease among infants in Swedenand the increase of pertussis reported during the last two years, the PHASissued recommendations in August 2016 to improve pertussis diseasecontrol among infants (Link to PHAS). The recommendations were basedon the EPS data, conclusions from a systematic literature review (Linkto review), and a health economic analysis performed by the PHAS in2015. The strategies evaluated in the review were discussed by Swedishexperts in the field and relevant stakeholders, including clinicians andcommunicable disease officers. The proposed interventions are aimed atstrengthening the current recommendations in Sweden, that is, to increase
93

the timeliness of the first vaccine dose, to increase the awareness of pertussisamong caregivers, and to increase testing for pertussis in infants and theuse of early post-exposure antibiotic prophylaxis.
It is important to be observant of coughing among close family membersduring a child’s first months of life. Generous use of testing, rapid diagnostics,and treatment can prevent infant deaths, and early post-exposure antibioticprophylaxis provides good protection against clinical pertussis in infants.The yearly collection and reporting of such data will help us to furtheranalyse if there is any difference in the awareness before and after thepublication of the recommendations in August 2016.
The Swedish National Board of Health and Welfare has since 1982 recommendedearly post-exposure prophylaxis with antibiotics to infants younger than 6months of age and treatment with antibiotics at first symptoms to infants6–12 months old. Prophylactic treatment, especially for the youngest children,should be started as quickly as possible. The data in the present 19-yearreport indicate no difference in time between episode start and start ofantibiotic treatment for the youngest infants compared with older agegroups. Furthermore, there is no obvious difference in the present 19-yearreport , compared with previous reports, regarding the time between theonset of disease and the start of antibiotic treatment (with a median of 13days for infants 0–3 months of age). The total number of samples testedfor pertussis in the general population was not significantly greater in2016 compared with 2015 or 2014. This information, along with the delaybetween the onset of disease and the start of treatment, indicates that theawareness of pertussis among health-care workers is low and still needsto be improved. Several years of low incidence of pertussis in Sweden(2008–2013) might have decreased the knowledge of pertussis diseaseamong health-care workers. The time period since the recommendationswere published (August 2016) is, however, short (6 months), and we arethus not yet able to evaluate if these recommendations have improved theawareness of pertussis.
Another parameter that can also can be used to evaluate the awarenessof pertussis among health-care workers is to analyse the number of timesparents have sought medical care for their sick child before pertussis wasdiagnosed. Since January 2016, data regarding the number of medical careinstances have been collected in the structured telephone interviews of theEPS. In 2016, 45 out of 80 infants with pertussis had more than one visitto a doctor. Eighteen of these had two visits, 18 had three visits, six hadfour visits and three infants had five visits before a pertussis diagnosis wasestablished. Comparing these data on a yearly basis might lead to a betterunderstanding of whether there are any improvements in the knowledgeand awareness of infant pertussis among healthcare workers.
At the moment, neither maternal vaccination nor cocooning immunisation
94
strategies are recommended in Sweden. The cocooning strategy is notrecommended due to the cost-effectiveness analysis and presumed difficultiesof vaccine up-take in combination with the need for high vaccinationcoverage before a significant effect on infants is seen. Maternal vaccinationis not recommended due to the lack of robust safety data and data oninfant response to the primary immunisation schedule (including bluntingand interference) (Link to recomendations). Furthermore, this report showsthat the pertussis incidence and hospitalisation incidence in infants are stillat lower levels compared to corresponding data in those countries that havedecided to recommend maternal vaccination.
Conclusion
In conclusion, the surveillance of pertussis in Sweden provides a reportingmethodology that is stable over time and offers a unique opportunity toconduct an enhanced follow-up after the introduction of aP vaccines in anendemic setting with high vaccination coverage. The long-term surveillanceprovides insights into the overall impact of an aP vaccination programme,including estimates of the duration of vaccine-induced protection aftervaccination in infancy and after the introduction of a preschool boosterand – with the continuation of the project – after the introduction of a"school-leaving" booster. The unique data on date of onset of disease providedthrough the surveillance allows for detailed evaluations of the effects ofvaccination strategies and the severity of disease in infants.
Despite the existing preventive strategies for reducing pertussis cases ininfants, many infants still contract the disease, and infants too young forvaccination are at greatest risk of life-threatening pertussis. Thus effectivestrategies to protect the youngest infants are needed. In the case of a furtherincrease of pertussis in infants, recommendation of maternal vaccinationwill be re-evaluated when more data on safety and interference of maternalvaccination are available, and complementary strategies might be recommendedin the future.
95

4 Plan for continued work
In accordance with the overall objective of the study, the plan for 2017 is:
• To monitor epidemiological trends over time for pertussis in Sweden(at the broader population level and specifically in vaccinated cohorts)
• To monitor the impact of any changes in the NIP
• To provide insight into the ability of the timing/dosing schedule tocontrol pertussis
• To provide particular insight into the disease burden in infants
The analyses are primarily descriptive/qualitative and are designed tomonitor epidemiological trends for pertussis and to provide insight intohow they might be changing with time and vaccination schedule.
Age-specific incidence will be studied in order to monitor the impactof the preschool booster and the adolescent booster on the incidence ofpertussis in infants, to monitor the trends of pertussis and the impact of theentire schedule of vaccinations, and to evaluate the effect of booster doseson pertussis epidemiology. Specifically, we will measure the incidence ofpertussis during and after first year of life (presented in time intervalsaccording to changes in the NIP), the incidence and cases of pertussis inchildren by age and by vaccination status, and the incidence of pertussis ininfancy by time and by changes to the NIP.
• Antibiotic treatment. The use and the effect of antibiotic treatment inall children will be studied, including the time interval between theonset of disease and the start of antibiotic treatment and the relationbetween the timing of antibiotic treatment and disease severity.
• Timing of vaccinations and the impact of vaccination status. Dueto regional vaccine procurements, exposure to different pertussisvaccines varies with birth cohort and geographical area. Therefore,comparison between vaccines will not be possible, and the outcomeof the analyses will instead include the following:
– We will determine the number of pertussis cases and severity ofpertussis in infancy by vaccination status.
– – In fully vaccinated children (according to the NIP and Summariesof Product Characteristics) with laboratory-confirmed pertussisfrom 2007 and onwards, we will study the time from last vaccinedose administered until the episode start of pertussis disease.The data will be analysed and reported by age group.
96

• Severity of pertussis disease will be studied with special focus oninfants and will include the duration of disease, the rate of hospitaladmission, the duration of hospital stay, the duration of cough, andthe rate of severe complications. Markers of severity will be studiedand related to the age at onset of disease and to individual vaccinationhistories as well as to the scheduled ages of the NIP.
• Case-contact information for infants will be used to study the sourceof infection and will be related to severity of disease, to age at onsetof disease, and to individual vaccination histories.
Additional analyses might be added to the project as decided at the annualreview meetings. Annual progress reports will, as previously, summarisethe overall number and age-specific incidence of laboratory-confirmedcases with detailed analyses in vaccinated cohorts.
4.1 Scientific publications and presentations
Papers being prepared for publication include:
1. An evaluation of the preschool booster effect on pertussis incidence
2. The analysis of the case-contacts data, which has recently been presentedas a poster at the Nordic Vaccine Meeting 2016.
3. In collaboration with Public Health Agencies in the Netherlands,Norway, Denmark and in the UK prepearing comparative study ofhospitalisation incidence in infants.
4.2 Limitations
While it is likely that the mandatory reporting system is reasonably reliablein reporting diagnosed cases, there is substantial risk that infected individualsare not diagnosed in the first place. One reason for not being diagnosed isbecause infected persons can have no, mild, or atypical symptoms. Whilemild symptoms reduce the probability that the disease will be diagnosed,these cases might still be relevant in the circulation of the disease. Also,there appears to be a conception among both medical professionals andthe public that pertussis disease does not infect vaccinated individuals. Itis therefore likely that even patients with typical symptoms are not testedfor pertussis if they have already been vaccinated. Because there are nodata on the true incidence of pertussis, we cannot quantify the magnitudeof such under diagnosis, but it is likely that failure to obtain a diagnosis ismore common in adults than in children and that it might be increasing
97

with time as the awareness of pertussis has decreased because a largeproportion of the population has been vaccinated. Possible consequencesof under-diagnosis include overly optimistic conclusions about pertussisincidence, vaccine effectiveness, and the duration of vaccine immunity.Adverse events in vaccinated children are reported directly to the MedicalProduct Agency in Sweden by the child’s nurse or doctor. These reporteddata are confidential, and the surveillance team at PHAS has no accessto these data. The study on pertussis in fully vaccinated children can bereported on a group level (by age), but not on an individual level. If aparent reports an adverse event (any symptoms), the team at PHAS willcontact the reporting doctor or nurse for proper action.
98

5 Administration
The EPS in Sweden started on Oct 1, 1997, and is ongoing with annualreconsideration of continuation.Financial support has been obtained from the vaccine manufacturers Sanofiof France and GlaxoSmithKline Bio of Rixensart, Belgium.Contracts for the project “Pertussis surveillance in Sweden” have beenagreed upon for the continued follow-up of clinical epidemiology since1997 by the manufacturers above.Major policy decisions relating to the conduct of the study are made bythe team at PHAS, including the Internal Steering Committee at PHAS,and are discussed with representatives from the supporting manufacturersat annual review meetings. Study staff at PHAS team: Bernice Aronsson(principal investigator, project leader), Kerstin Drakes Jämtberg (studynurse), Emma Byström (research assistant), Henrik Källberg (statistician),and Bo Östlund (administrative coordinator).
Annual reports are published every September on the PHAS website,(http://www.folkhalsomyndigheten.se/).
99

6 Reports from published peer-reviewed papers
6.1 Published reports based on the enhanced surveillancedata
The five-component aP vaccine is recommended for general use: Gustafsson L,Hallander HO, Olin P, Reizenstein E, Storsaeter J. A controlled trial ofa two-component acellular, a five-component acellular and awhole cellpertussis vaccine. N Engl J Med 1996; 334:349-55.
Similar efficacy of the UK whole-cell vaccine and the five-component and three-componentvaccines Olin, Rasmussen F, Gustafsson L, Hallander HO, Heijbel H. Randomisedcontrolled trial of two-component, three-component, and five-componentacellular pertussis vaccines compared with whole-cell pertussis vaccine. AdHoc Group for the Study of Pertussis Vaccines. Lancet. 1997 350:1569-77.
First signs of waning immunity at 6-7 years of age Olin P, Gustafsson L,BarretoL, Hessel L, Mast C, Van Rie A, Bogaerts H, Storsaeter J. Declining pertussisincidence in Sweden following the introduction of acellular pertussis vaccine.Vaccine 2003;21:2015-21
Pertussis toxoid causes a small but significant reduction of the immunogenicityof diphtheria toxoid and tetanus toxoid. Trollfors B, Taranger J, Lagergård T,Sundh V. Reduced immunogenicity of diphtheria and tetanus toxoids whencombined with pertussis toxoid. Pediatr Infect Dis J. 2005 Jan;24(1):85-6.
A booster dose of acellular pertussis vaccine is warranted from 5 to 7 years ofage Gustafsson L, Hessel L, Storsaeter J, Olin P. Long term follow-up ofSwedish children vaccinated with acellular pertussis vaccines at 3, 5, and12 months of age indicates the need for a booster dose at 5 to 7 years of age.Pediatrics September 2006; 118:3 978-984
Complementary strategies are needed to achieve further reduction in morbidityfrom circulation of Bordetella pertussis Carlsson RM1, Trollfors B. Control ofpertussis-lessons learnt from a 10-year surveillance programme in Sweden.Vaccine. 2009; 27:5709-18.
A universal adolescent booster vaccination will reduce the incidence of pertussisin the target group but the duration of immunity is uncertain. Hallander HO,Nilsson L, Gustafsson L. Is adolescent pertussis vaccination preferable tonatural booster infections? Expert Rev Clin Pharmacol. 2011 Nov;4(6):705-11
The first dose of vaccine has a significant effect on the incidence and associatedcomplications of pertussis, and we find 38% fewer hospitalised infants in the3-<9 month age group Nilsson L, Lepp T, von Segebaden K, Hallander H,Gustafsson L. Pertussis vaccination in infancy lowers the incidence ofpertussis disease and the rate of hospitalisation after one and two doses:
100

analyses of 10 years of pertussis surveillance. Vaccine. 2012 May 2;30(21):3239-47
Age-specific contact patterns alone can explain shifts in prevalence and age-stratifiedincidence Rohani P, Zhong X, King AA. Contact network structure explainsthe changing epidemiology of pertussis. Science. 2010 Nov 12;330(6006):982-5
Pertussis among infants could be further reduced by increasing awareness ofpertussis in adults and adolescents and by strictly following the recommendedvaccination schedule Nilsson L, von Segebaden K, Blennow M, Linde A,Uhnoo I. Review Läkartidningen 2013; 110.
Pertussis immunization in infancy does not increase the risk of asthma medicationuse in adolescents. Vogt H, Bråbäck L, Kling A-M, Grunewald M, NilssonL. Pertussis immunization in infancy and adolescent asthma medication.Pediatrics 134; 2014: 721 -728
The probability of infection upon contact is age-independent, and we find elevatedprobabilities among children, adolescents and young adults whose contacts mightbe more intimate than others. Feng Z, Glasser JW, Hill AN, Franko MA, CarlssonRM, Hallander H, Tull P, Olin P. Modeling rates of infection with transientmaternal antibodies and waning active immunity: application to Bordetellapertussis in Sweden. Theor Biol. 2014 Sep 7; 356:123-32.
Surveillance of infant pertussis in Sweden 1998-2012: the severity of disease inrelation to the national vaccination programme. Carlsson R-M, von SegebadenK, Bergström J, Kling AM, Nilsson L. Euro Surveill. 2015;20(6):pii=21032.12 February 2015
101

7 References
Acosta AM, DeBolt C, Tasslimi A, et al. Tdap vaccine effectiveness in adolescentsduring the 2012 Washington State pertussis epidemic. Pediatrics. 2015;135(6):981-989
Advani A, Donnelly D, Hallander H. Reference system for characterisationof Bordetella pertussis PFGE-profiles. J. Clin. Microbiol 2004;42:2890-7
Advani A, et al, Changes in the Bordetella pertussis population duringvaccination with acellular pertussis vaccines in Sweden from 1997 to 2004during vaccination with acellular pertussis vaccines. APMIS 2007; 115:736-42.
Advani A, Gustafsson L, Carlsson RM, Donnelly D, Hallander H. Clinicaloutcome of pertussis in Sweden: association with Pulsed-Field Gel Electrophoresisprofiles and serotype. APMIS 2007; 115: 736-42.
Advani A, Van der Heide HG, Hallander HO, Mooi FR. Analysis of SwedishBordetella pertussis isolates with three typing methods: Characterization ofan epidemic lineage. J Microbiol Methods. 2009 Jul 2.
Amirthalingam G, Gupta S, Campbell H. Pertussis immunisation andcontrol in England and Wales, 1957 to 2012: a historical review. Euro Surveill.2013;18(38).
Amirthalingam G, Strategies to control pertussis in infants. Arch Dis Child.2013; 98(7):552-555.
Amirthalingam G, Gupta S, Campbell H. Pertussis immunisation andcontrol in England and Wales, 1957 to 2012: a historical review. Euro Surveill2013;18.
Amirthalingam G, Andrews N, Campbell H, Ribeiro S, Kara E, DoneganK, Fry NK, Miller E and Ramsay M. Effectiveness of maternal pertussisvaccination in England: an observational study. The Lancet.com Vol 384October 25, 2014.
Auger et al., Pediatrics 2013; 132: e1149-55
Baxter R, Bartlett J, Rowhani-Rahbar A, Fireman B, Klein NP. Effectivenessof pertussis vaccines for adolescents and adults: case-control study. BMJ2013; 347: f4249
Baxter R, Bartlett J, Fireman B, Lewis E, Klein NP. Effectiveness of vaccinationduring pregnancy to prevent infant pertussis. Pediatrics, Volume 139,number 5, May 2017.
Belloni C, de Silvestri A, Tinelli C, Avanzini MA, Marconi M, Strano F,Rondini G, Chirico G. Immunogenicity of a three-component acellular
102

pertussis vaccine administered at birth. Pediatrics 2003;111:1042-5.
Bento AI, Rohani P. Forecasting epidemiological consequences of maternalimmunization. Clin Infect Dis. 2016;63(suppl 4):S205-12.
Bento AI, King AA, Rohani P. Maternal Pertussis Immunisation: Clinicalgains and epidemiological legacy. Eurosurveillance, Volume 22, Issue 15, 13April 2017.
Bertilone C, Wallace T, Selvey LA. Finding the "who" in whooping cough:vaccinated siblings are important pertussis sources in infants 6 months ofage and under. Commun Dis Intell Q Rep. 2014;38(3).
Bisgard KM, Pascual FB, Ehresmann KR, et al. Infant pertussis: who wasthe source? Pediatr Infect Dis J. 2004; 23(11):985-989.
Briand V, Bonmarin I, Lévy-Bruhl D. Study of the risk factors for severechildhood pertussis based on hospital surveillance data. Vaccine. 2007;25(41):7224-7232.
Broutin et al. Impact of vaccination and birthrate on the epidemiology ofpertussis: comparative study in 64 countries. Proceedings of the RoyalSociety of London. Series B. Biological Sciences. 2010; 277: 3239-45.
Campbell P, McIntyre P, Quinn H, Hueston L, Gilbert GL, McVernon J.Increased population prevalence of low pertussis toxin antibody levels inyoung children preceding a record pertussis epidemic in Australia. PloSOne. 2012; 7(4): e35874.
Campbell H, Amirthalingam G, Andrews N, et al. Accelerating control ofpertussis in England and Wales. Emerg Infect Dis. 2012; 18(1):38-47.
Carlsson R-M, von Segebaden K, Bergström J, Kling AM, Nilsson L. Surveillanceof infant pertussis in Sweden 1998-2012; severity of disease in relation tothe national vaccination programme. 2015 Euro Surveill. 2015;20(6):pii=21032.12 February 2015
CDC 2001-2003. Centers for Disease Control and Prevention . Pertussis–UnitedStates, 2001–2003.MMWR, Morb Mortal Wkly Rep2005541283–1286.
CDC 2012. Centers for Disease Control and Prevention. Pertussis Epidemic— Washington, 2012. MMWR, Morb Mortal Wkly July 20, 2012 / 61(28);517-522.
Cherry JD. Epidemic pertussis in 2012-the resurgence of a vaccine-preventabledisease. N Engl J Med. 2012;367(9):785-7.
Dabrera G, Amirthalingam G, Andrews N, et al. A case-control study toestimate the effectiveness of maternal pertussis vaccination in protectingnewborn infants in England and Wales, 2012-2013. Clin Infect Dis. 2015;60(3):333–337.
103

de Greeff SC, Mooi FR, Schellekens JF, de Melker HE. Impact of acellularpertussis preschool booster vaccination on disease burden of pertussis inThe Netherlands. Pediatr Infect Dis J. 2008;27:218-23 (Comment in: PediatrInfect Dis J. 2008 Jun;27(6):573-4.)
de Greeff SC, Mooi FR, Westerhof A, Verbakel JM, Peeters MF, HeuvelmanCJ, Notermans DW, Elvers LH, Schellekens JF, de Melker HE. Pertussisdisease burden in the household: how to protect young infants. Clin InfectDis. 2010 50:1339-45.
de Melker HE, Schellekens JF, Neppelenbroek SE, Mooi FR, Rümke HC,Conyn-van Spaendonck MA. Reemergence of pertussis in the highly vaccinatedpopulation of the Netherlands: observations on surveillance data. EmergInfect Dis. 2000;6(4):348-57.
Dodie H, Crowcroft NS, Bramley JC, Miller E. UK guidelines for use oferythromycin chemoprophylaxis in persons exposed to pertussis. J PublHealth Med 2002;24:202-6
de Celle‘s DM, Magpantay FMG, King AA, Rohani P. The pertussis enigma:reconciling epidemiology, immunology and evolution. Proc. R. Soc. B, 2016;283: 20152309.
Donegan K, King B, Bryan P. Safety of pertussis vaccination in pregnantwomen in UK: observational study. BMJ 2014;349.
Elomaa A, Advani A, Donnelly D, Antila M, Mertsola J, He Q, HallanderH. Population dynamics of Bordetella pertussis in Finland and Sweden,neighboring countries with different vaccination histories. Vaccine 2007;25:918-26EU Commission decision 19 March 2002, Decision No 2119/98/EC
EPI-NEWS, Statens Serum Institut, Denmark 2016. http://www.ssi.dk/English/News/EPI-NEWS/2016/No%2016%20-%202016.aspx
Folkhelseinstituttet, Norge, February 2016. Situasjonen for kikhoste blantbarn under 1 år i Norge.Situasjonen for kikhoste blant barn under 1 år iNorge.
Forsyth KD, Campins-Marti M, Caro J, et al. Global Pertussis Initiative.New pertussis vaccination strategies beyond infancy: recommendations bythe global pertussis initiative. Clin Infect Dis. 2004;39(12):1802-1809.
Gonfiantini M V, Carloni E, Gesualdo F, Pandolfi E, Agricola E, RizzutoE, Iannazzo S, Ciofi Degli Atti M L, Villani A, Tozzi A E. Epidemiology ofpertussis in Italy: Disease trends over the last century. Eurosurveillance,Volume 19, Issue 40, 09 October 2014.
Greco D, Salmaso S, Mastrantonio P, et al. A controlled trial of two acellularvaccines and one whole-cell vaccine against pertussis. N Engl J Med, 1996;334:341-8
104

Grgic-Vitek M, Klavs I, Kraigher A. Re-emergence of pertussis in Slovenia:time to change immunization policy. Vaccine. 2008;26(15):1874-8.
Gustafsson L, Hallander HO, Olin P, Reizenstein E, Storsaeter J. A controlledtrial of a two-component acellular, a five-component acellular, and a whole-cellpertussis vaccine. N Engl J Med 1996;334:349-55
Gustafsson, L., Hallander, HO, Olin, P, Seven year report, Pertussis surveillancein Sweden, Progress Report October 1997 - September 2004. http://www.smittskyddsinstitutet.se/SMItemplates/Article____5894.aspx, 2005.
Gustafsson L, Hessel L, Storsaeter J, Olin P. Long-term follow-up of Swedishchildren vaccinated with acellular pertussis vaccines at 3, 5, and 12 monthsof age indicates the need for a booster dose at 5 to 7 years of age. Pediatrics2006;118:978-84.
Guyatt GH, Oxman AD, Vist GE, Kunz R, Falck-Ytter Y, Alonso-Coello P,et al., for the GRADE Working Group. GRADE: an emerging consensus onrating quality of evidence and strength of recommendations. BMJ 2008; 336:924-6.
Halasa NB, O’Shea A, Shi JR, Lafleur BJ, Edwards KM. Poor immuneresponses to a birth dose of diphtheria, tetanus and acellular pertussisvaccine. J Pediatr 2008; 153: 327-32.
Hallander, HO, Advani A, Donelly D, Gustafsson L and Carlsson RM.Shifts of Bordetella pertussis variants in Sweden from 1970 to 2003, duringthree periods marked by different vaccination programs. J Clin Microbiol2005;43:2856-65
Hallander HO, Andersson M, Gustafsson L, Ljungman M, Netterlid E.Seroprevalence of pertussis antitoxin (anti-PT) in Sweden before and 10years after the introduction of a universal childhood pertussis vaccinationprogram. APMIS. 2009; 117: 912-22.
Hallander HO, Gustafsson L. Efficacy and effectiveness of acellular pertussisvaccines: a 20-year Swedish experience. Expert Rev Vaccines. 2009 Oct;8(10):1303-7.
Hardy-Fairbanks AJ, Pan SJ, Decker MD, Johnson DR, Greenberg DP,Kirkland KB, et al. Immune responses in infants whose mothers receivedTdap vaccine during pregnancy. Pediatr Infect Dis J. 2013;32(11):1257-60.
Hethcote HW. Simulations of pertussis epidemiology in the United States:effect of adult booster vaccination. Math Biosci 1999;158:47-73.
Hoang HTT, Leuridan E, Maertens K, Nguyen TD, Hens N, Vu NH, et al.Pertussis vaccination during pregnancy in Vietnam: Results of a randomizedcontrolled trial Pertussis vaccination during pregnancy. Vaccine. 2016;34(1):151-9.
105

Jackson DW, Rohani P. Perplexities of pertussis: recent global epidemiologicaltrends and their potential causes. Review article. Epidemiol Infect. 2014;142: 672-84.
Jajosky RA, Hall PA, Adams DA, et al. Centers for Disease Control andPrevention (CDC). Summary of Notifiable diseases–United States, 2004.MMWR, Morb Mortal Wkly Rep2006531–79.
Jardine A, Conaty SJ, Lowbridge C, Staff M, Vally H. Who gives pertussisto infants? Source of infection for laboratory confirmed cases less than 12months of age during an epidemic, Sydney, 2009. Commun Dis Intell QRep. 2010;34(2):116-121.
Juretzko P, von Kries R, Hermann M, Wirsing von König CH, Weil J, GianiG. Effectiveness of acellular pertussis vaccine assessed by hospitalbasedactive surveillance in Germany. Clin Infect Dis. 2002;35(2):162-167.
Kaczmarek MC, Valenti L, Kelly HA, Ware RS, Britt HC, Lambert SB. Sevenfoldrise in likelihood of pertussis test requests in a stable set of Australiangeneral practice encounters, 2000-2011. Med J Aust 2013; 198(11): 624-8.
Kandola et al., Can J Infect Dis Med Microbiol 2005; 16: 271-4.
Kerr JR, Matthews RC. Bordetella pertussis infection: Pathogenesis, diagnosis,management, and the role of protective immunity. Eur J Clin MicrobiolInfect Dis 2000;19:77-88.
Klein NP, Bartlett J, Rowhani-Rahbar A, Fireman B, Baxter R. Waningprotection after fifth dose of acellular pertussis vaccine in children. NEJM2012; 367: 1012-9
Klein NP, Bartlett J, Fireman B, Baxter R. Waning Tdap Effectiveness inAdolescents. Pediatrics 2016; 37: e2 0153326
Knuf M, Schmitt HJ, Jacquet JM, Collard A, Kieninger D, Meyer CU, SiegristCA, Zepp F. Booster vaccination after neonatal priming with acellularpertussis vaccine. J Pediatrics 2010; 156: 675-8
Knuf M, Schmitt HJ, Wolter J, Schuerman L, Jacquet JM, Kieninger D,Siegrist CA, Zepp F. Neonatal vaccination with an acellular pertussis vaccineaccelerates the acquisition of pertussis antibodies in infants. J Pediatr2008;152:655-60
Koepke R, Eickhoff JC, Ayele RA, et al. Estimating the effectiveness oftetanus-diphtheria-acellular pertussis vaccine (Tdap) for preventing pertussis:evidence of rapidly waning immunity and difference in effectiveness byTdap brand. J Infect Dis.2014;210(6):942-953.
Kowalzik F, Barbosa AP, Fernandes VR, et al. Prospective multinationalstudy of pertussis infection in hospitalized infants and their household
106

contacts. Pediatr Infect Dis J. 2007;26(3):238-242
Ladhani SN, Andrews NJ, Southern J, Jones CE, Amirthalingam G, WaightPA, et al. Antibody responses after primary immunization in infants bornto women receiving a pertussis containing vaccine during pregnancy:single arm observational study with a historical comparator. Clin InfectDis. 2015;61(11):1637-44.
Lavine J, Björnstad O, Freiesleben de Blasio B, Storsaeter J. Shortlivedimmunity against pertussis, age-specific routes of transmission, and theutility of a teenage booster vaccine. Vaccine 2012; 30: 544-51.
Libster R, Edwards KM. 2012 Re-emergence of pertussis: what are thesolutions? Expert Rev. Vaccines 11, 1331-1346.
Liu BC, McIntyre P, Kaldor JM, Quinn HE, Ridda I, Banks E. Pertussis inolder adults: prospective study of risk factors and morbidity. Clin InfectDis. 2012 Dec;55(11):1450-6.
Locht C. Pertussis: acellular, whole-cell, new vaccines, what to choose?Expert Review of Vaccines, 15:6, 671-673, 2016.
Lugauer S, Heininger U, Cherry JD, Stehr S. Long-term clinical effectivenessof an acellular pertussis component vaccine and a whole cell componentvaccine. Eur J Pediatr 2002;161:142-6
Maertens K, Caboré RN, Vermeiren S, Hens N, Van Damme P, Leuridan E.Pertussis vaccination during pregnancy in Belgium: Follow-up of infantsuntil 1 month after the fourth infant pertussis vaccination at 15 months ofage. Vaccine 34 (2016) 3613–3619.
Maertens K, Caboré RN, Huygen K, Hens N, Van Damme P, Leuridan E.Pertussis vaccination during pregnancy in Belgium: Results of a prospectivecontrolled cohort study. Vaccine. 2016;34(1):142-50.
Maertens K, Hoang TT, Nguyen TD, Caboré RN, Duong TH, Huygen K,et al. The Effect of Maternal Pertussis Immunization on Infant VaccineResponses to a Booster Pertussis Containing Vaccine in Vietnam. Clin InfectDis. 2016;63(suppl 4):S197-204.
Masseria C, Martin CK, Girishanthy K, Becker LK, Buikema, A, Tan, TQ.Incidence and burden of pertussis among infants less than 1 year of age.Pediatric Infectious Disease Journal: March 2017 - Volume 36 - Issue 3 - pe54–e61.
Matthias J, Scott Pritchard P, Martin S, Dusek C, Cathey E, D’Alessio R, andKirsch M. Sustained Transmission of Pertussis in Vaccinated, 1–5-Year-OldChildren in a Preschool, Florida, USA.Emerg Infect Dis. 2016 Feb; 22(2):242–246.
107

Mertens PLJM, Borsboom GJJM, Richardus JH. A pertussis outbreak associatedwith social isolation among elderly nuns in a convent. Clin Infect Dis 2007;44: 266-8
Misegades LK, Winter K, Harriman K, et al. Association of childhoodpertussis with receipt of 5 doses of pertussis vaccine by time since lastvaccine dose, California, 2010. JAMA. 2012;308(20):2126-2132.
Moro PL, Cragan J, Tepper N, Zheteyeva Y, Museru O, Lewis P, Broder K.Enhanced surveillance of tetanus toxoid, reduced diphtheria toxoid, andacellular pertussis (Tdap) vaccines in pregnancy in the Vaccine AdverseEvent Reporting System (VAERS), 2011-2015. Vaccine. 2016 Apr 29;34(20):2349-53.
Munoz FM, Bond NH, Maccato M, Pinell P, Hammill HA, Swamy GK, etal. Safety and immunogenicity of tetanus diphtheria and acellular pertussis(Tdap) immunization during pregnancy in mothers and infants: a randomizedclinical trial. JAMA. 2014;311(17):1760-9.
National Health and Medical Research Council. The Australian ImmunisationHandbook. Canberra: Australian Government Department of Health andAgeing; 2003.
National Health Service 2014.
Nilsson L, Lepp T, von Segebaden K, Hallander H, Gustafsson L. Pertussisvaccination in infancy lowers the incidence of pertussis disease and the rateof hospitalisation after one and two doses: analyses of 10 years of pertussissurveillance. Vaccine 2012; 30: 3239-47.
Olin P. Vaccination programmes out of pace with vaccine development: acall for national vaccination registers. Invited commentary. Acta Paediatr1999;88:800-2
Olin P, Gustafsson L, Barreto L, Hessel L, Mast C, Van Rie A, BogaertsH, Storsaeter J. Declining pertussis incidence in Sweden following theintroduction of acellular pertussis vaccine. Vaccine 2003;21:2015-21
Olin P, Hallander HO: Marked decline in pertussis followed reintroductionof pertussis vaccination in Sweden. EuroSurveillance 1999;4:128-9
Olin P, Rasmussen F, Gustafsson L, Hallander HO, Heijbel H. for the AdHoc Group for the Study of Pertussis Vaccines: Randomised trial of two-component,three-component and five-component acellular pertussis vaccines comparedwith whole-cell pertussis vaccine. Lancet 1997;350:1569-77
Paddock CD, Sanden GN, Cherry JD, Gal AA, Langston C, Tatti KM, WuKH, Goldsmith CS, Greer PW, Montague JL, Eliason MT, Holman RC,Guarner J,
108

Pertussis vaccines: WHO position paper, August 2015-RecommendationsVaccine 34 (2016) 1423-1425
Pinto C, Portulez AC, Nogueira P, Costa A. Whooping cough epidemicpeak in Portugal, 2012. Stockholm: European Scientific Conference onApplied Infectious Diseases Epidemiology, 2013.
Plotkin SA. The pertussis problem. Clin. Infect. Dis. 2014, 58, 830-833.
Quinn H, McIntyre P. The impact of adolescent pertussis immunization,2004-2009; lessons from Australia. Bulletin of the World Health Organization.2011; 89: 666-74.
Quinn et al., Bull World Health Organ 2011; 89: 666-74.
Quinn HE, Snelling TL, Macartney KK, McIntyre PB. Duration of protectionafter first dose of acellular pertussis vaccine in infants. Pediatrics. 2014;133(3).
Regulation HSLF-FS 2015:6 from The Public Health Agency of Sweden(Swedish: Folkhälsomyndigheten) concerning vaccinations of children.
Reid S. The further and future evolution of the New Zealand immunizationschedule. The New Zealand Medical Journal. 2012; 125: 86-89.
Riolo MA, King AA, Rohani P. Can vaccine legacy explain the Britishpertussis resurgence? Vaccine. 2013;31(49):5903-8.
Ridda I, Yin JK, King C, MacIntyre CR, McIntyre P. The importance ofpertussis in older adults: A growing case for reviewing vaccination strategyin the elderly. Vaccine 2012; 30: 6745-52
Rohani P, Drake JM. The decline and resurgence of pertussis in the US.Epidemics 2011; 3: 183-8.
Rolfhamre, Jansson A, Arneborn M, Ekdahl K. SmiNet-2: Descriptionof an internet-based surveillance system for communicable diseases inSweden.Euro surveillance: bulletin Europeen sur les maladies transmissibles=European communicable disease bulletin, 2006; 11(5), 103-107.
Romanus V, Jonsell R, Bergquist S-O. Pertussis in Sweden after the cessationof general immunization in 1979. Pediatr Infect Dis J 1987;6:364-371
Rydevik, Lepp, Nilsson. Incidence of pertussis in childhood after primaryand booster vaccinations Poster at the European Society of Pediatric InfectiousDiseases. 2010
Salmaso S, Mastrantonio P, Tozzi AE, Stefanelli P, Anemona A, Ciofi degliAtti ML et al. Sustained efficacy during first 6 years of life of 3-componentacellular pertussis vaccines administered in infancy: The Italian experience.
109

Pediatrics 2001;108 (5) e81-95
Shapiro ED. Acellular vaccines and resurgence of pertussis. JAMA. 2012;308(20): 2149-50.
Sheridan SL, Ware RS, Grimwood K, Lambert SB. Number and order ofwhole cell pertussis vaccines in infancy and disease protection. JAMA.2012;308 (5):454-456
Shieh WJ, Zaki SR. Pathology and pathogenesis of fatal Bordetella pertussisinfection in infants. CID 2008;47:328-338.
Sizaire V, Garrido-Estepa M, Masa-Calles J, Martinez de Aragon M V. Increasepf pertussis incidence in 2010-2012 after 12 years of low circulation in Spain.Euro Surveill. 2014;19(32).
Skoff T, Kenyon C, Cocoros N, Liko J, Miller L, Kudish K, Baumbach J,Zansky S, Faulkner A, Martin S. Sources of Infant Pertussis Infection in theUnited States. Pediatrics. October 2015, VOLUME 136 / ISSUE 4.
Skowronski DM, De Serres G, MacDonald D, Wu W, Shaw C, Macnabb J, etal. The changing age and seasonal profile of pertussis in Canada. J InfectDis. 2002;185(10):1448-53.
Skowronski DM, Janjua NZ, Tsafack EPS, Ouakki M, Hoang L, De Serres G.The number needed to vaccinate to prevent infant pertussis hospitalizationand death through parent cocoon immunization. Clin Infect Dis 2012; 54:318-27.
Socialstyrelsens meddelandeblad nr 23/1982. Information om åtgärder motoch vid kikhosta.
Somerville RL, Grant CC, Scragg RK, Thomas MG Hospitalisations due topertussis in New Zealand in the pre-immunisation and mass immunisationeras. J Paediatr Child Health. 2007 Mar;43(3):147-53.
Sowdhamini S, Wallace DO, Cruz AT, Quinonez RA, Caviness AC. RiskFactors for Complications in hospitalized young infants presenting withuncomplicated pertussis. Hospital Pediatrics. Volume 1, Issue 1, 2011.
Tami H, Skoff M, Stacey W, Martin M. Impact of Tetanus Toxoid, ReducedDiphtheria Toxoid, and Acellular Pertussis Vaccinations on Reported PertussisCases Among Those 11 to 18 Years of Age in an Era of Waning PertussisImmunity. A Follow-up Analysis.JAMA Pediatr. 2016;170(5):453-458.
Tanaka M, Vitek CR, Pascual BF, Bisgard KM, DVM, Tate JE, Murphy TV.Trends in pertussis among infants in the United States, 1980-1999. JAMA,December 10, 2003, Volume 290, No 22.
Taranger J, Trollfors B, Lagergård T, Lind L, Sundh V, Zackrisson G, et al.
110

Unchanged efficacy of a pertussis toxoid vaccine throughout the two yearsafter the third vaccination of infants. Pediatr Infect Dis J. 1997;16:180-4.
Tejpratap T, Baughman AL, Clark T. First Pertussis Vaccine Dose and Preventionof Infant Mortality. Pediatrics. June 2015, VOLUME 135 / ISSUE 6
Torvaldsen S, McIntyre PB. Effect of the preschool pertussis booster onnational notifications of disease in Australia. Pediatr Infect Dis J. 2003;22:956-9.
Trollfors B, Taranger J, Lagergård T et al, Lind L, Sundh V, ZachrissonG, Lowe CH, Blackwelder W, Robbins J. A placebo-controlled trial of apertussis-toxoid vaccine. N Engl J Med 1995;333:1045-50
Vaccinationsuppföljning - Seroepidemiologisk tvärsnittsstudie 2007.(www.folkhalsomyndigheten.se)
van Boven M, de Melker HE, Schellekens JF, Kretzschmar M. Waningimmunity and sub-clinical infection in an epidemic model: implicationsfor pertussis in the Netherlands. Math Biosci 2000;164:161-82
van der Maas NA, Mooi FR, de Greeff SC, Berbers GA, Spaendonck MA, deMelker HE. Pertussis in the Netherlands, is the current vaccination strategysufficient to reduce disease burden in young infants? Vaccine. 2013 Sep23;31(41):4541-7.
Voysey M, Kelly DF, Fanshawe TR, Sadarangani M, O’Brien KL, PereraR, Pollard AJ. The influence of maternally derived antibody and infantage at vaccination on infant vaccine responses. An individual participantmeta-analysis. JAMA Pediatr. 2017;171(7):637-646.
Wassilak SGF, Fine P. Session IV. Rapporteurs’ summary. In: Brown F,Greco D, Mastrantonio P, Salmaso S, Wassilak S, editors. Pertussis vaccinetrials. Dev Biol Stand, Basel, Karger, 1997;89:187-93
Wendelboe AM, Van Rie A, Salmaso S, Englund JA. Duration of immunityagainst pertussis after natural infection or vaccination. Pediatr Infect Dis J.2005;24(5 Suppl):S58-61.
Wendelboe AM, Njamkepo E, Bourillon A, et al; Infant Pertussis StudyGroup. Transmission of Bordetella pertussis to young infants. Pediatr InfectDis J. 2007; 26(4):293-299.
Winter K, Harriman K, Zipprich J, et al. California pertussis epidemic, 2010.J Pediatr. 2012;161(6):1091-1096.
Winter K, Glaser C, Watt J, MD2, Harriman K. Pertussis Epidemic — California,2014. MMWR Morb Mortal Wkly. December 5, 2014 / 63(48);1129-1132.
Winter K, Nickell S, Powell M, Harriman K. Effectiveness of prenatal versuspostpartum tetanus, diphtheria, and acellular pertussis vaccination in
111

preventing infant pertussis. Clin Infect Dis. 2017;64(1):3–8.
WHO position paper. Pertussis vaccines. Wkly. Epidemiol. Rec. 2010;85(40):385-400.
WHO position paper 2015. Pertussis vaccines. Weekly epidemiologicalrecord. 28 August 2015. No. 35, 2015, 90, 433-460.
WHO meeting on case definition of pertussis. Geneva, 10-11 January 1991.
Geneva: WHO, MIN/EPI/PET/91. 1:4-5
WHO surveillance definition of February 2003, WHO/VB/03.01
Witt MA, Katz PH, Witt DJ. Unexpectedly limited durability of immunityfollowing acellular pertussis vaccination in preadolescents in a NorthAmerican outbreak. Clin Infect Dis 2012;54(12):1730-5
Yih WK, Lett SM, des Vignes FN, Garrison KM, Sipe PL, Marchant CD Theincreasing incidence of pertussis in Massachusetts’ adolescents and adults,1989-1998. J Infect Dis 2000;182:1409-16.
Zeddeman A1, van Gent M, Heuvelman CJ, van der Heide HG, Bart MJ,Advani A, Hallander HO, Wirsing von Konig CH, Riffelman M, StorsaeterJ, Vestrheim DF, Dalby T, Krogfelt KA, Fry NK, Barkoff AM, Mertsola J,He Q, Mooi F. Investigations into the emergence of pertactin-deficientBordetella pertussis isolates in six European countries, 1996 to 2012. EuroSurveill. 2014 Aug 21;19(33).
Årsrapport 2016. Barnvaccinationsprogrammet årsrapport 2016. Artikelnummer:00741-2017. Årsrapport 2016
Pertussis surveillance yearly progress reports
1-year report. Pertussis surveillance in Sweden. Progress Report October1997 - September 1998. Swedish Institute for Infectious Disease Control1999.
3-year report. Pertussis surveillance in Sweden. Progress Report October1997 - September 2000. Swedish Institute for Infectious Disease Control2001.
4-year report. Pertussis surveillance in Sweden. Progress Report October1997 - September 2001. Swedish Institute for Infectious Disease Control 3February 2002.
5-year report. Pertussis surveillance in Sweden. Progress Report October1997 - September 2002. Gustafsson L, Hallander HO, Advani A, Olin P.Swedish Institute for Infectious Disease Control 3 February 2003.
6-year report. Pertussis surveillance in Sweden, progress report October
112

1997 - September 2003 with an executive summary. Gustafsson L, HallanderHO, Advani A, Carlsson RM, Olin P. Smittskyddsinstitutets rapportserie2:2004 (available at www.folkhalsomyndigheten.se).
7-year report. Pertussis surveillance in Sweden, Progress Report October1997 - September 2004. Gustafsson, L., Hallander, HO, Olin, P,
8-year report. Pertussis surveillance in Sweden, progress report October1997 - September 2005 with an executive summary. Carlsson RM, GustafssonL, Hallander HO. Smittskyddsinstitutets rapportserie 4:2006 (available atwww.folkhalsomyndigheten.se).
9-year report. Pertussis surveillance in Sweden; Progress report October1997 - September 2006 with an executive summary. Carlsson RM, GustafssonL. Smittskyddsinstitutets rapportserie 1:2007 (available at www.folkhalsomyndigheten.se).
10-year report. Pertussis surveillance in Sweden; Progress report October1997 - September 2007 with an executive summary. Carlsson RM, GustafssonL. Smittskyddsinstitutets rapportserie 4:2008 (available at www.folkhalsomyndigheten.se).
11-year report. Pertussis surveillance in Sweden; Progress report October1997 - December 2008 with an Executive summary. Nilsson L, Rydevik G.Smittskyddsinstituetets rapportserie x:2009 (available at www.folkhalsomyndigheten.se).
12-year report. Pertussis surveillance in Sweden; Progress report October1997 - December 2009 with an Executive summary. Nilsson L, GrünewaldM, Kling A-M. Smittskyddsinstituetets rapportserie x:2010 (available atwww.folkhalsomyndigheten.se.
13-year report. Pertussis surveillance in Sweden; Progress report October1997 - December 2010 with an Executive summary. Nilsson L, GrünewaldM, Kling A-M. Smittskyddsinstitutets rapportserie x:2011 (available at www.folkhalsomyndigheten.se)
14-year report. Pertussis surveillance in Sweden; Progress report October1997 - December 2009 with an Executive summary. Nilsson L, GrünewaldM, Kling A-M. Smittskyddsinstitutets rapportserie: 2012 (available at www.folkhalsomyndigheten.se)
15-year report. Ridda I, Yin JK, King C, MacIntyre CR, McIntyre P. Theimportance of pertussis in older adults: A growing case for reviewingvaccination strategy in the elderly. Vaccine 2012; 30: 6745-52
16-year report. Pertussis surveillance in Sweden; Progress report October1997 - December 2013 with an Executive summary. Nilsson L, Kling A-M,von Segebaden K, Grünewald M, Kling A-M och Bergström J. Folkhälsomyndigheten
113

2014. Article number: ISBN 978-91-7603-445-3 (available at www.folkhalsomyndigheten.se)
17-year report. Pertussis surveillance in Sweden. Progress report October1997-December 2014 with an executive summary. Aronsson B, von SegebadenK, Bergström J and Källberg H. Folkhälsomyndigheten, 2015. Articel number:16026 ISBN 978-91-7603-660-0 (available at www.folkhalsomyndigheten.se)
18-year report. Pertussis surveillance in Sweden. Progress report October1997-December 2015 with an executive summary. Aronsson B, Drakes-JämtbergK, Emma Byström, Källberg H. Folkhälsomyndigheten, 2016. Articel number:Artikelnummer: 16109 ISBN 978-91-7603-735-5 (pdf) (available at www.folkhalsomyndigheten.se)
114

8 Appendix
8.1 Information
Below are the contents of the tables and figures mentioned in Chapter 2and those included in the Appendix.
8.2 Tables referring to Chapter 2.1 to 2.9
Tables 1 to 3 Appendix to Figure 8 in the main report and show case reportsin numbers for:
Table 1 Appendix: Linked to Figure 8. All of Sweden per month from2004 to 2016
Table 2 Appendix: Linked to Figure 8. Sweden excluding VästraGötaland
Table 3 Appendix: Linked to Figure 8. Västra Götaland.
Table 4 Appendix: Number of pertussis cases in Västra Götaland,1986 2016
Table 5 Appendix: Incidence of pertussis in Västra Götaland, 19862016
Table 6 Appendix: Linked to Figure 10 in the main report
Table 7 Appendix: Linked to Figure 11 A-E in the main report
Table 8 Appendix: Linked to Figure 12 in the main report
Table 9 Appendix: Linked to Figure 18 A-E in the main report
115

Table 10 Appendix: Spasmodic cough, Gothenburg study area
Table 11 Appendix: Spasmodic cough, Sweden excluding the Gothenburgstudy area
Table 12 Appendix: Pertussis cases, Sweden excluding the Gothenburgstudy area
Table 13 Appendix: Pertussis cases, Gothenburg study area
Table 14 Appendix: unvaccinated children, Sweden excluding theGothenburg study area
Table 15 Appendix: unvaccinated children, Gothenburg study area
Table 16 Appendix: Incidence in infants from case report data (SmiNet)
Table 17 Appendix: Mean incidence in 10-year intervals from case reportdata (SmiNet)
116

Table 1 Appendix, see Chapter 2.1.2, Figure 8.
Year Jan Feb Mar Apr May Jun Jul Aug Sep Oct Nov Dec
2004 71 67 75 71 161 130 130 166 119 122 143 1522005 155 90 48 46 83 63 61 87 105 93 125 1122006 83 68 45 28 49 29 26 60 50 46 75 482007 79 92 58 31 58 37 45 36 37 42 29 182008 38 23 22 50 26 27 10 22 59 45 21 302009 27 24 27 23 13 22 15 23 29 22 10 252010 30 18 20 21 14 24 12 21 11 26 27 282011 15 9 17 15 10 7 13 20 20 24 7 122012 15 10 13 13 10 3 14 29 30 38 48 462013 36 18 8 10 8 9 18 43 23 13 20 172014 16 8 9 13 20 27 49 88 154 113 92 992015 70 68 42 47 39 28 38 62 65 47 35 412016 24 29 20 20 19 24 27 94 70 93 128 99
Table 1 Appendix: Number of cases diagnosed with pertussis, per month.Data are from case reports of pertussis, reported to SmiNet, according tothe Communicable Disease Act.
117

Table 2 Appendix, see Chapter 2.1.2, related to Figure 8.
Year Jan Feb Mar Apr May Jun Jul Aug Sep Oct Nov Dec
2004 48 44 47 31 73 72 80 72 73 54 86 942005 108 58 41 31 61 46 42 72 95 80 107 972006 67 63 38 25 41 26 26 45 36 38 56 412007 64 88 54 27 51 33 43 30 28 39 26 172008 25 18 20 25 14 16 4 17 53 32 11 222009 21 16 25 18 12 17 12 17 23 20 10 222010 21 14 16 21 10 16 9 21 11 24 26 212011 13 8 17 13 8 7 11 17 18 23 7 122012 14 9 12 13 10 2 11 23 23 30 46 392013 35 18 8 7 7 8 16 36 18 11 18 152014 15 8 9 13 19 26 42 79 137 107 82 882015 59 58 31 42 38 25 33 52 55 36 30 372016 23 27 20 16 16 22 25 72 51 77 108 86
Table 2 Appendix: Number of cases diagnosed with pertussis per month inSweden excluding Västra Götaland Data are from case reports of pertussis,reported to SmiNet, according to the Communicable Disease Act.
118

Table 3 Appendix, see Chapter 2.1.2, related to Figure 8.
Year Jan Feb Mar Apr May Jun Jul Aug Sep Oct Nov Dec
2004 23 23 28 40 88 58 50 94 46 68 57 582005 47 32 7 15 22 17 19 15 10 13 18 152006 16 5 7 3 8 3 0 15 14 8 19 72007 15 4 4 4 7 4 2 6 9 3 3 12008 13 5 2 25 12 11 6 5 6 13 10 82009 6 8 2 5 1 5 3 6 6 2 0 32010 9 4 4 0 4 8 3 0 0 2 1 72011 2 1 0 2 2 0 2 3 2 1 0 02012 1 1 1 0 0 1 3 6 7 8 2 72013 1 0 0 3 1 1 2 7 5 2 2 22014 1 0 0 0 1 1 7 9 17 6 10 112015 11 10 11 5 1 3 5 10 10 11 5 42016 1 2 0 4 3 2 2 22 19 16 20 13
Table 3 Appendix: Number of cases diagnosed with pertussis per monthin Västra Götaland. Data are from case reports of pertussis, reported toSmiNet, according to the Communicable Disease Act.
119

Age
1991
1992
1993
1994
1995
1996
1997
1998
1999
2000
2001
2002
2003
2004
2005
2006
2007
2008
2009
2010
2011
2012
2013
2014
2015
2016
021
013
120
621
119
973
2617
5882
5110
648
147
4229
1614
1011
613
109
1423
128
022
637
235
830
397
198
1859
2034
1041
145
27
22
01
12
32
234
227
733
140
937
311
038
68
2226
3010
336
42
11
11
13
43
13
315
220
358
404
309
132
4017
1425
1821
318
105
12
21
00
22
34
421
918
931
331
334
713
453
2126
2517
198
303
23
31
11
20
02
15
153
140
242
198
206
101
3716
2446
1224
644
64
30
10
01
00
43
612
310
512
811
416
789
2919
5744
3325
951
152
44
02
00
00
11
739
4679
8697
4422
1641
5030
2812
4313
45
60
30
10
10
18
4118
2949
4418
148
3242
2821
1138
115
07
01
00
10
11
915
1224
2032
153
711
3018
2012
309
21
153
41
00
01
110
126
125
169
23
1623
712
323
158
27
00
00
01
02
116
26
188
11
110
1511
78
178
12
11
01
01
13
112
43
83
42
22
68
98
619
165
12
01
00
00
02
134
14
40
00
14
92
67
1510
33
51
00
00
00
214
40
34
01
00
33
24
19
51
23
41
00
00
11
150
11
21
00
13
12
21
35
33
66
20
10
10
016
10
13
21
11
17
12
14
51
06
11
11
23
11
170
13
00
11
00
00
00
21
13
20
11
10
21
118
11
01
00
00
02
01
03
02
11
01
00
01
30
191
01
10
10
01
20
01
12
11
01
00
00
30
120
-24
55
614
32
11
31
12
08
20
21
21
21
15
38
25-2
915
1616
1812
53
13
22
22
83
30
51
10
00
59
630
-34
1722
1629
167
01
15
35
113
62
02
11
02
05
79
35-3
98
19
1413
80
30
82
54
88
00
42
50
14
24
1140
-44
48
59
30
00
01
24
211
43
07
00
03
06
46
45-4
91
14
83
21
10
00
21
42
11
21
00
10
05
450
-54
66
63
41
20
10
12
02
32
10
20
11
01
33
55-5
91
410
62
20
00
20
12
41
20
01
00
20
11
260
-64
107
43
32
10
01
00
12
42
12
10
01
01
20
65+
812
1011
104
21
23
22
22
12
21
21
03
17
76
Tota
l18
4514
6122
0723
1821
7786
229
815
234
351
830
039
517
263
323
010
562
116
4742
1537
2663
8610
4
Tabl
e4
App
endi
x:N
um
ber
ofla
bora
tory
-rep
orte
dca
ses
ofp
ertu
ssis
ind
efine
dag
e-gr
oup
sfr
om19
91to
Dec
3120
16Fo
rla
bora
tory
-con
firm
edca
ses
repo
rted
toSm
iNet
betw
een
1997
and
Dec
31,2
016.
Dat
abe
fore
1997
are
from
volu
ntar
ilyre
port
sfr
omba
cter
iolo
gica
llab
orat
orie
s.
120

Age
1991
1992
1993
1994
1995
1996
1997
1998
1999
2000
2001
2002
2003
2004
2005
2006
2007
2008
2009
2010
2011
2012
2013
2014
2015
2016
098
6.4
619.
799
7.1
1067
.310
79.6
433.
816
4.4
110.
237
9.2
534.
132
7.9
667.
729
2.4
871.
524
6.0
164.
987
.575
.652
.956
.130
.868
.051
.946
.371
.711
6.0
113
56.1
1061
.917
59.9
1735
.215
31.3
525.
611
2.8
50.4
115.
938
3.1
129.
221
7.2
62.7
248.
582
.529
.111
.338
.110
.810
.50.
05.
15.
210
.315
.210
.12
1741
.413
45.9
1559
.719
34.3
1806
.055
7.2
206.
735
.750
.414
1.4
168.
119
2.8
63.7
206.
436
.323
.511
.65.
65.
45.
45.
35.
115
.220
.615
.35.
03
1686
.911
19.6
1735
.918
91.3
1452
.263
9.5
202.
892
.483
.215
7.0
115.
113
5.0
19.2
114.
362
.430
.15.
911
.511
.25.
40.
00.
010
.110
.115
.320
.14
1231
.110
10.9
1588
.015
06.2
1615
.363
0.0
257.
110
6.7
141.
214
8.0
106.
512
1.0
51.2
191.
219
.012
.518
.017
.55.
85.
65.
410
.70.
00.
010
.05.
05
881.
278
7.0
1289
.299
4.9
983.
946
9.7
174.
177
.712
1.9
249.
270
.714
9.6
38.1
280.
738
.225
.318
.60.
05.
80.
00.
05.
40.
00.
019
.814
.96
726.
460
2.1
715.
960
1.2
832.
642
5.2
135.
289
.627
6.8
222.
917
8.1
146.
555
.932
2.9
95.3
12.7
25.1
24.7
0.0
11.6
0.0
0.0
0.0
0.0
5.1
4.9
723
9.7
270.
945
1.1
476.
050
7.5
219.
210
5.1
74.5
192.
824
1.8
151.
415
0.4
70.0
266.
482
.225
.331
.537
.50.
017
.80.
05.
70.
05.
30.
05.
18
253.
811
0.2
169.
927
6.6
241.
194
.069
.638
.114
8.8
197.
013
4.8
105.
559
.022
1.5
68.1
31.5
0.0
43.9
0.0
6.1
0.0
0.0
5.6
0.0
5.2
5.1
992
.173
.914
6.0
115.
817
9.2
82.1
15.6
34.7
52.4
139.
184
.195
.960
.116
0.2
52.3
12.3
6.3
94.1
18.7
24.8
6.1
0.0
0.0
0.0
5.4
5.2
1073
.836
.773
.530
.191
.950
.310
.915
.679
.310
9.0
32.3
55.8
14.3
114.
879
.946
.312
.243
.60.
00.
00.
00.
00.
05.
60.
010
.611
36.9
12.2
36.5
109.
147
.75.
75.
65.
552
.074
.151
.932
.237
.181
.139
.95.
311
.56.
16.
20.
06.
20.
06.
05.
716
.65.
412
25.2
18.4
48.7
18.1
24.0
11.9
11.4
11.1
32.7
41.4
44.2
37.6
27.5
88.0
76.2
24.8
5.3
11.4
0.0
6.2
0.0
0.0
0.0
0.0
0.0
10.9
1325
.16.
324
.424
.10.
00.
00.
05.
722
.248
.810
.329
.432
.868
.546
.114
.214
.926
.35.
70.
00.
00.
00.
00.
00.
011
.214
24.6
0.0
18.7
24.2
0.0
6.0
0.0
0.0
17.1
16.6
10.8
20.5
4.9
42.0
22.8
4.6
9.4
14.8
20.9
5.7
0.0
0.0
0.0
0.0
5.9
5.7
150.
06.
16.
212
.46.
00.
00.
06.
017
.75.
711
.010
.75.
114
.623
.313
.613
.828
.229
.410
.40.
05.
90.
06.
00.
00.
016
5.5
0.0
6.1
18.5
12.3
6.0
5.9
5.9
5.9
41.2
5.6
10.9
5.3
20.3
24.2
4.6
0.0
27.3
4.7
4.9
5.2
5.6
11.7
17.7
5.8
5.8
170.
05.
517
.50.
00.
06.
16.
00.
00.
00.
00.
00.
00.
010
.65.
14.
813
.89.
00.
04.
64.
85.
10.
011
.45.
85.
718
5.3
5.3
0.0
5.8
0.0
0.0
0.0
0.0
0.0
11.7
0.0
5.8
0.0
16.2
0.0
10.1
4.8
4.6
0.0
4.5
0.0
0.0
0.0
5.4
16.8
0.0
195.
20.
05.
35.
40.
05.
90.
00.
05.
911
.70.
00.
05.
85.
510
.85.
35.
00.
04.
50.
00.
00.
00.
014
.90.
05.
520
-24
4.9
5.0
6.1
14.2
3.1
2.1
1.1
1.1
3.4
1.1
1.1
2.3
0.0
8.8
2.2
0.0
2.1
1.0
1.9
0.9
1.8
0.9
0.9
4.3
2.6
7.2
25-2
913
.814
.314
.216
.211
.04.
72.
91.
02.
91.
92.
02.
02.
08.
23.
13.
10.
05.
01.
01.
00.
00.
00.
04.
47.
74.
930
-34
17.2
22.4
16.1
28.3
15.1
6.4
0.0
0.9
0.9
4.6
2.8
4.7
1.0
12.4
5.7
1.9
0.0
2.0
1.0
1.0
0.0
2.0
0.0
4.8
6.6
8.3
35-3
98.
21.
09.
114
.113
.18.
10.
03.
00.
07.
61.
84.
53.
57.
17.
30.
00.
03.
81.
94.
70.
01.
03.
92.
03.
910
.740
-44
3.8
7.7
4.9
9.1
3.1
0.0
0.0
0.0
0.0
1.0
2.0
4.0
2.0
10.7
3.8
2.7
0.0
6.2
0.0
0.0
0.0
2.8
0.0
5.6
3.7
5.6
45-4
91.
00.
93.
77.
42.
81.
91.
01.
00.
00.
00.
02.
01.
04.
02.
01.
01.
02.
01.
00.
00.
00.
90.
00.
04.
53.
650
-54
7.7
7.5
7.1
3.4
4.2
1.0
1.9
0.0
0.9
0.0
1.0
2.0
0.0
2.0
3.1
2.1
1.0
0.0
2.0
0.0
1.0
1.0
0.0
1.0
2.8
2.7
55-5
91.
45.
814
.38.
32.
72.
60.
00.
00.
02.
20.
01.
01.
93.
81.
02.
00.
00.
01.
00.
00.
02.
10.
01.
01.
02.
160
-64
14.3
10.1
5.8
4.4
4.5
3.0
1.5
0.0
0.0
1.4
0.0
0.0
1.3
2.4
4.5
2.1
1.0
2.0
1.0
0.0
0.0
1.0
0.0
1.1
2.2
0.0
65+
3.1
4.6
3.9
4.2
3.8
1.5
0.8
0.4
0.8
1.2
0.8
0.8
0.8
0.8
0.4
0.8
0.8
0.4
0.7
0.4
0.0
1.0
0.3
2.3
2.2
1.9
Tota
l12
7.7
100.
615
1.2
157.
614
7.1
58.1
20.1
10.2
23.1
34.7
20.0
26.3
11.4
41.7
15.1
6.8
4.0
7.5
3.0
2.7
0.9
2.3
1.6
3.9
5.2
6.3
Tabl
e5
App
endi
x:In
cid
ence
ofla
bora
tory
-rep
orte
dca
ses
ofp
ertu
ssis
ind
efine
dag
e-gr
oup
sfr
om19
91to
Dec
3120
16Fo
rla
bora
tory
-con
firm
edca
ses
repo
rted
toSm
iNet
betw
een
1997
and
Dec
31,2
016.
Dat
abe
fore
1997
are
from
volu
ntar
ilyre
port
sfr
omba
cter
iolo
gica
llab
orat
orie
s.
121

Table 6 Appendix, see Chapter 2.1.3, Figure 10 in the main report.
Age 1986-1995 1997-2016
0 842.5 109.61 1290.6 27.72 1578.3 39.43 1531.0 43.64 1346.2 70.85 988.0 75.86 705.0 87.07 382.1 75.68 203.8 60.09 114.7 43.410 65.5 33.111 37.9 24.312 25.0 19.513 17.2 15.614 10.5 12.815 8.9 10.516 6.2 10.117 5.1 7.818 4.7 5.619 5.1 4.220-24 6.3 2.725-29 14.2 2.830-34 16.0 2.935-39 9.6 3.440-44 5.4 3.045-49 3.2 1.950-54 4.2 1.655-59 4.4 1.460-64 4.8 1.665+ 2.6 1.3
Table 6 Appendix: Mean incidence (per 100,000 person years) of pertussisin defined age groups during the 10 calendar years before (1986–1995) andduring the 20 years after the (1997-2016) introduction of DTaP in 1996. Dataare from case reports of pertussis, reported to SmiNet, according to theCommunicable Disease Act. Age at date for the positive sample.
122

Table 7 Appendix, see Chapter 2.1.3, Figure 11 A-E in the main report.
123

Time period Gothenburg Included Onset of pertussis Person years Number of cases Incidence 95% C.I.Time period
Oct 1997 - Dec 2002 No During 1 year of age 434,346 71 16 13-21Oct 1997 - Dec 2002 No During 2years of age 424,062 81 19 15-24Oct 1997 - Dec 2002 No During 3years of age 413,982 79 19 15-24Oct 1997 - Dec 2002 No During 4years of age 407,196 67 16 13-21Oct 1997 - Dec 2002 No During 5years of age 406,920 38 9 7-13Oct 1997 - Dec 2002 No During 6years of age 368,184 23 6 4-9Oct 1997 - Dec 2002 No During 7years of age 287,742 0 0 0-1Oct 1997 - Dec 2002 No During 8years of age 207,930 0 0 0-2Oct 1997 - Dec 2002 No During 9years of age 127,002 0 0 0-3Oct 1997 - Dec 2002 No During 10years of age 43,086 0 0 0-9Jan 2003 - Dec 2008 No During 1 year of age 838,602 59 7 5-9Jan 2003 - Dec 2008 No During 2years of age 818,808 63 8 6-10Jan 2003 - Dec 2008 No During 3years of age 800,322 63 8 6-10Jan 2003 - Dec 2008 No During 4years of age 783,042 72 9 7-12Jan 2003 - Dec 2008 No During 5years of age 768,414 87 11 9-14Jan 2003 - Dec 2008 No During 6years of age 759,444 122 16 13-19Jan 2003 - Dec 2008 No During 7years of age 711,804 144 20 17-24Jan 2003 - Dec 2008 No During 8years of age 621,912 118 19 16-23Jan 2003 - Dec 2008 No During 9years of age 534,198 90 17 14-21Jan 2003 - Dec 2008 No During 10years of age 450,006 37 8 6-11Jan 2003 - Dec 2008 No During 11years of age 368,184 13 4 2-6Jan 2003 - Dec 2008 No During 12years of age 287,742 8 3 1-5Jan 2003 - Dec 2008 No During 13years of age 207,930 2 1 0-3Jan 2003 - Dec 2008 No During 14years of age 127,002 0 0 0-3Jan 2003 - Dec 2008 No During 15years of age 43,086 0 0 0-9Jan 2003 - Dec 2008 Yes During 1 year of age 935,238 123 13 11-16Jan 2003 - Dec 2008 Yes During 2years of age 912,474 106 12 10-14Jan 2003 - Dec 2008 Yes During 3years of age 891,234 91 10 8-13Jan 2003 - Dec 2008 Yes During 4years of age 871,470 119 14 11-16Jan 2003 - Dec 2008 Yes During 5years of age 854,568 136 16 13-19Jan 2003 - Dec 2008 Yes During 6years of age 843,834 190 23 19-26Jan 2003 - Dec 2008 Yes During 7years of age 790,338 206 26 23-30Jan 2003 - Dec 2008 Yes During 8years of age 690,294 142 21 17-24Jan 2003 - Dec 2008 Yes During 9years of age 592,806 100 17 14-21Jan 2003 - Dec 2008 Yes During 10years of age 499,164 44 9 6-12Jan 2003 - Dec 2008 Yes During 11years of age 408,210 13 3 2-5Jan 2003 - Dec 2008 Yes During 12years of age 318,906 9 3 1-5Jan 2003 - Dec 2008 Yes During 13years of age 230,310 2 1 0-3Jan 2003 - Dec 2008 Yes During 14years of age 140,544 0 0 0-3Jan 2003 - Dec 2008 Yes During 15years of age 47,646 0 0 0-8Jan 2009 - Dec 2013 No During 1 year of age 510,072 47 9 7-12Jan 2009 - Dec 2013 No During 2years of age 508,452 36 7 5-10Jan 2009 - Dec 2013 No During 3years of age 504,816 46 9 7-12Jan 2009 - Dec 2013 No During 4years of age 500,256 36 7 5-10Jan 2009 - Dec 2013 No During 5years of age 494,988 35 7 5-10Jan 2009 - Dec 2013 No During 6years of age 486,078 31 6 4-9Jan 2009 - Dec 2013 No During 7years of age 475,188 26 5 4-8Jan 2009 - Dec 2013 No During 8years of age 466,152 27 6 4-8Jan 2009 - Dec 2013 No During 9years of age 456,774 29 6 4-9Jan 2009 - Dec 2013 No During 10years of age 445,410 25 6 4-8Jan 2009 - Dec 2013 No During 11years of age 434,346 44 10 7-14Jan 2009 - Dec 2013 No During 12years of age 424,062 38 9 6-12Jan 2009 - Dec 2013 No During 13years of age 413,982 39 9 7-13Jan 2009 - Dec 2013 No During 14years of age 407,196 36 9 6-12Jan 2009 - Dec 2013 No During 15years of age 406,920 50 12 9-16Jan 2009 - Dec 2013 No During 16years of age 368,184 57 15 12-20Jan 2009 - Dec 2013 No During 17years of age 287,742 46 16 12-21Jan 2009 - Dec 2013 Yes During 1 year of age 568,710 50 9 7-12Jan 2009 - Dec 2013 Yes During 2years of age 567,540 43 8 5-10Jan 2009 - Dec 2013 Yes During 3years of age 563,832 49 9 6-11Jan 2009 - Dec 2013 Yes During 4years of age 558,804 40 7 5-10Jan 2009 - Dec 2013 Yes During 5years of age 552,996 39 7 5-10Jan 2009 - Dec 2013 Yes During 6years of age 542,922 32 6 4-8Jan 2009 - Dec 2013 Yes During 7years of age 530,346 26 5 3-7Jan 2009 - Dec 2013 Yes During 8years of age 519,846 30 6 4-8Jan 2009 - Dec 2013 Yes During 9years of age 508,974 29 6 4-8Jan 2009 - Dec 2013 Yes During 10years of age 495,948 25 5 3-7Jan 2009 - Dec 2013 Yes During 11years of age 483,270 49 10 8-13Jan 2009 - Dec 2013 Yes During 12years of age 471,432 38 8 6-11Jan 2009 - Dec 2013 Yes During 13years of age 459,984 39 8 6-12Jan 2009 - Dec 2013 Yes During 14years of age 452,262 37 8 6-11Jan 2009 - Dec 2013 Yes During 15years of age 451,518 50 11 8-15Jan 2009 - Dec 2013 Yes During 16years of age 408,210 58 14 11-18Jan 2009 - Dec 2013 Yes During 17years of age 318,906 47 15 11-20
Table 7 Appendix: Pertussis incidence for children of different ages atdifferent time periods in Sweden including or excluding the Gothenburgarea.
124

Table 8 Appendix. Incidence numbers for Figure 12 in the main report.
Age (years) 2004 2005 2006 2007 2008 2009 2010 2011 2012 2013 2014 2015 2016
0 263 138 89 76 50 44 49 39 49 41 121 84 841 47 23 10 5 13 9 2 2 7 4 20 10 72 44 11 11 7 6 4 6 3 5 7 12 7 93 28 20 7 8 8 6 5 1 6 5 12 12 134 50 17 11 8 5 5 5 4 7 6 6 9 85 62 23 19 4 2 7 4 1 6 4 10 8 106 70 41 18 19 7 7 5 2 6 5 6 5 87 77 52 25 20 14 3 7 1 4 2 5 7 78 36 20 12 17 6 5 1 5 2 7 6 99 18 15 26 6 9 2 2 2 8 5 1010 8 17 3 5 3 1 4 8 2 711 7 1 3 2 1 3 13 13 1712 1 4 1 1 2 11 8 1613 1 0 2 1 11 6 2014 2 1 0 5 14 1315 8 6 16 10 816 5 19 11 1617 19 11 1418 15 619 9
Table 8 Appendix: Number of laboratory verified cases between 2004and 2016 by age.Data collection was performed in the Swedish enhancedsurveillance study of pertussis.
125
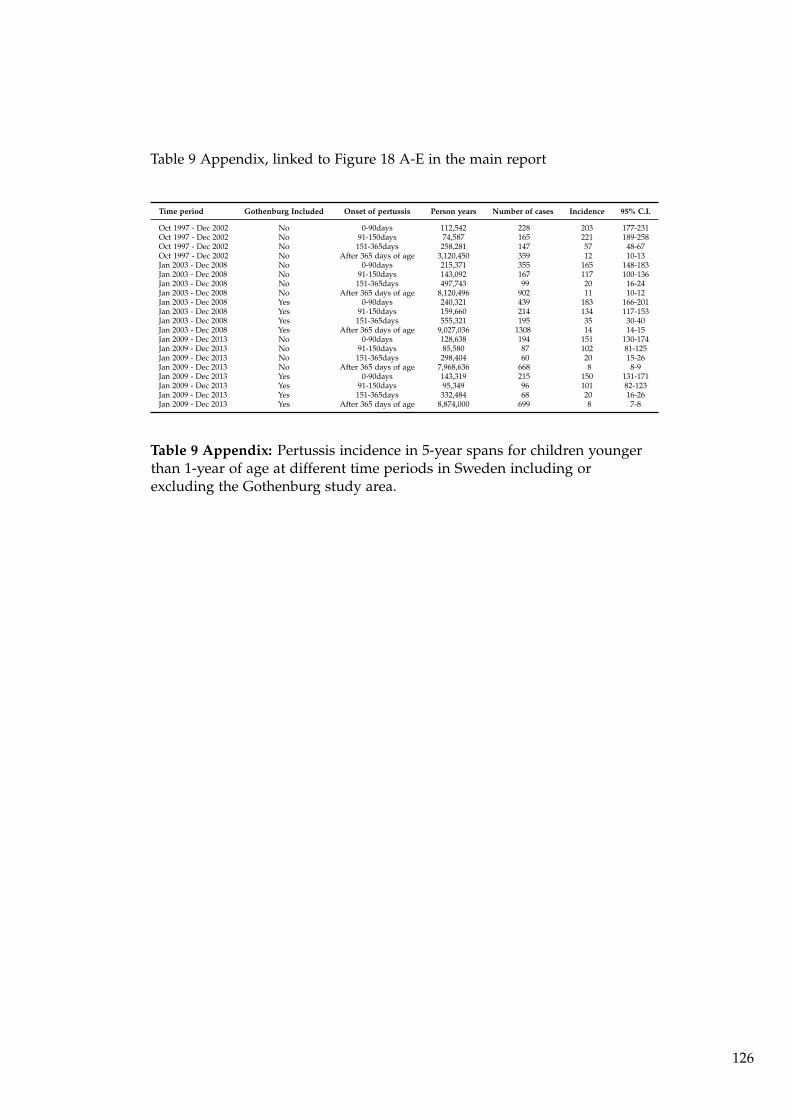
Table 9 Appendix, linked to Figure 18 A-E in the main report
Time period Gothenburg Included Onset of pertussis Person years Number of cases Incidence 95% C.I.
Oct 1997 - Dec 2002 No 0-90days 112,542 228 203 177-231Oct 1997 - Dec 2002 No 91-150days 74,587 165 221 189-258Oct 1997 - Dec 2002 No 151-365days 258,281 147 57 48-67Oct 1997 - Dec 2002 No After 365 days of age 3,120,450 359 12 10-13Jan 2003 - Dec 2008 No 0-90days 215,371 355 165 148-183Jan 2003 - Dec 2008 No 91-150days 143,092 167 117 100-136Jan 2003 - Dec 2008 No 151-365days 497,743 99 20 16-24Jan 2003 - Dec 2008 No After 365 days of age 8,120,496 902 11 10-12Jan 2003 - Dec 2008 Yes 0-90days 240,321 439 183 166-201Jan 2003 - Dec 2008 Yes 91-150days 159,660 214 134 117-153Jan 2003 - Dec 2008 Yes 151-365days 555,321 195 35 30-40Jan 2003 - Dec 2008 Yes After 365 days of age 9,027,036 1308 14 14-15Jan 2009 - Dec 2013 No 0-90days 128,638 194 151 130-174Jan 2009 - Dec 2013 No 91-150days 85,580 87 102 81-125Jan 2009 - Dec 2013 No 151-365days 298,404 60 20 15-26Jan 2009 - Dec 2013 No After 365 days of age 7,968,636 668 8 8-9Jan 2009 - Dec 2013 Yes 0-90days 143,319 215 150 131-171Jan 2009 - Dec 2013 Yes 91-150days 95,349 96 101 82-123Jan 2009 - Dec 2013 Yes 151-365days 332,484 68 20 16-26Jan 2009 - Dec 2013 Yes After 365 days of age 8,874,000 699 8 7-8
Table 9 Appendix: Pertussis incidence in 5-year spans for children youngerthan 1-year of age at different time periods in Sweden including orexcluding the Gothenburg study area.
126

Table 10 Appendix, see Chapter 2.9.2 in the main report.
Doses before episodeBirth Cohort 0 1 2 3
2003 24 (9) 12 (5) 40 (9) 28 (16)2004 42 (20) 26 (14) 21 (10) 11 (7)2005 9 (6) 3 (2) 6 (1) 4 (3)2006 10 (10) 3 (1) 2 (1) 3 (0)2007 5 (4) 2 (2) 4 (3) 6 (3)2008 5 (4) 3 (3) 1 (1) 1 (0)2009 3 (2) 2 (1) 2 (1) 2 (2)2010 9 (4) 0 (0) 0 (0) 4 (2)2011 2 (2) 1 (1) 0 (0) 3 (2)2012 7 (6) 1 (0) 5 (4) 1 (1)2013 5 (4) 0 (0) 0 (0) 1 (1)2014 4 (3) 2 (1) 2 (2) 1 (0)2015 5 (4) 1 (1) 1 (1) 0 (0)2016 4 (3) 3 (3) 0 (0) 0 (0)Subtotal 134 (81) 59 (34) 84 (33) 65 (37)
Table 10 Appendix: Laboratory-confirmed pertussis cases in theGothenburg study area divided by birth cohort and number of vaccinedoses before the start of the episode. The number of cases with 21 or moredays of spasmodic cough is shown in parenthese. Data collection wasperformed in the Swedish enhanced surveillance study of pertussis.
127

Table 11 Appendix, see Chapter 2.9.2 in the main report.
Doses before episodeBirth Cohort 0 1 2 3
1997.10-12 13 (10) 4 (4) 5 (4) 37 (33)1998 73 (56) 28 (22) 21 (15) 210 (166)1999 121 (106) 45 (42) 26 (19) 140 (108)2000 114 (104) 33 (27) 9 (7) 122 (92)2001 51 (41) 15 (13) 11 (7) 87 (68)2002 99 (87) 36 (30) 4 (4) 69 (54)2003 79 (63) 18 (15) 14 (11) 64 (54)2004 110 (95) 47 (42) 19 (14) 53 (37)2005 83 (72) 18 (16) 4 (2) 29 (19)2006 79 (66) 20 (18) 9 (5) 30 (17)2007 58 (54) 11 (10) 11 (9) 26 (15)2008 38 (32) 7 (6) 5 (3) 23 (15)2009 40 (29) 13 (10) 2 (2) 18 (12)2010 40 (30) 12 (10) 3 (2) 27 (17)2011 34 (27) 8 (6) 1 (1) 20 (16)2012 36 (26) 13 (13) 1 (1) 31 (25)2013 35 (30) 6 (6) 9 (8) 19 (10)2014 92 (77) 30 (25) 14 (11) 3 (1)2015 39 (36) 16 (16) 7 (7) 2 (2)2016 46 (41) 14 (12) 7 (5) 0 (0)Subtotal 1280 (1082) 394 (343) 182 (137) 1010 (761)
Table 11 Appendix: Laboratory-confirmed pertussis cases in Sweden,excluding the Gothenburg study area divided by birth-cohort and numberof vaccine doses before the start of the episode. The number of caseswith 21 or more days of spasmodic cough is shown in parenthese. Datacollection was performed in the Swedish enhanced surveillance study ofpertussis.
128

Table 12 Appendix, see Chapter 2.9.2 in the main report.
Year of Pertussis episodeBirthcohort
1997 1998 1999 2000 2001 2002 2003 2004 2005 2006 2007 2008 2009 2010 2011 2012 2013 2014 2015 2016 Total
1996 5 17 40 41 20 39 14 60 41 14 3 6 2 0 2 10 4 14 10 14 356(3) (14) (35) (35) (16) (39) (14) (55) (38) (13) (3) (5) (2) (0) (2) (9) (2) (7) (2) (6) (300)
1997 23 29 19 25 17 32 7 25 26 16 14 8 0 5 2 7 5 20 14 3 297(6) (15) (19) (22) (14) (29) (4) (20) (25) (14) (13) (7) (0) (5) (2) (6) (5) (11) (5) (2) (224)
1998 61 36 14 7 17 12 34 40 21 13 25 3 1 0 1 4 23 11 9 332(7) (20) (12) (4) (15) (11) (33) (40) (19) (12) (23) (3) (1) (0) (0) (3) (18) (4) (6) (231)
1999 96 65 9 19 8 18 25 12 18 20 3 5 2 2 1 7 9 13 332(6) (23) (6) (14) (4) (13) (24) (11) (18) (19) (3) (4) (2) (2) (0) (4) (5) (8) (166)
2000 88 31 16 7 21 14 24 18 15 4 7 0 1 0 6 12 14 278(5) (6) (9) (6) (14) (11) (17) (17) (12) (4) (6) (0) (1) (0) (6) (10) (7) (131)
2001 33 21 8 16 13 10 10 12 5 3 4 0 2 10 8 9 164(3) (10) (7) (11) (10) (8) (9) (10) (5) (2) (1) (0) (2) (7) (7) (6) (98)
2002 98 15 15 10 8 3 2 6 6 2 1 5 13 7 17 208(3) (3) (10) (9) (7) (3) (2) (3) (2) (1) (1) (3) (11) (5) (10) (73)
2003 52 40 11 6 7 4 7 3 0 4 4 10 10 17 175(2) (17) (10) (6) (7) (4) (4) (0) (0) (0) (2) (8) (4) (14) (78)
2004 116 40 12 7 5 5 5 2 5 1 9 6 16 229(4) (16) (11) (6) (5) (5) (2) (0) (0) (1) (7) (5) (10) (72)
2005 74 14 4 4 3 3 2 3 0 8 2 17 134(0) (5) (4) (2) (2) (0) (0) (1) (0) (7) (2) (10) (33)
2006 64 22 9 5 7 0 7 6 7 6 5 138(4) (6) (7) (5) (2) (0) (3) (1) (6) (2) (3) (39)
2007 46 17 4 4 3 8 2 3 8 11 106(0) (12) (3) (1) (2) (3) (0) (2) (6) (8) (37)
2008 26 16 3 2 4 6 8 3 5 73(1) (8) (2) (0) (2) (3) (7) (2) (3) (28)
2009 29 11 2 5 3 9 5 9 73(0) (2) (2) (1) (2) (5) (4) (4) (20)
2010 31 10 9 5 9 9 9 82(1) (3) (3) (3) (7) (6) (7) (30)
2011 28 7 3 10 7 8 63(0) (1) (2) (8) (3) (7) (21)
2012 34 11 15 11 10 81(0) (2) (15) (8) (7) (32)
2013 25 24 8 12 69(1) (15) (4) (8) (28)
2014 104 29 6 139(3) (12) (2) (17)
2015 51 13 64(1) (8) (9)
2016 67 67(7) (7)
Total 28 107 191 233 117 242 123 345 294 201 165 153 92 94 61 108 87 309 226 284 3460(0) (0) (0) (0) (0) (0) (0) (0) (0) (0) (0) (0) (0) (0) (0) (0) (0) (0) (0) (0) (0)
Table 12 Appendix: Laboratory confirmed pertussis cases in Sweden,excluding the Gothenburg study area. Cases are presented per calendaryear and birth cohort. In parentheses is the number of children with two ormore doses of a pertussis vaccine prior to the start of the episode. Data arefrom laboratory-confirmed case reports of pertussis, with episodes startingbetween Oct 1 1997 and Dec 31 2016. Data collection was performed in theSwedish enhanced surveillance study of pertussis. Data are presented forchildren born from Jan 1 1996.
129

Table 13 Appendix, see Chapter 2.9.2 in the main report.
Year of Pertussis episodeBirthcohort
1997 1998 1999 2000 2001 2002 2003 2004 2005 2006 2007 2008 2009 2010 2011 2012 2013 2014 2015 2016 Total
1996 3 3 7 21 9 21 7 38 3 6 0 1 0 0 0 1 0 0 0 0 120(3) (3) (7) (21) (8) (19) (6) (37) (3) (6) (0) (1) (0) (0) (0) (1) (0) (0) (0) (0) (115)
1997 2 6 7 17 10 14 8 37 15 2 1 0 0 0 0 0 0 0 1 1 121(2) (6) (7) (17) (9) (12) (8) (35) (15) (2) (1) (0) (0) (0) (0) (0) (0) (0) (0) (1) (115)
1998 12 24 39 26 21 4 44 11 3 0 1 0 0 0 0 0 0 0 0 185(5) (18) (36) (25) (20) (4) (42) (9) (3) (0) (1) (0) (0) (0) (0) (0) (0) (0) (0) (163)
1999 25 63 21 20 9 39 10 6 1 2 2 0 0 0 0 0 0 0 198(8) (45) (21) (18) (9) (36) (9) (6) (1) (2) (2) (0) (0) (0) (0) (0) (0) (0) (157)
2000 32 26 32 6 13 4 2 0 0 0 4 1 0 0 0 1 0 121(13) (17) (30) (6) (11) (4) (2) (0) (0) (0) (4) (0) (0) (0) (0) (1) (0) (88)
2001 30 50 8 30 5 1 0 1 0 1 0 0 0 0 0 0 126(8) (33) (8) (28) (5) (1) (0) (1) (0) (1) (0) (0) (0) (0) (0) (0) (85)
2002 50 18 32 5 1 3 0 0 0 0 0 0 0 0 0 109(8) (12) (32) (5) (0) (3) (0) (0) (0) (0) (0) (0) (0) (0) (0) (60)
2003 28 58 11 1 1 1 1 1 0 0 0 1 1 0 104(4) (47) (10) (1) (1) (1) (1) (1) (0) (0) (0) (1) (1) (0) (68)
2004 75 18 0 2 2 1 0 0 0 0 0 2 0 100(17) (9) (0) (2) (2) (1) (0) (0) (0) (0) (0) (1) (0) (32)
2005 14 6 0 0 0 1 0 0 1 0 0 0 22(3) (6) (0) (0) (0) (1) (0) (0) (0) (0) (0) (0) (10)
2006 10 5 2 0 0 1 0 0 0 0 0 18(0) (2) (2) (0) (0) (1) (0) (0) (0) (0) (0) (5)
2007 6 6 2 1 0 1 0 0 1 0 17(1) (5) (2) (0) (0) (1) (0) (0) (1) (0) (10)
2008 7 1 1 0 0 0 0 0 1 10(0) (0) (1) (0) (0) (0) (0) (0) (1) (2)
2009 4 2 1 0 1 0 1 0 9(1) (1) (1) (0) (1) (0) (0) (0) (4)
2010 5 0 0 4 0 3 1 13(0) (0) (0) (3) (0) (1) (0) (4)
2011 2 1 1 1 1 0 6(0) (0) (1) (1) (1) (0) (3)
2012 9 3 1 0 1 14(2) (3) (0) (0) (1) (6)
2013 4 1 1 0 6(0) (1) (0) (0) (1)
2014 5 3 1 9(1) (1) (1) (3)
2015 5 2 7(0) (1) (1)
2016 7 7(0) (0)
Total 5 21 63 172 122 208 88 366 96 38 19 23 11 16 5 12 14 9 20 14 1322(5) (14) (40) (132) (88) (140) (57) (285) (72) (27) (11) (15) (7) (9) (2) (4) (8) (4) (7) (5) (932)
Table 13 Appendix: Laboratory confirmed pertussis cases in theGothenburg study area. Cases are presented per calendar year and birthcohort. In parentheses is the number of children with two or more dosesof a pertussis vaccine prior to the start of the episode. Data are fromlaboratory-confirmed case reports of pertussis, with episodes startingbetween Oct 1 1997 and Dec 31 2016. Data collection was performed inthe Swedish enhanced surveillance study of pertussis. Data are presentedfor children born from Jan 1 1996.
130

Table 14 Appendix, see Chapter 2.9.2 in the main report.
Year of Pertussis episodeBirthcohort
1997 1998 1999 2000 2001 2002 2003 2004 2005 2006 2007 2008 2009 2010 2011 2012 2013 2014 2015 2016 Total
1996 2 3 5 6 3 0 0 5 2 1 0 1 0 0 0 1 2 7 8 8 541997 12 8 0 3 3 3 3 5 1 2 1 1 0 0 0 1 0 9 9 1 621998 38 7 2 3 1 1 1 0 2 1 2 0 0 0 1 0 4 7 3 731999 61 26 3 5 4 5 1 1 0 1 0 1 0 0 1 3 4 5 1212000 58 19 7 1 6 3 7 1 3 0 0 0 0 0 0 2 7 1142001 22 5 1 4 3 2 1 2 0 1 3 0 0 3 1 3 512002 66 5 5 1 1 0 0 3 4 1 0 2 2 2 7 992003 41 16 1 0 0 0 3 3 0 3 2 1 6 3 792004 77 13 1 1 0 0 3 2 5 0 1 1 6 1102005 60 5 0 2 1 3 2 2 0 1 0 7 832006 44 12 2 0 5 0 4 5 1 4 2 792007 35 5 1 3 1 5 2 1 2 3 582008 21 5 1 2 2 3 1 1 2 382009 19 6 0 4 1 4 1 5 402010 23 2 6 2 2 3 2 402011 24 3 1 2 4 0 342012 24 6 0 3 3 362013 21 6 4 4 352014 76 12 4 922015 35 4 392016 46 46Total 14 49 73 95 53 87 56 124 85 66 52 40 32 53 37 61 48 124 109 125 1383
Table 14 Appendix: Unimmunised children (i.e. children who have notreceived any pertussis vaccine before onset of cough) per birth-cohort.Cases are defined as confirmed pertussis with PCR or culture and from2008 also with serology. Data collection was performed in the EPS. Casesare from Sweden excluding the Gothenburg study area.
131

Table 15 Appendix, see Chapter 2.9.2 in the main report.
Year of Pertussis episodeBirthcohort
1998 1999 2000 2001 2002 2003 2004 2005 2006 2007 2008 2009 2010 2011 2012 2013 2014 2015 2016 Total
1996 0 0 0 1 1 1 1 0 0 0 0 0 0 0 0 0 0 0 0 41997 0 0 0 1 2 0 0 0 0 0 0 0 0 0 0 0 0 1 0 41998 4 0 3 1 1 0 2 1 0 0 0 0 0 0 0 0 0 0 0 121999 8 4 0 2 0 2 1 0 0 0 0 0 0 0 0 0 0 0 172000 9 7 1 0 2 0 0 0 0 0 0 1 0 0 0 0 0 202001 15 6 0 2 0 0 0 0 0 0 0 0 0 0 0 0 232002 26 4 0 0 1 0 0 0 0 0 0 0 0 0 0 312003 17 6 1 0 0 0 0 0 0 0 0 0 0 0 242004 35 6 0 0 0 0 0 0 0 0 0 1 0 422005 8 0 0 0 0 0 0 0 1 0 0 0 92006 8 2 0 0 0 0 0 0 0 0 0 102007 3 1 0 1 0 0 0 0 0 0 52008 5 0 0 0 0 0 0 0 0 52009 2 0 0 0 0 0 1 0 32010 5 0 0 1 0 2 1 92011 2 0 0 0 0 0 22012 6 0 1 0 0 72013 4 0 1 0 52014 2 2 0 42015 4 1 52016 4 4Total 4 8 16 25 39 22 50 17 9 5 6 2 6 3 6 6 3 12 6 245
Table 15 Appendix: Unimmunised children (i.e. children who have notreceived any pertussis vaccine before onset of cough) per birth-cohort.Cases are defined as confirmed pertussis with PCR or culture and from2008 also with serology.Data collection was performed in the Swedishenhanced surveillance study of pertussis. Cases are from the Gothenburgstudy area
132

Table 16 Appendix
Year Number of cases Incidence
1986 782 7831987 850 8251988 1253 11581989 1025 9001990 816 6801991 1191 9631992 907 7381993 1007 8391994 815 7111995 906 8431996 548 5531997 170 1841998 93 1041999 165 1862000 219 2452001 115 1262002 217 2312003 112 1152004 285 2852005 154 1522006 98 942007 91 852008 47 432009 43 392010 49 432011 37 322012 51 452013 39 342014 121 1052015 85 732016 87 74
Table 16 Appendix: Incidence (per 100,000 person years) of pertussis ininfants younger than 1 year of age Data are from case reports of pertussis,reported to SmiNet, according to the Communicable Disease Act..
133

Table 17 Appendix
Age (in months) Incidence1986-1995 1997-2016
0 120.7 41.61 429.7 227.52 456.2 224.63 608.6 215.44 821.3 187.15 930.3 109.76 1035.1 94.17 1094.4 47.38 1154.7 41.09 1200.2 42.710 1117.7 38.111 1140.9 46.2
Table 17 Appendix: Mean incidence (per 100,000 person years) of pertussisin infants during the 10 calendar years before (1986–1995) and during the20years after the (1997-2016) introduction of DTaP in 1996. Data are from casereports of pertussis, reported to SmiNet, according to the CommunicableDisease Act..
134

8.3 Severity of pertussis
8.3.1 Severity of pertussis in Sweden including the Gothenburgstudy area (from 2003) and excluding the Gothenburgstudy area (from 1997)
8.3.2 Cases of hospitalization due to pertussis for all of Sweden
Data on hospitalizations, defined as at least one night in the hospital due topertussis disease, were available for 4166 of 4166 children born from Jan 1,1996 to December 31, 2016 (see Table 18 Appendix). Altogether 887 (21.3 %)of the children had a hospital admission during the pertussis episode. Thecases include 72 cases from the Gothenburg study area and 815 cases fromrest of the Sweden.
8.3.3 The rate of hospital admission for pertussis by age for allof Sweden
In all, 621 of 887 infants (70 %) who were younger than 3 months of ageat the start of the pertussis episode were hospitalised. The correspondingrates, regardless of vaccination status at the episode, for the 476 children inthe agegroup of 3 <5 months and for the 411 children in age-group 5-<12months and for the 2392 children from 12 months or older were 36 %, 12 %and 2 %, respectively (Table 18 Appendix).
8.3.4 Incidence of hospital admission and age at the onset ofpertussis episode for Sweden without Gothenburg studyarea
Hospitalization data for Sweden from Oct 1, 1997, excluding the Gothenburgstudy area is shown in Figure 1 Appendix, Table 19 Appendix, Figure 2Appendix and Figure 3 Appendix. The age-specific incidence rate of hospitalizationdue to pertussis is highest at 128.3 per 100.000 person years of follow-upfor children 0-<3 Months of age and decreases by increasing age, to 0.2per 100.000 person years for children »=12 Months of age at the start of thepertussis episode (Figure 2 Appendix).
8.3.5 Duration of hospital stay by age and vaccination status atthe start of the pertussis episode
Hospital admissions were also studied by age, duration of hospital stayand vaccination status at the start of the pertussis episode. Detailed data
135

are given in Table 19 Appendix and in Figure 3 Appendix. Comparinghospitalizations among unvaccinated children with those who had beengiven one dose of a pertussis vaccine before the episode in the age intervalbetween 3 and 12 months of age at beginning of the pertussis episode ledto the following observations:
1. The median (mean) age at the start of the episode was 114 (149)days for unvaccinated children versus 125 (131) days for childrenvaccinated with one dose before the start of the episode. Thus, thetwo groups are "comparable" in age.
2. When comparing the groups described above - a higher rate of hospitaladmission was seen in the unvaccinated group compared to thevaccinated group (39% vs 30 %). This differences is statistically significant,p=0.031).
3. Of those hospitalized due to pertussis at 3-<12 months of age, 41 % ofthe hospitalizations had a duration longer than a week for unvaccinatedand 24 % were longer than a week among children with one dose.This difference was statistically significant (p=0.021). These resultssuggest that there might be some protection against "severe" pertussis,which is defined as requiring hospitalization, already after one doseof a pertussis vaccine.
In summary: There was a strong association between the age of the child atthe onset of the pertussis episode and the need for hospitalization as wellas between the vaccination status of the child before the start of the episodeand the risk of a hospitalization due to the disease. The same conclusionholds for the duration of the hospital stay and age.
136

Table 18 Appendix: Duration of hospital stay for all Sweden from 1997 andfor Gothenburg from 2003 in 4166 hospitalized children.
Age at episode start (days)
Dosesbeforeepisode
Duration ofhospital stay
0-30 31-60 61-90 91-150 151-365 >365 Sum
0 0 45 96 121 68 38 463 831(17.9%) (28.6%) (41.3%) (56.2%) (71.7%) (97.7%)
1-7 79 130 114 30 10 8 371(31.3%) (38.7%) (38.9%) (24.8%) (18.9%) (1.7%)
>7 128 110 58 23 5 3 327(50.8%) (32.7%) (19.8%) (19%) (9.4%) (0.6%)
Sum 252 336 293 121 53 474 1529
1 0 4 234 79 15 332(66.7%) (66.1%) (86.8%) (93.8%)
1-7 1 90 10 1 102(16.7%) (25.4%) (11%) (6.2%)
>7 1 30 2 0 33(16.7%) (8.5%) (2.2%) (0%)
Sum 6 354 91 16 467
>1 0 1 246 1869 2116(100%) (92.1%) (98.3%)
1-7 19 29 48(0%) (7.1%) (1.5%)
>7 2 4 6(0%) (0.7%) (0.2%)
Sum 1 267 1902 2170
Table 18 Appendix: Hospitalisation due to pertussis stratified by age andvaccination status. Data are from laboratory confirmed case reports ofpertussis, with episodes starting between Oct 1, 1997 and Dec 31 2016. Forthe Gothenburg study area the data are from case reports of pertussis withepisodes starting between Jan 1, 2003, and Dec 31 2016. Data collection wasperformed in the Swedish enhanced surveillance study of pertussis. Dataare here presented for children born from Jan 1, 1996.
137

Table 18 Appendix: Duration of hospital stay for all Sweden excludingthe Gothenburg study area from 1997 for 3460 children hospitalized withpertussis.
Age at episode start (days)
Dosesbeforeepisode
Duration ofhospital stay
0-30 31-60 61-90 91-150 151-365 >365 Sum
0 0 35 79 99 60 35 435 743(15.4%) (27.1%) (38.4%) (54.1%) (70%) (97.8%)
1-7 71 113 104 29 10 7 334(31.1%) (38.8%) (40.3%) (26.1%) (20%) (1.6%)
>7 122 99 55 22 5 3 306(53.5%) (34%) (21.3%) (19.8%) (10%) (0.7%)
Sum 228 291 258 111 50 445 1383
1 0 4 194 65 12 275(80%) (63%) (84.4%) (92.3%)
1-7 1 85 10 1 97(20%) (27.6%) (13%) (7.7%)
>7 0 29 2 0 31(0%) (9.4%) (2.6%) (0%)
Sum 5 308 77 13 403
>1 0 1 161 1465 1627(100%) (89.4%) (98.1%)
1-7 17 25 42(0%) (9.4%) (1.7%)
>7 2 3 5(0%) (1.1%) (0.2%)
Sum 1 180 1493 1674
Table 19 Appendix: Hospitalisation due to pertussis stratified by age andvaccination status in Sweden excluding the Gothenburg study area. Dataare from laboratory confirmed case reports of pertussis, with episodesstarting between Oct 1, 1997, and Dec 31 2016. Data collection wasperformed in the EPS. Data are here presented for children born from Jan 1,1996.
138

Figure 1 Appendix
Hospitalization data
1
1
1
1 1
3321 cases with data on
cough characteristics
3335 cases with data on complications and hospitalizations
1273 Unimmunized cases 2062 Immunized cases
638 Hospitalizedcases (50.12%)
175 Hospitalizedcases (8.49%)
Figure 1 Appendix: Hospitalised cases in a flow chart of 3321 cases ofpertussis from Sweden excluding the Gothenburg study area. Data arefrom laboratory-confirmed case reports of pertussis, with episodes startingbetween Oct 1 1997 and Dec 31 2016. Data collection was performed in theEPS. Data are presented for children born from Jan 1 1996.
139

Figure 2 Appendix, Hospitalization in Sweden excluding the Gothenburgstudy area
0
20
40
60
80
100
120
140
Hospital admission due to pertussis with 95% CI
Days of age
Cas
es p
er 1
00 0
00 p
erso
n ye
ars
●
●
●
●
0−90days 91−150days 151−365days >365days
125.2
55
4.40.2
Figure 2 Appendix: Incidence of pertussis (per 100,000 person years) inSweden. Data are from laboratory-confirmed case reports of pertussis, withepisodes starting between Oct 1 1997 and Dec 31 2016. Data collection wasperformed in the EPS in children born from January 1, 1996.
140

Figure 3 Appendix, Hospitalizations in Sweden excluding the Gothenburgstudy area.
Observed duration of hospital stay among cases born 1996 or later,stratified by age and vaccination status at episode start
Age at episode start
Num
ber
of c
ases
0
100
200
300
400
0−30days 31−60days 61−90days91−150days151−365days>365days
0 doses
0
50
100
150
200
0−30days 31−60days 61−90days91−150days151−365days>365days
1 dose
0
500
1000
1500
0−30days 31−60days 61−90days91−150days151−365days>365days
2 or more doses
0
500
1000
1500
2000
0−30days 31−60days 61−90days91−150days151−365days>365days
Regardless of vaccination status
Days at hospital0 days1−7 days>7 days
Figure 3 Appendix: Hospitalised cases, stratified by age and vaccinationstatus at pertussis episode start in Sweden excluding the Gothenburg studyarea. Data are from laboratory-confirmed case reports of pertussis, withepisodes starting between Oct 1, 1997 and Dec 31, 2016. Data collectionwas performed in the EPS. Data are presented for children born from Jan 11996.
141

Figure 4 Appendix
Hospitalization data
1
1
1
1 1
3090 cases with data on
cough characteristics
3084 cases with data on complications and hospitalizations
1031 Unimmunized cases 2053 Immunized cases
494 Hospitalizedcases (47.91%)
136 Hospitalizedcases (6.62%)
Figure 4 Appendix: Hospitalised cases with cough of at least one day in aflow chart of 3090 cases of pertussis. Data are from laboratory-confirmedcase reports of pertussis, with episodes starting between Jan 1, 2003 andDec 31, 2016. Data collection was performed in the EPS. Data are herepresented for children born from Jan 1, 1996.
142

Figure 5 Appendix
Hospitalization data
1
1
1
1 1
686 cases with data on
cough characteristics
683 cases with data on complications and hospitalizations
134 Unimmunized cases 549 Immunized cases
56 Hospitalizedcases (41.79%)
14 Hospitalizedcases (2.55%)
Figure 5 Appendix: Hospitalised cases with cough of at least one day in aflow chart of 686 cases of pertussis.Cases are from the Gothenburg studyarea. Data are from laboratory-confirmed case reports of pertussis, withepisodes starting between Jan 1, 2003 and Dec 31, 2016. Data collection wasperformed in the EPS. Data are here presented for children born from Jan 1,1996.
143

8.4 Complications in the enhanced surveillance study
8.4.1 Cases of complications due to pertussis for all of Sweden
Data on respiratory complications, neurological complications, dehydrationwith >5 % of weight loss or other serious complications during the pertussisepisode were registered in the database for 4029 of the 4166 children bornfrom January 1, 1996 to December 31, 2016, with both vaccination andfollow-up information. A respiratory complication (with apnoea, n= 289 orwithout apnoea, n= 312) was reported for 601 (15 %) of the children, and adehydration event was reported for 128 (3 %) of the children. Uncommoncomplications, i.e. neurological and other serious complications, werereported for 12 (0.3 %) of the children.
8.4.2 2 The correlation between the rate of complications dueto pertussis and age for all of Sweden
To analyse the association between complications during the pertussisepisode and the age and vaccination status of the child at the start of theepisode, children were grouped into two groups; children with at leastone noted complication and children without any complication duringthe pertussis episode. Altogether 741 children (18 %) had at least onecomplication due to pertussis during their pertussis episode and 3288children (82 %) had no complication at all, information was missing in 137cases. In the 887 children who were younger than 3 months of age at thebeginning of the pertussis episode, 44 % (389) had at least one complication.The corresponding rates for the 476 children in the age group of 3-<5months, for 411 the children in the age-group of 5-<12 months and for the2392 children aged 12 months and older at the beginning of the pertussisepisode were 22 %, 14 % and 14 %, respectively (Figure 6 Appendix andTable 20 Appendix.
8.4.3 Incidence of complications and age for all of Sweden
The age specific incidence rate of any complication due to pertussis washighest at 76 per 100,000 person years of follow-up, for children 0-<3 monthsof age and decreased, by increasing age, to 1 per 100,000 person years forchildren >=12 months of age or older at the start of the pertussis episode.
144

8.4.4 Complications, age, and vaccination status at the start ofthe pertussis episode for all Sweden
The events "any complication" were studied in relation to age and vaccinationstatus at the beginning of the pertussis episode. Detailed data are given inFigure 6 Appendix and Table 20 Appendix. For unvaccinated children aged0-30, 31-60 and 61-90 days at the beginning of the pertussis episode thecomplication rates were 57 %, 39 % and 35 % respectively, and dropped to9 % for children above one year of age. For unvaccinated children between3-<5 and 5-<12 months of age, the rates of any complication were 26 % and31 %, respectively. Thus, for the unvaccinated children there was a strongassociation between the rate of any complication due to the disease andage of the child at the beginning of the pertussis episode. The overall rateof any complication for unvaccinated children was 32 %. Regardless ofage, the rate of any complication for children vaccinated with one dosewas 18 %, and the rate for children vaccinated with two or more dosesbefore the pertussis episode was 9 % (p<0.001). This statistically significantdifference was confounded by age. For children more than 12 months, therate of any complication was at about 9 % for unvaccinated children and10 % for children vaccinated with two or more doses. In the age intervalof 5-<12 months at the start of the episode, the complication rate was 31 %for unvaccinated children, 11 % for children vaccinated with one dose and9 % for those vaccinated with two or more doses prior to the start of theepisode. This downward "trend" in rate by the number of doses prior to thepertussis episode was statistically significant (p<0.001).
Table 21 Appendix describes the same data as Table 20 Appendix but forSweden without the Gothenburg study area.
Table 22 Appendix and Table 23 Appendix describe complications in relationto hospitalization for Sweden without the Gothenburg study area and forthe Gothenburg study area, respectively. These tables are supplements toTable 13 with all the data but only from 2003 onwards.
145

Table 20 Appendix: Sweden from 1997 and Gothenburg from 2003.
Age at episode start (days)
Dosesbeforeepisode
Complicationsafter episode
0-30 31-60 61-90 91-150 151-365 >365 Sum
0 No 107 201 188 85 34 344 959(43.3%) (60.7%) (65.1%) (73.9%) (69.4%) (90.5%)
Yes 140 130 101 30 15 36 452(56.7%) (39.3%) (34.9%) (26.1%) (30.6%) (9.5%)
Sum 247 331 289 115 49 380 1411
1 No 2 283 81 13 379(33.3%) (80.6%) (89%) (81.2%)
Yes 4 68 10 3 85(66.7%) (19.4%) (11%) (18.8%)
Sum 6 351 91 16 464
>1 No 1 238 1711 1950(100%) (91.2%) (90.4%)
Yes 23 181 204(0%) (8.8%) (9.6%)
Sum 1 261 1892 2154
Table 20 Appendix: Any complication due to the pertussis diseaseand stratified by age and vaccination status. Data are from laboratoryconfirmed case reports of pertussis, with episodes starting between Oct1, 1997, and Dec 31 2016. For the Gothenburg study area the data are fromcase reports of pertussis with episodes starting between Jan 1, 2003 andDec 31 2016. Data collection was performed in the Swedish enhancedsurveillance study of pertussis. Data are here presented for children bornfrom Jan 1, 1996.
146

Table 21 Appendix: Complications since 1997 in Sweden excluding theGothenburg study area.
Age at episode start (days)
Dosesbeforeepisode
Complicationsafter episode
0-30 31-60 61-90 91-150 151-365 >365 Sum
0 No 90 173 161 77 32 327 860(40.4%) (60.3%) (63.4%) (73.3%) (69.6%) (91.3%)
Yes 133 114 93 28 14 31 413(59.6%) (39.7%) (36.6%) (26.7%) (30.4%) (8.7%)
Sum 223 287 254 105 46 358 1273
1 No 2 245 68 12 327(40%) (80.3%) (88.3%) (92.3%)
Yes 3 60 9 1 73(60%) (19.7%) (11.7%) (7.7%)
Sum 5 305 77 13 400
>1 No 1 159 1329 1489(100%) (89.8%) (89.6%)
Yes 18 155 173(0%) (10.2%) (10.4%)
Sum 1 177 1484 1662
Table 21 Appendix: Any complication due to the pertussis disease andstratified by age and vaccination status in Sweden excl. the Gothenburgstudy area. Data are from laboratory confirmed case reports of pertussis,with episodes starting between Oct 1, 1997 and Dec 31 2016. Data collectionwas performed in the EPS. Data are here presented for children born fromJan 1, 1996.
147

Figure 6 Appendix: Sweden excluding Gothenburg.
Cases with complications,stratified by age and vaccination status at episode start
Age at episode start
Num
ber
of c
ases
0
100
200
300
0−30days 31−60days 61−90days 91−150days151−365days >365days
0 doses
050
100150200250
0−30days 31−60days 61−90days 91−150days151−365days >365days
1 dose
0
500
1000
0−30days 31−60days 61−90days 91−150days151−365days >365days
2 or more doses
0
500
1000
1500
0−30days 31−60days 61−90days 91−150days151−365days >365days
Regardless of vaccination status
Had complicationNoYes
Figure 6 Appendix: Cases with complications, stratified by age andvaccination status at pertussis episode start in Sweden excluding theGothenburg study area. Data are from laboratory-confirmed case reportsof pertussis, with episodes starting between Oct 1, 1997 and Dec 31. 2016.Data collection was performed in the EPS. Data are presented for childrenborn from Jan 1 1996.
148

Table 22 Appendix: Complications, Sweden from 1997.
Complication type Hospitalized Not hospitalized Sum
Respiratory, with apnoea 225 (88%) 32 (12%) 257Respiratory, without apnoea 142 (51%) 135 (49%) 277Dehydration 76 (68%) 36 (32%) 112Other severe events 4 (50%) 4 (50%) 8No complication 361 (13%) 2315 (87%) 2676Sum 808 (24%) 2522 (76%) 3330
Table 22 Appendix: Type of complications in children with laboratoryconfirmed pertussis in Sweden excl. the Gothenburg study area. Data arefrom laboratory confirmed case reports of pertussis, with episodes startingbetween Oct 1, 1997 and Dec 31 2016. Data collection was performed in theEPS. Data are here presented for children born from Jan 1, 1996.
149

Table 23 Appendix: Complications, Sweden from 1997 and Gothenburgfrom 2003.
Complication type Hospitalized Not hospitalized Sum
Respiratory, with apnoea 255 (88%) 34 (12%) 289Respiratory, without apnoea 150 (48%) 162 (52%) 312Dehydration 79 (62%) 49 (38%) 128Other severe events 8 (67%) 4 (33%) 12No complication 393 (12%) 2895 (88%) 3288Sum 885 (22%) 3144 (78%) 4029
Table 23 Appendix: Type of complications in children with laboratoryconfirmed pertussis in Sweden including the Gothenburg study area.Data are from laboratory confirmed case reports of pertussis, withepisodes starting between Oct 1 1997 and Dec 31 2016. Data collection wasperformed in the Swedish enhanced surveillance study of pertussis. Dataare here presented for children born from Jan 1 1996.
150
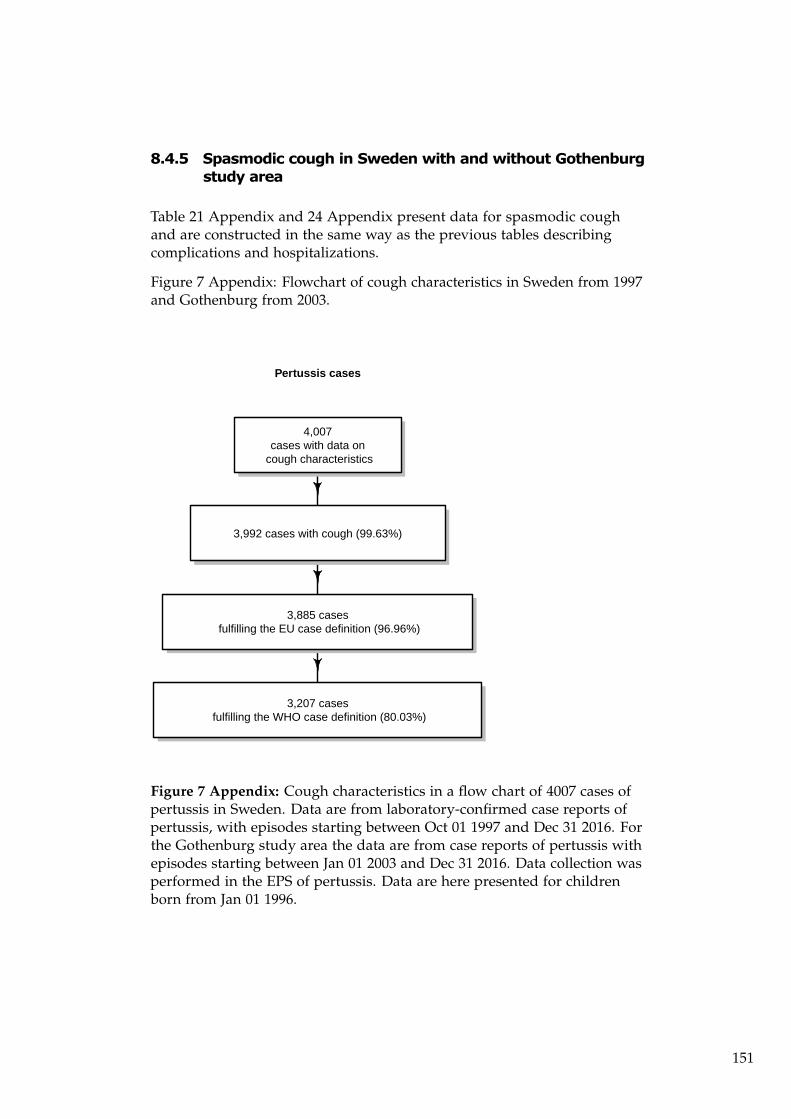
8.4.5 Spasmodic cough in Sweden with and without Gothenburgstudy area
Table 21 Appendix and 24 Appendix present data for spasmodic coughand are constructed in the same way as the previous tables describingcomplications and hospitalizations.
Figure 7 Appendix: Flowchart of cough characteristics in Sweden from 1997and Gothenburg from 2003.
Pertussis cases
1
1
1
4,007cases with data on
cough characteristics
3,992 cases with cough (99.63%)
3,885 cases fulfilling the EU case definition (96.96%)
3,207 cases fulfilling the WHO case definition (80.03%)
Figure 7 Appendix: Cough characteristics in a flow chart of 4007 cases ofpertussis in Sweden. Data are from laboratory-confirmed case reports ofpertussis, with episodes starting between Oct 01 1997 and Dec 31 2016. Forthe Gothenburg study area the data are from case reports of pertussis withepisodes starting between Jan 01 2003 and Dec 31 2016. Data collection wasperformed in the EPS of pertussis. Data are here presented for childrenborn from Jan 01 1996.
151

Figure 9 Appendix: Flowchart of cough characteristics in Sweden from1997.
Sweden excluding the Gothenburg study area
1
1
1
3,321cases with data on
cough characteristics
3,308 cases with cough (99.61%)
3,241 cases fulfilling the EU case definition (97.59%)
2,793 cases fulfilling the WHO case definition (84.1%)
Figure 8 Appendix: Cough characteristics in a flow chart of 3090 casesof pertussis in Sweden excluding the Gothenburg study area. Data arefrom laboratory-confirmed case reports of pertussis, with episodes startingbetween Oct 01 1997 and Dec 31 2016. Data collection was performed inthe EPS of pertussis. Data are here presented for children born from Jan 011996.
152

Figure 9 Appendix: Flowchart of cough characteristics in Gothenburg from2003.
Gothenburg study area
1
1
1
686cases with data on
cough characteristics
684 cases with cough (99.71%)
644 cases fulfilling the EU case definition (93.88%)
414 cases fulfilling the WHO case definition (60.35%)
Figure 9 Appendix: Cough characteristics in a flow chart of 686 cases ofpertussis in the Gothenburg study area. For the Gothenburg study areathe data are from case reports of pertussis with episodes starting betweenJan 01 2003 and Dec 31 2016. Data collection was performed in the EPS ofpertussis. Data are here presented for children born from Jan 01 1996.
153

Table 24 Appendix: Spasmodic cough, enhanced Sweden study from 1997and Gothenburg from 2003.
Age at episode start (days)
Vaccinedosesbeforeepisode
Duration ofspasmodiccough
0-30 31-60 61-90 91-150 151-365 >365 Sum
0 0 21 21 26 11 6 117 202(8.3%) (6.2%) (8.9%) (9.1%) (11.3%) (24.7%)
1-20 10 29 11 11 2 8 71(4%) (8.6%) (3.8%) (9.1%) (3.8%) (1.7%)
>20 221 286 256 99 45 349 1256(87.7%) (85.1%) (87.4%) (81.8%) (84.9%) (73.6%)
Sum 252 336 293 121 53 474 1529
1 0 0 32 9 1 42(0%) (9%) (9.9%) (6.2%)
1-20 0 30 9 0 39(0%) (8.5%) (9.9%) (0%)
>20 6 292 73 15 386(100%) (82.5%) (80.2%) (93.8%)
Sum 6 354 91 16 467
>1 0 63 387 450(0%) (23.6%) (20.3%)
1-20 1 39 115 155(100%) (14.6%) (6%)
>20 165 1400 1565(0%) (61.8%) (73.6%)
Sum 1 267 1902 2170
Table 24 Appendix: Spasmodic cough due to the pertussis disease andstratified by age and vaccination status Data are from laboratory confirmedcase reports of pertussis, with episodes starting between Oct 1 1997 andDec 31 2016. For the Gothenburg study area the data are from case reportsof pertussis with episodes starting between Jan 1 2003 and Dec 31 2016.Data collection was performed in the EPS. Data are here presented forchildren born from Jan 1 1996.
154

Table 25 Appendix: Spasmodic cough, enhanced Sweden study from 1997excluding Gothenburg study area.
Age at episode start (days)
Vaccinedosesbeforeepisode
Duration ofspasmodiccough
0-30 31-60 61-90 91-150 151-365 >365 Sum
0 0 13 12 15 8 6 108 162(5.7%) (4.1%) (5.8%) (7.2%) (12%) (24.3%)
1-20 7 25 10 8 2 8 60(3.1%) (8.6%) (3.9%) (7.2%) (4%) (1.8%)
>20 208 254 233 95 42 329 1161(91.2%) (87.3%) (90.3%) (85.6%) (84%) (73.9%)
Sum 228 291 258 111 50 445 1383
1 0 0 16 7 0 23(0%) (5.2%) (9.1%) (0%)
1-20 0 25 5 0 30(0%) (8.1%) (6.5%) (0%)
>20 5 267 65 13 350(100%) (86.7%) (84.4%) (100%)
Sum 5 308 77 13 403
>1 0 28 258 286(0%) (15.6%) (17.3%)
1-20 1 20 85 106(100%) (11.1%) (5.7%)
>20 132 1150 1282(0%) (73.3%) (77%)
Sum 1 180 1493 1674
Table 25 Appendix: Spasmodic cough due to the pertussis disease andstratified by age and vaccination status in Sweden excl. the Gothenburgstudy area. Data are from laboratory-confirmed case reports of pertussis,with episodes starting between Oct 1, 1997 and Dec 31 2016. Data collectionwas performed in the Swedish enhanced surveillance study of pertussis.Data are presented for children born from Jan 1 1996.
155

Figure 10 Appendix: Sweden excluding Gothenburg.
Duration of spasmodic cough,stratified by age and vaccination status at episode start
Age at episode start
Num
ber
of c
ases
0
100
200
300
0−30days 31−60days 61−90days91−150days151−365days>365days
0 doses
050
100150200250
0−30days 31−60days 61−90days91−150days151−365days>365days
1 dose
0200400600800
10001200
0−30days 31−60days 61−90days91−150days151−365days>365days
2 or more doses
0
500
1000
1500
0−30days 31−60days 61−90days91−150days151−365days>365days
Regardless of vaccination status
Days of spasmodiccough
0 days1−20 days21+ days
Figure 10 Appendix: Duration of spasmodic cough, stratified by age andvaccination status at pertussis episode start in Sweden excluding theGothenburg study area. Data are from laboratory-confirmed case reportsof pertussis, with episodes starting between Oct 1, 1997 and Dec 31, 2016.Data collection was performed in the EPS. Data are presented for childrenborn from Jan 1 1996.
156

Table 26 Appendix:
Onset of pertussisepisode occurred (inage group)
Person years offollow-up
Number of laboratoryconfirmed cases
Incidence(per 100 000person-years)
95% confidenceinterval forincidence per 100,000person-years
0-90days 51,523 178 (178) 345 (345) 297-400 (297-400)91-150days 34,238 89 (111) 260 (324) 209-320 (267-390)151-365days 119,150 233 (237) 196 (199) 171-222 (174-226)After 365 days of age 1,967,584 754 (796) 38 (40) 36-41 (38-43)During 1 year of age 201,867 191 (196) 95 (97) 82-109 (84-112)During 2years of age 192,780 119 (128) 62 (66) 51-74 (55-79)During 3years of age 181,092 91 (94) 50 (52) 40-62 (42-64)During 4years of age 169,356 83 (90) 49 (53) 39-61 (43-65)During 5years of age 157,704 77 (84) 49 (53) 39-61 (42-66)During 6years of age 145,794 72 (78) 49 (54) 39-62 (42-67)During 7years of age 133,692 66 (66) 49 (49) 38-63 (38-63)During 8years of age 122,076 31 (33) 25 (27) 17-36 (19-38)During 9years of age 110,808 10 (10) 9 (9) 4-17 (4-17)During 10years of age 99,696 7 (7) 7 (7) 3-14 (3-14)During 11years of age 88,950 3 (5) 3 (6) 1-10 (2-13)During 12years of age 78,534 1 (1) 1 (1) 0-7 (0-7)During 13years of age 68,382 0 (0) 0 (0) 0-5 (0-5)During 14years of age 58,608 1 (1) 2 (2) 0-10 (0-10)During 15years of age 49,158 0 (0) 0 (0) 0-8 (0-8)During 16years of age 40,026 1 (1) 2 (2) 0-14 (0-14)During 17years of age 31,164 0 (1) 0 (3) 0-12 (0-18)During 18years of age 22,380 1 (1) 4 (4) 0-25 (0-25)During 19years of age 13,542 0 (0) 0 (0) 0-27 (0-27)
Table 26 Appendix: From the enhanced surveillance study. Incidence ofreported culture- or PCR-confirmed B. pertussis is described and from2008 al so serology-diagnosed cases of pertussis among children in theGothenburg study area. Data are from laboratory confirmed case reportsof pertussis, with episodes starting between Oct 1 1997 and Dec 31 2016.Data collection was performed in the EPS. Data are here presented forchildren born from Jan 1 1996. We present person years of follow-up,number of laboratory confirmed cases, incidence per 100,000 person yearsand 95% confidence interval in the following age groups at onset of thepertussis episode; 0-<3 months of age 2; 3-<5 months of age ; 5-<12 monthsof age ; and after 12 months of age in one-year age intervals3 in vaccinatedchildren. In brackets total figures, regardless of vaccination status, inrespective age group, are given.
157

Table 27 Appendix
Onset of pertussisepisode occurred (inage group)
Person years offollow-up
Number of laboratoryconfirmed cases
Incidence(per 100 000person-years)
95% confidenceinterval forincidence per 100,000person-years
0-90days 451,337 782 (782) 173 (173) 161-186 (161-186)91-150days 300,066 309 (420) 103 (140) 92-115 (127-154)151-365days 1,045,176 257 (307) 25 (29) 22-28 (26-33)After 365 days of age 17,525,318 1506 (1951) 9 (11) 8-9 (11-12)During 1 year of age 1,774,444 124 (178) 7 (10) 6-8 (9-12)During 2years of age 1,695,444 140 (183) 8 (11) 7-10 (9-12)During 3years of age 1,592,880 155 (191) 10 (12) 8-11 (10-14)During 4years of age 1,491,228 134 (177) 9 (12) 8-11 (10-14)During 5years of age 1,390,404 128 (162) 9 (12) 8-11 (10-14)During 6years of age 1,288,608 147 (177) 11 (14) 10-13 (12-16)During 7years of age 1,186,992 138 (170) 12 (14) 10-14 (12-17)During 8years of age 1,088,064 125 (148) 11 (14) 10-14 (11-16)During 9years of age 990,972 108 (121) 11 (12) 9-13 (10-15)During 10years of age 895,416 54 (62) 6 (7) 5-8 (5-9)During 11years of age 802,530 40 (57) 5 (7) 4-7 (5-9)During 12years of age 711,804 36 (46) 5 (6) 4-7 (5-9)During 13years of age 621,912 28 (41) 5 (7) 3-7 (5-9)During 14years of age 534,198 28 (36) 5 (7) 3-8 (5-9)During 15years of age 450,006 40 (50) 9 (11) 6-12 (8-15)During 16years of age 368,184 39 (58) 11 (16) 8-14 (12-20)During 17years of age 287,742 23 (46) 8 (16) 5-12 (12-21)During 18years of age 207,930 11 (28) 5 (13) 3-9 (9-19)During 19years of age 127,002 8 (20) 6 (16) 3-12 (10-24)
Table 27 Appendix: From the enhanced surveillance study. Incidence ofreported culture- or PCR-confirmed B. pertussis is described and from2008 also serology-diagnosed cases of pertussis1 among children outsidethe Gothenburg study area. Data are from laboratory confirmed casereports of pertussis, with episodes starting between Oct 1 1997 and Dec31 2016. Data collection was performed in the EPS. Data are here presentedfor children born from Jan 1 1996. We present person years of follow-up,number of laboratory confirmed cases, incidence per 100,000 person yearsand 95% confidence interval in the following age groups at onset of thepertussis episode; 0-<3 months of age 2; 3-<5 months of age ; 5-<12 monthsof age ; and after 12 months of age in one-year age intervals3 in vaccinatedchildren. In brackets total figures, regardless of vaccination status, inrespective age group, are given.
158

8.5 Updated tables with incidence data from the onset ofthe enhanced studies in Sweden and in the Gothenburgstudy area, respectively
Tables 28 Appendix, 29 Appendix, 30 Appendix, 31 Appendix and 32Appendix are data up to Dec 31, 2016 comparing incidence figures andrelative risks in the Gothenburg study area with the rest of Sweden.
• Table 28 Appendix shows the person years of follow up for pertussisincidences and confidence intervals in 19 age intervals in the enhancedstudy since 2003
• Table 29 Appendix shows the person years of follow up for pertussisincidences and confidence intervals in 17 age intervals for childrenvaccinated with two or more doses of a pertussis vaccine in the enhancedstudy since 2003
• Table 30 Appendix shows the person years of follow up for pertussisincidences and confidence intervals in 17 age intervals with the WHOcriterion (21 or more days of spasmodic cough) in the enhanced studysince 2003.
• Table 31 Appendix describes person years of follow up for pertussisincidences and confidence intervals in 19 age intervals within theenhanced study since 1997
• Table 32 Appendix shows the person years of follow up for pertussisincidences and confidence intervals in 17 age intervals for childrenvaccinated with two or more doses of a pertussis vaccine in the enhancedstudy since 1997
159

Table 28 Appendix: The Gothenburg study area from 2003.
160

Age at onset ofpertussis; vaccine-or age group
Person years offollow up
No of laboratoryconfirmed cases
Incidenceper 100,000person-years
95% confidenceinterval
Relative riskin Gothenburgcompared withSweden exceptGothenburg
Before Dose 1(0-90days)
39,630 (344,009) 104 (544) 262 (158) 214-318 (145-172) 1.66 (1.33-2.05)
Between 1and 2 doses(91-150days)
26,337 (228,672) 74 (303) 281 (133) 221-353 (118-148) 2.12 (1.62-2.74)
Between 2and 3 doses(151-365days)
91,658 (796,147) 97 (137) 106 (17) 86-129 (14-20) 6.15 (4.69-8.04)
After Dose 3and/or during 1year of age
155,274 (1,348,674) 64 (98) 41 (7) 32-53 (6-9) 5.67 (4.07-7.85)
During 2 years ofage
152,754 (1,327,260) 49 (99) 32 (7) 24-42 (6-9) 4.3 (2.99-6.12)
During 3 years ofage
149,928 (1,305,138) 30 (108) 20 (8) 14-29 (7-10) 2.42 (1.56-3.65)
During 4 years ofage
146,976 (1,283,298) 51 (107) 35 (8) 26-46 (7-10) 4.16 (2.92-5.86)
During 5 years ofage
144,162 (1,263,402) 51 (121) 35 (10) 26-47 (8-11) 3.69 (2.61-5.16)
During 6 years ofage
141,234 (1,245,522) 67 (153) 47 (12) 37-60 (10-14) 3.86 (2.85-5.18)
During 7 years ofage
133,692 (1,186,992) 61 (169) 46 (14) 35-59 (12-17) 3.2 (2.35-4.32)
During 8 years ofage
122,076 (1,088,064) 31 (148) 25 (14) 17-36 (11-16) 1.87 (1.22-2.76)
During 9 years ofage
110,808 (990,972) 10 (116) 9 (12) 4-17 (10-14) 0.77 (0.36-1.47)
During 10 years ofage
99,696 (895,416) 7 (62) 7 (7) 3-14 (5-9) 1.01 (0.39-2.22)
During 11 years ofage
88,950 (802,530) 5 (55) 6 (7) 2-13 (5-9) 0.82 (0.26-2.03)
During 12 years ofage
78,534 (711,804) 1 (46) 1 (6) 0-7 (5-9) 0.2 (0-1.15)
During 13 years ofage
68,382 (621,912) 0 (41) 0 (7) 0-5 (5-9) 0 (0-0.86)
During 14 years ofage
58,608 (534,198) 1 (36) 2 (7) 0-10 (5-9) 0.25 (0.01-1.5)
During 15 years ofage
49,158 (450,006) 0 (48) 0 (11) 0-8 (8-14) 0 (0-0.73)
During 16 years ofage
40,026 (368,184) 1 (58) 2 (16) 0-14 (12-20) 0.16 (0-0.92)
During 17 years ofage
31,164 (287,742) 1 (45) 3 (16) 0-18 (11-21) 0.21 (0.01-1.2)
During 18 years ofage
22,380 (207,930) 1 (28) 4 (13) 0-25 (9-19) 0.33 (0.01-2.01)
During 19 years ofage
13,542 (127,002) 0 (20) 0 (16) 0-27 (10-24) 0 (0-1.9)
Table 28 Appendix: Incidence of pertussis among children, comparingthe Gothenburg area (primary numbers) with the rest of Sweden (inbrackets). The children are born from January 1, 1996 until Dec 31 2016and followed from January 1, 2003 until Dec 31 2016 with culture-, orPCR-confirmed B.pertussis with positive serology from 2008. Datacollection was performed in the EPS. Person-years of follow-up, numberof laboratory confirmed cases, incidence per 100,000 person-years offollow-up and relative risk of having a laboratory-verified episode ofB.pertussis in age-/vaccine-groups at onset of the pertussis episode isanalysed; 0-<3 months of age (before Dose 1); 3-<5 months of age (betweenDose 1 and 2); 5-<12 months of age (between Dose 2 and 3); and after 12months of age (after Dose 3) in thirteen age intervals. Age is calculated atthe date for onset of cough during the episode (for cases without cough thedate for the positive sample is used). Age interval in the heading classifiesunimmunised children.
161

Table 29 Appendix: Sweden from 1997 and the Gothenburg studyarea from 2003.
162

Age at onsetof pertussis;vaccine-or agegroup.
Person years offollow up
No of laboratoryconfirmed cases
Incidenceper 100,000person-years
95% confidenceinterval
Relative riskin Gothenburgcompared withSweden exceptGothenburg
Between 2and 3 doses(151-365days)
91,658 (796,147) 94 (108) 103 (14) 83-126 (11-16) 7.56 (5.67-10.06)
After Dose 3and/or during 1year of age
155,274 (1,348,674) 61 (68) 39 (5) 30-50 (4-6) 7.79 (5.42-11.17)
During 2 years ofage
152,754 (1,327,260) 44 (71) 29 (5) 21-39 (4-7) 5.38 (3.61-7.95)
During 3 years ofage
149,928 (1,305,138) 28 (84) 19 (6) 12-27 (5-8) 2.9 (1.82-4.5)
During 4 years ofage
146,976 (1,283,298) 46 (72) 31 (6) 23-42 (4-7) 5.58 (3.77-8.19)
During 5 years ofage
144,162 (1,263,402) 47 (91) 33 (7) 24-43 (6-9) 4.53 (3.11-6.51)
During 6 years ofage
141,234 (1,245,522) 62 (123) 44 (10) 34-56 (8-12) 4.45 (3.22-6.08)
During 7 years ofage
133,692 (1,186,992) 61 (137) 46 (12) 35-59 (10-14) 3.95 (2.87-5.38)
During 8 years ofage
122,076 (1,088,064) 29 (125) 24 (11) 16-34 (10-14) 2.07 (1.33-3.12)
During 9 years ofage
110,808 (990,972) 10 (103) 9 (10) 4-17 (8-13) 0.87 (0.4-1.66)
During 10 years ofage
99,696 (895,416) 7 (54) 7 (6) 3-14 (5-8) 1.16 (0.45-2.57)
During 11 years ofage
88,950 (802,530) 3 (38) 3 (5) 1-10 (3-6) 0.71 (0.14-2.24)
During 12 years ofage
78,534 (711,804) 1 (36) 1 (5) 0-7 (4-7) 0.25 (0.01-1.5)
During 13 years ofage
68,382 (621,912) 0 (28) 0 (5) 0-5 (3-7) 0 (0-1.28)
During 14 years ofage
58,608 (534,198) 1 (28) 2 (5) 0-10 (3-8) 0.33 (0.01-1.97)
During 15 years ofage
49,158 (450,006) 0 (38) 0 (8) 0-8 (6-12) 0 (0-0.93)
During 16 years ofage
40,026 (368,184) 1 (39) 2 (11) 0-14 (8-14) 0.24 (0.01-1.39)
During 17 years ofage
31,164 (287,742) 0 (22) 0 (8) 0-12 (5-12) 0 (0-1.69)
During 18 years ofage
22,380 (207,930) 1 (11) 4 (5) 0-25 (3-9) 0.84 (0.02-5.81)
During 19 years ofage
13,542 (127,002) 0 (8) 0 (6) 0-27 (3-12) 0 (0-5.49)
Table 29 Appendix: Incidence of pertussis among children vaccinated with2 or more doses prior to episode onset, comparing the Gothenburg area(primary numbers) with the rest of Sweden (in brackets). The children areborn from January 1, 1996 until Dec 31 2016 and followed from January 1,2003 until Dec 31 2016 with culture-, or PCR-confirmed B.pertussis withpositive serology from 2008. Data collection was performed in the Swedishenhanced surveillance study of pertussis. Approximate person-years offollow-up (assuming all children are vaccinated on schedule), numberof laboratory confirmed cases, incidence per 100,000 person-years offollow-up and relative risk of having a laboratory-verified episode ofB.pertussis in age-/vaccine-groups at onset of the pertussis episode isanalysed; 0-<3 months of age (before Dose 1); 3-<5 months of age (betweenDose 1 and 2); 5-<12 months of age (between Dose 2 and 3); and after 12months of age (after Dose 3) in thirteen age intervals. Age is calculated atthe date for onset of cough during the episode (for cases without cough thedate for the positive sample is used). Age interval in the heading classifiesunimmunised children
163

Table 30 Appendix: WHO-criterion, Sweden from 1997 and the Gothenburgstudy area from 2003.
164

Age at onset ofpertussis; vaccine-or age group.
Person years offollow up
No of laboratoryconfirmed cases
Incidenceper 100,000person-years
95% confidenceinterval
Relative riskin Gothenburgcompared withSweden exceptGothenburg
Between 2and 3 doses(151-365days)
91,658 (796,147) 39 (83) 43 (10) 30-58 (8-13) 4.08 (2.72-6.04)
After Dose 3and/or during 1year of age
155,274 (1,348,674) 28 (43) 18 (3) 12-26 (2-4) 5.66 (3.38-9.32)
During 2 years ofage
152,754 (1,327,260) 18 (52) 12 (4) 7-19 (3-5) 3.01 (1.66-5.23)
During 3 years ofage
149,928 (1,305,138) 14 (66) 9 (5) 5-16 (4-6) 1.85 (0.96-3.32)
During 4 years ofage
146,976 (1,283,298) 28 (51) 19 (4) 13-28 (3-5) 4.79 (2.91-7.75)
During 5 years ofage
144,162 (1,263,402) 32 (65) 22 (5) 15-31 (4-7) 4.31 (2.73-6.69)
During 6 years ofage
141,234 (1,245,522) 45 (95) 32 (8) 23-43 (6-9) 4.18 (2.86-6.02)
During 7 years ofage
133,692 (1,186,992) 39 (104) 29 (9) 21-40 (7-11) 3.33 (2.24-4.85)
During 8 years ofage
122,076 (1,088,064) 19 (95) 16 (9) 9-24 (7-11) 1.78 (1.03-2.94)
During 9 years ofage
110,808 (990,972) 9 (78) 8 (8) 4-15 (6-10) 1.03 (0.45-2.06)
During 10 years ofage
99,696 (895,416) 7 (40) 7 (4) 3-14 (3-6) 1.57 (0.59-3.55)
During 11 years ofage
88,950 (802,530) 3 (28) 3 (3) 1-10 (2-5) 0.97 (0.19-3.13)
During 12 years ofage
78,534 (711,804) 0 (31) 0 (4) 0-5 (3-6) 0 (0-1.15)
During 13 years ofage
68,382 (621,912) 0 (22) 0 (4) 0-5 (2-5) 0 (0-1.66)
During 14 years ofage
58,608 (534,198) 0 (22) 0 (4) 0-6 (3-6) 0 (0-1.66)
During 15 years ofage
49,158 (450,006) 0 (35) 0 (8) 0-8 (5-11) 0 (0-1.02)
During 16 years ofage
40,026 (368,184) 1 (35) 2 (10) 0-14 (7-13) 0.26 (0.01-1.56)
During 17 years ofage
31,164 (287,742) 0 (20) 0 (7) 0-12 (4-11) 0 (0-1.87)
During 18 years ofage
22,380 (207,930) 1 (10) 4 (5) 0-25 (2-9) 0.93 (0.02-6.53)
During 19 years ofage
13,542 (127,002) 0 (7) 0 (6) 0-27 (2-11) 0 (0-6.51)
Table 30 Appendix: Incidence of pertussis fulfilling the WHO critera (21 ormore days of spasmodic cough), among children vaccinated with 2 or moredoses prior to episode onset, comparing the Gothenburg area (primarynumbers) with the rest of Sweden (in brackets). The children are bornfrom January 1, 1996 until Dec 31 2016 and followed from January 1, 2003until December 31, 2013 with culture-, or PCR-confirmed B.pertussis withpositive serology from 2008. Data collection was performed in the Swedishenhanced surveillance study of pertussis. Approximate person-years offollow-up (assuming all children are vaccinated on schedule), numberof laboratory confirmed cases, incidence per 100,000 person-years offollow-up and relative risk of having a laboratory-verified episode ofB.pertussis in age-/vaccine-groups at onset of the pertussis episode isanalysed; 0-<3 months of age (before Dose 1); 3-<5 months of age (betweenDose 1 and 2); 5-<12 months of age (between Dose 2 and 3); and after 12months of age (after Dose 3) in thirteen age intervals. Age is calculated atthe date for onset of cough during the episode (for cases without cough thedate for the positive sample is used). Age interval in the heading classifiesunimmunised children.
165

Table 31 Appendix: Sweden from 1997 and the Gothenburg studyarea from 2003.
Age at onset offollow up
Person years offollow up
No of laboratoryconfirmed cases
Incidenceper 100,000person-years
95% confidenceinterval
Relative riskin Gothenburgcompared withSweden exceptGothenburg
0-<3Months 51,523 (451,337) 176 (700) 342 (155) 293-396 (144-167) 2.2 (1.86-2.6)3-<5Months 34,238 (300,066) 115 (507) 336 (169) 277-403 (155-184) 1.99 (1.61-2.44)5-<12Months 119,150 (1,045,176) 248 (355) 208 (34) 183-236 (31-38) 6.13 (5.19-7.23)During 1 years ofage
201,867 (1,774,444) 204 (193) 101 (11) 88-116 (9-13) 9.29 (7.59-11.37)
During 2 years ofage
192,780 (1,695,444) 134 (196) 70 (12) 58-82 (10-13) 6.01 (4.79-7.53)
During 3 years ofage
181,092 (1,592,880) 98 (187) 54 (12) 44-66 (10-14) 4.61 (3.57-5.92)
During 4 years ofage
169,356 (1,491,228) 90 (179) 53 (12) 43-65 (10-14) 4.43 (3.4-5.73)
During 5 years ofage
157,704 (1,390,404) 87 (165) 55 (12) 44-68 (10-14) 4.65 (3.54-6.06)
During 6 years ofage
145,794 (1,288,608) 82 (186) 56 (14) 45-70 (12-17) 3.9 (2.97-5.08)
During 7 years ofage
133,692 (1,186,992) 66 (169) 49 (14) 38-63 (12-17) 3.47 (2.57-4.63)
During 8 years ofage
122,076 (1,088,064) 34 (154) 28 (14) 19-39 (12-17) 1.97 (1.32-2.87)
During 9 years ofage
110,808 (990,972) 10 (129) 9 (13) 4-17 (11-15) 0.69 (0.32-1.32)
During 10 years ofage
99,696 (895,416) 7 (63) 7 (7) 3-14 (5-9) 1 (0.39-2.18)
During 11 years ofage
88,950 (802,530) 5 (56) 6 (7) 2-13 (5-9) 0.81 (0.25-1.99)
During 12 years ofage
78,534 (711,804) 1 (45) 1 (6) 0-7 (5-8) 0.2 (0-1.18)
During 13 years ofage
68,382 (621,912) 0 (40) 0 (6) 0-5 (5-9) 0 (0-0.88)
During 14 years ofage
58,608 (534,198) 1 (33) 2 (6) 0-10 (4-9) 0.28 (0.01-1.65)
During 15 years ofage
49,158 (450,006) 0 (49) 0 (11) 0-8 (8-14) 0 (0-0.72)
During 16 years ofage
40,026 (368,184) 1 (57) 2 (15) 0-14 (12-20) 0.16 (0-0.94)
During 17 years ofage
31,164 (287,742) 1 (48) 3 (17) 0-18 (12-22) 0.19 (0-1.12)
During 18 years ofage
22,380 (207,930) 0 (26) 0 (13) 0-16 (8-18) 0 (0-1.42)
During 19 years ofage
13,542 (127,002) 1 (23) 7 (18) 0-41 (11-27) 0.41 (0.01-2.51)
Table 31 Appendix: Incidence of pertussis, comparing the Gothenburg area(primary numbers) with the rest of Sweden (in brackets). The children areborn from January 1, 1996 until Dec 31 2016 and followed from October 1,1997 until Dec 31 2016 with culture-, or PCR-confirmed B.pertussis withpositive serology from 2008. Data collection was performed in the Swedishenhanced surveillance study of pertussis. Person-years of follow-up,number of laboratory confirmed cases, incidence per 100,000 person-yearsof follow-up and relative risk of having a laboratory-verified episode ofB.pertussis in age-/vaccine-groups at onset of the pertussis episode isanalysed; 0-<3 months of age (before Dose 1); 3-<5 months of age (betweenDose 1 and 2); 5-<12 months of age (between Dose 2 and 3); and after 12months of age (after Dose 3) in thirteen age intervals. Age is calculated atthe date for onset of cough during the episode (for cases without cough thedate for the positive sample is used). Age interval in the heading classifiesunimmunised children.
166

Table 32 Appendix: Sweden from 1997 and the Gothenburg studyarea from 2003.
167

Age at onset ofpertussis; vaccine-or age group.
Person years offollow up
No of laboratoryconfirmed cases
Incidenceper 100,000person-years
95% confidenceinterval
Relative riskin Gothenburgcompared withSweden exceptGothenburg
Between 2 and 3doses
119,150 (1,045,176) 209 (206) 175 (20) 152-201 (17-23) 8.9 (7.31-10.84)
After Dose 3 andduring 1 year ofage
201,867 (1,774,444) 172 (107) 85 (6) 73-99 (5-7) 14.13 (11.04-18.16)
During 2 years ofage
192,780 (1,695,444) 118 (147) 61 (9) 51-73 (7-10) 7.06 (5.49-9.06)
During 3 years ofage
181,092 (1,592,880) 89 (148) 49 (9) 39-60 (8-11) 5.29 (4.02-6.93)
During 4 years ofage
169,356 (1,491,228) 80 (133) 47 (9) 37-59 (7-11) 5.3 (3.96-7.04)
During 5 years ofage
157,704 (1,390,404) 77 (128) 49 (9) 39-61 (8-11) 5.3 (3.94-7.09)
During 6 years ofage
145,794 (1,288,608) 68 (153) 47 (12) 36-59 (10-14) 3.93 (2.91-5.26)
During 7 years ofage
133,692 (1,186,992) 63 (134) 47 (11) 36-60 (9-13) 4.17 (3.04-5.67)
During 8 years ofage
122,076 (1,088,064) 32 (128) 26 (12) 18-37 (10-14) 2.23 (1.46-3.3)
During 9 years ofage
110,808 (990,972) 10 (110) 9 (11) 4-17 (9-13) 0.81 (0.38-1.55)
During 10 years ofage
99,696 (895,416) 7 (55) 7 (6) 3-14 (5-8) 1.14 (0.44-2.52)
During 11 years ofage
88,950 (802,530) 3 (40) 3 (5) 1-10 (4-7) 0.68 (0.13-2.12)
During 12 years ofage
78,534 (711,804) 1 (33) 1 (5) 0-7 (3-7) 0.27 (0.01-1.64)
During 13 years ofage
68,382 (621,912) 0 (27) 0 (4) 0-5 (3-6) 0 (0-1.33)
During 14 years ofage
58,608 (534,198) 1 (24) 2 (4) 0-10 (3-7) 0.38 (0.01-2.33)
During 15 years ofage
49,158 (450,006) 0 (37) 0 (8) 0-8 (6-11) 0 (0-0.96)
During 16 years ofage
40,026 (368,184) 1 (32) 2 (9) 0-14 (6-12) 0.29 (0.01-1.72)
During 17 years ofage
31,164 (287,742) 0 (20) 0 (7) 0-12 (4-11) 0 (0-1.87)
During 18 years ofage
22,380 (207,930) 0 (10) 0 (5) 0-16 (2-9) 0 (0-4.14)
During 19 years ofage
13,542 (127,002) 0 (9) 0 (7) 0-27 (3-13) 0 (0-4.75)
Overall inc. innon-infants
1,965,609(17,505,760)
722 (1,475) 37 (8) 34-40 (8-9) 4.36 (3.98-4.77)
Table 32 Appendix: Incidence of pertussis among children vaccinated with2 or more doses prior to episode onset, comparing the Gothenburg area(primary numbers) with the rest of Sweden (in brackets). The children areborn from January 1, 1996 until Dec 31 2016 and followed from October 1,1997 until Dec 31 2016 with culture-, or PCR-confirmed B.pertussis withpositive serology from 2008. Data collection was performed in the Swedishenhanced surveillance study of pertussis. Approximate person-years offollow-up (assuming all children are vaccinated on schedule), numberof laboratory confirmed cases, incidence per 100,000 person-years offollow-up and relative risk of having a laboratory-verified episode ofB.pertussis in age-/vaccine-groups at onset of the pertussis episode isanalysed; 0-<3 months of age (before Dose 1); 3-<5 months of age (betweenDose 1 and 2); 5-<12 months of age (between Dose 2 and 3); and after 12months of age (after Dose 3) in thirteen age intervals. Age is calculated atthe date for onset of cough during the episode (for cases without cough thedate for the positive sample is used). Age interval in the heading classifiesunimmunised children.
168

Year
Num
ber
of case
s
Num
ber
offu
lly
vacc
inat
edca
ses
Num
ber
offe
mal
eca
ses
Num
ber
ofm
ale
case
sN
umbe
rof
case
sw
ith
posi
tive
PCR
Num
ber
ofca
ses
wit
hSe
rolo
gy
Num
ber
ofca
ses
wit
his
olat
ion
of Bor
date
lla
Peru
ssis
bycu
ltur
e
Num
ber
ofca
ses
wit
hot
her
diag
nost
icm
etho
d
2007
124
3863
610
60
118
2008
163
4884
7982
5817
8
2009
7431
4331
3329
120
2010
7216
4131
4916
43
2011
3914
2217
269
22
2012
9131
5041
6219
73
2013
7530
3441
5512
17
2014
208
133
101
107
170
262
12
2015
162
8477
8513
813
56
2016
205
112
111
9417
819
47
Tota
l12
1353
762
658
779
320
754
166
Tabl
e33
App
endi
x:N
um
ber
ofre
por
ted
per
tuss
isca
ses
wit
hd
ata
onva
ccin
atio
nst
atu
sco
llect
edd
uri
ngth
ep
erio
d20
07to
2016
.D
ata
colle
ctio
nw
aspe
rfor
med
inth
eE
PS.
Fully
vacc
inat
edch
ildre
nw
ere
defi
ned
asch
ildre
nag
edbe
twee
non
eto
five
year
s,w
hoha
dre
ciev
edat
leas
tth
ree
dos
esof
aPva
ccin
and
chlid
ren
aged
betw
een
six
to18
year
sw
hoha
dre
ciev
edat
leas
tfo
urdo
ses
ofaP
vacc
in.
169

Årsrapporten för övervakningen av kikhosta (pertussis) beskriverutfallet av antal rapporterade fall av kikhosta för alla åldersgruppermed förstärkt övervakning av kikhosta hos barn och ungdomarsom pågått i Sverige under arton års tid. Rapporten beskriveri detalj förekomst av kikhosta utifrån ålder, vaccinationsstatusoch sjukdomsbörda med särskilt fokus på barn yngre än ettår. Rapporten är avsedd som kunskapsstöd för forskare ochvårdgivare. Målgruppen för årsrapporten är hälso- ochsjukvårdspersonal, och då särskilt personal inom mödravård,barnhälsovård och barnsjukvård samt primärvård ochsmittskyddsenheter.————————————————-
Folkhälsomyndigheten är en nationell kunskapsmyndighetsom arbetar för en bättre folkhälsa. Det gör myndighetengenom att utveckla och stödja samhällets arbete med attfrämja hälsa, förebygga ohälsa och skydda mot hälsohot.Vår vision är en folkhälsa som stärker samhällets utveckling.
Solna Nobels väg 18, SE-171 82 Solna Östersund Forskarens väg 3, SE-831 40 Östersund.www.folkhalsomyndigheten.se
170