Embed Size (px)
Citation preview

PERUVIAN ECONOMIC ASSOCIATION
The Effect of Bonuses on Teacher Behavior:
A Story with Spillovers
Juan F. Castro
Bruno Esposito
Working Paper No. 104, December 2017
Updated August 2018
The views expressed in this working paper are those of the author(s) and not those of the Peruvian
Economic Association. The association itself takes no institutional policy positions.

1
The Effect of Bonuses on Teacher Behavior:
A Story with Spillovers
Juan F. Castro Bruno Esposito Department of Economics Universidad del Pacifico
Department of Engineering Universidad del Pacifico
This version: July 2018
Abstract
Teachers in many developing countries are offered monetary incentives to work in secluded, hard-to-reach schools. This is a fairly common practice but there is very little evidence about its effect on teacher behavior or learning outcomes. In addition, estimating the effect of these incentives is problematic because they can produce spillovers that affect control schools. This is the first study to account for this potential source of bias. We estimate the effect of the bonus paid in rural schools in Peru on teacher attrition, the proportion of teacher vacancies filled and learning outcomes measured in 2016. We exploit the exogenous variation in the assignment of the bonus around the distance cutoff used to classify a school as rural. To account for the externality, we assume that those schools that fail to meet the distance criterion but have a treated school nearby can be affected by the bonus. We found that the bonus was effective in reducing teacher attrition and increasing the probability of filling a teacher vacancy with effects ranging between 1.1 and 1.6 percentage points. Failure to account for spillovers would have led to overestimating the effect of the bonus by, at least, 20% in the case of teacher attrition and 30% in the case of the proportion of teacher vacancies filled. The positive effect on the probability of filling a teacher vacancy was driven by the response of contract teachers only. We did not find evidence of an effect on tenured teachers or on learning outcomes among second grade students.
Keywords: teacher incentives, rural schools, spillovers, regression discontinuity. JEL codes: I21, C26.

2
1. Introduction and motivation
Teachers in many developing countries are offered monetary incentives to work in
secluded, hard-to-reach schools (Pugatch and Schroeder, 2014). Despite this is a fairly
common practice, there is little evidence about its effectiveness in shifting teacher
behavior or learning outcomes.
The relation between conditional incentives and teacher performance is already well
documented for both developed (Podgursky and Springer, 2006; Podgursky, 2008;
Koppich, 2008; Vegas and Umansky, 2005; Allan and Fryer, 2011) and developing
countries (Behrman, et al., 2015; Glewwe, Ilias and Kremer, 2010). The literature,
however, offers very little evidence about the effects of unconditional monetary
incentives paid to teachers working in hard-to-reach schools. In fact, Pugatch and
Schroeder (2014) was the first study to provide rigorous causal evidence about the
effect of this type of incentive. They estimated the effect of a wage premium paid to
teachers working in rural schools in Gambia on the proportion of qualified teachers.
They found it caused an increase of 10 percentage points.
Teachers will typically avoid working in low-income districts (Loeb, el al. 2002;
Hough, 2012) where basic services are in short supply, transport costs are high and
students show a low performance. In Peru, rural schools have poorer infrastructure and
less advantaged students than urban schools (Castro and Rolleston, 2018). According to
the 2015 national student evaluation, there is a 36 percentage point gap between the
proportion of urban and rural second grade students with adequate reading
comprehension skills. Rural schools also face difficulties filling teacher vacancies and
retaining their teachers. In 2016, nearly 20% of teacher vacancies in rural schools
remained open and around 13% of rural teachers left their placement before the end of
the academic year.
Peru is among the developing countries where unconditional monetary incentives are
offered to teachers working in hard-to-reach schools. The main criterion used to
determine if a school is eligible for this incentive or bonus is related to its “rurality” and
this, in turn, is determined by the school’s distance to the nearest province capital and
the population of the community hosting the school. The Peruvian Ministry of
Education has three classifications for rural schools: Rural 1, Rural 2 and Rural 3.
Schools classified as Rural 1 serve the smallest communities and are more distant from

3
a city. In 2015, the bonus for Rural 1 schools was raised significantly (from
S/. 200 to S/. 500) and it currently represents nearly 35% of the starting salary.
The objective of this paper is to estimate the effect of the teacher bonus paid in Rural 1
schools in Peru on teacher attrition, the proportion of teacher vacancies filled and
learning outcomes observed in 2016. For this, we exploit the exogenous variation in the
assignment of the bonus around the distance threshold used by the Ministry of
Education to classify a school as Rural 1. Importantly, we also account for possible
spillovers affecting control schools that have a Rural 1 school nearby.
The implementation of an incentive scheme to reward teachers working in hard-to-reach
areas needs a definition for “hard-to-reach”. Schools that meet the criterion for this
definition can then offer an additional payment to the teachers that decide to work there.
To estimate the causal effect of the incentive, one could randomly assign the bonus to a
subsample of the schools that meet the criterion and compare the outcome against those
that do not receive the bonus but are also classified as “hard-to-reach”.
Alternatively, if the criterion is based on a continuous variable (such as the distance to a
certain reference point) the effect of the bonus can be estimated using the exogenous
variation induced around the cutoff value used to classify a school as “hard-to-reach”.
This constitutes the basis of a regression discontinuity design. Schools that marginally
fail to meet the criterion serve as controls for those which marginally succeed in
meeting the criterion.1 This empirical strategy has already been implemented to identify
the effect of this type of bonuses (Pugatch and Schroeder, 2014).
An important threat to identification that can affect both experimental and regression
discontinuity designs has to do with the possible existence of spillovers. In particular,
control schools can end up affected by the presence of a bonus payment in treated
schools and will no longer serve as an adequate counterfactual. This threat stems from
one of the mechanisms through which the bonus may affect teacher behavior.
1 Notice that the strategies just described will not necessarily recover the same parameter. An experimental design can be implemented to provide an estimate of the treatment effect on the average school that meets the criterion to be classified as “hard-to-reach”. A regression discontinuity design will recover the effect of treatment in the schools situated around the cutoff value of the variable used to classify a school as “hard-to-reach”. That is, it is a local effect.

4
One of the channels through which these bonuses are expected to work involves making
hard-to-reach schools more attractive.2 The bonus can compensate for the additional
effort of working at a distant location and with less advantaged students, and turn the
net cost of working in a hard-to-reach school comparable to the net cost of working in a
school that does not fall into this classification. Thus, one of the intended mechanisms
of the bonus involves shifting the relative attractiveness of job openings in hard-to-reach
schools and this, in turn, can end up affecting the outcomes observed in the schools that
do not offer the bonus. This externality affecting outcomes in schools that serve as
controls will introduce a bias in the estimated effect of the bonus.
For example, the bonus can cause migration from schools that fail to meet the “hard-to-
reach” criterion to available vacancies in schools that meet the criterion. Also, for a
given pool of newly hired teachers and a sufficiently large number of job openings,
more teachers can decide to work in a hard-to-reach school so those schools that fail to
meet the criterion for the bonus will face a smaller likelihood of filling their vacancies.
This substitution effect will lead to an overestimation of the effect of the bonus. In fact,
a simple comparison of outcome values between treated and control schools will
consider the gain caused in treated schools but also the loss experienced by control
schools as part of the effect of the bonus.
This paper contributes to the literature in two ways. First, it is the first study to analyze
the effect of unconditional monetary incentives paid to teachers working in hard-to-
reach locations considering the possibility of spillovers. Second, it is also the first study
to offer evidence about the effect of this type of incentives on learning outcomes.
Our main results can be summarized as follows. The rural bonus paid in Rural 1 schools
in Peru has been effective in reducing teacher attrition between 1.2 and 1.5 percentage
points. Failure to account for spillovers would have led to overestimating this effect by,
at least, 20%. We found a positive effect of the bonus on the proportion of vacancies
filled ranging between 1.1 and 1.6 percentage points. We also found a significant
negative externality affecting the probability of filling teacher vacancies in control
schools that have a Rural 1 school nearby. Ignoring this spillover would have led to an
overestimation of the effect of the bonus by, at least, 30%. A distinction between
2 Another possible mechanism involves inducing a change in behavior among existing teachers who, for
instance, can decide to devote more time to their teaching duties.

5
contract and tenured teachers reveals that the positive effect found for the aggregate
proportion of teacher vacancies filled was driven by an increase in contract teachers
only. We found a negative externality affecting the probability of filling teacher
vacancies with tenured teachers that was only partially offset by a positive spillover on
contract teachers. We did not find robust evidence of an effect on learning outcomes
among second grade students.
The rest of the paper is organized as follows. Section 2 describes the incentive scheme
offered in rural schools in Peru. Section 3 describes the empirical strategy. In Section 4
we confirm that rural schools situated around the distance cutoff used to classify a
school as Rural 1 shared similar characteristics before treatment. We also confirm that
there has been no manipulation of the distance scores, so treated schools have not
chosen to be treated. In Section 5 we present and discuss our results. Section 6 closes
with some concluding remarks.
2. Rural bonuses in Peru
Bonuses were first implemented in 1990. The amount paid was less than S/. 50 (17% of
the 2017 minimum wage) and it was only offered in single teacher schools and schools
located in a national border. In 2014, the Ministry of Education changed the bonus
scheme including more school categories and increasing the size of bonuses.
Three important bonus categories are related to the degree of rurality of the school. In
particular, schools are classified as Rural 1, Rural 2 or Rural 3 based on two variables:
(i) the population of the community hosting the school; and (ii) the distance to the
nearest province capital. Schools classified as Rural 1 are the most rural. These schools
are located in a community with less than 500 inhabitants and are more than 120
minutes away from the nearest province capital. These schools currently receive the
largest bonus (S/. 500, which is around US$ 150 and approximately 35% of the starting
salary). Figure 1 shows the distance and population cutoffs used to classify a school into
one the three categories.
The population of rural schools in 2016 comprises 41,436 schools. Around 36% of them
are classified as Rural 1, 44% as Rural 2, and 20% as Rural 3. Table 1 shows the
number of schools in each category, the amount of the rural bonus assigned to each

6
type, and the average bonus received by the schools that belong to each category. The
average bonus is larger than the rural bonus assigned to each category because schools
can also receive bonuses based on other criteria that correlate with rurality.3 Table 1
also shows average figures for teacher attrition and teacher vacancies filled in 2016. In
that year, around 17% of teacher vacancies remained open in rural schools, while nearly
13% of teachers left their placement before the end of the academic year.
Figure 1
Distribution of schools according to the distance and population cutoffs used to
classify a school as rural
3 These criteria are: being single teacher, multigrade, bilingual, located in a national border or located in the valley situated between the Apurimac, Ene and Mantaro rivers (a highly poor and challenging environment due to drug trafficking). Schools can receive more than one bonus.
Distance refers to the school’s distance (in minutes) to the nearest province capital. Population
refers to the number of people living in the community hosting the school.
Distancia
R2Average bonus: S/. 212.7
17,081 schools (41%)
R3Average bonus: S/. 171.5
4,882 schools (12%)
Población
R1Average bonus: S/. 640.8
14,942 schools (36%)
R2Average bonus: S/. 164.9
1,044 schools (3%)
R3Average bonus: S/. 114.6
3,487 schools (8%)
500
120
30
Distance
Population

7
Table 1
Distribution of rural schools, bonus payments, teacher attrition and proportion of
teacher vacancies filled (2016) Number of
schools
Assigned
bonus
Average
bonus
Teacher
attrition /a
% vacancies
filled /b
Rural 1 14,942 500.0 640.81 13.1% 82.3% Rural 2 18,125 100.0 209.95 12.2% 83.7% Rural 3 8,369 70.0 147.80 11.9% 83.7%
Total 41,436 238.2 352.77 12.5% 83.2% /a Proportion of teachers that left the school before the end of the 2016 academic year. /b Proportion of teacher vacancies that were filled by the end of the 2016 academic year
Table 2
Distribution of rural schools, bonus payments, teacher attrition and proportion of
teacher vacancies filled in the sample considered for the analysis
Number of
schools
Assigned
bonus
Average
bonus
Teacher
attrition /a
% vacancies
filled /b
A. Rural 1 and Rural 2 schools with less than 500 inhabitants
Rural 1 14,942 500.0 640.8 13.1% 82.32% Rural 2 17,081 100.0 212.8 12.0% 84.11%
Total 32,023 233.84 412.46 12.51% 83.27%
B. Rural 1 and Rural 2 schools with less than 500 inhabitants and complete information
about neighboring schools
Rural 1 9,852 500.0 682.2 12.6% 83.0% Rural 2 10,691 100.0 256.1 11.6% 84.9%
Total 20,543 291.8 460.4 12.1% 84.0% /a Proportion of teachers that left the school before the end of the 2016 academic year. /b Proportion of teacher vacancies that were filled by the end of the 2016 academic year.
This analysis will focus on estimating the effect of the bonus paid in Rural 1 schools on
teacher attrition, the percentage of teacher vacancies filled and learning outcomes
observed in 2016. For this, Figure 1 reveals that we could exploit variation across the
distance cutoff of 120 minutes and across the population cutoff of 500 inhabitants. For
the results we present and discuss below, we will exploit the variation in the assignment
of the bonus across the distance cutoff of 120 minutes. This means our sample will
comprise Rural 1 and Rural 2 schools that fall below the population threshold of 500
inhabitants. Notice that this sample comprises nearly 97% of the population of Rural 1
and Rural 2 schools and it ensures a balanced number of schools at both sides of the
threshold value of the running variable.

8
In Table 2 we present the basic descriptive statistics for the sample of schools
considered for this analysis. Notice we had to exclude around 35% of Rural 1 and Rural
2 schools from our final sample because they lacked complete information about
neighboring schools. As will be explained below, this information is required to
implement the strategy proposed to account for spillovers. Notice, however, that there
are no significant differences in outcome values with respect to the population of Rural
1 and Rural 2 schools.
Figure 2 presents the relationship between the school’s distance to the nearest province
capital (the running variable for this analysis) and the amount of the bonus, teacher
attrition and the proportion of teacher vacancies filled. This is done for the sample of
Rural 1 and Rural 2 schools that fall below the population threshold and for which we
have complete information about neighboring schools. Panel A in Figure 2 reveals that
there is good compliance with the bonus payment following the criteria proposed to
classify a school as Rural 1. There is a sharp discontinuity around the 120 minute cutoff,
so teachers working in a school that marginally falls above this threshold earn S/. 400
more than the teachers that work in a school that marginally falls below the 120 minute
cutoff.
As expected, panel B shows that the relation between the school’s distance to the
nearest province capital and teacher attrition is positive. In panel C we observe a
negative relation between the running variable and the proportion of teacher vacancies
filled. The linear fit used for the figures presented in panels B and C suggests a
discontinuity in both outcome variables around the distance cutoff. We need, however,
to account for standard errors and potential non-linearities in the relation between these
outcomes and the running variable. Recall, also, that the presence of spillovers affecting
control schools can bias our assessment of the effect of the bonus. A substitution effect
as the one described in the Introduction can inflate the size of the discontinuity around
the distance cutoff. In what follows, we propose an empirical strategy to account for all
these issues.

9
Figure 2
Relationship between the size of the bonus, teacher attrition and teacher vacancies
filled, and the school’s distance to the nearest province capital
A. Bonus payments and school distance to the nearest province capital
B. Teacher attrition and school distance to the nearest province capital
C. Teacher vacancies filled and school distance to the nearest province capital
0.0
010
.00
20
.00
30
.00
40
.00
50
.00
0 200 400 600P-value: 0.812
Sample average within bin Polynomial fit of order 1
60
70
80
90
10
0
0 200 400 600P-value: 0.827
Sample average within bin Polynomial fit of order 1

10
3. Empirical strategy
The following empirical specification will be used to implement the regression
discontinuity design:
�� = �� + ���� + �� , �� + �� (1)
Where �� is the outcome of interest measured in school �, �� is an indicator function that
has the value of 1 if school � is classified as Rural 1, and �� , �� is a function of the
school’s distance to the nearest province capital ��� and the population of its
community ��. This function should be flexible enough to account for the relationship
between the outcome of interest and these two variables, especially the distance to the
nearest province capital which is the variable used to define a school as Rural 1 in the
sample of interest.
Function �� , �� will be an nth-order polynomial of the distance to the nearest
province capital and the population of the community hosting the school. It will also
include an interaction between the distance to the nearest province capital and an
indicator that has the value of 1 if the distance is above the threshold of 120 minutes.
We will consider polynomial orders between 1 and 4 when discussing our results.
Because classification as Rural 1 is fully determined by �� in the sample of interest,
variation in �� should be exogenous after controlling for �� , ��. Thus, identification
will exploit variation in �� around the cutoff value of �� used by the Ministry of
Education to classify a school as Rural 1. Rural 2 schools that marginally fall short in
this criterion will serve as controls for Rural 1 schools that marginally satisfy the
criterion. Parameter �� measures the effect of the bonus.
The presence of spillovers affecting Rural 2 schools that marginally fail to meet the
criterion to be classified as Rural 1 implies that control schools are no longer an
adequate counterfactual for treated schools. In particular, we argue that the bonus paid
in Rural 1 schools can affect the degree of teacher attrition and the probability of filling
teacher vacancies in Rural 2 schools serving as control schools in the regression
discontinuity design. To isolate this spillover, we will assume that not all Rural 2
schools serving as controls are affected with the same intensity by the externality. In
particular, we will assume that the spillover is determined by the presence of a treated
11
(Rural 1) school nearby. In other words, Rural 2 schools that can be affected by the
bonus are those that have a neighboring Rural 1 school. This relies on the notion that
schools located close to each other will be likely perceived as similar by teachers
because they share the same environment. Therefore, the presence of a bonus payment
in one of the neighboring schools can trigger a substitution effect that ends up affecting
the school that does not offer the bonus. Rural 2 schools that marginally fail to meet the
criterion to be classified as Rural 1 but do not have a neighboring Rural 1 school are
less likely affected by this externality and, thus, are assumed to be an adequate
counterfactual.
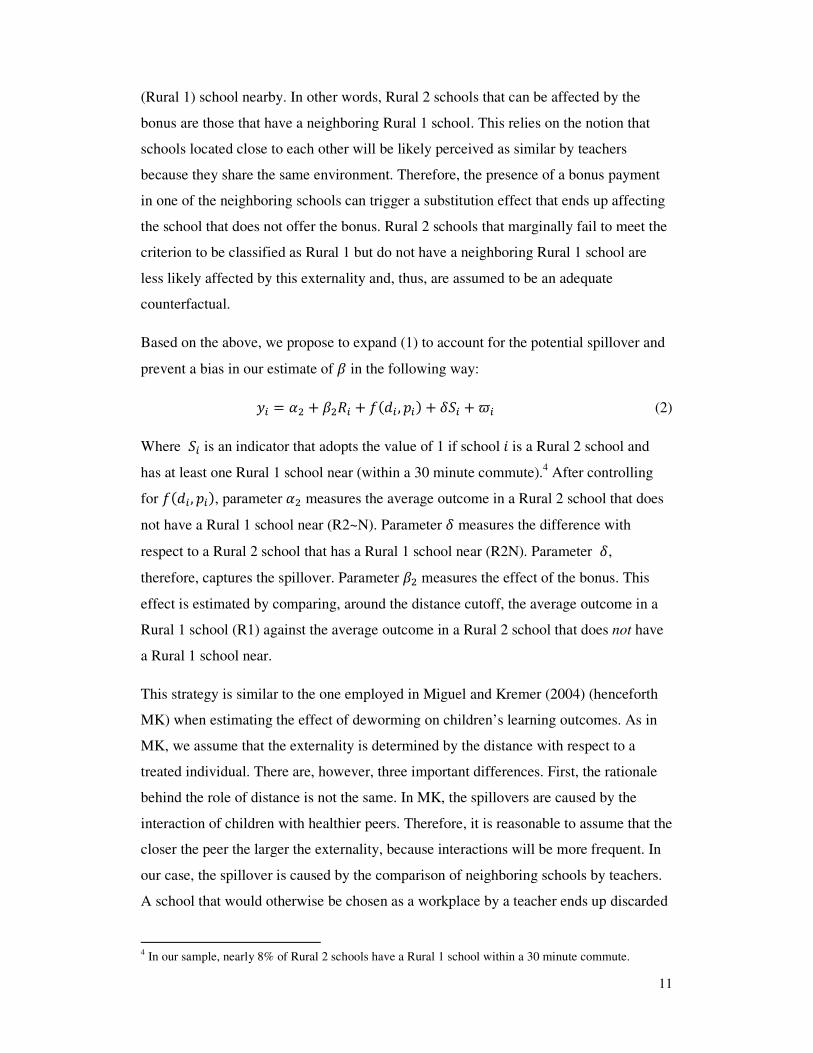
Based on the above, we propose to expand (1) to account for the potential spillover and
prevent a bias in our estimate of � in the following way:
�� = �� + ���� + �� , �� + ��� +�� (2)
Where �� is an indicator that adopts the value of 1 if school �is a Rural 2 school and
has at least one Rural 1 school near (within a 30 minute commute).4 After controlling
for �� , ��, parameter �� measures the average outcome in a Rural 2 school that does
not have a Rural 1 school near (R2~N). Parameter � measures the difference with
respect to a Rural 2 school that has a Rural 1 school near (R2N). Parameter �,
therefore, captures the spillover. Parameter �� measures the effect of the bonus. This
effect is estimated by comparing, around the distance cutoff, the average outcome in a
Rural 1 school (R1) against the average outcome in a Rural 2 school that does not have
a Rural 1 school near.
This strategy is similar to the one employed in Miguel and Kremer (2004) (henceforth
MK) when estimating the effect of deworming on children’s learning outcomes. As in
MK, we assume that the externality is determined by the distance with respect to a
treated individual. There are, however, three important differences. First, the rationale
behind the role of distance is not the same. In MK, the spillovers are caused by the
interaction of children with healthier peers. Therefore, it is reasonable to assume that the
closer the peer the larger the externality, because interactions will be more frequent. In
our case, the spillover is caused by the comparison of neighboring schools by teachers.
A school that would otherwise be chosen as a workplace by a teacher ends up discarded
4 In our sample, nearly 8% of Rural 2 schools have a Rural 1 school within a 30 minute commute.
12
because they start offering a higher wage in a neighboring school. The intensity of the
externality, thus, will not necessarily increase with proximity but rather one can think of
a distance threshold below which schools are considered as similar by the average
teacher.
Second, in MK, externalities affected both control and treated children. In our case, the
spillover only affects control schools because these are the ones that experience a shift
in their relative attractiveness with respect to treated schools. Accordingly, in (2)
parameter � accounts for the fact that having a Rural 1 school near can affect school � if
school � is a Rural 2 school.
The third difference is that in MK, the spillover is identified using the exogenous
variation in the number of treated children in the vicinity of each child caused by the
random assignment of treatment. In our case, we have to assume that, around the cutoff
value of ��, variation in the likelihood of having a treated school near is exogenous.
Identification of the spillover effect, thus, depends on the same assumption as the
identification of the treatment effect in a regression discontinuity design: around the
cutoff value of ��, schools have been effectively assigned to treatment in a random
fashion.
4. Balanced pre-treatment characteristics and absence of
manipulation of distance scores
A key assumption for the identification of the effect of the bonus and the spillover is
that R1, R2~N and R2N schools are all comparable around the distance cutoff of 120
minutes. The only difference between an R1 and an R2~N school should be that the R1
receives a bonus. The only difference between an R2N and an R2~N school should be
that the R2N has a treated school nearby. One way of testing this is by comparing the
characteristics of these schools before the bonus scheme was introduced. To implement
this comparison, we will estimate the regressions presented in (1) and (2) considering a
wide range of school characteristics as outcomes, for polynomial orders ranging from 1
to 4.5 Balanced pre-treatment characteristics should manifest as the absence of
5 We would have preferred to include pre-treatment values for teacher attrition and the proportion of teacher vacancies filled but there is no reliable information on teachers’ transitions during the academic year or the number of vacancies available in each school prior to 2016. The results presented below, however, do consider the number of tenured and contract teachers in each school.

13
significant estimates for parameters ��, �� and �. Parameter �� captures the difference
between an R1 school and the average Rural 2 school around the distance cutoff value.
Parameters �� and � capture the difference (again, around the distance threshold)
between an R1 and a R2~N school and the difference between an R2N and a R2~N
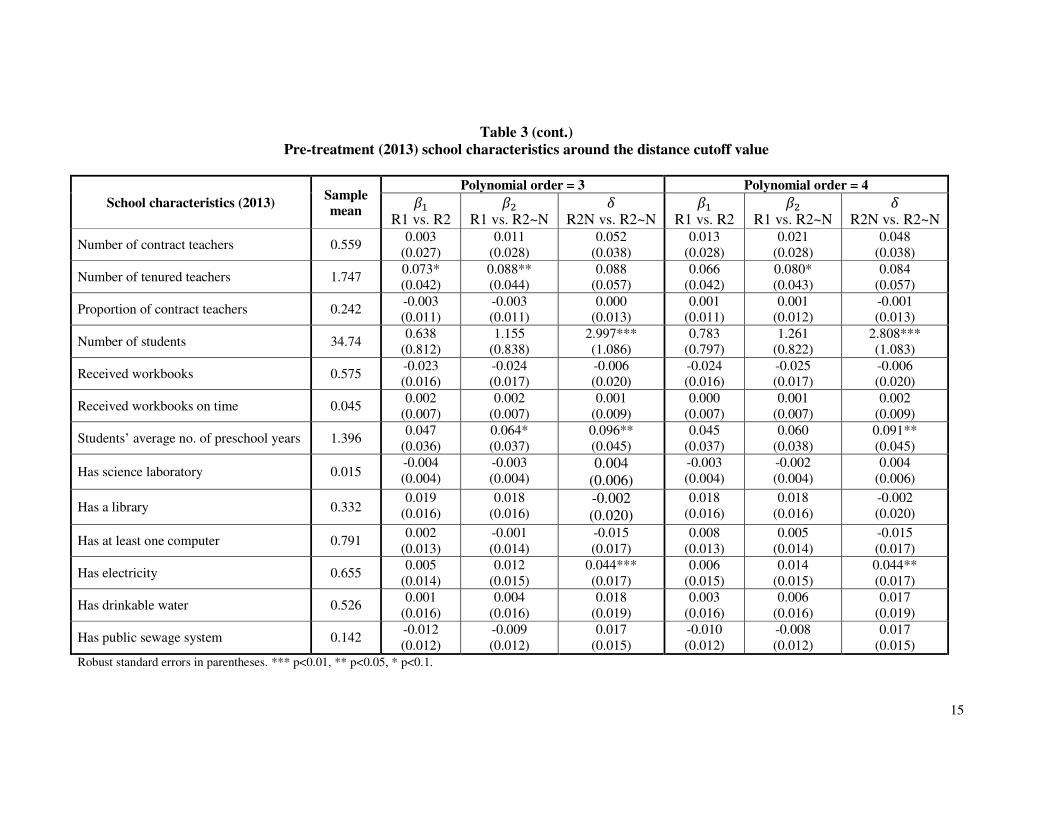
school, respectively. The results are presented in Table 3.
The vast majority of estimates across the thirteen school indicators and the four
polynomial orders considered are not significant using conventional p-values. There is a
positive difference in the number of tenured teachers apparently favoring R1 schools
that remains significant for two of the four polynomial orders. Notice, however, that the
sizes are quite small and that the participation of contract teachers is statistically the
same in the three school categories. There are also differences that remain significant in
the number of students, their average number of preschool years and the likelihood of
having electricity that apparently favor R2N schools when compared to R2~N schools.
Again, however, the size of these differences is quite small. In addition, notice that the
comparison of R2N and R2~N schools we propose in our main results intends to capture
a negative externality affecting R2N schools. This means that the direction of the three
differences that remain significant in Table 3 is contrary to the effect we intend to
estimate. Therefore, if one believes they are truly significant, these differences add a
more conservative stance to our main results.

14
Table 3
Pre-treatment (2013) school characteristics around the distance cutoff value
School characteristics (2013) Sample
mean
Polynomial order = 1 Polynomial order = 2
�� R1 vs. R2
�� R1 vs. R2~N
� R2N vs. R2~N
�� R1 vs. R2
�� R1 vs. R2~N
� R2N vs. R2~N
Number of contract teachers 0.559 -0.006 (0.023)
0.003 (0.024)
0.051 (0.038)
-0.005 (0.026)
0.004 (0.027)
0.052 (0.038)
Number of tenured teachers 1.747 0.038
(0.037) 0.053
(0.039) 0.081
(0.057) 0.080** (0.040)
0.095** (0.042)
0.088 (0.057)
Proportion of contract teachers 0.242 -0.008 (0.010)
-0.008 (0.010)
0.000 (0.013)
-0.010 (0.011)
-0.010 (0.011)
0.000 (0.013)
Number of students 34.74 0.117
(0.713) 0.616
(0.743) 2.848*** (1.101)
0.450 (0.775)
0.967 (0.802)
2.994*** (1.095)
Received workbooks 0.575 -0.014 (0.014)
-0.015 (0.014)
-0.006 (0.020)
-0.019 (0.015)
-0.020 (0.016)
-0.006 (0.020)
Received workbooks on time 0.045 -0.002 (0.006)
-0.002 (0.006)
0.001 (0.009)
0.004 (0.007)
0.004 (0.007)
0.001 (0.009)
Students’ average no. of preschool years 1.396 0.035
(0.032) 0.052
(0.033) 0.098** (0.045)
0.056 (0.035)
0.072** (0.036)
0.095** (0.045)
Has science laboratory 0.015 -0.002 (0.004)
-0.001 (0.004)
0.004 (0.006)
-0.002 (0.004)
-0.001 (0.004)
0.004 (0.006)
Has a library 0.332 0.009
(0.014) 0.008
(0.014) -0.002 (0.020)
0.015 (0.015)
0.014 (0.016)
-0.002 (0.020)
Has at least one computer 0.791 -0.006 (0.011)
-0.009 (0.012)
-0.014 (0.017)
0.000 (0.013)
-0.002 (0.013)
-0.015 (0.017)
Has electricity 0.655 -0.010 (0.012)
-0.002 (0.013)
0.046*** (0.017)
0.009 (0.014)
0.016 (0.014)
0.044*** (0.017)
Has drinkable water 0.526 -0.016 (0.013)
-0.012 (0.014)
0.019 (0.019)
0.003 (0.015)
0.006 (0.015)
0.018 (0.019)
Has public sewage system 0.142 -0.012 (0.010)
-0.009 (0.010)
0.017 (0.015)
-0.008 (0.011)
-0.005 (0.011)
0.017 (0.015)
Robust standard errors in parentheses. *** p<0.01, ** p<0.05, * p<0.1.
15
Table 3 (cont.)
Pre-treatment (2013) school characteristics around the distance cutoff value
School characteristics (2013) Sample
mean
Polynomial order = 3 Polynomial order = 4
�� R1 vs. R2
�� R1 vs. R2~N
� R2N vs. R2~N
�� R1 vs. R2
�� R1 vs. R2~N
� R2N vs. R2~N
Number of contract teachers 0.559 0.003
(0.027) 0.011
(0.028) 0.052
(0.038) 0.013
(0.028) 0.021
(0.028) 0.048
(0.038)
Number of tenured teachers 1.747 0.073* (0.042)
0.088** (0.044)
0.088 (0.057)
0.066 (0.042)
0.080* (0.043)
0.084 (0.057)
Proportion of contract teachers 0.242 -0.003 (0.011)
-0.003 (0.011)
0.000 (0.013)
0.001 (0.011)
0.001 (0.012)
-0.001 (0.013)
Number of students 34.74 0.638
(0.812) 1.155
(0.838) 2.997*** (1.086)
0.783 (0.797)
1.261 (0.822)
2.808*** (1.083)
Received workbooks 0.575 -0.023 (0.016)
-0.024 (0.017)
-0.006 (0.020)
-0.024 (0.016)
-0.025 (0.017)
-0.006 (0.020)
Received workbooks on time 0.045 0.002
(0.007) 0.002
(0.007) 0.001
(0.009) 0.000
(0.007) 0.001
(0.007) 0.002
(0.009)
Students’ average no. of preschool years 1.396 0.047
(0.036) 0.064* (0.037)
0.096** (0.045)
0.045 (0.037)
0.060 (0.038)
0.091** (0.045)
Has science laboratory 0.015 -0.004 (0.004)
-0.003 (0.004)
0.004 (0.006)
-0.003 (0.004)
-0.002 (0.004)
0.004 (0.006)
Has a library 0.332 0.019
(0.016) 0.018
(0.016) -0.002 (0.020)
0.018 (0.016)
0.018 (0.016)
-0.002 (0.020)
Has at least one computer 0.791 0.002
(0.013) -0.001 (0.014)
-0.015 (0.017)
0.008 (0.013)
0.005 (0.014)
-0.015 (0.017)
Has electricity 0.655 0.005
(0.014) 0.012
(0.015) 0.044*** (0.017)
0.006 (0.015)
0.014 (0.015)
0.044** (0.017)
Has drinkable water 0.526 0.001
(0.016) 0.004
(0.016) 0.018
(0.019) 0.003
(0.016) 0.006
(0.016) 0.017
(0.019)
Has public sewage system 0.142 -0.012 (0.012)
-0.009 (0.012)
0.017 (0.015)
-0.010 (0.012)
-0.008 (0.012)
0.017 (0.015)
Robust standard errors in parentheses. *** p<0.01, ** p<0.05, * p<0.1.

16
The identification of the effect of the bonus and the externality relies on treatment status
being randomly assigned around the distance cutoff. This means there should be no
manipulation of the scores obtained in the running variable in such a way that certain
schools effectively chose to receive treatment. One way to test this is by discarding the
presence of discontinuities in the density of schools around the distance cutoff. Figure 3
show the results of the discontinuity test proposed by Cattaneo et al. (2018). We found
no evidence of a discontinuity at the distance threshold used to classify a school as
Rural 1.
Figure 3
Density of rural schools around the distance cutoff
Cattaneo et al. (2018) statistic (p-value): 0.061 (0.951).
5. Results
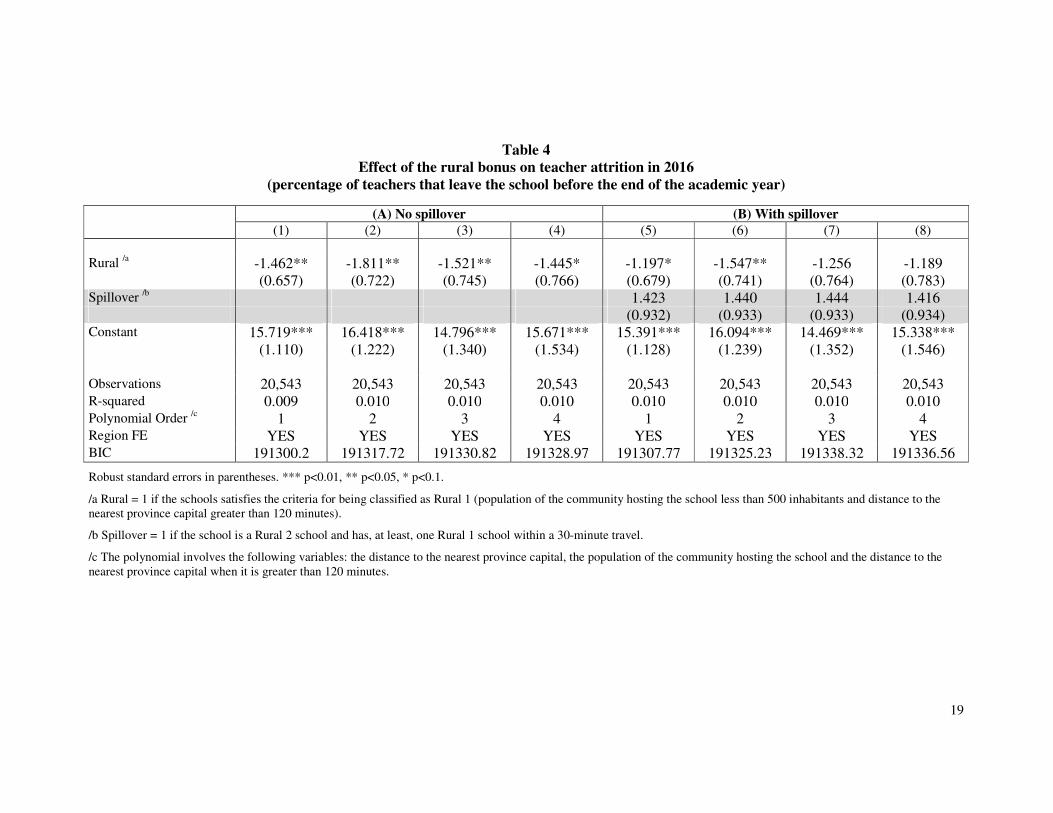
Tables 4 and 5 show our results for teacher attrition and the proportion of teacher
vacancies filled. In each table, panel A shows the results obtained using the baseline
specification for polynomial orders ranging from 1 to 4. Panel B shows the results
obtained using the specification that includes the spillover effect, also for polynomial
orders ranging from 1 to 4.
Panel B in Table 4 shows that the bonus had a negative effect on teacher attrition, with a
size between 1.2 and 1.5 percentage points. We do not find a statistically significant
0.0
02
.004
.006
.008
50 100 150 200 250Distance - P-value: 0.951
point estimate 95% C.I.

17
spillover effect. However, it produces a positive point estimate for all polynomial orders
and failure to account for it would lead to overstating the effect of the bonus by, at least,
20%. In particular, results obtained for the baseline specification (panel A) show
estimates ranging between 1.5 and 1.8 percentage points.
We also find that the bonus had a positive effect on the proportion of teacher vacancies
filled. Results presented in panel B of Table 5 show a significant effect ranging between
1.1 and 1.6 percentage points. Panel B also reports a significant negative spillover. In
particular, control (Rural 2) schools that have at least one treated (Rural 1) school near
experienced a reduction of nearly 2.6 percentage points in the proportion of teacher
vacancies filled. Consistent with the sign of this spillover, ignoring it would lead to
overstating the effect of the bonus. The baseline specification (see panel A in Table 5)
produces an estimated effect ranging between 1.6 and 2.1 percentage points (at least,
30% larger).
It is possible from the data to distinguish between contract and tenured teachers when
estimating the effect of the bonus on the proportion of teacher vacancies filled. Tables 6
and 7 show the results for the proportion of teacher vacancies filled with contract and
tenured teachers, respectively. Three important results are worth highlighting: (i) the
bonus had a positive effect on contract teachers but no effect on tenured teachers;
(ii) the bonus produced a positive spillover for contract teachers (~2.4pp); (iii) the bonus
produced a negative spillover for tenured teachers (~5.0pp). This means that the positive
effect found for the aggregate indicator was driven by an increase in the probability of
filling a vacancy with a contract teacher and that the negative externality (~2.6pp)
reported above was the consequence of a large negative spillover on tenured teachers
that was partially offset by a positive spillover on contract teachers.
To interpret these results, we need to consider the way in which tenured and contract
positions are opened. Tenured positions are opened by the central office on the basis of
student enrollment while contract positions are decided in a more decentralized manner
involving regional offices and schools. The number of tenured positions opened each
year by the central office is fixed and quite small for rural schools because the number
of students per school is also small. Teachers apply to tenured positions on the basis of
merit, based on the scores obtained in the annual teacher evaluation. Once the tenured
positions at a particular school are filled, no more teachers can apply to a tenured

18
position in that school, even if vacancies for contract teachers are still open. Tenured
positions are permanent and it is quite difficult for a teacher to migrate to a tenured
position at a different school. If a tenured position is not filled, the school can decide to
fill that vacancy with a contract teacher.
Based on this, the lack of effect of the bonus on the proportion of teacher vacancies
filled with tenured teachers is explained by the rigidities preventing these teachers from
switching school, and by the fact that the bonus cannot induce the creation of more
tenured positions beyond the fixed number decided by the central office.
The negative externality on tenured teachers means that the bonus paid in R1 schools
discouraged teachers from taking a tenured position in R2N schools. This allows for two
explanations based on the fact that the bonus had a positive effect on contract teachers
but no effect on the probability of filling a teacher vacancy with a tenured teacher in R1
schools. The first explanation involves a substitution effect that includes a change in
teacher category. In particular, the bonus can induce teachers to substitute a contract
position in an R1 school for a tenured position in an R2N school. The second
explanation does not involve substituting a treated for a control school. Teachers can be
discouraged from taking a tenured position in an R2N school by the fact that they would
permanently receive a lower wage than the colleagues working in a school nearby.
Finally, the positive spillover found for contract teachers can be explained by the
negative externality on the probability of filling vacancies with tenured teachers. In
other words, R2N schools facing difficulties to fill tenured positions ended up filling
some of these vacancies with contract teachers.
Tables 8 and 9 report the results obtained for learning outcomes in reading
comprehension and mathematics, respectively. There is no robust evidence that the rural
bonus had an effect on test scores obtained in the 2016 national second grade student
evaluation.
19
Table 4
Effect of the rural bonus on teacher attrition in 2016
(percentage of teachers that leave the school before the end of the academic year)
(A) No spillover (B) With spillover
(1) (2) (3) (4) (5) (6) (7) (8)
Rural /a -1.462** -1.811** -1.521** -1.445* -1.197* -1.547** -1.256 -1.189 (0.657) (0.722) (0.745) (0.766) (0.679) (0.741) (0.764) (0.783) Spillover /b 1.423 1.440 1.444 1.416 (0.932) (0.933) (0.933) (0.934) Constant 15.719*** 16.418*** 14.796*** 15.671*** 15.391*** 16.094*** 14.469*** 15.338*** (1.110) (1.222) (1.340) (1.534) (1.128) (1.239) (1.352) (1.546) Observations 20,543 20,543 20,543 20,543 20,543 20,543 20,543 20,543 R-squared 0.009 0.010 0.010 0.010 0.010 0.010 0.010 0.010 Polynomial Order /c 1 2 3 4 1 2 3 4 Region FE YES YES YES YES YES YES YES YES BIC 191300.2 191317.72 191330.82 191328.97 191307.77 191325.23 191338.32 191336.56
Robust standard errors in parentheses. *** p<0.01, ** p<0.05, * p<0.1.
/a Rural = 1 if the schools satisfies the criteria for being classified as Rural 1 (population of the community hosting the school less than 500 inhabitants and distance to the nearest province capital greater than 120 minutes).
/b Spillover = 1 if the school is a Rural 2 school and has, at least, one Rural 1 school within a 30-minute travel.
/c The polynomial involves the following variables: the distance to the nearest province capital, the population of the community hosting the school and the distance to the nearest province capital when it is greater than 120 minutes.

20
Table 5
Effect of the rural bonus on the percentage of teacher vacancies filled in 2016
(A) No spillover (B) With spillover
(1) (2) (3) (4) (5) (6) (7) (8)
Rural /a 1.571** 2.085*** 2.084*** 2.040** 1.097 1.615** 1.613** 1.582* (0.707) (0.777) (0.803) (0.824) (0.730) (0.796) (0.822) (0.842) Spillover /b -2.542** -2.561** -2.568** -2.533** (1.025) (1.025) (1.026) (1.027) Constant 75.258*** 74.721*** 78.281*** 76.560*** 75.845*** 75.297*** 78.863*** 77.156*** (1.191) (1.327) (1.480) (1.720) (1.210) (1.343) (1.492) (1.730) Observations 20,543 20,543 20,543 20,543 20,543 20,543 20,543 20,543 R-squared 0.022 0.022 0.023 0.023 0.022 0.022 0.023 0.023 Polynomial Order /c 1 2 3 4 1 2 3 4 Region FE YES YES YES YES YES YES YES YES BIC 194110.12 194127.06 194129.39 194125.68 194113.49 194130.33 194132.61 194129.09
Robust standard errors in parentheses. *** p<0.01, ** p<0.05, * p<0.1.
/a Rural = 1 if the schools satisfies the criteria for being classified as “Rural 1” (population of the community hosting the school less than 500 inhabitants and distance to the nearest province capital greater than 120 minutes).
/b Spillover = 1 if the school is a “Rural 2” school and has, at least, a “Rural 1” school within a 30-minute travel.
/c The polynomial involves the following variables: the distance to the nearest province capital, the population of the community hosting the school and the distance to the nearest province capital when it is greater than 120 minutes.

21
Table 6
Effect of the rural bonus on the percentage of teacher vacancies filled with contract teachers in 2016
(A) No spillover (B) With spillover
(1) (2) (3) (4) (5) (6) (7) (8)
Rural /a 1.109 0.967 1.339 1.443 1.553* 1.407 1.782* 1.870* (0.789) (0.882) (0.911) (0.946) (0.810) (0.900) (0.929) (0.962) Spillover /b 2.382** 2.403** 2.415** 2.360** (1.062) (1.062) (1.063) (1.063) Constant 24.340*** 25.903*** 20.753*** 22.927*** 23.791*** 25.362*** 20.206*** 22.372*** (1.228) (1.397) (1.607) (1.918) (1.252) (1.418) (1.625) (1.934) Observations 20,543 20,543 20,543 20,543 20,543 20,543 20,543 20,543 R-squared 0.110 0.110 0.111 0.112 0.110 0.110 0.112 0.112 Polynomial Order /c 1 2 3 4 1 2 3 4 Region FE YES YES YES YES YES YES YES YES BIC 199795.76 199811.77 199799.63 199794.21 199801.33 199817.26 199805.06 199799.85
Robust standard errors in parentheses. *** p<0.01, ** p<0.05, * p<0.1.
/a Rural = 1 if the schools satisfies the criteria for being classified as “Rural 1” (population of the community hosting the school less than 500 inhabitants and distance to the nearest province capital greater than 120 minutes).
/b Spillover = 1 if the school is a “Rural 2” school and has, at least, a “Rural 1” school within a 30-minute travel.
/c The polynomial involves the following variables: the distance to the nearest province capital, the population of the community hosting the school and the distance to the nearest province capital when it is greater than 120 minutes.

22
Table 7
Effect of the rural bonus on the percentage of teacher vacancies filled with tenured teachers in 2016
(A) No spillover (B) With spillover
(1) (2) (3) (4) (5) (6) (7) (8)
Rural /a 0.462 1.118 0.744 0.597 -0.456 0.208 -0.170 -0.288 (1.012) (1.123) (1.167) (1.194) (1.045) (1.152) (1.194) (1.219) Spillover /b -4.923*** -4.964*** -4.983*** -4.892*** (1.428) (1.428) (1.431) (1.431) Constant 50.918*** 48.818*** 57.528*** 53.633*** 52.054*** 49.935*** 58.657*** 54.783*** (1.651) (1.865) (2.147) (2.554) (1.681) (1.890) (2.167) (2.571) Observations 20,543 20,543 20,543 20,543 20,543 20,543 20,543 20,543 R-squared 0.104 0.104 0.107 0.107 0.104 0.105 0.107 0.107 Polynomial Order /c 1 2 3 4 1 2 3 4 Region FE YES YES YES YES YES YES YES YES BIC 209006.23 209020.01 208985.32 208975.1 209004.23 209017.81 208983 208973.22
Robust standard errors in parentheses. *** p<0.01, ** p<0.05, * p<0.1.
The sample considers all “Rural 1” and “Rural 2” schools with complete information on attrition, percentage of teacher positions filled, the population of the community hosting the school, the distance to the nearest province capital, and the presence of other schools within a 30-minute travel.
/a Rural = 1 if the schools satisfies the criteria for being classified as “Rural 1” (population of the community hosting the school less than 500 inhabitants and distance to the nearest province capital greater than 120 minutes).
/b Spillover = 1 if the school is a “Rural 2” school and has, at least, a “Rural 1” school within a 30-minute travel.
/c The polynomial involves the following variables: the distance to the nearest province capital, the population of the community hosting the school and the distance to the nearest province capital when it is greater than 120 minutes.

23
Table 8
Effect of the rural bonus on reading comprehension test scores obtained in the 2016 national second grade student evaluation
(in standard deviations)
(A) No spillover (B) With spillover
(1) (2) (3) (4) (5) (6) (7) (8)
Rural /a -0.042 -0.168** -0.189** -0.135 -0.028 -0.155** -0.187** -0.142 (0.048) (0.071) (0.095) (0.119) (0.049) (0.072) (0.095) (0.120) Spillover /b 0.070 0.075 0.093 0.091 (0.064) (0.064) (0.066) (0.066) Constant 0.232*** 0.326*** 0.349*** 0.417*** 0.215*** 0.310*** 0.343*** 0.417*** (0.072) (0.089) (0.112) (0.136) (0.074) (0.090) (0.112) (0.136) Observations 5,595 5,595 5,595 5,595 5,595 5,595 5,595 5,595 R-squared 0.119 0.120 0.121 0.122 0.120 0.121 0.121 0.122 Polynomial Order /c 1 2 3 4 1 2 3 4 Region FE YES YES YES YES YES YES YES YES BIC 15243.01 15262.34 15276.05 15289.28 15250.35 15269.48 15282.5 15295.84
Robust standard errors in parentheses. *** p<0.01, ** p<0.05, * p<0.1.
The sample considers all “Rural 1” and “Rural 2” schools with complete information on attrition, percentage of teacher positions filled, the population of the community hosting the school, the distance to the nearest province capital, and the presence of other schools within a 30-minute travel.
/a Rural = 1 if the schools satisfies the criteria for being classified as “Rural 1” (population of the community hosting the school less than 500 inhabitants and distance to the nearest province capital greater than 120 minutes).
/b Spillover = 1 if the school is a “Rural 2” school and has, at least, a “Rural 1” school within a 30-minute travel.
/c The polynomial involves the following variables: the distance to the nearest province capital, the population of the community hosting the school and the distance to the nearest province capital when it is greater than 120 minutes.

24
Table 9
Effect of the rural bonus on mathematics test scores obtained in the 2016 national second grade student evaluation
(in standard deviations)
(A) No spillover (B) With spillover
(1) (2) (3) (4) (5) (6) (7) (8)
Rural /a -0.044 -0.150** -0.146 -0.063 -0.029 -0.136* -0.145 -0.069 (0.050) (0.074) (0.101) (0.128) (0.052) (0.075) (0.100) (0.128) Spillover /b 0.070 0.073 0.086 0.083 (0.070) (0.070) (0.071) (0.072) Constant 0.229*** 0.251*** 0.187 0.255* 0.212*** 0.235** 0.181 0.256* (0.073) (0.093) (0.118) (0.144) (0.074) (0.094) (0.118) (0.144) Observations 5,595 5,595 5,595 5,595 5,595 5,595 5,595 5,595 R-squared 0.129 0.130 0.131 0.132 0.130 0.131 0.132 0.132 Polynomial Order /c 1 2 3 4 1 2 3 4 Region FE YES YES YES YES YES YES YES YES BIC 15846.93 15866.26 15877.75 15889.12 15854.39 15873.64 15884.69 15896.22
Robust standard errors in parentheses. *** p<0.01, ** p<0.05, * p<0.1.
The sample considers all “Rural 1” and “Rural 2” schools with complete information on attrition, percentage of teacher positions filled, the population of the community hosting the school, the distance to the nearest province capital, and the presence of other schools within a 30-minute travel.
/a Rural = 1 if the schools satisfies the criteria for being classified as “Rural 1” (population of the community hosting the school less than 500 inhabitants and distance to the nearest province capital greater than 120 minutes).
/b Spillover = 1 if the school is a “Rural 2” school and has, at least, a “Rural 1” school within a 30-minute travel.
/c The polynomial involves the following variables: the distance to the nearest province capital, the population of the community hosting the school and the distance to the nearest province capital when it is greater than 120 minutes.
25
6. Concluding remarks
In this paper we sought to estimate the effect of the teacher bonus paid in schools
classified as Rural 1 in Peru on teacher attrition, the proportion of teacher vacancies
filled and learning outcomes measured in 2016. We argued that the estimation of the
effects of this type of incentives is problematic because they can produce spillovers that
affect control schools and lead to biased results. The externality stems from the potential
substitution of treated schools for control schools by teachers seeking a higher salary.
This is the first study to account for this potential source of bias.
To estimate the effect of the bonus, we exploited the exogenous variation in the
assignment of this premium around the distance cutoff used to classify a school as Rural
1. To isolate the externality, we assumed it depends on the proximity to treated schools
based on the notion that teachers will likely assess schools as similar in their preferences
if they share the same environment. Therefore, control schools that do not have a treated
school nearby were considered as an adequate counterfactual to measure the effect of
the bonus.
We found that the bonus caused a reduction between 1.2 and 1.5 percentage points in
teacher attrition. Ignoring the possibility of spillovers would have led to overestimating
this effect by at least 20%. We found a positive effect of the bonus on the proportion of
vacancies filled, with a size ranging between 1.1 and 1.6 percentage points. We also
found a significant negative spillover of nearly 2.6 percentage points affecting the
probability of filling a teacher vacancy in control schools that have a treated school
nearby. Ignoring this spillover would have led to an overestimation of the effect of the
bonus of, at least, 30%.
The effects found on the aggregate proportion of teacher vacancies filled were driven by
an increase in the probability of filling a vacancy with a contract teacher and by a
negative spillover on tenured teachers that was partially offset by a positive spillover on
contract teachers. We found no effect of the bonus on the probability of filling a
vacancy with a tenured teacher and no robust evidence of an effect on learning
outcomes.

26
The possibility that teachers substitute treated schools for schools that fail to meet the
criteria for being classified as rural is not necessarily bad for policy or for the
econometrician seeking to estimate the effect of the bonus. From the point of view of
policy, this substitution can be one of the intended mechanisms of the incentive. If the
policymaker is concerned about the concentration of resources in urban areas, this
substitution can produce a more egalitarian distribution of teachers. From the point of
view of the econometrician, the substitution will not pose a threat to identification if it
does not affect control schools.
The externality considered in this analysis, however, can be problematic for both the
econometrician and the policymaker. In particular, the spillover addressed in this paper
is caused by the proximity of schools offering the bonus to those that do not offer the
wage premium. From the point of view of an econometrician using a regression
discontinuity design, this is problematic because the schools that do not offer the bonus
but are nearby a treated school will likely be part of the control group. The externality,
thus, translates into a bias.
From the point of view of the policymaker, the externality discussed here is also
problematic if it entails a substitution between schools that share the same
characteristics. If this is the case, it will not produce a more egalitarian distribution of
teacher resources. The larger the proportion of schools that do not offer the bonus and
have a treated school nearby, the smaller the net benefits of the program (in more cases,
the program would be transferring resources between school of similar characteristics).
In the extreme case in which all control schools have a treated school near, the net
benefit around the distance threshold would be close to zero and, in addition, it would
not be possible to isolate the externality as proposed here. In our sample, nearly 8% of
the schools that offer no bonus have a treated school near. This allowed us to isolate the
externality. It also means that there is room for a positive net benefit arising from the
transference of resources to treated schools.

27
References
Allan, B., and Fryer, R. (2011). The power and pitfalls of education incentives. The Hamilton Project. Working Paper.
Behrman, J., Parker, S., Todd, P. and Wolpin, K. (2015). Aligning Learning Incentives of Students and Teachers: Results from a Social Experiment in Mexican High Schools. Journal of Political Economy, 123(2), 325-364.
Castro J.F and C. Rolleston (2018). The contribution of early childhood and schools to cognitive gaps: New evidence from Peru. Economics of Education Review (64), 144-164.
Cattaneo M., M. Jansson and X. Ma (2018). Manipulation Testing Based on Density Discontinuity. The Stata Journal (18), 234-261.
Glewwe, P., Ilias, N., and Kremer, M. (2010). Teacher Incentives. American Economic Journal: Applied Economics (2), 205-227.
Hough, H. (2012). Salary incentives and teacher quality: The effect of a district-level salary increase on teacher recruitment. Standford Center for Education Policy Analysis (CEPA). Working Paper.
Koppich, J. (2008). Toward a more comprehensive model of teacher pay. National Center on Performance Incentives. Working Paper.
Loeb, S., Lankford, H., and Wyckoff, J. (2002). Teacher Sorting and the Plight of Urban Schools: A Descriptive Analysis. Educational Evaluation and Policy Analysis, 24(1), 37-62.
Miguel, E. and M. Kremer (2004). Worms: Identifying Impacts on Education and Health in the Presence of Treatment Externalities. Econometrica 72 (1): 159-217.
Podgursky, M. (2008). Market-based pay reform for public school teachers. National Center on Performance Incentives. Working Paper.
Podgursky, M., and Springer, M. (2006). Teacher performance pay: a review. National Center on Performance. Working Paper.
Pugatch, T., and Schroeder, E. (2014). Incentives for Teacher Relocation: Evidence from the Gambian Hardship Allowance. Economics of Education Review (41), 120-136.
Vegas, E., and Umansky, I. (2005). Improving teaching and learning through effective incentives. In E. Vegas (Ed.), Incentives to improve teaching (pp. 1-15). Washington: The World Bank.