Embed Size (px)
Citation preview

Pervious Concrete Physical Characteristics and Effectiveness in Stormwater Pollution ReductionFinal Report April 2016
Sponsored byMidwest Transportation CenterU.S. Department of Transportation Office of the Assistant Secretary for Research and Technology

About MTCThe Midwest Transportation Center (MTC) is a regional University Transportation Center (UTC) sponsored by the U.S. Department of Transportation Office of the Assistant Secretary for Research and Technology (USDOT/OST-R). The mission of the UTC program is to advance U.S. technology and expertise in the many disciplines comprising transportation through the mechanisms of education, research, and technology transfer at university-based centers of excellence. Iowa State University, through its Institute for Transportation (InTrans), is the MTC lead institution.
About InTransThe mission of the Institute for Transportation (InTrans) at Iowa State University is to develop and implement innovative methods, materials, and technologies for improving transportation efficiency, safety, reliability, and sustainability while improving the learning environment of students, faculty, and staff in transportation-related fields.
ISU Non-Discrimination Statement Iowa State University does not discriminate on the basis of race, color, age, ethnicity, religion, national origin, pregnancy, sexual orientation, gender identity, genetic information, sex, marital status, disability, or status as a U.S. veteran. Inquiries regarding non-discrimination policies may be directed to Office of Equal Opportunity, Title IX/ADA Coordinator, and Affirmative Action Officer, 3350 Beardshear Hall, Ames, Iowa 50011, 515-294-7612, email [email protected].
NoticeThe contents of this report reflect the views of the authors, who are responsible for the facts and the accuracy of the information presented herein. The opinions, findings and conclusions expressed in this publication are those of the authors and not necessarily those of the sponsors.
This document is disseminated under the sponsorship of the U.S. DOT UTC program in the interest of information exchange. The U.S. Government assumes no liability for the use of the information contained in this document. This report does not constitute a standard, specification, or regulation.
The U.S. Government does not endorse products or manufacturers. If trademarks or manufacturers’ names appear in this report, it is only because they are considered essential to the objective of the document.
Quality Assurance StatementThe Federal Highway Administration (FHWA) provides high-quality information to serve Government, industry, and the public in a manner that promotes public understanding. Standards and policies are used to ensure and maximize the quality, objectivity, utility, and integrity of its information. The FHWA periodically reviews quality issues and adjusts its programs and processes to ensure continuous quality improvement.

Technical Report Documentation Page
1. Report No. 2. Government Accession No. 3. Recipient’s Catalog No.
4. Title and Subtitle 5. Report Date
Pervious Concrete Physical Characteristics and Effectiveness in Stormwater
Pollution Reduction
April 2016
6. Performing Organization Code
7. Author(s) 8. Performing Organization Report No.
Say Kee Ong, Kejin Wang, Yifeng Ling, and Guyu Shi
9. Performing Organization Name and Address 10. Work Unit No. (TRAIS)
Institute for Transportation
Iowa State University
2711 South Loop Drive, Suite 4700
Ames, IA 50010-8664
11. Contract or Grant No.
DTRT13-G-UTC37
12. Sponsoring Organization Name and Address 13. Type of Report and Period Covered
Midwest Transportation Center
2711 S. Loop Drive, Suite 4700
Ames, IA 50010-8664
U.S. Department of Transportation
Office of the Assistant Secretary for
Research and Technology
1200 New Jersey Avenue, SE
Washington, DC 20590
Final Report
14. Sponsoring Agency Code
15. Supplementary Notes
Visit www.intrans.iastate.edu for color pdfs of this and other research reports.
16. Abstract
The objective of this research was to investigate the physical/chemical and water flow characteristics of various previous concrete
mixes made of different concrete materials and their effectiveness in attenuating water pollution. Four pervious concrete mixes
were prepared with Portland cement and with 15% cementitious materials (slag, limestone powder, and fly ash) as a Portland
cement replacement.
All four pervious concrete mixtures had acceptable workability. The unit weight of the fresh pervious concrete mixtures ranged
from 115.9 lb/yd3 to 119.6 lb/yd3, while the 28 day compressive strength of the pervious concrete mixes ranged from 1858 psi
(mix with 15% slag) to 2285 psi (pure cement mix). The compressive strength generally increased with unit weight and decreased
with total porosity (air void ratio). The permeability of the four mixes generally decreased with unit weight and increased with
total porosity. The permeability coefficients ranged from 340 in./hr for the pure cement mix to 642 in./hr for the mix with 15%
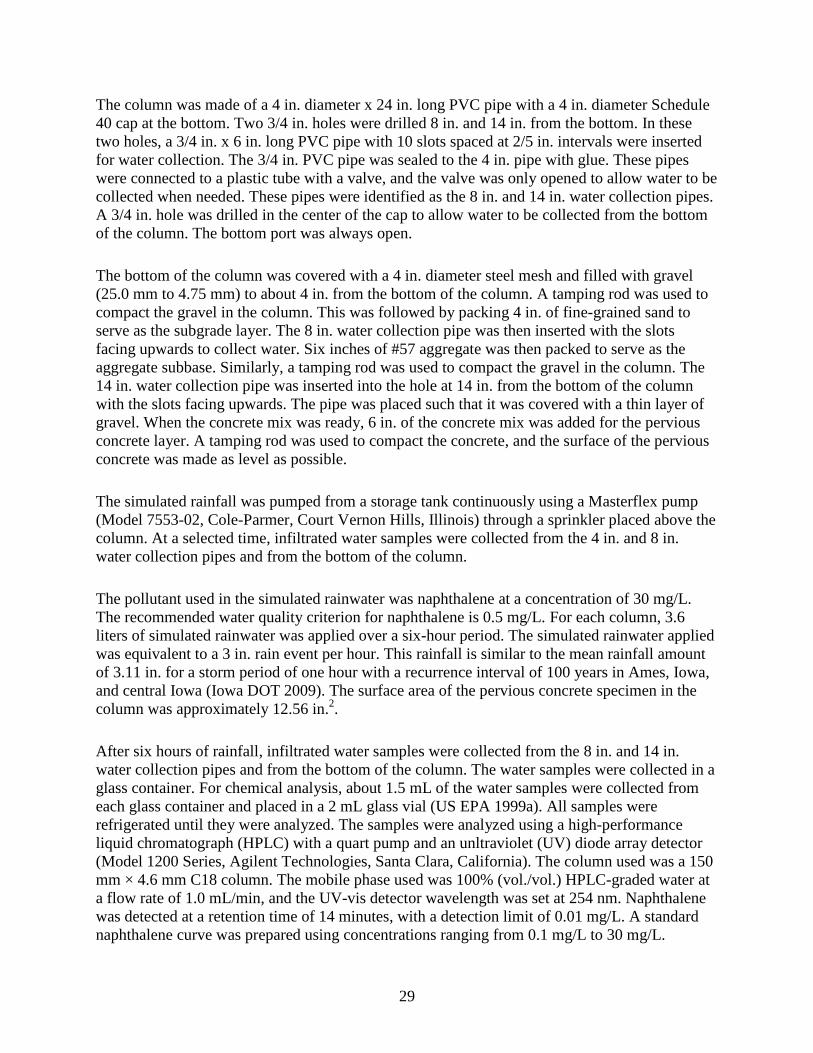
slag. The total porosities of the four pervious concrete mixes ranged from 24.00% (mix with 15% slag) to 31.41% (pure cement
mix) as measured by the flatbed scanner test method, while the porosities ranged from 18.93% (mix with 15% slag) to 24.15%
(pure cement mix) as measured by the RapidAir method. The total porosities of the four pervious concrete mixes measured by the
flatbed scanner method were higher than those measured by the Rapid Air method, but the specific surface areas measured by the
flatbed scanner method were all lower than those measured by the Rapid Air method. For the pollution abatement experiments,
mixes with fly ash and limestone powder removed about 30% of the input naphthalene concentration, while the mix with slag
only removed 0.5% of the influent naphthalene concentration. The water volume balance showed that less than 1% of the water
added was retained in the experimental column setup.
17. Key Words 18. Distribution Statement
abatement—binders—pervious concrete—stormwater pollution No restrictions.
19. Security Classification (of this
report)
20. Security Classification (of this
page)
21. No. of Pages 22. Price
Unclassified. Unclassified. 57 NA
Form DOT F 1700.7 (8-72) Reproduction of completed page authorized

PERVIOUS CONCRETE PHYSICAL
CHARACTERISTICS AND EFFECTIVENESS IN
STORMWATER POLLUTION REDUCTION
Final Report
April 2016
Principal Investigator
Say Kee Ong, Professor
Institute for Transportation, Iowa State University
Co-Principal Investigator
Kejin Wang, Professor
Institute for Transportation, Iowa State University
Research Assistants
Guyu Shi and Yifeng Ling
Authors
Say Kee Ong, Kejin Wang, Yifeng Ling, and Guyu Shi
Sponsored by
the Midwest Transportation Center and
the U.S. Department of Transportation
Office of the Assistant Secretary for Research and Technology
A report from
Institute for Transportation
Iowa State University
2711 South Loop Drive, Suite 4700
Ames, IA 50010-8664
Phone: 515-294-8103
Fax: 515-294-0467
www.intrans.iastate.edu

v
TABLE OF CONTENTS
ACKNOWLEDGMENTS ............................................................................................................ vii
EXECUTIVE SUMMARY ........................................................................................................... ix
1 INTRODUCTION ........................................................................................................................1
1.1 Research Background ....................................................................................................1 1.2 Research Objectives .......................................................................................................1
2 LITERATURE REVIEW .............................................................................................................2
2.1 Introduction ....................................................................................................................2 2.2 Pervious Concrete Mix ..................................................................................................2
2.3 Consolidation of Pervious Concrete ..............................................................................4 2.4 Physical Characterization...............................................................................................4
2.5 Mixture Design Research ...............................................................................................9
2.5 Pollutants in Stormwater ..............................................................................................12 2.6 Removal Mechanisms ..................................................................................................17
3 MATERIALS ..............................................................................................................................19
3.1 Pervious Concrete Mixes .............................................................................................19 3.2 Concrete Mixing and Casting ......................................................................................22
3.3 Engineering Properties of Pervious Concrete ..............................................................23 3.4 Pollution Abatement Column Experiments .................................................................26
4 EXPERIMENTAL RESULTS....................................................................................................30
4.1 Workability of Fresh Pervious Concrete......................................................................30
4.2 Unit Weight, Strength and Permeability of Pervious Concrete ...................................31 4.3 Pore Structure of Pervious Concrete ............................................................................33 4.4 Pollutant Abatement Experiments ...............................................................................38
5 CONCLUSION ...........................................................................................................................41
REFERENCES ..............................................................................................................................43

vi
LIST OF FIGURES
Figure 1. Relationship between porosity and permeability for pervious concrete mixtures ...........7 Figure 2. Effect of cementitious materials on compressive strengths ...........................................10 Figure 3. Pervious concrete specimens prepared for air void analysis: Portland cement (top
left), Portland cement - 15% Fly ash (top right), Portland cement - 15% Slag
(bottom left), and Portland cement - 15% Limestone (bottom right) ................................24 Figure 4. Falling head permeameter: setup (left) and schematic diagram (right) ..........................25 Figure 5. Column setup ..................................................................................................................27 Figure 6. Column test setup with rainfall simulator: simplified flow diagram (top) and test
setup (bottom) ....................................................................................................................28 Figure 7. Workability test results of pervious concrete mixtures: Portland cement (top left),
Portland cement - 15% Fly ash (top right), Portland cement - 15% Slag (bottom
left), and Portland cement - 15% Limestone (bottom right) ..............................................30 Figure 8. Unit weight, strength, and permeability of pervious concrete mixtures.........................32 Figure 9. Comparisons of air void parameters obtained from flatbed scanner and RapidAir
tests ....................................................................................................................................34 Figure 10. Void distribution curves obtained from flatbed scanner and RapidAir methods .........36
Figure 11. Effects of porosity on strength and permeability of pervious concrete ........................38
LIST OF TABLES
Table 1. Typical mixtures of pervious Portland cement concrete ...................................................3
Table 2. Effects of water-to-cement and binder-to-aggregate ratios on pervious concrete
properties..............................................................................................................................4
Table 3. Equations predicting permeability coefficients (k) from porosity ()* .............................8 Table 4. Pervious concrete properties of various mixes ................................................................11
Table 5. Pollutants removal in porous pavements .........................................................................13 Table 6. Mix proportions ...............................................................................................................20 Table 7. Properties of coarse and fine aggregates ..........................................................................21
Table 8. Chemical and physical properties of cementitious materials ...........................................22 Table 9. Parameters for image analysis .........................................................................................25
Table 10. Unit weight, strength, and permeability of pervious concrete mixes ............................31 Table 11. Pore parameters of pervious concrete mixes .................................................................33 Table 12. Water volume balance ...................................................................................................39
Table 13. Naphthalene concentrations in water samples ...............................................................40

vii
ACKNOWLEDGMENTS
The authors would like to thank the Midwest Transportation Center and the U.S. Department of
Transportation Office of the Assistant Secretary for Research and Technology for sponsoring this
research.

ix
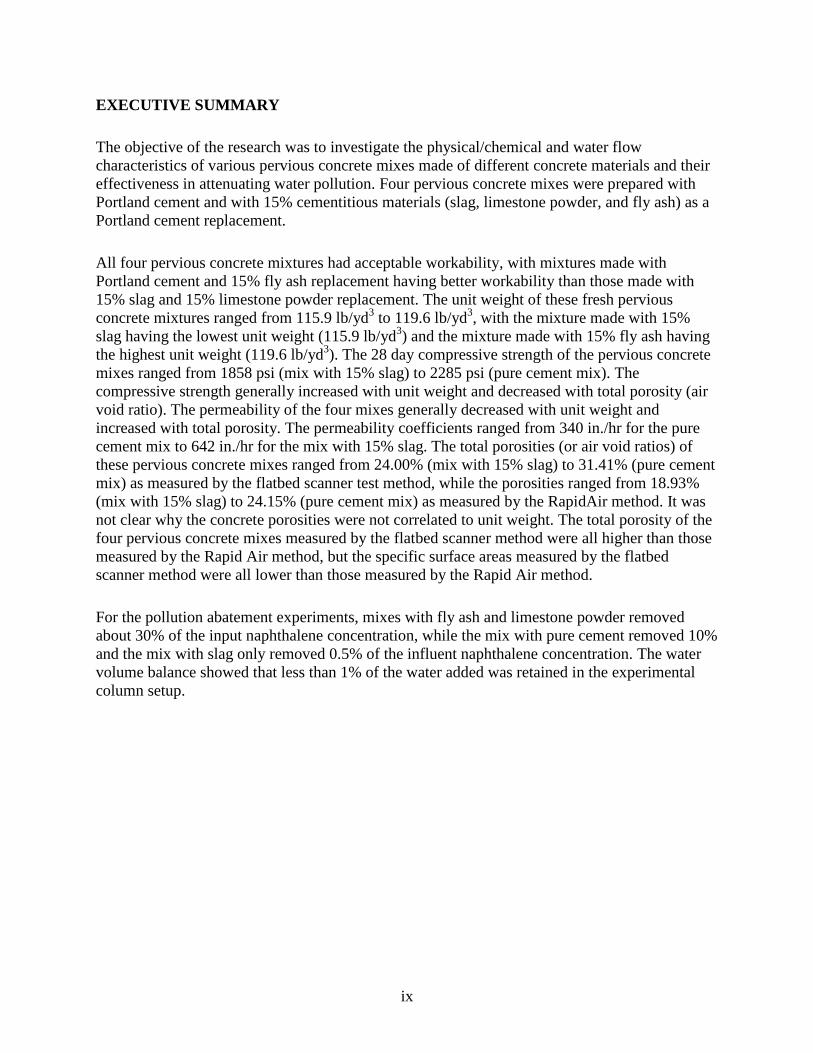
EXECUTIVE SUMMARY
The objective of the research was to investigate the physical/chemical and water flow
characteristics of various pervious concrete mixes made of different concrete materials and their
effectiveness in attenuating water pollution. Four pervious concrete mixes were prepared with
Portland cement and with 15% cementitious materials (slag, limestone powder, and fly ash) as a
Portland cement replacement.
All four pervious concrete mixtures had acceptable workability, with mixtures made with
Portland cement and 15% fly ash replacement having better workability than those made with
15% slag and 15% limestone powder replacement. The unit weight of these fresh pervious
concrete mixtures ranged from 115.9 lb/yd3 to 119.6 lb/yd
3, with the mixture made with 15%
slag having the lowest unit weight (115.9 lb/yd3) and the mixture made with 15% fly ash having
the highest unit weight (119.6 lb/yd3). The 28 day compressive strength of the pervious concrete
mixes ranged from 1858 psi (mix with 15% slag) to 2285 psi (pure cement mix). The
compressive strength generally increased with unit weight and decreased with total porosity (air
void ratio). The permeability of the four mixes generally decreased with unit weight and
increased with total porosity. The permeability coefficients ranged from 340 in./hr for the pure
cement mix to 642 in./hr for the mix with 15% slag. The total porosities (or air void ratios) of
these pervious concrete mixes ranged from 24.00% (mix with 15% slag) to 31.41% (pure cement
mix) as measured by the flatbed scanner test method, while the porosities ranged from 18.93%
(mix with 15% slag) to 24.15% (pure cement mix) as measured by the RapidAir method. It was
not clear why the concrete porosities were not correlated to unit weight. The total porosity of the
four pervious concrete mixes measured by the flatbed scanner method were all higher than those
measured by the Rapid Air method, but the specific surface areas measured by the flatbed
scanner method were all lower than those measured by the Rapid Air method.
For the pollution abatement experiments, mixes with fly ash and limestone powder removed
about 30% of the input naphthalene concentration, while the mix with pure cement removed 10%
and the mix with slag only removed 0.5% of the influent naphthalene concentration. The water
volume balance showed that less than 1% of the water added was retained in the experimental
column setup.


1
1 INTRODUCTION
1.1 Research Background
Pervious concrete is an environmentally friendly and sustainable infrastructure with benefits
such as stormwater reduction, stream/river peak flow rate reduction, groundwater recharge,
pollutant abatement, heat island mitigation, noise reduction, and skid reduction (US EPA 2014).
Typical applications of pervious concrete pavements include vehicle parking areas, sidewalks,
pathways, driveways, and alleys. Pervious concrete allows rainfall to be drained and to percolate
through the concrete to the subbase/subgrade materials, thereby reducing stormwater runoff and,
at the same time, recharging the groundwater. Depending on the design of the pervious concrete
system, a pervious concrete pavement and its subbase material may have sufficient water storage
capacity such that a stormwater detention pond or swale may not be needed. In addition,
pervious concrete pavement has the advantage of pollutant abatement in that it filters and retains
stormwater runoff pollutants within the pervious concrete and the subbase materials.
Despite its many benefits, several aspects of pervious concrete have not been fully investigated.
Some of these include pollutant attenuation for different pervious concrete mixes, the impact of
the concrete pore structure (e.g., the pore surface area and flow path characteristics) on pollutant
removal, the mechanism of pollutant abatement, and the potential for pervious concrete to
experience subsurface contamination. Research has been conducted on plastic grids and small
concrete block pavements (Bean et al. 2007), porous asphalt pavements (Legret and Colandini
1999), and commercially available permeable interlocking concrete pavements and plastic
reinforcing grid pavers with gravel (Brattebo and Booth 2003).
1.2 Research Objectives
This research investigated the physical/chemical and water flow characteristics of various
pervious concrete mixes made of different concrete materials and their effectiveness in
attenuating water pollution. The pervious concrete mixes studied were made by replacing cement
with different cementitious materials (slag, limestone, and fly ash) and were characterized for
such physical properties as compressive strength, air void structure, and water permeability.
Limited laboratory-scale column experiments were conducted to assess the pollutant attenuation
properties of the pervious concrete mixes.
2
2 LITERATURE REVIEW
2.1 Introduction
Pervious concrete as described by the American Concrete Institute (ACI) is a “near-zero slump,
open-graded material consisting of Portland cement, coarse aggregate, little or no fine aggregate,
admixtures, and water with void contents ranging from 15% to 35% and compressive strengths
of 400 to 4000 psi (2.8 to 28 MPa)” (ACI 2006). The primary benefit offered by pervious
concrete is its ability to transport water through its structure, thus reducing stormwater runoff
and recharging groundwater. At the same time, pollutants may be attenuated as the stormwater
flows through the pervious concrete and the subbase materials. In order to obtain the targeted
void content and compressive strength, the proportions of the different cementitious materials
and aggregate, the water-to-cement (w/c) ratio, and the casting and compaction procedure are
important determining factors.
2.2 Pervious Concrete Mix
Material design for pervious concrete differs from that of conventional concrete in that a certain
void content needs to be obtained in the material structure to provide adequate water flow
performance and, at the same time, the necessary compressive strength. A description of
pervious concrete mix design can be found in the ACI 522R report (ACI 2010). Because the void
content (i.e., porosity) is one of the prominent characteristics of pervious concrete, the mix of
cementitious materials, the aggregate used, the water-to-binder (w/b) ratio, and the binder-to-
aggregate (b/a) ratio affect the final porosity of the prepared pervious concrete.
Aggregates
The recommended aggregate size number for pervious concrete ranges from #67 (3/4 in. to No.
4) to #89 (3/8 in. to No. 50). With regards to aggregate type, dolomite is believed to be the best
aggregate to make porous concrete (Lian and Zhuge 2010). To obtain a specified porosity, fine
aggregates are avoided or kept to a very small amount. For example, a study by Schaefer et al.
(2006) showed that when 7% of the coarse aggregate was replaced by fine aggregate for a
pervious concrete mixture, the permeability coefficient of the mixture decreased but the freeze-
thaw durability, compressive strength, and flexural strength improved. Logically, increasing the
pore sizes through the use of larger sized aggregate is a means to increase the permeability of the
pervious concrete. Table 1 provides the typical range of mixture proportions and the water-to-
cement ratios used.

3
Table 1. Typical mixtures of pervious Portland cement concrete
Materials Mixture proportions/ratios
Cementitious materials (lb/yd3) 450-700
Coarse aggregate (lb/yd3) 2000-2500
Fine to coarse aggregate ratio by weight 0 - 1:1
Water-to-cement ratio by weight 0.27 - 0.4
Aggregate-to-binder ratio by weight 4 to 4.5:1
Air entraining agent (oz/cwt*) 2
Water reducer (oz/cwt) 6
Hydration stabilizer (oz/cwt) 6 - 12
* cwt = hundredweight = 112 lbs
Source: Tennis et al. 2004
Cementitious Materials or Binder
Most pervious mixes have between 450 and 700 pounds of cementitious materials, or binder, per
cubic yard or 18% to 24% by weight of the concrete (Table 1). Portland cement and blended
cement conforming to ASTM C595 (2015) “Standard Specification for Blended Hydraulic
Cements” and ASTM C1157 (2011) “Standard Performance Specification for Hydraulic
Cement” are used in pervious concrete (Tennis et al. 2004). In addition, other cementitious
materials such as fly ash, slag, and silica fume conforming to ASTM C618 (2015) “Standard
Specification for Coal Fly Ash and Raw or Calcined Nature Pozzolan for Use in Concrete,”
ASTM C 989 (2014) “Standard Specification for Slag Cement for Use in Concrete and Mortars,”
and ASTM C1240 (2015) “Standard Specification for Silica Fume Used in Cementitious
Mixtures,” respectively, have been used in the preparation of pervious concrete.
Water-to-binder (w/b) Ratio
A w/b ratio between 0.27 and 0.30 is preferred for pervious concrete. A w/b ratio less than 0.27
can result in very low workability for pervious concrete. On the other hand, a high w/b ratio may
lead to a mixture with excessive paste segregated at the bottom of the mold or formwork and can
cause lower permeability than anticipated after hardening (Kevern et al. 2009). Table 2 shows the
effects of w/b ratio on the properties of pervious concrete.
Binder-to-aggregate (b/a) Ratio
The b/a ratio primarily depends on the final application of the pervious concrete and the mixture
materials used. A low or high b/a ratio determines how thin or thick a paste layer will coat the
aggregate particles and how much paste may fill the void spaces. The typical b/a ratio used is
between 0.22 and 0.25. Table 2 shows the effects of b/a ratio on the properties of pervious
concrete.
4
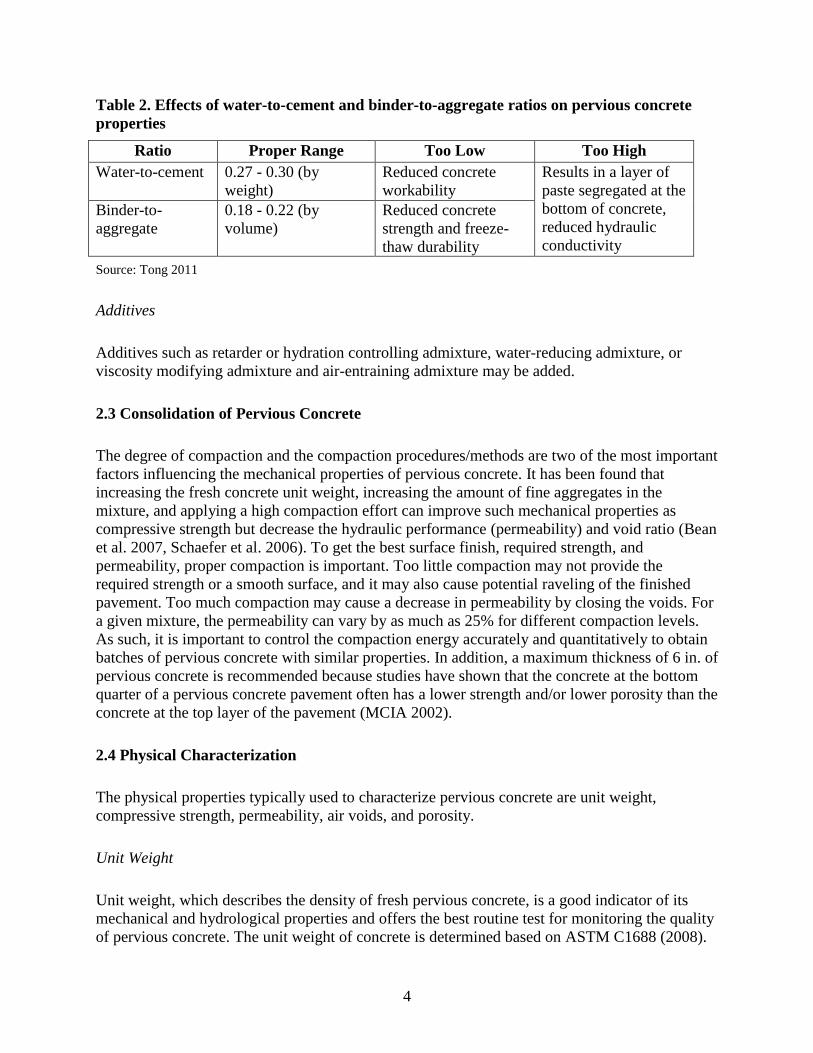
Table 2. Effects of water-to-cement and binder-to-aggregate ratios on pervious concrete
properties
Ratio Proper Range Too Low Too High
Water-to-cement 0.27 - 0.30 (by
weight)
Reduced concrete
workability
Results in a layer of
paste segregated at the
bottom of concrete,
reduced hydraulic
conductivity
Binder-to-
aggregate
0.18 - 0.22 (by
volume)
Reduced concrete
strength and freeze-
thaw durability
Source: Tong 2011
Additives
Additives such as retarder or hydration controlling admixture, water-reducing admixture, or
viscosity modifying admixture and air-entraining admixture may be added.
2.3 Consolidation of Pervious Concrete
The degree of compaction and the compaction procedures/methods are two of the most important
factors influencing the mechanical properties of pervious concrete. It has been found that
increasing the fresh concrete unit weight, increasing the amount of fine aggregates in the
mixture, and applying a high compaction effort can improve such mechanical properties as
compressive strength but decrease the hydraulic performance (permeability) and void ratio (Bean
et al. 2007, Schaefer et al. 2006). To get the best surface finish, required strength, and
permeability, proper compaction is important. Too little compaction may not provide the
required strength or a smooth surface, and it may also cause potential raveling of the finished
pavement. Too much compaction may cause a decrease in permeability by closing the voids. For
a given mixture, the permeability can vary by as much as 25% for different compaction levels.
As such, it is important to control the compaction energy accurately and quantitatively to obtain
batches of pervious concrete with similar properties. In addition, a maximum thickness of 6 in. of
pervious concrete is recommended because studies have shown that the concrete at the bottom
quarter of a pervious concrete pavement often has a lower strength and/or lower porosity than the
concrete at the top layer of the pavement (MCIA 2002).
2.4 Physical Characterization
The physical properties typically used to characterize pervious concrete are unit weight,
compressive strength, permeability, air voids, and porosity.
Unit Weight
Unit weight, which describes the density of fresh pervious concrete, is a good indicator of its
mechanical and hydrological properties and offers the best routine test for monitoring the quality
of pervious concrete. The unit weight of concrete is determined based on ASTM C1688 (2008).

5
Depending on the mixture, the materials used, and the compaction levels and procedures, the unit
weight of fresh pervious concrete is commonly between 105 lb/ft3 and 120 lb/ft
3 (1680 to 1920
kg/m3). The porosity of pervious concrete can be determined from the unit weight, and therefore
the compressive strength can be predicted based on the relationship between void ratio and
compressive strength (Kevern et al. 2008, Tennis et al. 2004).
Compressive Strength
Compressive strength is used in the structural design of pervious concrete pavement and is
determined based on ASTM C39 (2003). Pervious concrete mixtures can have compressive
strengths ranging from 500 psi to 4000 psi (3.5 MPa to 28 MPa). The typical pervious concrete
compressive strength is approximately 2500 psi (17 MPa) (Tan et al. 2003). Zouaghi et al. (2000)
showed that the compressive strength of a mix is linearly proportional to unit weight but
inversely proportional to void ratio.
Permeability
The permeability of pervious concrete is a measure of the water flow through the pore spaces or
fractures in the pervious concrete. The permeability of pervious concrete is determined using the
falling head permeability test and is estimated based on Darcy’s Law. Permeability is an
important parameter used in the hydrological design of pervious concrete. Typical permeability
values range from 3 gal/ft2/min (120 L/m
2/min or 0.2 cm/s) to 17 gal/ft
2/min (700 L/m
2/min or
1.2 cm/s) (Montes and Haselbach 2006).
Air Voids
The average pore sizes of pervious concrete typically range from 2 mm to 8 mm. The void ratio
ranges from 15% to 35% by volume. The air void content of pervious concrete can be
determined using either an automatic image analysis device, RapidAir, according to ASTM C457
(2012) “Standard Test Method for Microscopical Determination of Parameters of the Air-Void
System in Hardened Concrete” or the flatbed scanner method (Peterson et al. 2009). Another
method is the standard linear-traverse test method (ASTM C1754 2012). In contrast to ASTM
C457, in ASTM C1754 the measured points are counted manually.
The RapidAir and the flatbed scanner methods are much less tedious than the manual test
method. In the RapidAir method, a cross-section of a polished sample is stained with a black ink,
and the voids are filled with a white material such as zinc paste, which allows the rapid air
system to distinguish between the air voids and the concrete matrix. The RapidAir device
automatically scans the sample surface and provides the air void parameters. Recent studies have
shown that the RapidAir method has a high degree of multi-laboratory reproducibility and has
less variation than the manual technique (Jakobsen et al. 2006). The RapidAir test method can
determine the air content, specific surface area, and spacing factor. Research has shown a strong
relationship between porosity/air content and spacing factor for conventional concrete using the
RapidAir and flatbed scanner methods (Carlson et al. 2006). However, the air content measured
6
by the RapidAir method was found to be slightly higher and the spacing factor was found to be
slightly lower than those values measured by the flatbed scanner method. This implies that the
flatbed scanner method may not capture all of the air voids in conventional concrete that the
RapidAir method captures due to the resolution limitations of the scanner.
The flatbed scanner method uses an ordinary flatbed scanner to scan the prepared samples.
Analysis of the scanned images using a software program provides the air content and spacing
factor of the specimens. The flatbed scanner method is cost effective and convenient in
comparison to the manual and RapidAir methods of analysis because the scanned image takes a
few minutes to produce. The flatbed scanner method can also provide an assessment of the
amount and size distribution of entrapped air in concrete (Peterson et al. 2009). Peterson et al.
(2009) also reported that in the automated trials the air void frequency and air void specific
surface values were slightly lower and the average air void chord length values were slightly
higher than those values obtained by the manual method.
Pore-specific Surface Area and Spacing Factor
The specific surface area of a porous material, as given by the total internal boundary between
the solid phase and the pore system, is one of the microstructural properties of pervious concrete.
The spacing factor is a parameter describing the average distance of an air void to its
nearest neighboring air void. The spacing factor is determined using an equation in ASTM C457
(2012) “Standard Test Method for Microscopical Determination of Parameters of the Air-Void
System in Hardened Concrete.”
Porosity
The porosity of pervious concrete is a function of the concrete materials, their proportions, and
the compaction procedures. The typical porosity of pervious concrete ranges from 15% to 30%.
Porosity affects the properties of pervious concrete, including compressive strength, flexural
strength, permeability, and storage capacity, and is regarded as an important parameter in many
design calculations (Montes et al. 2005). Porosity can be measured using the water displacement
method proposed by Montes et al. (2005). The relationship between the porosity and
permeability of pervious concrete has been discussed in several studies (ACI 2006, Low et al.
2008, Kevern 2006, Schaefer et al. 2006, Montes et al. 2005). Figure 1 shows that permeability
increases exponentially with increasing porosity.

7
Neithalath et al. 2010
Figure 1. Relationship between porosity and permeability for pervious concrete mixtures
Several formulas have been proposed to estimate the permeability of pervious concrete based on
the measured porosity. Permeability calculations based on Darcy’s Law were found to be less
predictable than permeability values estimated using the Carman-Kozeny equation (Kevern et al.
2008, Neithalath et al. 2010, Montes and Haselbach 2006). This is generally due to the flow
regime in the pervious concrete, where the flow is transitional rather than laminar, the latter of
which is an assumption of Darcy’s Law. A summary of some of the best-fit equations describing
the relationship between permeability coefficients and porosities is presented in Table 3.

8
Table 3. Equations predicting permeability coefficients (k) from porosity ()*
Reference Sample Description K function of porosity (p)
Carman-Kozeny Equation
α factor Equation
Montes et al. 2005 Porosity: 16%, 18% and 28%
Cylinders: 4 in. dia. x 4 in.–6 in. height
K=7.214*e(0.1761*p)
R2=0.73
Sample size=19
18.9 K = 18.9 ×𝑝3
(1 − 𝑝)2
Delatte et al. 2009 N/A K=2.8705*e
(0.1674*p)
R2=0.67
9 K = 9 ×𝑝3
(1 − 𝑝)2
Wang et al. 2006
2 Cylinders: 3 in. dia. x 3 in. height
Unit Weight: 104.1–132.2 lb/ft3
Porosity: 14.4%–33.6%
Permeability: 0.015–0.193 in./sec
K=13.257*e(0.1579*p)
R2=0.65
Sample Size: 19
19 K = 19 ×𝑝3
(1 − 𝑝)2
Schaefer et al. 2009,
Kevern et al. 2009
Cylinder cores: 3 in. dia. x 3 in. height for permeability
Cylinder cores: 3 in. dia. x 6 in. height for porosity test
Compaction Level: Low, Regular
Unit Weight: 104.1–138.9 lb/ft3 Porosity: 11.2%–38.8%
Permeability: 0.004–0.59 in./sec
K=5.8826*e(0.1873*p)
R2=0.79
Sample Size=17
18 K = 18 ×𝑝3
(1 − 𝑝)2
Luck et al. 2006 N/A K=0.066*e
(0.1121*p)
R2=0.79
43 K = 43 ×𝑝3
(1 − 𝑝)2
Huang et al. 2006 N/A K=0.732*e
(0.1451*p)
R2=0.99
25.36 K = 25.36 ×𝑝3
(1 − 𝑝)2
* Test methods: Falling head permeability test and volume method, units for k (in./sec.) and (%)
9
Pore Structure
The pore structure of pervious concrete includes the pore volume, pore size, pore distribution,
and the connectivity of the pores (Montes et al. 2005, Haselbach and Roberts 2006). Information
on pore structure of pervious concrete has been used to understand freeze-thaw damage of
pervious concrete, clogging, and associated maintenance and for the prediction of permeability.
The effect of pore size distribution on permeability has been studied by several researchers
(Neithalath et al. 2010, Low et al. 2008, Kevern 2006). Their results showed that measured
porosity is not the only factor that controls the hydraulic performance of pervious concrete, but
increasing either the pore size or pore connectivity would also increase the hydraulic
conductivity of the pervious concrete.
2.5 Mixture Design Research
Many researchers have experimented with different mixes, cementitious materials, w/b ratios,
and additives to obtain the optimal mix design for specific targeted pervious concrete properties.
Neithalath et al. (2010) obtained a porosity of about 20% using single-sized coarse aggregate
(pea gravel) (#8, #4, or 3/8 in.), Type 1 ordinary Portland cement, a w/c ratio of 0.33, and an a/b
ratio of 5. Wang et al. (2006) evaluated pervious Portland cement concrete mixes made with
various types and amounts of aggregates, cementitious materials, fibers, and chemical
admixtures. Their results indicated that pervious concrete made with single-sized coarse
aggregates generally had high permeability (0.57 in./sec) but did not have adequate strength.
They found that adding fine sand at approximately 7% by weight of total aggregate improved the
compressive strength by 47% while at the same time maintaining adequate water permeability.
They recommended a w/b ratio of 0.27 or lower. They also found that adding a small amount
(1.5 lb/yd3) of fiber (polypropylene) to the mix increased the concrete strength as well as the
void content, while adding latex (styrene butadiene rubber) at a weight percent of 1.6 improved
concrete cracking resistance. Kevern (2006) showed that narrowly graded coarse aggregate
between 3/8 in. and 3/4 in. (9.5 mm to 19 mm) produced significant differences in properties
compared to conventional concrete. In addition, angular aggregates produced pervious concrete
with a lower density, higher void content, higher permeability, and lower strength than concrete
that used rounded aggregates. Sumanasooriya and Neithalath (2011) found that using mixture
proportioning methods with higher paste contents and lower compaction efforts or with lower
paste contents and higher compaction efforts resulted in porosities close to the design porosities
in the range of 10% to 27%. They also found that pervious concrete with less paste content
resulted in an increase in porosity and pore connectivity. Lian and Zhuge (2010) obtained a 28
day compressive strength of 5802 psi (40 MPa) and a water permeability of 283 in./hr (2 mm/s)
using quarry sand at 18% by weight of the mix and an optimum w/c ratio of 0.32. They
recommended that when the structural strength or potential clogging of the pores is of particular
concern over the pavement’s service life, a higher w/c ratio (0.36) could be used.
Several researchers showed that mineral additives such as fly ash, slag, and silica fume resulted
in an improvement in the mechanical strength and durability of the concrete (Maso 1996).
Improvements in the mechanical properties with the addition of minerals are due to the improved
interfacial transition zone (ITZ) between the aggregate and the cement matrix.

10
Application of a superplasticizer as a dispersion agent has been shown to enhance strength
sufficiently to make high-strength porous concrete. Inclusion of silica fume was found not to be
very effective in improving the strength of porous concrete due to the difficulty in dispersing the
silica fume (Lee et al. 2011). Joung (2008) also investigated the addition of silica fume to a mix
and found that the compressive strength decreased primarily due to workability problems, which
did not allow the cement paste to uniformly coat the aggregates (see Figure 2). As shown in
Figure 2, the addition of fly ash was found to increase the compressive strength of the mix.
Joung 2008
Figure 2. Effect of cementitious materials on compressive strengths
A summary of various studies showing the effects of different mixes on the properties of
pervious concrete is given in Table 4.

11
Table 4. Pervious concrete properties of various mixes
Cement
(lb/yd3)
Coarse
aggregate
(lb/yd3)
Fine
aggregate
(lb/yd3)
Water-to-
cement
ratio
Porosity
(%)
Density
(lb/ft3)
Permeability
coefficient
(in./hr)
Compressive
strength
(psi)
Flexural
strength
(psi) References
450-700 - - - - 0.27-0.34 15-25 100-125 288-770 500-3000 150-550 Tennis et al. 2004
- - - - - - - - 20-30 118-130 - - 2553-4650 561-825 Beeldens 2001
486-600 2500-2700 168 0.22-0.27 18.3-33.6 104.1-130.9 142-694 1771-3661 205-421 Wang et al. 2006
347-944 2112-2836 - - 0.33 19-27 - - - 1000-2988 - - Sumanasooriya and
Neithalath 2011
- - - - - - 0.28-0.36 7.5-16.6 120-140 564-1791 2320-4133 - - Lian and Zhuge 2010
296 2245 225 0.29 14.8-25.9 108-125 283-1700 - - - - Tong 2011
12
2.5 Pollutants in Stormwater
The use of pervious concrete in pavements has several advantages, such as stormwater runoff
attenuation, ground water recharge, retention of natural drainage patterns, minimal water quality
degradation, and less need for curbs and storm sewers (ACI 2006). As permeable pavements,
pervious concretes have also been described as “effective in-situ aerobic bioreactors” and
“pollution sinks” (Scholz and Grabowiecki 2007). Pervious pavement systems are viewed as a
sustainable approach to providing needed pavement surfaces for urban areas and, at the same
time, allow for natural water infiltration or recharge into the soils.
In general, the extent of contamination of stormwater tends to vary based on land use, with a
higher degree of contamination in manufacturing areas and a lesser degree of contamination in
residential areas. Stormwater runoff from places such as gas stations, vehicle maintenance shops,
and industrial manufacturing plants tend to have both inorganic and organic pollutants of an
anthropogenic nature. Many of the pollutants are associated with the solid particles, dust, and
debris found on the surface of the pavement. A good example is metal ions, which are generally
bound to particles or dust (Magnuson et al. 2001). Particles in the runoff are generally retained
and trapped in the pore spaces of the pervious pavements, while some of the pollutants are
adsorbed into or interact with the pavement pore surfaces. The subbase and subgrade further
provide straining and removal of the particles and pollutants as the water infiltrates through
them. Stormwater runoff has been found to contain pollutants such as inorganic pollutants
(sulfate, chloride, ammonia, nitrate, and phosphate), metal pollutants (copper and zinc), and
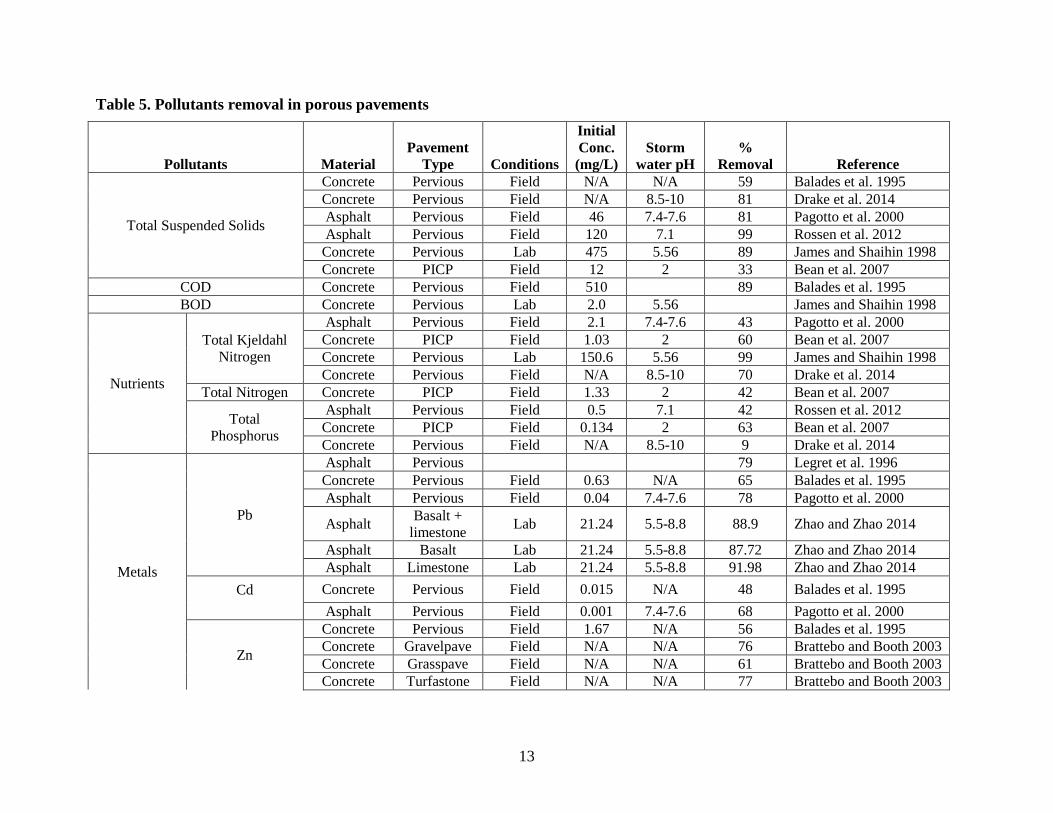
organic pollutants (petroleum hydrocarbons) (Dierkes et al. 2002). A list of pollutants and their
concentrations in stormwater can be found in Table 5.
13
Table 5. Pollutants removal in porous pavements
Pollutants Material
Pavement
Type Conditions
Initial
Conc.
(mg/L)
Storm
water pH
%
Removal Reference
Total Suspended Solids
Concrete Pervious Field N/A N/A 59 Balades et al. 1995
Concrete Pervious Field N/A 8.5-10 81 Drake et al. 2014
Asphalt Pervious Field 46 7.4-7.6 81 Pagotto et al. 2000
Asphalt Pervious Field 120 7.1 99 Rossen et al. 2012
Concrete Pervious Lab 475 5.56 89 James and Shaihin 1998
Concrete PICP Field 12 2 33 Bean et al. 2007
COD Concrete Pervious Field 510 89 Balades et al. 1995
BOD Concrete Pervious Lab 2.0 5.56 James and Shaihin 1998
Nutrients
Total Kjeldahl
Nitrogen
Asphalt Pervious Field 2.1 7.4-7.6 43 Pagotto et al. 2000
Concrete PICP Field 1.03 2 60 Bean et al. 2007
Concrete Pervious Lab 150.6 5.56 99 James and Shaihin 1998
Concrete Pervious Field N/A 8.5-10 70 Drake et al. 2014
Total Nitrogen Concrete PICP Field 1.33 2 42 Bean et al. 2007
Total
Phosphorus
Asphalt Pervious Field 0.5 7.1 42 Rossen et al. 2012
Concrete PICP Field 0.134 2 63 Bean et al. 2007
Concrete Pervious Field N/A 8.5-10 9 Drake et al. 2014
Metals
Pb
Asphalt Pervious 79 Legret et al. 1996
Concrete Pervious Field 0.63 N/A 65 Balades et al. 1995
Asphalt Pervious Field 0.04 7.4-7.6 78 Pagotto et al. 2000
Asphalt Basalt +
limestone Lab 21.24 5.5-8.8 88.9 Zhao and Zhao 2014
Asphalt Basalt Lab 21.24 5.5-8.8 87.72 Zhao and Zhao 2014
Asphalt Limestone Lab 21.24 5.5-8.8 91.98 Zhao and Zhao 2014
Cd
Concrete Pervious Field 0.015 N/A 48 Balades et al. 1995
Asphalt Pervious Field 0.001 7.4-7.6 68 Pagotto et al. 2000
Zn
Concrete Pervious Field 1.67 N/A 56 Balades et al. 1995
Concrete Gravelpave Field N/A N/A 76 Brattebo and Booth 2003
Concrete Grasspave Field N/A N/A 61 Brattebo and Booth 2003
Concrete Turfastone Field N/A N/A 77 Brattebo and Booth 2003

14
Pollutants Material
Pavement
Type Conditions
Initial
Conc.
(mg/L)
Storm
water pH
%
Removal Reference
Concrete Uni Eco-
Stone Field N/A N/A 80 Brattebo and Booth 2003
Concrete Pervious Field N/A 8.6-10 62 Drake et al. 2014
Asphalt Pervious Field 0.228 7.4-7.6 66 Pagotto et al. 2000
Asphalt Pervious Field 0.1 7.1 99 Rossen et al. 2012
Asphalt Basalt +
limestone Lab 0.51 5.5-8.8 62.55 Zhao and Zhao 2014
Asphalt Basalt Lab 0.51 5.5-8.8 72.35 Zhao and Zhao 2014
Asphalt Limestone Lab 0.51 5.5-8.8 99.9 Zhao and Zhao 2014
Cu
Concrete Gravelpave Field N/A
N/A 93 Brattebo and Booth 2003
Concrete Grasspave Field N/A N/A 99 Brattebo and Booth 2003
Concrete Turfastone Field N/A N/A 89 Brattebo and Booth 2003
Concrete Uni Eco-
Stone Field N/A N/A 93 Brattebo and Booth 2003
Concrete Pervious Field N/A 8.6-10 50 Drake et al. 2014
Asphalt Pervious Field 0.03 7.4-7.6 33 Pagotto et al. 2000
Fe Concrete Pervious Field N/A 8.6-10 32 Drake et al. 2014
Mn Concrete Pervious Field N/A 8.6-10 71 Drake et al. 2014
Hydrocarbons
Total
hydrocarbon Asphalt Pervious Field 1.2 7.4-7.6 93 Pagotto et al. 2000
Motor oil Concrete
Different
paver same
as above
Field N/A N/A 99 Brattebo and Booth 2003
Oil and grease Concrete Pervious Field 180 5.6 98 James and Shaihin 1998
PICP = permeable interlocking concrete pavers

15
Suspended Solids
Total suspended solids (TSS) come from vehicle exhaust emissions, vehicle parts, building and
construction materials, and atmospheric deposition of particles. Typical suspended solid sizes
range from 0.45 μm to 2 μm, and the typical concentration is 150 mg/L in urban runoff (US EPA
1999b). Drake et al. (2014) investigated the water quality of infiltrate during spring, summer, and
fall for three permeable pavement systems (AquaPave, Eco-Optiloc, and Hydromedia) and found
that the effluent from all three pavement systems had 80% less TSS than traditional asphalt
pavement. Bean et al. (2007) found that the TSS concentration in the exfiltrate of permeable
interlocking concrete pavers (8 mg/L) was lower than that of the runoff (12 mg/L).
Metals
Heavy metals are commonly found in stormwater runoff. One of the sources of heavy metals is
fine metallic dust generated from the semi-metallic pads of automobile disc brakes. The more
common metals found in the metallic dusts are copper and, at times, zinc and lead. A study by
Ellis et al. (1987) showed that highway runoff in northwest London was chronically toxic to
receiving waters, with the runoff containing Cd, Cu, Pb, and Zn concentrations of 6 ug/L, 45
ug/L, 17 ug/L, and 169 ug/L, respectively. In a study by Davis et al. (2001), the metals and their
concentrations in stormwater runoff from various urban areas and highways were typically Zn
(20–5000 μg/L), Cu and Pb (5–200 μg/L), and Cd (< 12 μg/L). In these two studies, brake wear
was the largest contributor of copper contamination (47% by mass) while tire wear was the
largest contributor of zinc contamination (25% by mass) in urban runoff. The fractions of metal
elements (particularly Zn and Cu) in the dissolved phase were significantly higher during rainfall
events, when the rainfall pH is lowest (3.8) and the average pavement residence time or holding
time of the stormwater is relatively long (5.6 min) (Sansalone and Buchberger 1997). Sansalone
and Buchberger (1997) indicated that the use of concrete could effectively increase the pH of the
runoff. Pratt et al. (1995) reported stormwater pH values between 6.0 and 9.3 for pervious
concrete pavers and found that Zn and Cu in the stormwater precipitate out when the pH in the
stormwater exceeded a value of 7.
Table 5 presents the percent removal of metals for different permeable pavement systems
(Brattebo and Booth 2003, Rushton 2001, Pagotto et al. 2000, Bean et al. 2007). Drake et al.
(2014) reported removal efficiencies of Cu (62%, 61%, 50%), Fe (60%, 74%, 32%), Mn (87%,
82%, 71%), and Zn (80%, 82%, 62%) for three commercial permeable pavement systems
(AquaPave, Eco-Optiloc, and Hydromedia), respectively. Brattebo and Booth (2003) reported Cu
concentrations of 0.89 ug/L, 1.33 ug/L, and 0.86 ug/L and Zn concentrations of 8.23 ug/L, 7.7
ug/L, and 6.8 ug/L in the infiltrates of three permeable concrete pavements (Grasspave,
Turfstone, and UNI Eco-stone), respectively, as compared to Cu and Zn concentrations of 7.98
ug/L and 21.6 ug/L in the runoff of impervious asphalt material. For a porous asphalt pavement,
Zhao and Zhao (2014) reported 88% and 63% removal of the initial amount of lead and zinc,
respectively, in the first flush of stormwater. Bean et al. (2007) found that the Cu and Zn
concentrations in the exfiltrate of permeable interlocking concrete pavers (0.005 mg/L and 0.008
mg/L, respectively) were lower than the Cu and Zn concentrations in the influent runoff (0.013
mg/L and 0.067 mg/L, respectively). In summary, for the fours metals commonly found in runoff

16
(Pb, Zn, Cu, and Cd), higher removals (60% to 90%) were obtained for pervious asphalt and
permeable interlocking concrete pavers, while lower removals (about 40% to 60%) were
obtained for pervious concrete.
Nutrients
Two common nutrients found in stormwater runoff are nitrogen and phosphorous. The major
sources of nitrogen and phosphorus in urban stormwater are from atmospheric deposition and
fertilizers found in landscape runoff (US EPA 1999b). Other sources of nutrients include animal
and human wastes. Typical concentrations of nitrogen compounds and phosphorus are presented
in Table 5.
Bean et al. (2007) compared the concentrations of various pollutants in the exfiltrate from
permeable interlocking concrete pavers and standard asphalt systems. For the interlocking
pavers, they found that the exfiltrate concentrations of total nitrogen and total Kjeldahl nitrogen
(TKN) were 0.77 mg/L and 0.41 mg/L, respectively, which were lower than the surface runoff
concentrations of 1.33 mg/L and 1.03 mg/L, respectively, from the asphalt system. However, the
nitrate-nitrite concentrations (0.44 mg/L) in the exfiltrate were found to be greater than the
concentrations in the runoff (0.3 mg/L). A possible reason is that the aerobic conditions
facilitated biological nitrification with the conversion of NH3-N to NO2- -N and NO3
- -N.
Similarly, James and Shaihin (1998) compared the quantity and quality of runoff from permeable
interlocking concrete pavers and rectangular concrete pavers with the runoff from an asphalt
block. Their study showed that water infiltrating through both interlocking and concrete pavers
resulted in an increase in NO3- -N (19%) and a decrease in TKN (98%), while there was little
change in phosphorous concentrations.
Bean et al. (2007) reported that the total phosphorus concentrations in the exfiltrate for
permeable interlocking concrete pavers (0.01 to 0.28 mg/L) were lower than the runoff
concentrations (0.03 to 0.98 mg/L). The permeable pavement, as a filtering system, can capture
the particulate-bound P in stormwater. However, there is a lack of long-term observations or data
to assess whether the bound P would remobilize over time (Drake et al. 2013).
Hydrocarbons
Used motor oil is the most likely source of hydrocarbon contamination in surface runoff (Latimer
et al. 1990). According to the US EPA (1996), hundreds of thousands of tons of oil per year were
estimated to be in road surface runoff. Motor oils also contain organic chemical additives to
enhance the motor oil’s performance and metallic compounds produced from the wear and tear
of the engine.
Accidental releases or spills of gasoline and antifreeze are common sources of contamination of
surface water runoff. Gasoline contains between 10% to 20% of benzene, toluene, ethylbenzene,
and xylene isomers (BTEX), which are hazardous substances. In addition, most gasoline contains
oxygenated additives such as methyl tertiary-butyl ether (MTBE), which is also a major chemical
17
of concern. Despite being a large source of contamination, low molecular weight hydrocarbons
retained on the surface and in the pores of pervious pavement are lost through volatilization and
biodegradation (Pitt et al. 1996). Table 5 presents the various studies reporting removal rates for
oil and grease, polycyclic aromatic hydrocarbons (PAHs), and petroleum hydrocarbons. In
summary, oil and grease, PAHs, and petroleum hydrocarbons were attenuated to concentration
levels below the detection limits (93% to 99% removal) (Pagotto et al. 2000, Brattebo and Booth
2003, James and Shaihin 1998).
2.6 Removal Mechanisms
Pollutant removal mechanisms include straining/filtering, absorption, adsorption, chemical
immobilization, and biodegradation. As the runoff percolates through the porous pavement, solid
particles are strained and trapped on the pavement surface and within the pore structure of the
pavement (Ferguson 2005). Capture begins with the settling of sand grains and small gravel
particles, followed by smaller particles being lodged around the sand grains. Particle capture is
one of the processes that can reduce the surface infiltration rate. In this process, particles pass
though the surface pores, continue to the bottom of the pavement, and then settle on the
pavement’s floor or discharge through a drainage pipe, if one is present. Furthermore, most
solids accumulate at the surface or the bottom of the pavement, and very limited accumulations
tend to be in the middle (Ferguson 2005). Also, metal ions adsorbed onto the particles are
removed along with the particles (Magnuson et al. 2001). Due to the solids’ retention in the
porous material, regular maintenance of the pavement is needed (Legret et al. 1996). Balades et
al. (1995) investigated four methods of cleaning porous pavement: moistening following by
sweeping, sweeping followed by suction, suction alone, and washing with a high-pressure water
jet and suction. The authors found that using a high-pressure water jet with suction produced
satisfactory cleaning results.
Dissolved constituents can be removed by adsorbing onto the permeable pavement itself or
adsorbing onto solid particles and the solids trapped within the pavement as the infiltrated water
travels through the pore spaces (Teng and Sansalone 2004). Calcium, organic acids, PAHs,
metals, and phosphorous can be adsorbed onto the suspended solids (Sansalone and Buchberger
2008). Possible immobilization of heavy metals is due to (1) sorption, (2) chemical incorporation
(surface complexation, precipitation), and (3) micro- or macro-encapsulation (Glasser 1997).
Sorption of heavy metals onto cement hydration products includes physical adsorption and
chemical adsorption. Physical adsorption occurs when contaminants are attracted to the surfaces
of particles because of the unsatisfied charges of the particles. Chemical adsorption refers to
high-affinity adsorption involving covalent bonds. Heavy metal ions may be adsorbed onto the
surfaces and then enter the lattice to form a solid phase, which alters the ions’ structure or
particle size and solubility (Chen et al. 2009). In addition, heavy metals can be precipitated as
hydroxides, carbonates, sulfates, and silicates. Hydroxide precipitation for a specific metal
occurs when the pH of a solution is raised above an optimum level. The optimum pH is different
for each metal and for different valence states of a single metal. Some heavy metals, for
example, Zn2+
, Cd2+
, and Pb2+
, form hydroxides and deposit onto calcium silicate minerals
(Giergiczny and Krol 2008). Murakami et al. (2008, 2009) found that zinc present on the solid
sediments of surface runoff was in the form of free ions and carbonate complexes. Harada and
18
Komuro (2010) speculated that lead can be immobilized by ettringite, which forms a complex
compound as suggested by Gougar et al. (1996).
Organic pollutants trapped and adsorbed in the porous structure may biodegrade due to the
microbiota on the pavement (Ferguson 2005). The composition of the microbiota shifts with the
seasons. Biodegradation is faster in summer and slower in winter (Ferguson 2005).
Transformation of nitrogen compounds and reduction of organic carbon and chemical oxygen
demand through pervious pavement have been attributed to microbial activity within the
pavement. Pratt et al. (1999) directly found that a highly diverse microbial “biofilm” was visible
under an electron microscope. In that study, the geotextile separating the grid setting bed and the
aggregate base course was found to be a site for biofilm development. The authors also found
that by adding organic material such as peat or carbon granules in the voids of the base aggregate
increased the removal of organic pollutants.
19
3 MATERIALS
3.1 Pervious Concrete Mixes
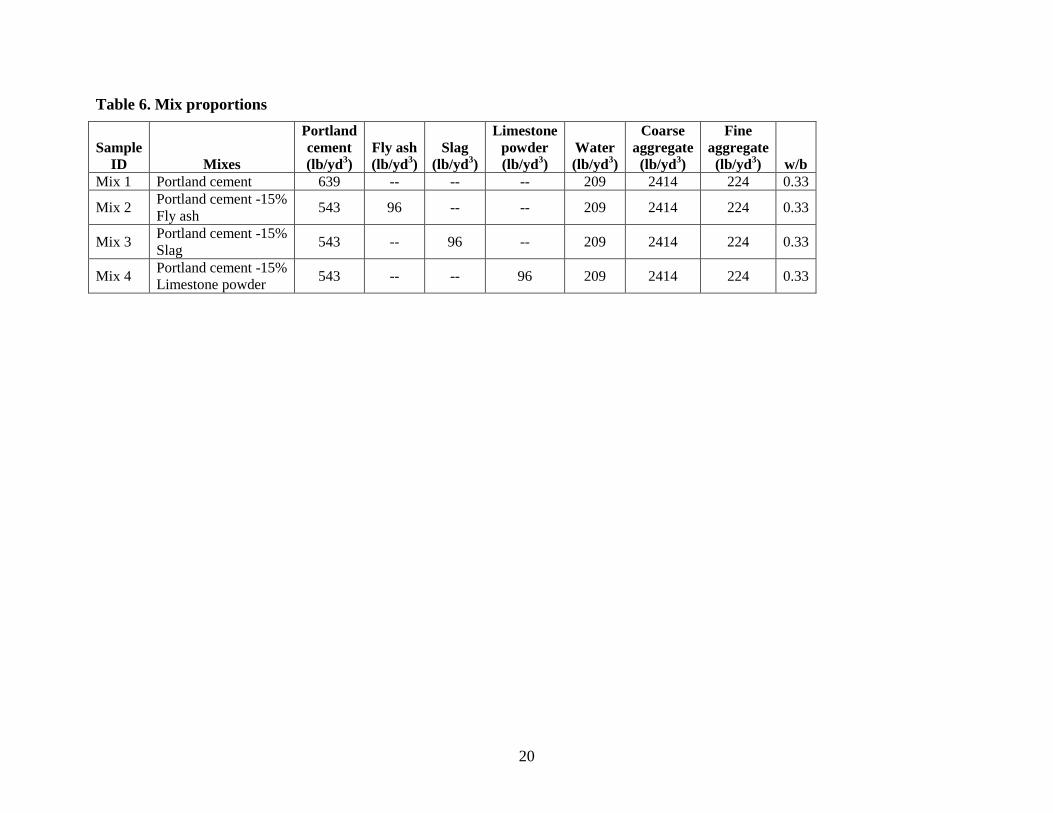
Four pervious concrete mixes were prepared with a target porosity of 20%. The mix proportions
are presented in Table 6. The only differences in these mixes were their binder materials. One
mix had pure Portland cement, and the other three had 15% of the Portland cement substituted by
fly ash, slag, or limestone powder, respectively.
20
Table 6. Mix proportions
Sample
ID Mixes
Portland
cement
(lb/yd3)
Fly ash
(lb/yd3)
Slag
(lb/yd3)
Limestone
powder
(lb/yd3)
Water
(lb/yd3)
Coarse
aggregate
(lb/yd3)
Fine
aggregate
(lb/yd3) w/b
Mix 1 Portland cement 639 -- -- -- 209 2414 224 0.33
Mix 2 Portland cement -15%
Fly ash 543 96 -- -- 209 2414 224 0.33
Mix 3 Portland cement -15%
Slag 543 -- 96 -- 209 2414 224 0.33
Mix 4 Portland cement -15%
Limestone powder 543 -- -- 96 209 2414 224 0.33
21
For each mix, five concrete cylinders (4 in. diameter x 8 in. length or 100 mm diameter x 200 m
length) were cast, along with one 4 in. diameter x 6 in. long (100 mm diameter and 150 mm
length) cylinder that was cast within a plastic column for pollution abatement experiments. Three
of the 4 in. diameter x 8 in. length cylinders were used for compressive strength tests, while the
remaining two were used for permeability (hydraulic conductivity) tests and pore structure
characterization experiments.
The coarse aggregate used was granite obtained from Helgeson Quarry, Knife River Corporation,
St. Cloud, Minnesota. It had a maximum size of 1/2 in. (12.7 mm), a specific gravity of 2.7, and
an absorption of 0.7%. The fine aggregate used was river sand from Hallett Materials, Ames,
Iowa. It had a fineness modulus of 2.9, a specific gravity of 2.7, and an absorption of 1.4%. The
basic properties and gradations of the coarse and fine aggregates are shown in Table 7.
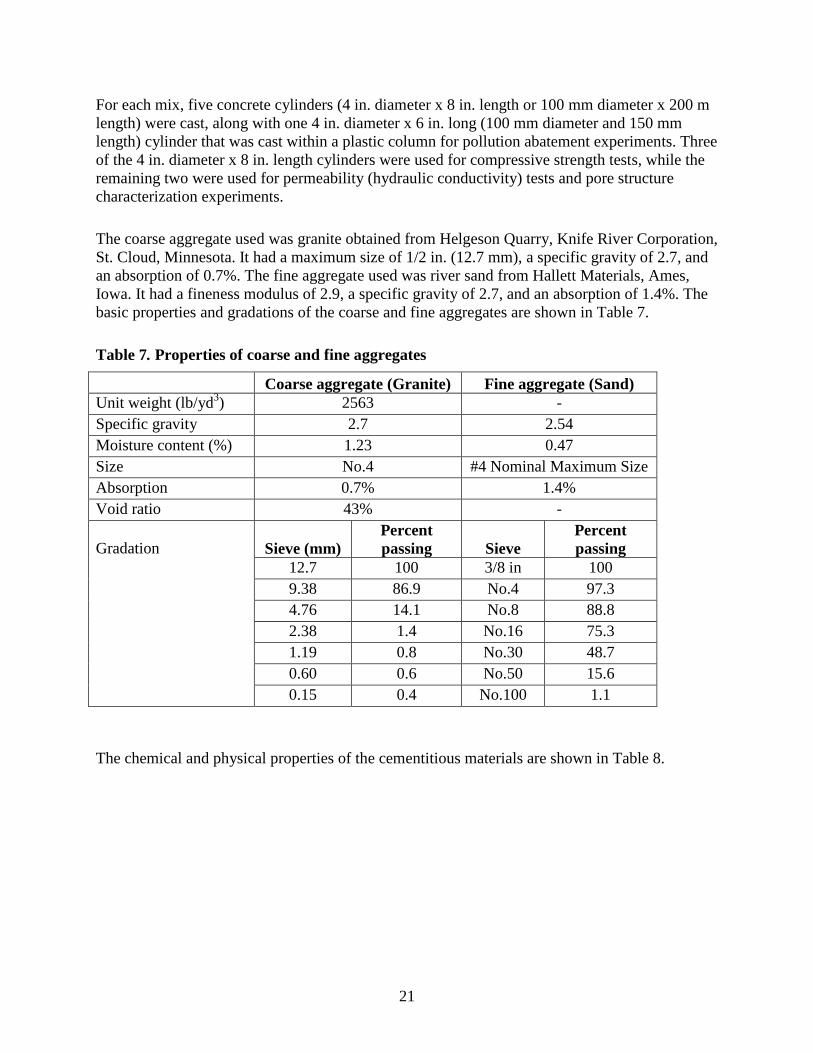
Table 7. Properties of coarse and fine aggregates
Coarse aggregate (Granite) Fine aggregate (Sand)
Unit weight (lb/yd3) 2563 -
Specific gravity 2.7 2.54
Moisture content (%) 1.23 0.47
Size No.4 #4 Nominal Maximum Size
Absorption 0.7% 1.4%
Void ratio 43% -
Gradation Sieve (mm)
Percent
passing Sieve
Percent
passing
12.7 100 3/8 in 100
9.38 86.9 No.4 97.3
4.76 14.1 No.8 88.8
2.38 1.4 No.16 75.3
1.19 0.8 No.30 48.7
0.60 0.6 No.50 15.6
0.15 0.4 No.100 1.1
The chemical and physical properties of the cementitious materials are shown in Table 8.

22
Table 8. Chemical and physical properties of cementitious materials
Compound (%) Cement Fly ash Slag
Limestone
powder
SiO2 20.2 46.0 36.5 2.82
Al2O3 4.7 17.8 8.54 1.06
Fe2O3 3.3 18.2 0.83 0.41
SO3 3.3 2.59 0.6 0.24
CaO 62.9 8.40 41.1 53.3
MgO 2.7 0.95 9.63 0.32
Na2O -- 0.59 0.29 0.03
K2O -- 2.16 0.44 0.32
CaCO3 -- -- -- 41.92
Loss of ignition (LOI) 1.1 1.49 -- --
Specific gravity 3.15 2.28 2.95 2.70
Blaine fineness (m2/kg) 385.3 309.7 455.3 390.8
The cement used was a Type I/II Portland cement from Lafarge North America Inc., Des
Moines, Iowa. The fly ash was Class F ash from Cumberland Fossil Plant, Knoxville, Tennessee.
The slag was a ground granulated blast furnace slag (GGBFS) obtained from Holcim Inc., Des
Moines, Iowa. The limestone powder was from Martin Marietta, Ames, Iowa.
3.2 Concrete Mixing and Casting
The concrete was mixed using a Lancaster 30-DH pan concrete mixer. First, coarse aggregate
and sand were loaded into the mixer and the materials were dry mixed for 30 seconds. Water was
then added to the mixture. After the mixture was mixed for another 30 seconds, the cementitious
materials were loaded. The mixture was then mixed for 3 minutes, rested for 3 minutes, and then
mixed for 2 more minutes.
After the completion of mixing, the workability of the fresh pervious concrete mixture was
evaluated. Then, five 4 in. diameter x 8 in length cylinder specimens and a 4 in. diameter column
specimen were prepared. The 4 in. diameter column specimen simulated a 6 in. thick pervious
concrete layer of a pervious concrete pavement system on top of a 6 in. thick graded limestone
layer (subbase) on top of a 4 in. thick drainable sand layer (as subgrade) (see Figure 5). Each
sample was cast with three layers, and each layer was rodded with a 1 in. diameter rod 25 times.
After rodding each layer, the samples were vibrated using a vibration table for 5 seconds.
Twenty-four hours later, the cylinder specimens were demolded and cured in a standard curing
room at 73F and 98% relative humidity until testing.
23
3.3 Engineering Properties of Pervious Concrete
For each concrete mix, the key engineering properties were evaluated, including the workability
and unit weight of fresh concrete and the compressive strength, air void structure, and water
permeability of hardened concrete.
The unit weight of each pervious concrete mix was determined by measuring the weights of the
three cylinders divided by their total volume. A 28 day compressive strength test was performed
according to ASTM C39 (2003) “Standard Test Method for Compressive Strength of Cylindrical
Concrete Specimens” using a compression testing machine (Test Mark Industries, East Palestine,
Ohio). The ends of the cylinders were capped according to ASTM C617 (2015), “Standard
Practice for Capping Cylindrical Concrete Specimens.”
The air voids, specific surface areas, and spacing factors of the pervious concrete samples were
measured using the RapidAir method and the flatbed scanner method. For both tests, a slice of
concrete with dimensions of 4 in. width x 8 in. length x 0.75 in. thickness was cut from each
cylinder specimen, and the slice was then cut into half to form two 4 in. width x 4 in. length x
0.75 in. thickness samples, one representing the top section and the other representing the bottom
section of the cylinder. These pervious concrete slice specimens were progressively polished
with 260 μm, 70 μm, 15 μm, and 6 μm grits using an Allied High Tech Products, Inc. polisher
(METPREP 2TM, Rancho Dominguez, California). The polished specimens were then coated
with broad-tipped black marker ink. After the ink had dried, the specimens were placed in an
oven for 2 hours at 80°C. After the heating, the specimens were removed and coated with a white
paste comprised of petroleum jelly and zinc oxide (Fisher Scientific, Pittsburgh, Pennsylvania)
and allowed to cool. Any extra paste was removed by dragging an angled razor blade across the
surface until all of the paste was removed from the aggregate and cement paste area. Specimens
for both tests are shown in Figure 3.
24
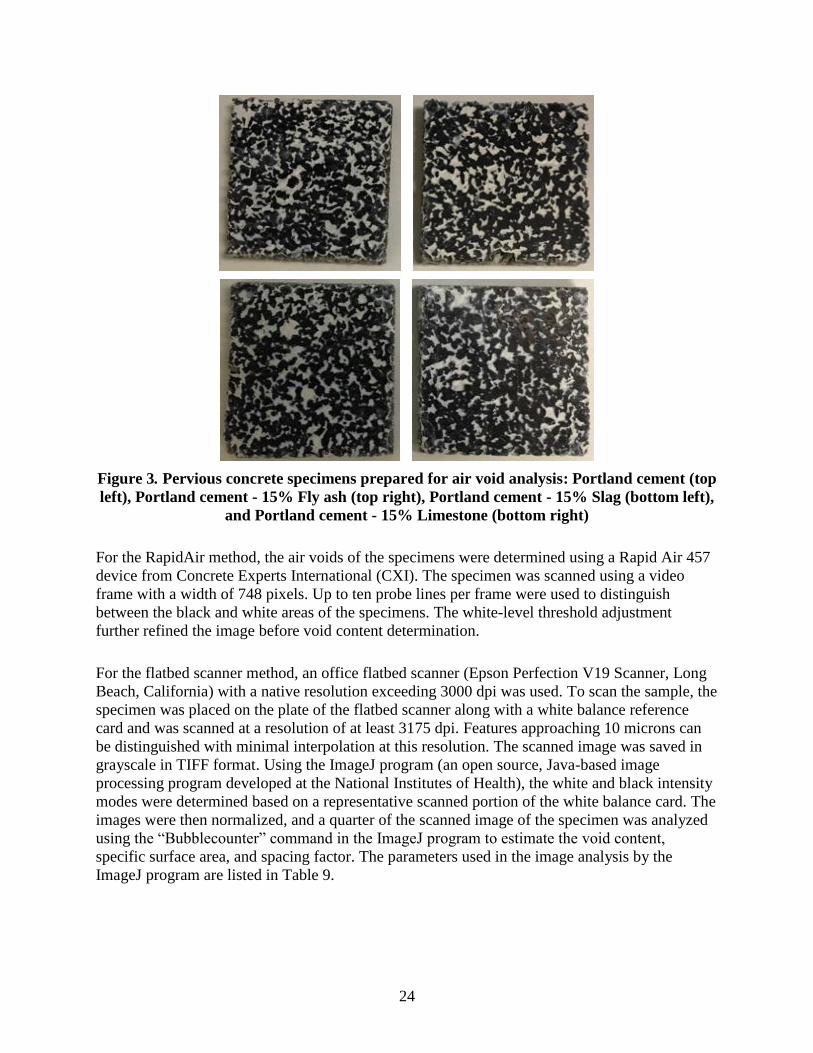
Figure 3. Pervious concrete specimens prepared for air void analysis: Portland cement (top
left), Portland cement - 15% Fly ash (top right), Portland cement - 15% Slag (bottom left),
and Portland cement - 15% Limestone (bottom right)
For the RapidAir method, the air voids of the specimens were determined using a Rapid Air 457
device from Concrete Experts International (CXI). The specimen was scanned using a video
frame with a width of 748 pixels. Up to ten probe lines per frame were used to distinguish
between the black and white areas of the specimens. The white-level threshold adjustment
further refined the image before void content determination.
For the flatbed scanner method, an office flatbed scanner (Epson Perfection V19 Scanner, Long
Beach, California) with a native resolution exceeding 3000 dpi was used. To scan the sample, the
specimen was placed on the plate of the flatbed scanner along with a white balance reference
card and was scanned at a resolution of at least 3175 dpi. Features approaching 10 microns can
be distinguished with minimal interpolation at this resolution. The scanned image was saved in
grayscale in TIFF format. Using the ImageJ program (an open source, Java-based image
processing program developed at the National Institutes of Health), the white and black intensity
modes were determined based on a representative scanned portion of the white balance card. The
images were then normalized, and a quarter of the scanned image of the specimen was analyzed
using the “Bubblecounter” command in the ImageJ program to estimate the void content,
specific surface area, and spacing factor. The parameters used in the image analysis by the
ImageJ program are listed in Table 9.

25
Table 9. Parameters for image analysis
Sample
Paste
content
Threshold Air
Content
Threshold Void
Frequency
Portland cement 0.222 131 110
Portland cement
- 15% Fly ash
0.184 120 221
Portland cement
- 15% Slag
0.149 129 110
Portland cement
- 15% Limestone
powder
0.163 131 110
Permeability, or hydraulic conductivity, tests were performed using a falling head permeameter
(Montes and Haselbach 2006). Figure 4 shows the permeameter for a 4 in. diameter test
specimen.
Figure 4. Falling head permeameter: setup (left) and schematic diagram (right)
The permeameter consisted of a 4 in. diameter upstream polyvinyl chloride (PVC) pipe with a U-
shaped assembly. The U-shaped assembly was mounted with a scale to record the change in
head. To prepare the specimen for testing, the side of the specimen was covered with silicone
sealant and wrapped with Saran wrap plastic film before placing in a plastic mold. The gaps
between the mold and the top and bottom surfaces of the specimen were sealed with silicone to
minimize preferential flow in the space between the mold and the specimen. The mold was then
26
connected to the upstream PVC pipe and a bottom PVC collector pipe with rubber connectors
and hose clamps. The height of the end of the U-shaped assembly was kept at 2 in. above the top
of the specimen to maintain full saturation of water in the specimen. The apparatus was filled
with water from the bottom (downstream side) to displace and expel any air in the specimen.
After completely immersing the specimen in water, the apparatus was filled with water
continuously from the upstream side until a steady state flow was achieved. At steady state, the
water level was recorded. The upstream water level was then increased to a height of 12 in.
(Montes and Haselbach 2006) and then allowed to fall by a height of 4 in. The time needed for
the water level to fall by 4 in. was recorded.
The saturated hydraulic conductivity was estimated using the following equation (ASTM 2003):
t
os
H
Hln
tA
aLK
(1)
where Ks is the saturated hydraulic conductivity (in./min), L is the length of the sample (inches),
A is the cross-sectional area of the sample (in.2), a is the cross-sectional area of PVC pipe
holding the sample (in.2), Ho is initial water head marked at 12 in., and Ht is water head mark at 4
in., and Δt is the time (min) needed for the water level to fall from Ho to Ht.
3.4 Pollution Abatement Column Experiments
To study the pollution abatement properties of pervious concrete, column experiments were
conducted. The setup for the column with the different layers is presented in Figure 5.
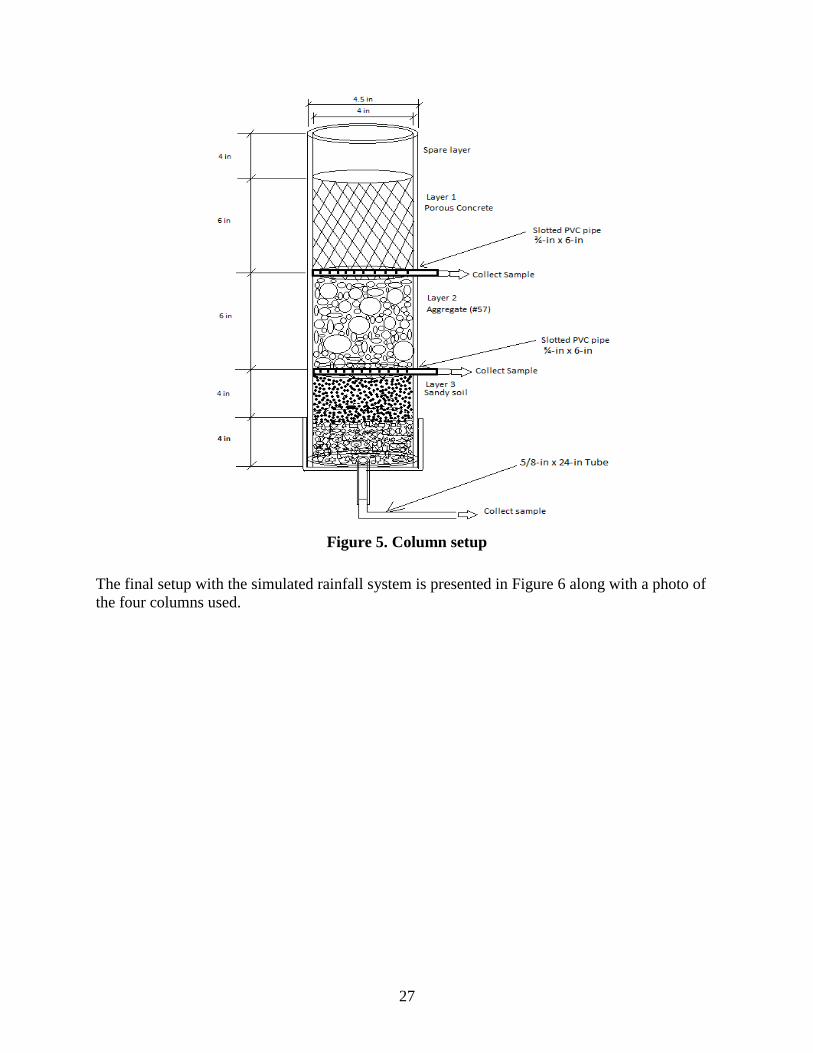
27
Figure 5. Column setup
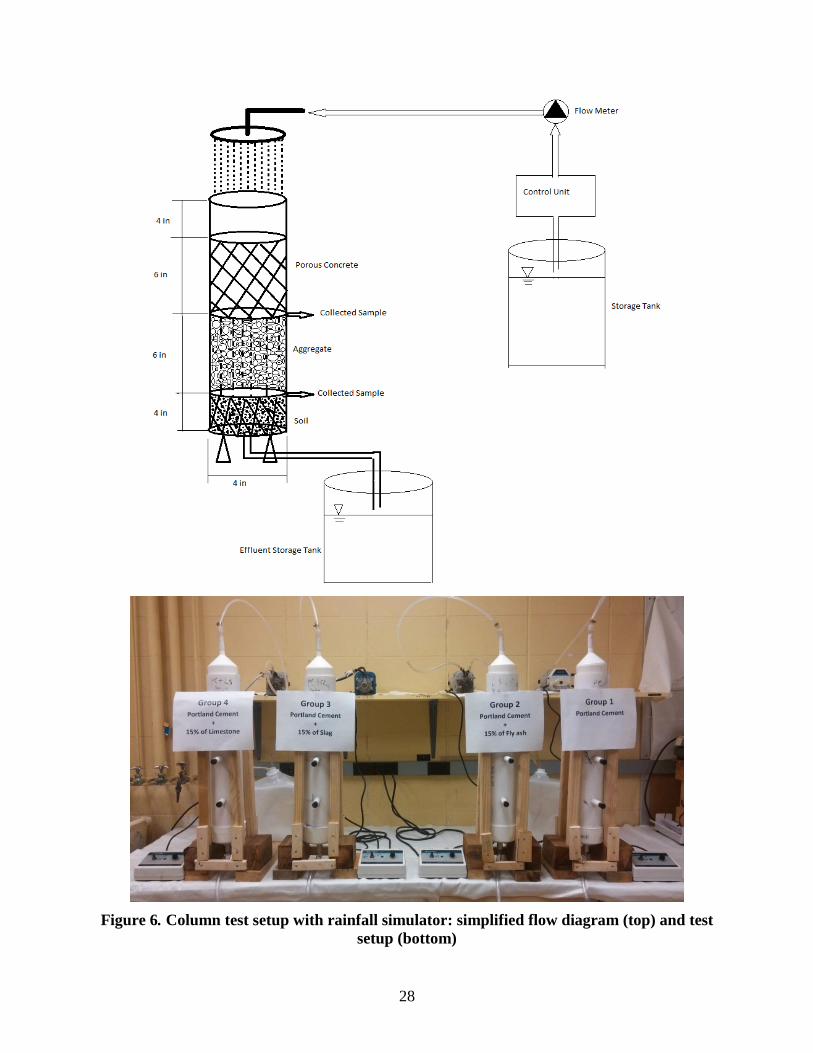
The final setup with the simulated rainfall system is presented in Figure 6 along with a photo of
the four columns used.
28
Figure 6. Column test setup with rainfall simulator: simplified flow diagram (top) and test
setup (bottom)
29
The column was made of a 4 in. diameter x 24 in. long PVC pipe with a 4 in. diameter Schedule
40 cap at the bottom. Two 3/4 in. holes were drilled 8 in. and 14 in. from the bottom. In these
two holes, a 3/4 in. x 6 in. long PVC pipe with 10 slots spaced at 2/5 in. intervals were inserted
for water collection. The 3/4 in. PVC pipe was sealed to the 4 in. pipe with glue. These pipes
were connected to a plastic tube with a valve, and the valve was only opened to allow water to be
collected when needed. These pipes were identified as the 8 in. and 14 in. water collection pipes.
A 3/4 in. hole was drilled in the center of the cap to allow water to be collected from the bottom
of the column. The bottom port was always open.
The bottom of the column was covered with a 4 in. diameter steel mesh and filled with gravel
(25.0 mm to 4.75 mm) to about 4 in. from the bottom of the column. A tamping rod was used to
compact the gravel in the column. This was followed by packing 4 in. of fine-grained sand to
serve as the subgrade layer. The 8 in. water collection pipe was then inserted with the slots
facing upwards to collect water. Six inches of #57 aggregate was then packed to serve as the
aggregate subbase. Similarly, a tamping rod was used to compact the gravel in the column. The
14 in. water collection pipe was inserted into the hole at 14 in. from the bottom of the column
with the slots facing upwards. The pipe was placed such that it was covered with a thin layer of
gravel. When the concrete mix was ready, 6 in. of the concrete mix was added for the pervious
concrete layer. A tamping rod was used to compact the concrete, and the surface of the pervious
concrete was made as level as possible.
The simulated rainfall was pumped from a storage tank continuously using a Masterflex pump
(Model 7553-02, Cole-Parmer, Court Vernon Hills, Illinois) through a sprinkler placed above the
column. At a selected time, infiltrated water samples were collected from the 4 in. and 8 in.
water collection pipes and from the bottom of the column.
The pollutant used in the simulated rainwater was naphthalene at a concentration of 30 mg/L.
The recommended water quality criterion for naphthalene is 0.5 mg/L. For each column, 3.6
liters of simulated rainwater was applied over a six-hour period. The simulated rainwater applied
was equivalent to a 3 in. rain event per hour. This rainfall is similar to the mean rainfall amount
of 3.11 in. for a storm period of one hour with a recurrence interval of 100 years in Ames, Iowa,
and central Iowa (Iowa DOT 2009). The surface area of the pervious concrete specimen in the
column was approximately 12.56 in.2.
After six hours of rainfall, infiltrated water samples were collected from the 8 in. and 14 in.
water collection pipes and from the bottom of the column. The water samples were collected in a
glass container. For chemical analysis, about 1.5 mL of the water samples were collected from
each glass container and placed in a 2 mL glass vial (US EPA 1999a). All samples were
refrigerated until they were analyzed. The samples were analyzed using a high-performance
liquid chromatograph (HPLC) with a quart pump and an unltraviolet (UV) diode array detector
(Model 1200 Series, Agilent Technologies, Santa Clara, California). The column used was a 150
mm × 4.6 mm C18 column. The mobile phase used was 100% (vol./vol.) HPLC-graded water at
a flow rate of 1.0 mL/min, and the UV-vis detector wavelength was set at 254 nm. Naphthalene
was detected at a retention time of 14 minutes, with a detection limit of 0.01 mg/L. A standard
naphthalene curve was prepared using concentrations ranging from 0.1 mg/L to 30 mg/L.

30
4 EXPERIMENTAL RESULTS
4.1 Workability of Fresh Pervious Concrete
The workability of pervious concrete for four mixtures was evaluated qualitatively based on the
ability of the plastic pervious concrete to form a ball by hand. Figure 7 shows the balls made
from the mixtures tested.
Figure 7. Workability test results of pervious concrete mixtures: Portland cement (top left),
Portland cement - 15% Fly ash (top right), Portland cement - 15% Slag (bottom left), and
Portland cement - 15% Limestone (bottom right)
It can be seen from the figure that the pure Portland cement mixture and 15% fly ash mixture had
good workability, and sufficient mortar materials filled the spaces among the coarse aggregate
particles and held the particles into a well-shaped ball. The 15% slag and 15% limestone powder
mixtures had slightly lower workability, and some spaces were clearly seen among some coarse
aggregates. However, the workability of all four mixtures tested was acceptable because they all
formed a ball.
It should be noted that the specific gravities of fly ash (2.28), slag (2.95), and limestone (2.7) are
lower than that of Portland cement (3.15). Therefore, the 15% (by weight) replacement of these
materials for cement actually provided more paste volume in the concrete, which could improve

31
the concrete workability. However, the slag had a much higher specific surface value (247
yd2/lb or 455.3 m
2/kg) and the limestone powder had a slightly higher specific surface value (212
yd2/lb or 390.8 m
2/kg) than the Portland cement (209 yd
2/lb or 385.3 m
2/kg). As mixing water
was adsorbed onto the fine particle surfaces, the workability of the concrete was reduced. As a
result, the pervious concrete mixture with 15% slag displayed a less desirable workability than
the mixture made with pure Portland cement.
4.2 Unit Weight, Strength and Permeability of Pervious Concrete
The unit weight, 28 day compressive strength, and water permeability of the four pervious
concrete mixes studied are summarized in Table 10.
Table 10. Unit weight, strength, and permeability of pervious concrete mixes
Mixes
Unit weight
(lb/ft3)
28 day
compressive
strength
(psi)
Permeability
coefficient,
Ks,
(in./hr)
Portland cement 117.0 2285 ± 228 340
Portland cement - 15% Fly ash 119.6 2120 ± 207 369
Portland cement - 15% Slag 115.9 1858 ± 184 624
Portland cement - 15% Limestone
powder 119.4 2045 ± 344 354
As shown in the table, the unit weights of mixtures made with 15% fly ash and 15% limestone
powder replacement were slightly higher than that of the mixture with pure cement, which itself
was a little higher than that of the mixture made with 15% slag replacement. This small variation
might be related to the workability of the mixtures because they had the same mix proportions.
Many studies have indicated that the use of fly ash and limestone powder as a cement
replacement can improve concrete workability (Malhotra 2002, Beeralingegowda and
Gundakalle 2013), thus possibly helping the consolidation of the concrete.
As shown in Figure 8, the 28 day compressive strength of the four mixes generally increased
while the water permeability generally decreased with the unit weight of the concrete.

32
(a) Comparison
(b) Relationship
Figure 8. Unit weight, strength, and permeability of pervious concrete mixtures
Because the mix with slag had the lowest unit weight value, which probably attributed to the
concrete’s consolidating ability or workability, its compressive strength was about 10% lower
than that of the mix with pure cement due to the former’s less desirable consolidation.
The permeability of pervious concrete is mainly controlled by its pore structure (volume, size,
and connectivity), the latter of which also significantly affects concrete strength because pores
reduce the effective cross-section area for load bearing. Therefore, opposite trends were found in
0
500
1000
1500
2000
2500
0
20
40
60
80
100
120
140U
nit
we
igh
t (l
b/c
f)
Avg. Unit weight (lb/ft3)
Avg. 28-day Compressive strength (psi)
28
day C
om
p. Stre
ngth
(psi)

33
Figure 8 between the concrete strength versus unit weight and the permeability versus unit
weight. These findings are consistent with previous studies, although the data from the present
study are limited.
4.3 Pore Structure of Pervious Concrete
The pore structures of the four pervious concrete mixes used in this study were analyzed using
both the flatbed scanner test and the RapidAir test. The RapidAir scanning test method had only
5 traverses for each tested sample, compared to 150 traverses performed by the flatbed scanner
test method. The results are presented in Table 11.
Table 11. Pore parameters of pervious concrete mixes
Mixes
Flatbed scanner RapidAir
Void
content
(%)
Specific
surface
area
(mm-1
)
Spacing
factor
(mm)
Void
content
(%)
Specific
surface
area
(mm-1
)
Spacing
factor
(mm)
Portland cement 31.41 5.47 0.130 24.15 8.17 0.11
Portland cement - 15% Fly ash 28.57 4.73 0.137 23.27 5.49 0.15
Portland cement - 15% Slag 24.00 5.23 0.120 18.93 5.38 0.13
Portland cement -15%
Limestone powder 28.25 5.06 0.120 20.95 6.45 0.12
Each datum in the table represents the average value of the two (top and bottom) samples cut
from a 4 in. x 8 in. cylinder.
Figure 9 presents the comparisons of the test data obtained from these two different test methods.
34
(a) Air voids
(b) Specific surface area
(c) Spacing factor
Figure 9. Comparisons of air void parameters obtained from flatbed scanner and RapidAir
tests
0
5
10
15
20
25
30
35
Portland cement Portland cement -15% Fly ash
Portland cement -15% Slag
Portland cement -15% Limestone P.
Air
Vo
ids,
%
Pervious Concrete Mixes
Flatbed Scanner
RapidAir
(a) Air voids
0
2
4
6
8
10
Portland cement Portland cement -15% Fly ash
Portland cement -15% Slag
Portland cement -15% Limestone P.
Spe
cifi
c Su
rfac
e (
mm
2)
Pervious Concrete Mixes
Flatbed Scanner
RapidAir
0.00
0.04
0.08
0.12
0.16
0.20
Portland cement Portland cement -15% Fly ash
Portland cement -15% Slag
Portland cement -15% Limestone P.
Spac
ing
Fact
or
(mm
)
Pervious Concrete Mixes
Flatbed Scanner RapidAir

35
As seen in Figure 9a, the air void ratios of the four pervious concrete mixes measured by the
flatbed scanner method are all higher than those measured by the Rapid Air method, but the
specific surface values measured by the flatbed scanner method are all lower than those
measured by the Rapid Air method (Figure 9b). This suggests that the flatbed scanner had
captured some large voids that were not captured by the RapidAir test method. The microscope
camera of the RapidAir method generally was unable to capture voids larger than 3 mm but was
able to capture smaller voids than the flatbed scanner test due to the good resolution of the
microscope camera, resulting in a higher specific surface area than that measured by the flatbed
scanner test method.
Note that the mixes made with 15% fly ash and 15% limestone powder replacement for cement
have lower void contents than the mix made with pure cement. This is to be expected due to the
higher paste content and better workability of the fly ash and limestone powder mixes. However,
it is not clear why the mix made with 15% slag replacement has the lowest void ratio, as
indicated by both the flatbed scanner and RapidAir test methods, because its unit weight and
strength were also slightly lower than those of the other mixes. Further study is needed.
The spacing factor indicates the distance from an air void to the nearest neighboring air void.
Figure 9c shows that the spacing factor values of the four mixes studied ranged from 0.12 to
0.137 mm, which are all acceptable in pervious concrete practice. However, there is no clear
trend in the spacing factors measured by the flatbed scanner and RapidAir test methods. This is
possibly related to the different ranges of the air void sizes measured by these two different
methods. In addition, the RapidAir scanning test method had far fewer traverses for each tested
sample than the flatbed scanner test method.
To further elucidate the pore structure of the pervious concrete mixes, Figure 10 provides the
size distribution of the voids measured using the flatbed scanner and the RapidAir methods,
respectively.
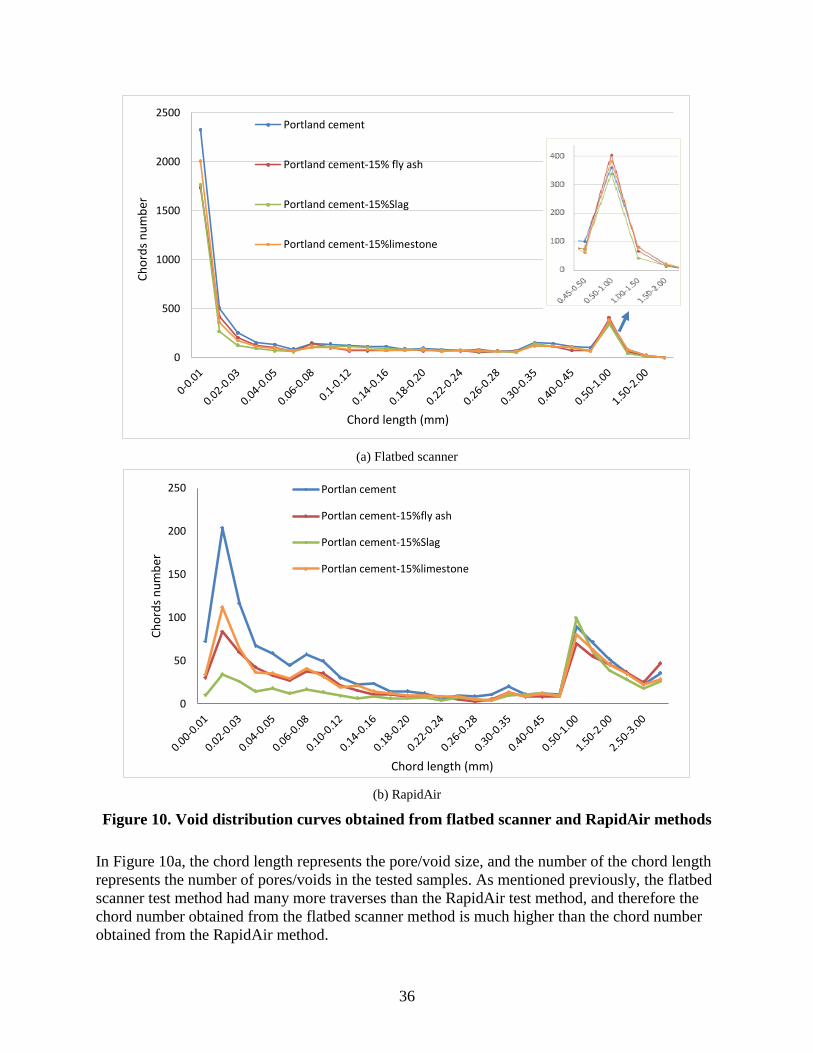
36
(a) Flatbed scanner
(b) RapidAir
Figure 10. Void distribution curves obtained from flatbed scanner and RapidAir methods
In Figure 10a, the chord length represents the pore/void size, and the number of the chord length
represents the number of pores/voids in the tested samples. As mentioned previously, the flatbed
scanner test method had many more traverses than the RapidAir test method, and therefore the
chord number obtained from the flatbed scanner method is much higher than the chord number
obtained from the RapidAir method.
0
500
1000
1500
2000
2500
Ch
ord
s n
um
ber
Chord length (mm)
Portland cement
Portland cement-15% fly ash
Portland cement-15%Slag
Portland cement-15%limestone
0
50
100
150
200
250
Ch
ord
s n
um
ber
Chord length (mm)
Portlan cement
Portlan cement-15%fly ash
Portlan cement-15%Slag
Portlan cement-15%limestone

37
As seen in Figure 10, both the flatbed scanner and RapidAir test results show that there were two
major groups of air voids in the pervious concrete: one group had sizes in the range of 0.01 mm
to 0.03 mm, and the other had sizes in the range of 0.5 mm to 3.0 mm. The group with the small-
sized air voids represents the voids in the cement paste/mortar, which might control the pollution
removal mechanism, while the group with large-sized air voids represents the voids among the
aggregate particles, which might contribute significantly to the water permeability of the
concrete. (Note that although the flatbed scanner method captured air voids larger than 3 mm,
there was difficulty in identifying the number of voids with sizes larger than 3 mm. A reason was
that when the computer characterized the chords separated by grayness on a traverse, only the
continuous pixels with the same grayness (white or black) were counted as one chord. If any
dark pixels existed, even a small gray spot in the white paste that was used to fill the voids for
image analysis, these darker pixels were identified as the end of the white chord. Thus, actually
large voids were read as small voids and false results were provided. This testing error did not
have significant effects on the total air porosity but significantly affected the size distributions of
the air voids. Therefore, the number of air voids with sizes less than 3 mm is not reported in
Figure 10a.)
Figure 10 also illustrates that both the flatbed scanner and RapidAir test results show that
replacing cement with 15% fly ash, slag, or limestone powder decreased the amount of the more
numerous group of voids (those from 0.01 mm to 0.03 mm) in the cement paste/mortar. The
quantitative difference may be caused by the number of traverses characterized by these two
methods. In addition, the quality of the image scanned by the flatbed scanner was greatly related
to the resolution of the scanner, and some small air voids might not have been identified due to
the limited resolution of the scanner. On the other hand, the RapidAir method read the sample
features with a microscope camera, and some errors might have been introduced by the scale of
the camera lens. For materials having large voids, such as pervious concrete, the flatbed scanner
test method is preferred because the RapidAir test method does not capture voids larger than 3
mm.
Many researchers have studied the effects of voids on the strength and permeability of pervious
concrete (Lian et al. 2011, Alaica et al. 2010). Although limited tests were performed in the
present study, similar effects were found, as illustrated in Figure 11.
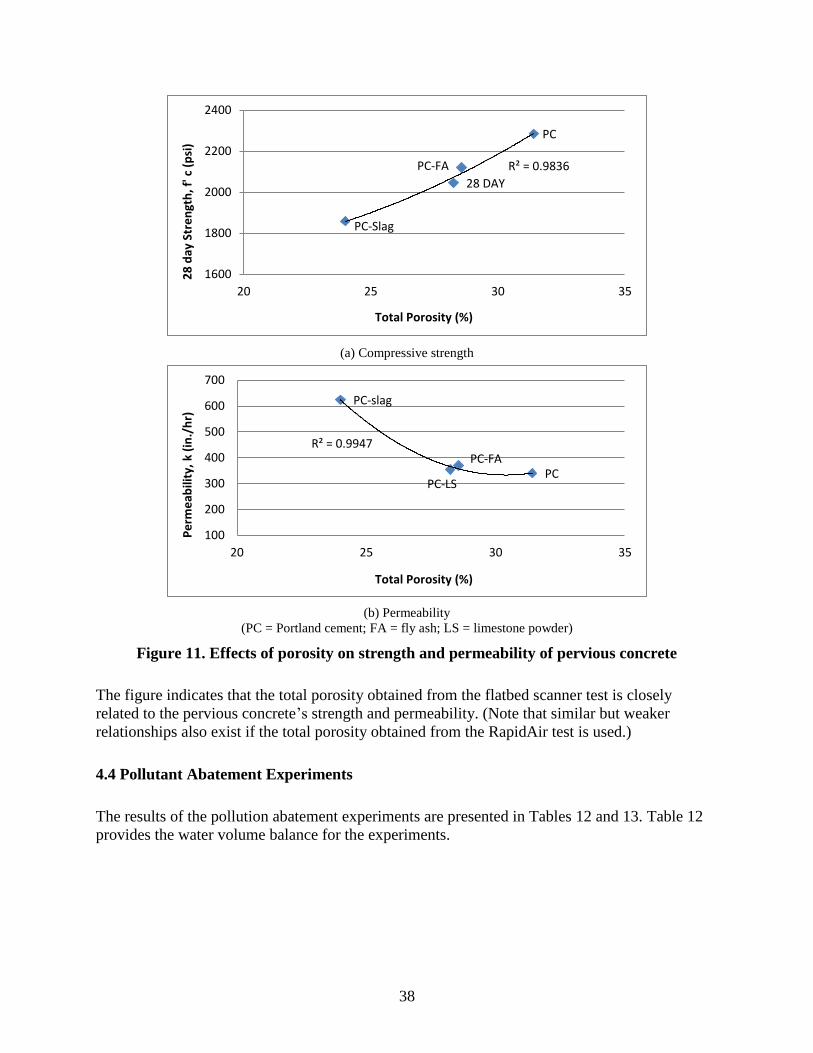
38
(a) Compressive strength
(b) Permeability
(PC = Portland cement; FA = fly ash; LS = limestone powder)
Figure 11. Effects of porosity on strength and permeability of pervious concrete
The figure indicates that the total porosity obtained from the flatbed scanner test is closely
related to the pervious concrete’s strength and permeability. (Note that similar but weaker
relationships also exist if the total porosity obtained from the RapidAir test is used.)
4.4 Pollutant Abatement Experiments
The results of the pollution abatement experiments are presented in Tables 12 and 13. Table 12
provides the water volume balance for the experiments.
PC
PC-FA
PC-Slag
28 DAY
R² = 0.9836
1600
1800
2000
2200
2400
20 25 30 35
28
day
Str
en
gth
, f' c
(p
si)
Total Porosity (%)
PC PC-FA
PC-slag
PC-LS
R² = 0.9947
100
200
300
400
500
600
700
20 25 30 35
Pe
rme
abili
ty,
k (i
n./
hr)
Total Porosity (%)

39
Table 12. Water volume balance
Volume
Control
(distilled water only)
Polluted water
(naphthalene = 30 mg/L)
Volume
Added
(L)
Volume
collected
over 6
hours
(L)
Volume
collected
from 6 to
18 hours
(L)
Volume
added
(L)
Volume
collected
over 6
hours
(L)
Volume
collected
from 6 to
18 hours
(L)
Portland cement 3.60 3.20 0.352 3.60 3.48 0.063
Portland cement
- 15% Fly Ash 3.60 3.30 0.250 3.60 3.49 0.051
Portland cement
- 15% Slag 3.60 3.30 0.252 3.60 3.50 0.051
Portland cement
- 15% Limestone
powder
3.60 3.56 0.035 3.60 3.52 0.015
Water was collected over a 6 hour period, and any water remaining 12 hours later was also
collected. For all mixes, the total volumes of water collected for the control experiment and the
polluted water experiment were similar to the volumes added to the column. This shows that
only a small volume of water was retained in the column.
Table 13 shows the naphthalene concentrations in the water samples.
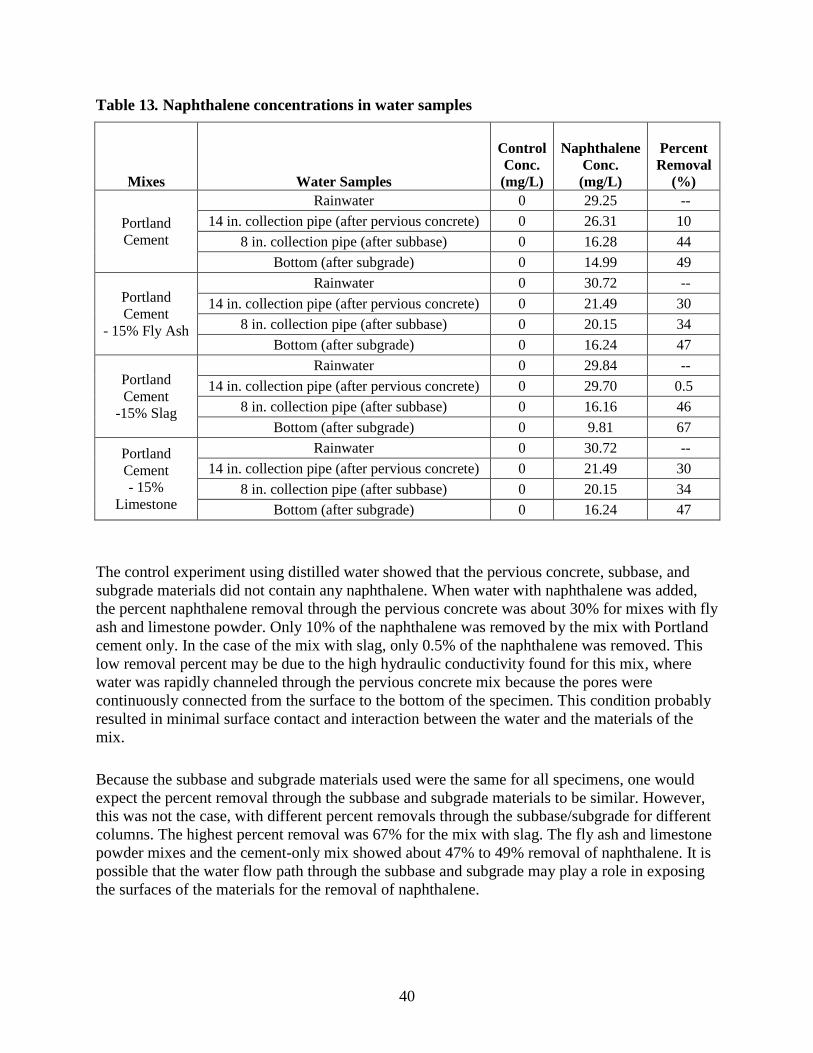
40
Table 13. Naphthalene concentrations in water samples
Mixes Water Samples
Control
Conc.
(mg/L)
Naphthalene
Conc.
(mg/L)
Percent
Removal
(%)
Portland
Cement
Rainwater 0 29.25 --
14 in. collection pipe (after pervious concrete) 0 26.31 10
8 in. collection pipe (after subbase) 0 16.28 44
Bottom (after subgrade) 0 14.99 49
Portland
Cement
- 15% Fly Ash
Rainwater 0 30.72 --
14 in. collection pipe (after pervious concrete) 0 21.49 30
8 in. collection pipe (after subbase) 0 20.15 34
Bottom (after subgrade) 0 16.24 47
Portland
Cement
-15% Slag
Rainwater 0 29.84 --
14 in. collection pipe (after pervious concrete) 0 29.70 0.5
8 in. collection pipe (after subbase) 0 16.16 46
Bottom (after subgrade) 0 9.81 67
Portland
Cement
- 15%
Limestone
Rainwater 0 30.72 --
14 in. collection pipe (after pervious concrete) 0 21.49 30
8 in. collection pipe (after subbase) 0 20.15 34
Bottom (after subgrade) 0 16.24 47
The control experiment using distilled water showed that the pervious concrete, subbase, and
subgrade materials did not contain any naphthalene. When water with naphthalene was added,
the percent naphthalene removal through the pervious concrete was about 30% for mixes with fly
ash and limestone powder. Only 10% of the naphthalene was removed by the mix with Portland
cement only. In the case of the mix with slag, only 0.5% of the naphthalene was removed. This
low removal percent may be due to the high hydraulic conductivity found for this mix, where
water was rapidly channeled through the pervious concrete mix because the pores were
continuously connected from the surface to the bottom of the specimen. This condition probably
resulted in minimal surface contact and interaction between the water and the materials of the
mix.
Because the subbase and subgrade materials used were the same for all specimens, one would
expect the percent removal through the subbase and subgrade materials to be similar. However,
this was not the case, with different percent removals through the subbase/subgrade for different
columns. The highest percent removal was 67% for the mix with slag. The fly ash and limestone
powder mixes and the cement-only mix showed about 47% to 49% removal of naphthalene. It is
possible that the water flow path through the subbase and subgrade may play a role in exposing
the surfaces of the materials for the removal of naphthalene.
41
5 CONCLUSION
In this study, four pervious concrete mixes made with pure Portland cement and with 15%
cementitious materials (slag, limestone powder or fly ash) as a Portland cement replacement
were investigated. Their physical properties, such as workability, unit weight, compressive
strength, water permeability, and air void structures, were characterized. Four laboratory-scale
column experiments were conducted to assess the pollutant attenuation properties of the pervious
concrete mixes. The following conclusions can be drawn:
1. All four pervious concrete mixtures studied had acceptable workability (i.e., formed a ball
shape by hand). The workability of the mixtures made with pure Portland cement and 15%
fly ash replacement appeared to have better workability than those mixtures made with 15%
slag and 15% limestone powder replacement.
2. The unit weight of the fresh pervious concrete mixtures ranged from 115.9 lb/yd3 to 119.6
lb/yd3, with the mixture with 15% slag being the lowest (115.9 lb/yd
3), followed by the pure
cement mixture (117.0 lb/yd3), then the mixture with 15% limestone powder (119.4 lb/yd
3),
and finally the mixture with 15% fly ash (119.6 lb/yd3).
3. The 28 day compressive strength of the pervious concrete mixes ranged from 1858 psi (mix
with 15% slag) to 2285 psi (pure cement mix). The compressive strength generally increased
with unit weight and decreased with total porosity (air void ratio).
4. The water permeability of the pervious concrete mixes ranged from 340 in./hr (pure cement
mix) to 642 in./hr (mix with 15% slag). The permeability generally decreased with unit
weight and increased with total porosity (air void ratio).
5. The total porosity (or air void ratio) of the pervious concrete mixes ranged from 24.00% (mix
with 15% slag) to 31.41% (pure cement mix) as measured by the flatbed scanner test method.
The total porosity ranged from 18.93% (mix with 15% slag) to 24.15% (pure cement mix)
using the RapidAir method. It was not clear why the concrete porosities were not correlated
to their unit weights. Further study is needed.
6. The total porosities of the four pervious concrete mixes measured by the flatbed scanner
method were all higher than those measured by the RapidAir method, but the specific surface
areas measured by the flatbed scanner method were all lower than those measured by the
RapidAir method. The flatbed scanner might have captured some large voids that were not
captured by the RapidAir test method. Using a microscope camera, the RapidAir device is
generally unable to capture voids larger than 3 mm. However, due to the good imaging
resolution of the microscope camera, the RapidAir test method might have captured a larger
quantity of small voids. In its ability to capture large voids, the flatbed scanner test method
has a clear advantage over the RapidAir test method for pervious concrete. However, the
flatbed scanner may also capture the background aggregate particles in some large voids and

42
make false identifications regarding the size of these voids. Further study is needed to further
improve this test method.
7. The pollutant abatement experiments showed that the mixes with fly ash and limestone
powder removed about 30% of the influent naphthalene concentration. The mix with pure
cement removed 10% of the influent naphthalene concentration, while the mix with slag
removed only 0.5% of the influent naphthalene concentration. The water volume balance
showed that less than 1% of the water added was retained in the experimental column setup.

43
REFERENCES
American Concrete Institute (ACI). 2006. Report on Pervious Concrete. ACI 522R. American
Concrete Institute, Farmington Hills, MI.
Alaica, A. L., Dolatabadi, M. H. Sucic, A., and Shehata, M. 2010. Optimizing the strength and
permeability of pervious concrete. Presented at TAC/ATC 2010 - 2010 Annual
Conference and Exhibition of the Transportation Association of Canada: Adjusting to
New Realities, September 26–29. Transportation Association of Canada (TAC), Halifax,
Canada.
ASTM C39. 2003. Standard Test Method for Compressive Strength of Cylinder Concrete
Specimens. ASTM International, West Conshohocken, PA.
ASTM C1688. 2008. Standard Test Method for Density and Void Content of Freshly Pervious
Concrete. ASTM International, West Conshohocken, PA.
ASTM C1157. 2011. Standard Performance Specification for Hydraulic Cement. ASTM
International, West Conshohocken, PA.
ASTM C457. 2012. Standard Test Method for Microscopical Determination of Parameters of
the Air-Void System in Hardened Concrete. ASTM International, West Conshohocken,
PA.
ASTM C1754. 2012. Standard Test Method for Density and Void Content of Hardened Pervious
Concrete. ASTM International, West Conshohocken, PA.
ASTM C989. 2014. Standard Specification for Slag Cement for Use in Concrete and Mortars.
ASTM International, West Conshohocken, PA.
ASTM C595. 2015, Standard Specification for Blended Hydraulic Cements. Annual Book of
ASTM Standards. ASTM International, West Conshohocken, PA.
ASTM C617. 2015. Standard Practice for Capping Cylindrical Concrete Specimens. Annual
Book of ASTM Standards. ASTM International, West Conshohocken, PA.
ASTM C618. 2015. Standard Specification for Coal Fly Ash and Raw or Calcined Nature
Pozzolan for Use in Concrete. ASTM International, West Conshohocken, PA.
ASTM C1240. 2015. Standard Specification for Silica Fume Used in Cementitious Mixtures.
ASTM International, West Conshohocken, PA.
Balades, J. D., Legret, M., and Madiec, H. 1995. Permeable pavements pollution management
tools. Water Science and Technology. 32(1): 49-56.
Bean, Z. E., Hunt, W. F., and Bidelspach, D. A. 2007. Evaluation of four permeable pavement
sites in eastern North Carolina for runoff reduction and water quality impacts. Journal of
Irrigation and Drainage Engineering. 133(6): 583-592.
Beeldens, A. 2001. Behavior of porous PCC under freeze-thaw cycling. Presented at the Tenth
International Congress on Polymers in Concrete, May 21–25, Honolulu, HI.
Beeralingegowda, B., and Gundakalle, V. D. 2013. The Effect of addition of limestone powder
on the properties of self-compacting concrete. International Journal of Innovative
Research in Science, Engineering and Technology. 2(9):4996
Brattebo, B. O., and Booth, D. B. 2003. Long-term stormwater quantity and quality performance
of permeable pavement systems. Water Research. 37(18): 4369-4376.
Chen, Q. Y., Tyrer, M., Hills, C. D. Yang, X. M., and Carey, P. 2009. Immobilization of heavy
metal in cement-based solidification/stabilization: A review. Waste Management. 29(1):
390-403.
44
Carlson, J., Sutter, L., Van Dam, T., and Peterson, K. 2006. Comparison of a flat-bed scanner
and the RapidAir 457 system for determining air-void system parameters of hardened
concrete. Transportation Research Record: Journal of the Transportation Research
Board. No. 1979:54-59.
Davis, A. P., Sholouhian, M., Sharma, H., and Minami, C. 2001. Laboratory study of biological
retention for urban stormwater management. Water Environmental Research. 73(1): 5-14.
Delatte, N., Mrkajic, A., and Miller, D. I. 2009. Field and laboratory evaluation of pervious
concrete pavements. Transportation Research Record: Journal of the Transportation
Research Board. No. 2113:132-139.
Dierkes, C., Kuhlmann, L., Kandasamy, J., and Angelis, G. 2002. Pollution retention capability
and maintenance of permeable pavements. Presented at the EWRI/ASCE 9th
International Conference on Urban Drainage, Portland, OR.
Drake, J. A. P., Bradford, and A., Marsalek, J. 2013. Review of environmental performance of
permeable pavement systems: state of the knowledge. Water Quality Research Journal of
Canada. 48(3): 203-222.
Drake, J., Bradford, A., and Seters, T. V. 2014. Stormwater quality of spring-summer-fall
effluent from three partial-infiltration permeable pavement systems and conventional
asphalt pavement. Journal of Environmental Management. 139: 69-79.
Ellis, J. B., Revitt, D. J., Harrop, D. O., and Beckwith, P. R. 1987. The contribution of highway
surfaces to urban stormwater sediments and metal loadings. Science of the Total
Environment. 59: 339-349.
Ferguson, B. K. 2005. Porous Pavements. CRC Press, Boca Raton, FL.
Giergiczny, Z., and Krol, A. 2008. Immobilization of heavy metals (Pb, Cu, Cr, Zn, Cd, Mn) in
the mineral additions containing concrete composites. Journal of Hazardous Material.
160(2-3): 247-255.
Glasser, F. P. 1997. Fundamental aspect of cement solidification and stabilization. Journal of
Hazardous Material. 52(2-3): 151–170.
Gougar, M. L., Scheetz, B. E., and Roy, M. D. 1996. Ettringite and C-S-H Portland cement
phases for waste ion immobilization: a review. Waste Management. 16(4) 295-303.
Harada, S., and Komuro, Y. 2010. Decrease of non-point zinc runoff using porous concrete.
Chemosphere 78(4): 488–491.
Haselbach, T., and Roberts, F. 2006. Vertical porosity distributions in pervious concrete
pavement. ACI Materials Journal. 103(6): 452–458.
Huang, B., Cao, J., Chen, X., and Shu, X. 2006. Laboratory and analytical study of permeability
and strength properties of pervious concrete. Presented at the National Ready Mix
Concrete Association Concrete Technology Forum: Focus on Pervious Concrete, May
24–25, Nashville, TN.
Iowa Department of Transportation (DOT). 2009. Chapter 2C-1, General Information for
Stormwater Hydrology. Iowa Stormwater Management Manual. Version 3. Iowa
Department of Transportation, Ames, IA.
Jakobsen, U. H., Pade, C., Thaulow, N., Brown, D., Sahu, S., Magnusson, O., De Buck, S., and
De Schutter, G. 2006. Automated air void analysis of hardened concrete – a round robin
study. Cement and Concrete Research. 36(8): 1444–1452.
James, W., and Shahin R. 1998. A laboratory examination of pollutants leached from four
different pavements by acid rain. Journal of Water Management Modeling. 6(17): 321-
349.

45
Joung, Y. M. 2008. Evaluation and optimization of pervious concrete with respect to
permeability and clogging. Master’s thesis, Texas A&M University, College Station, TX.
Kevern, J. T. 2006. Mix design development for Portland cement pervious concrete in cold
weather climates. Master’s thesis, Iowa State University, Ames, IA.
Kevern, J. T., Schaefer, V. R., Wang, K., and Suleiman, M. T. 2008. Pervious concrete mixture
proportion for improved freeze-thaw durability. Journal of ASTM international. 5(2): 1-
12.
Kevern, J., Schaefer, V. R., and Wang, K. 2009. The effect of curing regime on pervious
concrete abrasion resistance. Journal of Testing and Evaluation. 37(4): 1-6.
Latimer J. S., Hoffman, E. J., Hoffman, G., Fashching, J. L., and Quinn, J. G. 1990. Sources of
petroleum hydrocarbons in urban runoff. Water, Air, and Soil Pollution. 52(1): 1-21.
Lee, M., Huang, Y., Chang, T., and Pao, C. 2011. Experimental study of pervious concrete
pavement. Emerging Technologies for Material, Design, Rehabilitation, and Inspection
of Roadway Pavements. ASCE, Reston, VA. pp. 93-99.
Legret, M., Colandini, V., and Le Marc, C. 1996. Effects of a porous pavement with reservoir
structure on the quality of runoff water and soil. Science of the Total Environment.
189/190: 335-340.
Legret, M., and Colandini, V. 1999. Effects of a porous pavement with reservoir structure on
runoff water: Water quality and fate of heavy metals. Water Science and Technology.
39(2): 111-117.
Lian, C., and Zhuge, Y. 2010. Optimum mix design of enhanced permeable concrete – An
experimental investigation. Construction and Building Materials. 24(12): 2664-2671.
Lian, C., Zhuge , Y. and Beecham, S. 2011. The relationship between porosity and strength for
porous concrete. Construction and Building Materials. 25:4294–4298.
Low, K., Haz, D., and Neithalath, N. 2008. Statistical Characterization of the Pore Structure of
Enhanced Porosity Concretes. Presented at the National Ready Mixed Concrete
Association Concrete Technology Forum, Silver Spring, MD.
Luck, J. D., Workman, S. R., Higgins, S. F., and Coyne, M. 2006. Hydraulic properties of
pervious concrete. Transactions of the ASABE. 49(6): 1807−1813.
Magnuson, M. L., Kelty, C. A., and Kelty, K. C. 2001. Trace metal loading on water-borne soil
and dust particles characterized through the use of split-flow thin cell fractionation.
Analytical Chemistry. 73(14): 3492-3496.
Malhotra, V. M. 2002. High-Performance, High-volume fly ash concrete. Concrete
International. 24(7): 30- 34.
Maso, J. C. 1996. Interfacial Transition Zone in Concrete. CRC Press, Boca Raton, FL.
Mississippi Concrete Industries Association (MCIA). 2002. Pervious Concrete: The Pavement
That Drinks. Mississippi Concrete Industries Association.
www.mississippiconcrete.com/downloads/pervious.pdf. Accessed Feb. 10, 2015.
Montes, F., Valavala, S., and Haselbach, L. M. 2005. A new test method for porosity
measurements of Portland cement pervious concrete. Journal of ASTM International.
2(1):1-13.
Montes, F., and Haselbach, L. 2006. Measuring hydraulic conductivity in pervious concrete.
Environmental Engineering Science. 23(6): 960-969.
Murakami, M., Nakajima, F., and Furumai, H. 2008. The sorption of heavy metal species by
sediments in soakaways receiving urban road runoff. Chemosphere. 70 (11): 2099-2109.
46
Murakami, M., Fujita, M., Furumai, H., Kasuga, I., and Kurisu, K. F. 2009. Sorption behavior of
heavy metal species by soakaway sediment receiving urban road runoff from residential
and heavily trafficked areas. Journal of Hazardous Materials. 164(2-3): 707-712.
Neithalath, N., Sumanasooriya, M. S., and Deo, M. 2010. Characterizing pore volume, sizes, and
connectivity in pervious concretes for permeability prediction. Materials
Characterization. 61(8): 802-813.
Pagotto, C., Legret, M., and Cloirec, P. L. 2000. Comparison of the hydraulic behavior and the
quality of highway runoff water according to the type of pavement. Water Research.
34(18): 4446-4454.
Peterson, K. W., Sutter, L. L., and Radlinski, M. 2009. The practical application of a flatbed
scanner for air-void characterization of hardened concrete. Journal of ASTM
International. 6(9): 1-15.
Pitt, R. E., Clark, S., Parmer, K., and Field, R. 1996. Groundwater Contamination from
Stormwater. Ann Arbor Press, Chelsea, MI.
Pratt, C. J., Mantle, D. G., and Schofield, P. A. 1995. UK research into the performance of
permeable pavement, reservoir structures in controlling stormwater discharge quantity
and quality. Water Science and Technology. 32(1): 63–69.
Pratt, C. J., Newman, A. P., and Bond, P. C. 1999. Mineral Oil Bio-Degradation within a
Permeable Pavement though the Use of Permeable Pavements. Water Science and
Technology. 39(2): 103-109.
Rossen, R. M., Ballestero, T. P., Hooule, J. J., Brigga, J. F., and Houle, K. M. 2012. Water
quality and hydrologic performance of a porous asphalt pavement as a stormwater
treatment strategy in a cold climate. Journal of Environmental Engineering. 138(1): 81-
89.
Rushton, B. T. 2001. Low-impact parking lot design reduces runoff and pollutant loads. Journal
of Water Resources Planning and Management. 127(3): 172–179.
Sansalone, J., and Buchberger, B.S. 1997. Characterization of solid metal element distributions
in urban highway stormwater. Water Science and Technology. 36 (8-9): 155-160.
Schaefer, V. R., Wang, K., Suileiman, M. T., and Kevern, J. T. 2006. Mix Design Development
for Pervious Concrete in Cold Weather Climates. National Concrete Pavement
Technology Center, Iowa State University, Ames, IA.
Scholz, M., and Grabowiecki, P. 2007. Review of permeable pavement systems. Building and
Environment. 42(11): 3830-3836.
Sumanasooriya, M. S., and Neithalath, N. 2011. Pore structure features of pervious concretes
proportioned for desired porosities and their performance prediction. Cement & Concrete
Composites. 33(8): 778-787.
Tan, S., Fwa, T., and Han, C. 2003. Clogging evaluation of permeable bases. Journal of
Transportation Engineering. 129(3): 309-315.
Teng, Z., and Sansalone, J. J. 2004. In situ partial exfiltration of rainfall runoff. II: Particle
separation. Journal of Environmental Engineering. 130(9): 1008-1020.
Tennis, P. D., Leming, M. L., and Akers, D. J. 2004. Pervious Concrete Pavements. Portland
Cement Association, Skokie, Illinois.
Tong, B. 2011. Clogging effects of Portland cement pervious concrete. PhD dissertation, Iowa
State University, Ames, IA.
47
US Environmental Protection Agency (EPA). 1996. Indicators of the Environmental Impacts of
Transportation. EPA 230-R-96-009. US Environmental Protection Agency, Washington,
DC.
US Environmental Protection Agency (EPA). 1999a. Methods for organic chemical analysis of
municipal and industrial wastewater. Method 610 – Polynuclear aromatic hydrocarbons,
US Code Fed. Regulations, Title 40, Part 136, App. A, pp. 145–157
US Environmental Protection Agency (EPA). 1999b. Preliminary Data Summary of Urban
Storm Water Best Management Practices. EPA-821-R-99-012. US Environmental
Protection Agency, Washington, DC.
US Environmental Protection Agency (EPA). 2014. Green Infrastructure. National Risk
Management Research Laboratory, US Environmental Protection Agency.
water.epa.gov/infrastructure/greeninfrastructure/. Last accessed March 22, 2016.
Wang, K., Schaefer, V. R., Kevern, J. T., and Suleiman, M. T. 2006. Development of Mix
Proportion for Functional and Durable Pervious Concrete. Presented at the NRMCA
Concrete Technology Forum: Focus on Pervious Concrete, Nashville, TN.
Zhao, Y., and Zhao, C. 2014. Lead and zinc removal with storage period in porous asphalt
pavement. Water SA. 40(1): 65-72.
Zouaghi, A., Kumagai, M., and Nakazawa, T. 2000. Fundamental study on some properties of
pervious concrete and its applicability to control stormwater run-off. Transactions of the
Japan Concrete Institute. 22:43-50.