Embed Size (px)
Citation preview

PET OWNERSHIP IN AUSTRALIA
2013

NOTE: DISCLAIMERThe Animal Health Alliance (Australia) Ltd, Cox Inall Communications Pty Ltd and their representatives have prepared this publication on the basis of information available to them. In doing so, The Animal Health Alliance (Australia) Ltd, Cox Inall Communications Pty Ltd and their representatives accept no legal responsibility for this publication’s contents. To the fullest extent allowed by law, Animal Health Alliance (Australia) Ltd, Cox Inall Communications Pty Ltd and their representatives exclude all liability in respect of the information and opinions expressed in this publication.
COPYRIGHT © All copyright subsisting in the contents of this publication is owned by The Animal Health Alliance (Australia) Ltd and may not be reproduced without the prior consent of The Animal Health Alliance (Australia) Ltd. Where permission is granted, it will be subject to the requirement that The Animal Health Alliance (Australia) Ltd is acknowledged on any reproduced or quoted material, whether in whole or in part. All rights reserved.
ISBN: 978-0-9923114-0-7Animal Health Alliance (Australia) Ltd www.animalhealthalliance.org.au Level 2 AMP Building, 1 Hobart Place, Canberra ACT 2601 Email: [email protected] +61 (2) 6257 9022
Cox Inall Communications Pty Ltd www.coxinall.com.au Level 1, 44 Mountain Street, Ultimo NSW 2007 Email: [email protected] +61 (2) 8204 3850

Contents1 INTRODUCTION .......................................................................................................................................................6
1.1 Report context ..........................................................................................................................................7
1.2 Information sources ................................................................................................................................7
1.3 Historical pet population data ............................................................................................................ 8
1.4 Data reporting .......................................................................................................................................... 9
2 EXECUTIVE SUMMARY ......................................................................................................................................10
2.1 Pet population ..........................................................................................................................................11
2.2 Trends ..........................................................................................................................................................11
2.3 Market value .............................................................................................................................................12
2.3.1 Pet food ........................................................................................................................................ 13
2.3.2 Pet products and accessories ............................................................................................... 14
2.3.3 Pet care services ........................................................................................................................ 14
3 PET OWNERSHIP ..................................................................................................................................................16
3.1 Companion animal population .......................................................................................................... 17
3.1.1 Summary ...................................................................................................................................... 17
3.1.2 Households .................................................................................................................................. 18
3.1.3 States ............................................................................................................................................. 18
3.1.4 Dogs ..............................................................................................................................................20
3.1.5 Cats ...............................................................................................................................................20
3.1.6 Other pets .................................................................................................................................... 21
3.1.7 International comparison ........................................................................................................ 21
Trends in New Zealand ............................................................................................................ 22
Trends in the United States ................................................................................................... 23
Trends in the United Kingdom .............................................................................................. 24
Trends in Europe ....................................................................................................................... 25
3.2 Pet ownership insights ........................................................................................................................26
3.2.1 Summary ..................................................................................................................................... 26
3.2.2 Reasons for pet ownership.................................................................................................... 26
3.2.3 Role of companion animals ....................................................................................................27
3.2.4 Valuable sources of information .......................................................................................... 29
3.2.5 Barriers to pet ownership ......................................................................................................30
3.2.6 Desire to own a pet ................................................................................................................... 31
3.2.7 Planning to get a pet ................................................................................................................ 31
3.3 Pet ownership trends...........................................................................................................................33
3.3.1 De-sexing .................................................................................................................................... 33
3.3.2 Adoption ......................................................................................................................................34
3.3.3 Micro-chipping ...........................................................................................................................34
3.3.4 Pet insurance .............................................................................................................................34
3.3.5 Indoors versus outdoors ........................................................................................................ 35
3.3.6 Holidays and outings ............................................................................................................... 35
3.3.7 Alternative healthcare treatments ..................................................................................... 35
PET OWNERSHIP IN AUSTRALIA 2013 3

3.3.8 Online ............................................................................................................................................ 36
3.3.9 Social media and online communities ............................................................................... 36
4 MARKET VALUE SUMMARY ............................................................................................................................ 38
4.1 Summary...................................................................................................................................................39 4.2 Summary by pet type ..........................................................................................................................42 4.2.1 Dogs ..............................................................................................................................................42
4.2.2 Cats ...............................................................................................................................................44
4.2.3 Other pets ...................................................................................................................................46
5 PET PURCHASES ..................................................................................................................................................50
6 PET FOOD ............................................................................................................................................................... 52
6.1 Summary...................................................................................................................................................53 6.2 Trends ........................................................................................................................................................53 6.2.1 Premiumisation .........................................................................................................................54
6.2.2 Packaging ....................................................................................................................................54
6.2.3 Health and wellness .................................................................................................................54
6.2.4 Segmentation ............................................................................................................................54
6.2.5 Private label ................................................................................................................................54
6.3 Dog food ....................................................................................................................................................55 6.3.1 Summary ..................................................................................................................................... 55
6.3.2 Channels ...................................................................................................................................... 55
6.3.3 Category and price point breakdown ................................................................................. 55
6.3.4 Dog food brands ........................................................................................................................57
6.3.5 Private label .................................................................................................................................57
6.3.6 Prepared versus non-prepared dog food ..........................................................................57
6.4 Cat food .....................................................................................................................................................58 6.4.1 Summary ..................................................................................................................................... 58
6.4.2 Channels ...................................................................................................................................... 58
6.4.3 Category and price point breakdown ................................................................................. 58
6.4.4 Cat food brands .........................................................................................................................60
6.4.5 Private label ................................................................................................................................60
6.4.6 Prepared versus non-prepared ............................................................................................60
6.5 Other pet food ........................................................................................................................................60 6.5.1 Summary .....................................................................................................................................60
6.5.2 Channels .......................................................................................................................................61
6.5.3 Products and brands ................................................................................................................61
7 PET CARE PRODUCTS ........................................................................................................................................62
7.1 Summary...................................................................................................................................................63 7.2 Pet healthcare products .....................................................................................................................64 7.2.1 Trends ...........................................................................................................................................64
Dietary supplements ...............................................................................................................64
Increased longevity ..................................................................................................................64
Pet obesity ..................................................................................................................................64
7.2.2 Healthcare product and veterinary medicine manufacturing ...................................64
PET OWNERSHIP IN AUSTRALIA 20134
7.2.3 Expenditure ................................................................................................................................ 67
7.3 Pet products and accessories ..........................................................................................................68
7.4 Cat litter ....................................................................................................................................................69
8 PET CARE SERVICES .......................................................................................................................................... 70 8.1 Summary....................................................................................................................................................71
8.2 Service providers ................................................................................................................................... 72
8.3 Veterinary services ............................................................................................................................... 72
8.3.1 Trends ............................................................................................................................................72
8.3.2 Visitations ................................................................................................................................... 73
8.3.3 Treatments .................................................................................................................................. 73
8.3.4 Expenditure .................................................................................................................................74
8.4 Other pet care services ....................................................................................................................... 74
8.4.1 Dogs ...............................................................................................................................................74
Clipping and grooming .............................................................................................................75
Pet insurance ..............................................................................................................................75
Boarding and minding ..............................................................................................................75
Training and behaviour ............................................................................................................76
Competitions and membership .............................................................................................76
Walking ..........................................................................................................................................77
Transport ......................................................................................................................................77
8.4.2 Cats ............................................................................................................................................... 78
Boarding and minding ............................................................................................................. 78
Pet insurance ............................................................................................................................. 78
Clipping and grooming ............................................................................................................ 79
Competitions and memberships .......................................................................................... 79
Training behaviour and therapy ........................................................................................... 79
Transport ..................................................................................................................................... 79
9 THE HUMAN-COMPANION ANIMAL BOND ................................................................................................80 9.1 History ........................................................................................................................................................81
9.2 Trusted companions ..............................................................................................................................81
9.3 Pets as social enablers .........................................................................................................................81
9.4 General health benefits.......................................................................................................................82
9.5 Mental health ..........................................................................................................................................82
9.6 Pets and families ...................................................................................................................................82
9.7 Pets in education ...................................................................................................................................83
9.8 Pets and the elderly .............................................................................................................................83
9.9 Therapy and pets ...................................................................................................................................83
9.10 Service animals ......................................................................................................................................83
10 EXPLANATORY NOTES ......................................................................................................................................84
11 REFERENCES AND SOURCES .......................................................................................................................... 88
PET OWNERSHIP IN AUSTRALIA 2013 5

1 INTRODUCTION
PET OWNERSHIP IN AUSTRALIA 20136

1.1 Report context The range of benefits that pets provide their owners is well established. Beyond companionship, enabling social interaction and general health benefits, research into the human-animal bond provides greater insight into the value of companion animals to those in socially isolating environments, suffering poor mental or physical health and as part of specialised educational or therapy programs for any age group.
Pets have become an important part of the everyday lives of the majority of Australians, with many considering them to be members of the family. Pet owners value the animals they choose to share their lives with and prioritise their health and wellbeing. As such, Australia’s pet care industry has grown and evolved to offer a wide range of products and services.
Enabling the pet care industry to flourish has been Australia’s consistently strong economic performance. Australia has experienced more than 20 years of continued economic growth, averaging 3.5% a year. The economy features low unemployment, contained inflation, very low public debt, and a strong and stable financial system (Central Intelligence Agency, 2013).
Placing this within a broader global context, Australia was virtually alone among advanced economies in avoiding a recession during the global financial crisis and what is often referred to as the ‘Great Recession’ of 2008-2009 (Barrett, 2011).
This national and global perspective provides the macroeconomic context within which this report has been written.
1.2 Information sources The Animal Health Alliance of Australia (the Alliance) commissioned Galaxy Research to undertake a survey of pet owners and non-pet owners in Australia (the Australian Pet Ownership Survey). The findings of this survey are used as the primary data source in Pet Ownership in Australia 2013 (this report).
This survey will be repeated every three years, with the findings published in future editions of this report.
This report is also informed by data and information sourced from internationally recognised research and consulting firms, Australian Government departments, international pet industry bodies, and industry associations and sources.
Galaxy Research is one of Australia’s leading polling companies, with a proven reputation for accuracy. The company applies a rigorous approach to all of its polls and surveys to deliver reliable results. Run by practitioners with more than 20 years of marketing and research experience, Galaxy Research builds strategic insight and innovation upon a solid understanding of research theory. Galaxy polls are published in all major Australian newspapers.
The Australian Pet Ownership Survey was conducted with a representative sample of adults, aged 18 years and older. The total number of respondents was 1,734, of which 1,089 were pet owners. The survey was undertaken between 15 and 18 January 2013. Following the completion of interviewing, the data was weighted by region to reflect the latest Australian Bureau of Statistics (ABS) household estimates to generate national and state figures.
The Australian Bureau of Statistics is Australia’s official national statistical agency. The ABS provides statistics on a wide range of economic, social and environmental matters, covering government, business and the community.
Euromonitor International is an international company and leading provider of strategy research for consumer markets, including pet care. The company provides international market intelligence on industries, countries and consumers. The company provides services including publishing market reports, business reference books, online information systems and tailored consulting projects.
IBISWorld provides business information, research, statistics, analysis and forecasts on over 500 industries, including pet care products and services and the veterinary industry. In addition the company also produces reports on Australia’s top 2,000 companies and risk rating reports on every industry.
PET OWNERSHIP IN AUSTRALIA 2013 7

1.3 Historical pet population dataIt is well established that pet numbers and ownership rates have been declining in Australia for a number of years.
The most recent pet population estimates were for the 2009 calendar year, published by the Australian Companion Animal Council (ACAC) in 2010. These estimates were based on market analysis and data modelling.
This report applies a different methodology. Pet population numbers in Pet Ownership in Australia 2013 are based on the findings of the Australian Pet Ownership Survey, commissioned by the Alliance and undertaken by one of Australia’s leading research and polling agencies, Galaxy Research.
The Australian Pet Ownership Survey findings showed dog and cat numbers to be higher than previously estimated, and bird and fish numbers lower than previously estimated. These variations are due to the different methodologies applied.
The robust methodology applied to surveying a statistically significant sample of Australians and resulting analysis provides accurate estimates for pet numbers. The approach is repeatable and the Alliance will undertake the survey and publish updated versions of this report every three years. The information contained in the first edition will therefore provide a benchmark against which future trends in pet ownership and buying behaviour can be analysed.
PET OWNERSHIP IN AUSTRALIA 20138

1.4 Data reportingThe following points regarding data should be noted:
�� Households may own more than one type of pet, therefore ownership rates for different types of pets cannot be added to get a total ownership percentage.
�� Figures in the report have been rounded to the nearest decimal point. This may result in minor variations between sums of the component items and totals, and some percentages may not total 100%.
�� There may be some variation across data depending on the data source.
�� Unless otherwise stated expenditure figures are in Australian dollars (AUD).
At the time the report was finalised (26 July 2013) the exchange rate for the Australian dollar with the United States dollar was 0.924; with the British pound was 0.601; with the New Zealand dollar was 1.146; and with the Euro was 0.696.
The report acknowledges contributions of all companies, industry associations and government agencies and thanks them for their support in providing information to compile this report.
PET OWNERSHIP IN AUSTRALIA 2013 9

2 EXECUTIVE SUMMARYThis report has been prepared by the Animal Health Alliance (Australia) and is based on the findings of one of the most comprehensive surveys of pet ownership undertaken in Australia. It provides an insight into pet ownership trends and buying behaviour, and outlines the value of the Australian pet care industry to the Australian economy.
Australia has a strong history of pet ownership, with pets playing an important role in the lives of Australians for generations. Today there are more pets living in Australia than people, confirming their importance in modern Australian society.
The Australian pet industry is estimated to be worth $8.0 billion annually.
PET OWNERSHIP IN AUSTRALIA 201310

2.1 Pet populationIn 2013 there are estimated to be more than 25 million pets in Australia, with nearly 5 million of Australia’s 7.6 million households home to pets. At 63%, Australia has one of the highest rates of pet ownership in the world.
Dogs are the most common pet, with 39% of households owning a dog. There are estimated to be 4.2 million pet dogs in Australia; 19 dogs for every 100 people.
Cats are the second most common pet, with 29% of households owning a cat. There are estimated to be 3.3 million pet cats in Australia; 15 cats for every 100 people.
Fish are the most numerous pet type, with a total population of 10.7 million. The number of birds is estimated to be 4.8 million, with a further 2.2 million other pets including small mammals and reptiles.
Almost half (48%) of all Australians would like to either get a pet or get another pet. More than 1.1 million Australian households (14.9%) are planning to get a companion animal in 2013.
2.2 Trends Companionship is the driving reason behind pet ownership, with seven out of ten Australians citing it as the main reason for getting a dog or cat.
Most pet owners consider their pets to be members of the family, and this has a powerful impact on how people look after the animals in their care, as well as on their buying behaviour.
Pet food has been compared to baby food in terms of its resilient market performance, with people prioritising spending on their pets as they would a member of their immediate family.
The popularity of premium dog and cat food and single serve portions has increased in recent years.
0%
5%
10%
15%
20%
25%
30%
35%
40%
45%
–
2.0
4.0
6.0
8.0
10.0
12.0
Dogs Cats Fish Birds Otherpets
Per
cent
age
of h
ouse
hold
s ow
ning
pet
s
Mill
ions
of
pets
Pet type
Total pets (millions)
Percentage of households
Figure 1: Australian pet population and ownership rates
Source: Galaxy Research, 2013
PET OWNERSHIP IN AUSTRALIA 2013 11
Pet food has become more sophisticated and now often makes claims about vitamins and minerals or of specific wellbeing outcomes such as dental health. The market has also become more segmented with products available for different life stages and different breeds.
Advances in healthcare products for animals have enabled people to keep their pets free of fleas, ticks and internal parasites. Over recent decades this has seen the domain of dogs and cats move from outside to inside the home. Today, 92% of cats and 76% of dogs are kept either exclusively or partly indoors.
Alternative healthcare treatments have become increasingly popular amongst Australians generally, and their popularity for pets is expected increase in the next five years (IBISWorld, 2012). Treatments already available include acupuncture, reflexology, chiropractic services and hydrotherapy.
The popularity of pet insurance is increasing, particularly amongst younger pet owners. Twenty per cent of Gen Y pet owners have insurance for their cats, and 27% for their dogs.
In comparison, only 12% of pet owning Baby Boomers have insurance for their dogs and just 9% have insurance for their cats.
Micro-chipping and de-sexing rates are relatively high in Australia, with 78% of dogs and 91% of cats de-sexed, and 76% of dogs and 64% of cats micro-chipped.
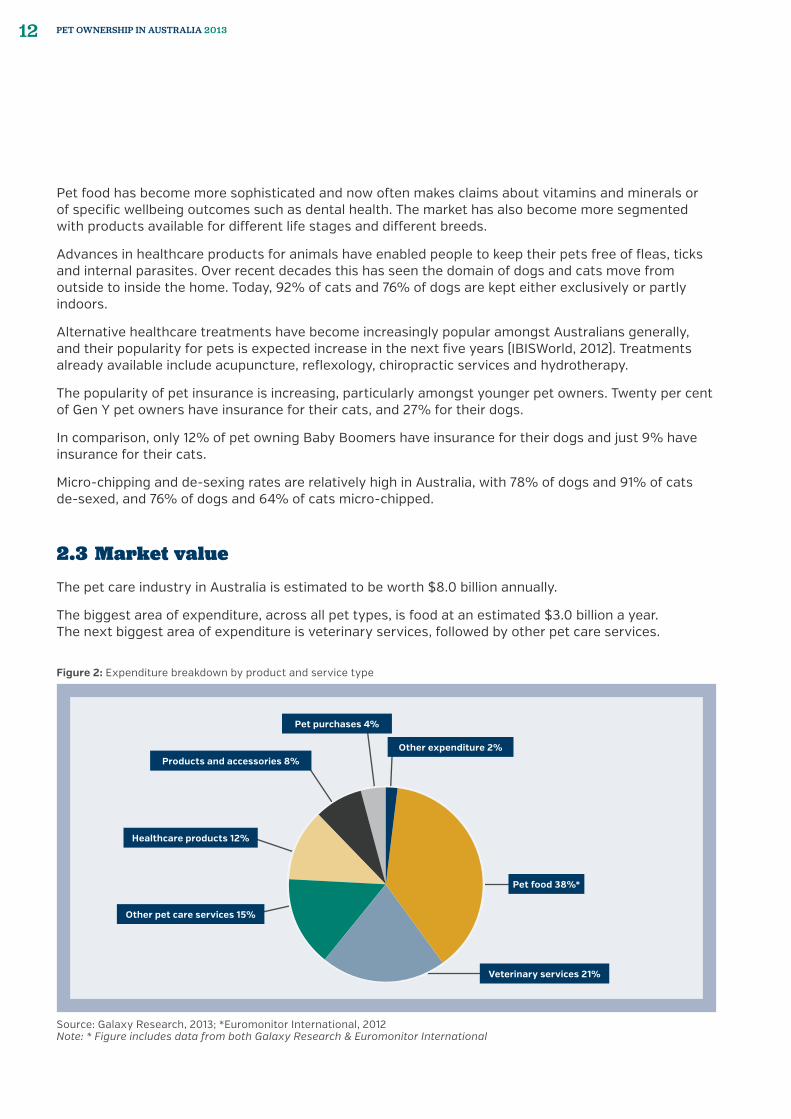
2.3 Market value The pet care industry in Australia is estimated to be worth $8.0 billion annually.
The biggest area of expenditure, across all pet types, is food at an estimated $3.0 billion a year. The next biggest area of expenditure is veterinary services, followed by other pet care services.
Figure 2: Expenditure breakdown by product and service type
Pet food 38%*
Veterinary services 21%
Other pet care services 15%
Healthcare products 12%
Products and accessories 8%
Pet purchases 4%
Other expenditure 2%
Source: Galaxy Research, 2013; *Euromonitor International, 2012Note: * Figure includes data from both Galaxy Research & Euromonitor International
PET OWNERSHIP IN AUSTRALIA 201312
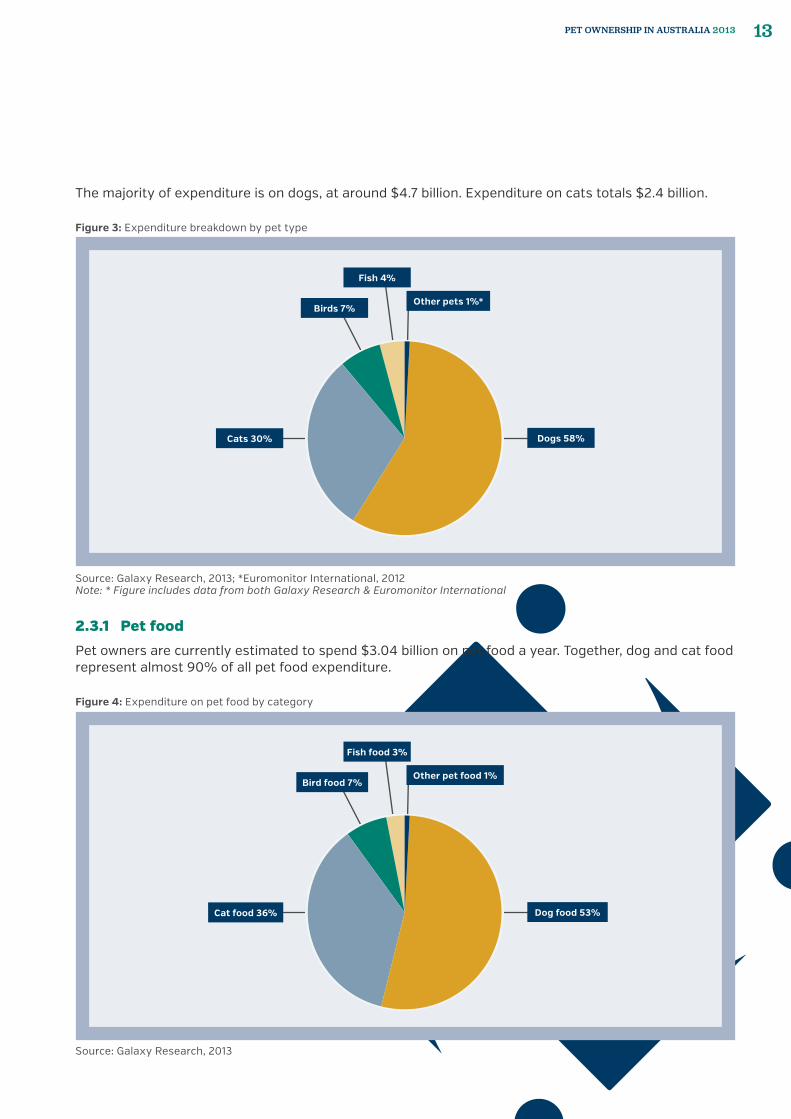
The majority of expenditure is on dogs, at around $4.7 billion. Expenditure on cats totals $2.4 billion.
2.3.1 Pet food
Pet owners are currently estimated to spend $3.04 billion on pet food a year. Together, dog and cat food represent almost 90% of all pet food expenditure.
Figure 3: Expenditure breakdown by pet type
Dogs 58%Cats 30%
Birds 7%
Fish 4%
Other pets 1%*
Source: Galaxy Research, 2013; *Euromonitor International, 2012Note: * Figure includes data from both Galaxy Research & Euromonitor International
Figure 4: Expenditure on pet food by category
Dog food 53%Cat food 36%
Bird food 7%
Fish food 3%
Other pet food 1%
Source: Galaxy Research, 2013
PET OWNERSHIP IN AUSTRALIA 2013 13

2.3.3 Pet care services
Pet owners currently spend around $2.9 billion a year on pet care services. The majority of this expenditure is on veterinary services, totalling around $1.7 billion a year.
Across the different pet types, dogs account for more than two thirds of all expenditure on pet care services.
2.3.2 Pet products and accessories
Pet owners are currently estimated to spend $1.6 billion on pet products and accessories a year, $976 million of which is on healthcare products.
Figure 5: Expenditure on pet products
Dogs 52%
Cats 26%
Fish 12%
Birds 10%
Source: Galaxy Research, 2013
Figure 6: Expenditure on pet care services
Dogs 69%
Cats 27%
Fish 1%
Birds 3%
Source: Galaxy Research, 2013
PET OWNERSHIP IN AUSTRALIA 201314

PET OWNERSHIP IN AUSTRALIA 2013 15

3 PET OWNERSHIP
PET OWNERSHIP IN AUSTRALIA 201316

Table 1: Australian pet population
Pet type Percentage of households Total Pets (million)
Dogs 39% 4.2
Cats 29% 3.3
Fish 15% 10.7
Birds 13% 4.8
Other pets 7% 2.2
Total 63%* 25.2
Source: Galaxy Research, 2013Note: * Figure relates to ownership of any type of pet
3.1 COMPANION ANIMAL POPULATION Companion animals play an important role in the lives of Australians, and with more than 25 million country-wide, they outnumber people. In 2013, 63% of Australian households are home to companion animals.
While Australia has one of the highest rates of pet ownership in the world (ACAC, 2010), increased urbanisation has resulted in ownership rates as low as 39% amongst those living in units and apartments as strata restrictions heavily limit pet ownership. However, a huge 59% of Australians surveyed who don’t currently have a companion animal would like to own one.
It is well established that pet numbers and ownership rates have been declining in Australia for a number of years. While pet numbers have been declining, the Australian Pet Ownership Survey findings showed dog and cat numbers to be higher, and bird and fish numbers lower than previously estimated (ACAC, 2010).
3.1.1 Summary
There are 4.2 million dogs in Australia. With 39% of households owning at least one dog, they are Australia’s most popular pet.
Cats aren’t far behind, with 29% of households home to 3.3 million cats.
Although more households have dogs and cats, fish are the most numerous pets at 10.7 million. On average, 15% of households own an average of nine fish. This is easy to understand considering the shift to urban apartment living (ABS, 2013b), where pets are not permitted to be kept in many strata title properties (ACAC, 2002).
Birds are the second most numerous pet, with a total population of 4.8 million. Thirteen per cent of households have birds – either caged (inside), aviary (outside) or chickens.
Other animals account for 2.2 million pets in Australia and include reptiles and small mammals such as rabbits and guinea pigs.
PET OWNERSHIP IN AUSTRALIA 2013 17

3.1.2 Households
There are 4.9 million pet owning households in Australia. Sixty-eight per cent of people living in freestanding houses own a pet compared to 39% living in units or apartments. Just 15% of people living in units or apartments own a dog.
Ownership rates are 10% higher amongst those who own the property in which they live (67%) compared to those who rent (57%). People living in suburban and regional locations are equally likely to own pets (67%), while the ownership rate in urban areas is considerably lower (54%).
Women (67%) are more likely to have a companion animal than men (60%).
3.1.3 States
South Australia is the stand out state for pet ownership, with 73% of households owning a pet. Almost half of all South Australian households have a dog – far exceeding the national average. The states with the next highest rates of dog ownership are Victoria/Tasmania and Queensland.
Cats are most popular in Victoria/Tasmania, with 36% of households owning a cat, followed by South Australia at 31%.
Western Australia has the lowest rate of pet ownership, where 56% of households include companion animals.
Table 2: Breakdown of Australian pet population
Pet type Percentage of households
Pet owning households ('000)
Average number in home
Total pets ('000)
Dogs 39% 3,045 1.4 4,168
Cats 29% 2,224 1.5 3,315
Fish 15% 1,189 9.0 10,811
Birds 13% 1,027 4.7 4,915
Other pets 7% 510 4.3 2,123
Total 63%* 4,925* – 25,332
Source: Galaxy Research, 2013Note: * Figure relates to ownership of any type of pet
Table 3: Percentage of households with pets by state
Pet type NSW VIC/TAS QLD SA WA National
Dogs 35% 43% 40% 48% 34% 39%
Cats 24% 36% 26% 31% 26% 29%
Fish 17% 13% 15% 23% 12% 15%
Birds 13% 15% 12% 22% 6% 13%
Other pets 6% 7% 6% 10% 5% 7%
Total (for any type of pet) 59% 71% 62% 73% 56% 63%
Source: Galaxy Research, 2013
PET OWNERSHIP IN AUSTRALIA 201318

Nationally, there are 19 dogs and 15 cats to every 100 people.
Table 4: Australian pet population by state (‘000)
Pet type NSW VIC/TAS QLD SA WA Total
Dogs 1,282 1,285 884 384 333 4,168
Cats 942 1,153 533 306 381 3,315
Fish 4,269 2,498 2,627 878 538 10,811
Birds 748 1,825 1,004 1,152 186 4,915
Other pets 471 673 454 216 310 2,123
Total 7,712 7,434 5,502 2,936 1,747 25,332
Source: Galaxy Research, 2013
Table 5: Dogs and cats per 100 head of population by state
State Population (‘000) Number per 100 people
Dogs Cats
VIC/TAS 5,849 22 20
SA 1,809 21 17
QLD 4,333 20 12
WA 2,239 15 17
NSW 7,275 18 13
Total 21,505 19 15
Source: ABS, 2013b; Galaxy Research, 2013
0%
20%
40%
60%
80%
100%
NSW VIC/TAS QLD SA WA Total
Per
cent
age
of h
ouse
hold
s
State
Total Dogs Cats Fish Birds Other pets
Figure 7: Percentage of pet owning households by state
Source: Galaxy Research, 2013
PET OWNERSHIP IN AUSTRALIA 2013 19

3.1.4 Dogs
There are 4.2 million dogs and more than 3.0 million dog owning households in Australia.
With 39% of all households owning a dog, they are Australia’s most popular pet.
There are on average 19 dogs to every 100 people in Australia. This ratio is highest in Victoria/Tasmania, South Australia and Queensland.
3.1.5 Cats
There are 3.3 million cats in Australia and 2.3 million cat owning households. On average, there are 15 cats per 100 people. This ratio is highest in Victoria/Tasmania, with South Australia and Western Australia also above the national average.
Interestingly, the average number of cats per cat owning household is higher in Western Australia than anywhere else in the country.
Most cats are mixed breeds (75%) rather than purebred (25%). Pure breeds are most popular in urban areas where they account for 39% of the cats, compared to only 20% of the cats in the suburbs and 22% in regional areas.
Half of all dogs are purebred. Mixed breeds make up 42% of Australia’s dog population, with designer breeds coming in at 8%.
Considerations such as lifestyle and space come into play when deciding on the size of dog to get. Australians tend to favour mid-sized dogs, from 4kg to 25kg.
Table 6: Dog population and ownership
Item 2013
Dog population (million) 4.2
Number of households with dogs (million) 3.0
Dog ownership (% households) 39%
Average number per home 1.4
Dogs per 100 people 19
Source: Galaxy Research, 2013
Table 8: Cat population and ownership
Item 2013
Cat population (million) 3.3
Number of households with cats (million) 2.3
Cat ownership (% households) 29%
Average number per home 1.5
Cats per 100 people 15
Source: Galaxy Research, 2013
Table 7: Breakdown of dog population by dog size
Item Percentage
Less than 4kg 12%
4 – 10kg 36%
10 – 25kg 30%
25 – 50kg 19%
More than 50kg 2%
Source: Galaxy Research, 2013
PET OWNERSHIP IN AUSTRALIA 201320

3.1.6 Other pets
Increasing urbanisation, apartment living and strata restrictions have made smaller pets such as birds, fish, small mammals and reptiles a more feasible pet choice than cats or dogs. Generally these smaller pets are also easier to care for, making them a good option for people with a busy lifestyle.
Of all bird owners, the majority have caged birds (66%) such as parrots and budgerigars. Thirty per cent have aviary birds and 22% have chickens.
Fish are most popular with younger pet owners. Twenty-two per cent of people aged 18-24 have fish. Twenty-three per cent of South Australian households keep fish as pets.
3.1.7 International comparison
An international comparison provides an insight into companion animal populations and trends in similar pet owning countries and regions around the world. New Zealand, the United States and United Kingdom have been selected for comparative purposes due to their economic and cultural similarities to Australia. Trends across Europe are also considered.
New Zealand has the highest rate of pet ownership at 68% of households (New Zealand Companion Animal Council (NZCAC), 2011), followed by Australia at 63% and the United States at 62% (American Pet Products Association (APPA), 2013). The United Kingdom trails considerably further behind, at 48% (Pet Food Manufacturers’ Association (PFMA), 2013a).
While Australia and the United States have a similar proportion of households owning dogs, the United States has more cat owning households (34%) and far more dogs and cats per 100 people than Australia. So, although the United States has a slightly lower household rate of pet ownership, there are far more companion animals in United States households.
In addition to having the highest rate of pet ownership, New Zealand has by far the highest rate of cat ownership. Nearly half (48%) of households own a cat – the same rate as for total pet ownership in the United Kingdom.
Table 9: International comparison
Pet type Australia (2013)
New Zealand (2011)
United States (2011-12)
United Kingdom (2012)
Dogs
Households with dogs 39% 29% 40% 23%
Dogs per 100 people 19 17 25 13
Cats
Households with cats 29% 48% 34% 19%
Cats per 100 people 15 35 28 13
Total
Households with pets (any type of pet) 63% 68% 62% 48%
Source: Galaxy Research, 2013; data compiled by Cox Inall based on figures from NZCAC, 2011; Statistics New Zealand, 2013; APPA, 2013; United States Census Bureau, 2013; PFMA, 2013a; Office for National Statistics, 2013
PET OWNERSHIP IN AUSTRALIA 2013 21

Trends in New Zealand In 2011 the NZCAC released its inaugural Companion Animals in New Zealand report. The report is based largely on the results of a broad pet owner survey, which provided insight into the level of pet ownership and the role that companion animals play in families and society.
The 2011 report found that 68% of all households own at least one companion animal, with nearly half of all households (48%) owning an average of two cats. New Zealand has the highest rate of both pet ownership and cat ownership anywhere in the world. This is largely attributed to the social and cultural importance of animals in New Zealand, and the importance placed on a harmonious relationship between animals, people and the environment.
The total companion animal population is 4.9 million, of which 1.4 million are cats, 0.7 million are dogs and 1.7 million are fish.
The vast majority of pet owners consider them to be a member of the family. This figure is highest for cats (83%) and dogs (77%).
New Zealand experienced an economic downturn in 2008 and constrained spending as a result of the global financial crisis. While consumers tended to ‘trade down’ to less expensive alternatives across key sectors within consumer goods, this was only really felt at the super-premium end of the pet food segment. Through this time, New Zealanders placed a priority on their pets’ health and wellbeing and expenditure on premium pet food and healthcare products remained strong (NZCAC, 2011).
It is estimated that New Zealanders spent NZ$ 1.6 billion on their companion animals in 2011, with the biggest areas of expenditure being pet food, veterinary visits and healthcare products.
Table 10: Pet population in New Zealand – 2011
Companion animal type Percentage of households Average number in home Total (‘000)
Cats 48% 1.8 1,419
Dogs 29% 1.5 700
Fish 11% 9.1 1,678
Birds 6% 4.9 527
Rabbits 3% 1.7 88
Horses/ponies 2% 3.2 87
Other pets 5% 4.9 446
None 32% ~ ~
Total 68%* 4,945
Source: NZCAC, 2011Note: * Figure relates to ownership of any type of pet
PET OWNERSHIP IN AUSTRALIA 201322

Trends in the United StatesThe APPA undertakes a biannual survey of pet owners. The 2011-12 survey found that 62% of households, or 72.9 million homes, own a pet. While ownership rates in the United States have remained steady at 62% in recent years, the total pet population has fluctuated during this time.
From 2001 to 2005, cat numbers experienced exceptional growth, jumping by 15 million (20%) to reach a total of 90.5 million. Over the following four years, cat numbers grew by a further 3% to reach a peak of 93.6 million (ACAC, 2006). The most recent survey, however, showed the first decline in cat numbers in the United States since 1994, down 8% to settle at 86.4 million in 2011-12 (APPA, 2013).
In contrast, dog numbers continued their steady climb to reach a total of 78.2 million in the 2011-12 survey. This is an increase of 42% on 1994, when the dog population was 55 million.
Interestingly, while ownership rates have remained constant, pet numbers have decreased quite significantly from 411.8 million in 2009-10 to 377.41 in 2011-12. This is largely attributed to a decrease of 20 million in freshwater fish numbers. In addition to cats and fish, horse numbers, saltwater fish and reptile numbers also decreased.
Table 11: New Zealand – Estimated annual expenditure on pets – 2011
Area of expenditure Expenditure (NZ$m) Percentage of total
Prepared pet food 434.4 27%
Veterinary services 358.1 23%
Non-prepared pet food 331.9 21%
Healthcare 166.1 10%
Boarding/day care/walking 75.0 5%
Clipping/grooming 45.5 3%
Registration/membership 49.6 3%
Cat litter 25.0 2%
Toys and accessories 31.0 2%
Grooming products 33.2 2%
Training 18.5 1%
Insurance 15.7 1%
Total 1583.8 100%
Source: NZCAC, 2011
Table 12: United States pet population (million)
Pet type 2009-10 2011-12
Freshwater fish 171.7 151.1
Cat 93.6 86.4
Dog 77.5 78.2
Bird 15.0 16.2
Small animal 15.9 16.0
Reptile 13.6 13.0
Saltwater fish 11.2 8.6
Equine 13.3 7.9
Total 411.8 377.4
Source: APPA, 2009 and 2013
PET OWNERSHIP IN AUSTRALIA 2013 23

In 2012 it was estimated that the value of the pet care market in the United States was US$52.87 billion, up on the 2011 figure of US$50.96 billion.
Trends in the United KingdomIn United Kingdom, the PFMA undertakes annual research on pet numbers and expenditure on pet care products. In 2012 it was estimated that there were around 67 million pets in the United Kingdom, with 48% of households (13 million) owning at least one pet (excluding fish).
Although ownership rates and pet numbers have fluctuated in recent years, they were higher in 2012 compared to the previous year. In 2011 the total pet population was estimated to be 64 million, with 45% of households owning a pet.
Dogs and cats remain the most common, with the total number of each estimated at 8 million. This translates into 23% of households owning at least one dog and 19% owning at least one cat. This indicates a higher average number of cats per household.
The pet food industry in the United Kingdom has remained healthy despite the 2008 recession. In 2011 the value of pet food sales rose by 1% to reach £2.14 billion. Research conducted by the PFMA (2013c) showed that while pet owners reduced their overall expenditure, they prioritised the needs of their pets.
Just 6% of owners cut back on treats, 4% on pet food costs and 3% on veterinary visits. This is in stark contrast to the reduction in discretionary spending, with 36% of pet owners cutting back on eating out, 25% on clothes shopping, 24% on holidays and 20% on entertainment; and even spending on essentials, with 16% reducing what they spend on food, 15% on petrol and 12% on heating. (PFMA, 2012)
Table 13: United States annual sales of pet food and pet care products (US$ billion)
Item 2011 (actual) 2012 (estimated)
Food 19.9 20.5
Vet care 13.4 13.6
Supplies/over the counter medicine 11.8 12.6
Pet services: grooming & boarding 3.8 4.1
Live animal purchases 2.1 2.2
Total 51.0 52.9
Source: APPA 2009 and 2013
Table 14: United Kingdom pet population (million)
Pet type 2009 2010 2011 2012
Indoor fish 20.0 20.0 20.0 22.5*
Outdoor fish 20.0 20.0 20.0 22.5*
Dogs 8.0 8.0 8.0 8.0
Cats 8.0 8.0 8.0 8.0
Caged birds 1.0 1.0 1.0 1.1
Rabbits 1.0 1.0 1.0 1.0
Guinea pigs 0.7 0.5 1.0 1.0
Hamsters 0.4 0.5 0.5 0.5
Domestic fowl 0.8 0.5 0.5 0.5
Total 66.0 65.0 64.0 67.0
Source: PFMA, 2013a; PFMA, 2013bNote: * Estimated to be between 20-25 million
PET OWNERSHIP IN AUSTRALIA 201324

It is estimated that in 2010, Europe’s 70 million (excluding Russia) pet owning households spent around €13.5 billion on pet food, and a further €10.5 billion on pet related products and services. This represents an annual growth rate for the pet food industry of 2% (average value over the previous three years).
Europe’s pet food industry supports 50,000 jobs directly, and a further 500,000 jobs indirectly (FEDIAF, 2013).
Trends in EuropeThe most recent figures from the European Pet Food Industry Federation (FEDIAF) show an increase in all pet numbers compared to previous estimates, with a total pet population of 240.8 million in Europe. Previous estimates had the total pet population at 200 million.
Almost the same number of households own dogs (26%) and cats (25%). However, the total number of cats is considerably higher, at 84.7 million compared to 73.6 million dogs. This indicates there are more cats per household than dogs.
Table 16: European pet population (million)
Pet type 2010
Cats 84.7
Dogs 73.6
Birds 42.6
Small mammals 30.6
Aquaria 9.2
Total (all animals) 240.8
Source: FEDIAF, 2013
Table 15: United Kingdom market for prepared pet food – 2011
Pet type Value (£ million) Year on year growth (%)
Dog food
Dry complete 486 1%
All wet food 329 1%
Treats 231 4%
Mixers 25 -3%
Total 1,071 1%
Cat food
Wet single serve food 491 2%
Dry complete 234 1%
Wet multi serve food 140 -6%
Treats 53 24%
Total 918 1%
Small animal
Total 67 2%
Total (all pets) 2,135 1%
Source: PFMA, 2012
PET OWNERSHIP IN AUSTRALIA 2013 25

3.2 PET OWNERSHIP INSIGHTS
3.2.1 Summary
Companion animals are considered by most pet owners to be members of the family. This has a powerful impact on how people look after the animals in their care. This isn’t just about how pet owners interact with their pets; it translates into buying behaviour.
The power of this was probably most clearly demonstrated during the global financial crisis. During the uncertain economic times over recent years, it has been well documented that Australian consumers changed their overall buying behaviour, cutting discretionary spending and saving more. During this time, the sale of more cost effective private label products in supermarkets soared.
Despite weak consumer confidence, pet owners have not been prepared to economise on pet care; in fact, pet food has been compared with baby food in terms of its resilient performance (Euromonitor International, 2012).
This prioritisation of pets has also lead to the growth of new and emerging products and services in the pet care sector. For example pet insurance, alternative healthcare, hotels catering for pets, spas and pet massage.
3.2.2 Reasons for pet ownership
The stand out reason for getting a pet is companionship. 72% of dog owners and 67% of cat owners selected ‘companionship’ as the main reason for getting a pet. The next most popular reasons were selected by fewer than 10% of respondents. This demonstrates why pets are more correctly referred to as companion animals.
The reasons offered for getting a bird are far more varied, with the most popular reasons being companionship (40%) and relaxation (38%). Companionship is less important for those with chickens, the majority of whom (80%) were motivated more by the eggs they lay. Other popular reasons include education or responsibility for children; as a hobby or to enter competitions; and for breeding.
Table 17: Main reason for getting a pet
Reason Dogs Cats Birds
Companionship 72% 67% 25%
Education/responsibility for the children 4% 5% 12%
Relaxation 3% 6% 18%
Security 3% ~ ~
To breed 2% 0% 4%
Encourage exercise 2% ~ ~
Hobby/enter competitions 0% 1% 7%
The eggs ~ ~ 15%
Other 9% 14% 11%
None of the above 5% 7% 8%
Total 100% 100% 100%
Source: Galaxy Research, 2013
PET OWNERSHIP IN AUSTRALIA 201326
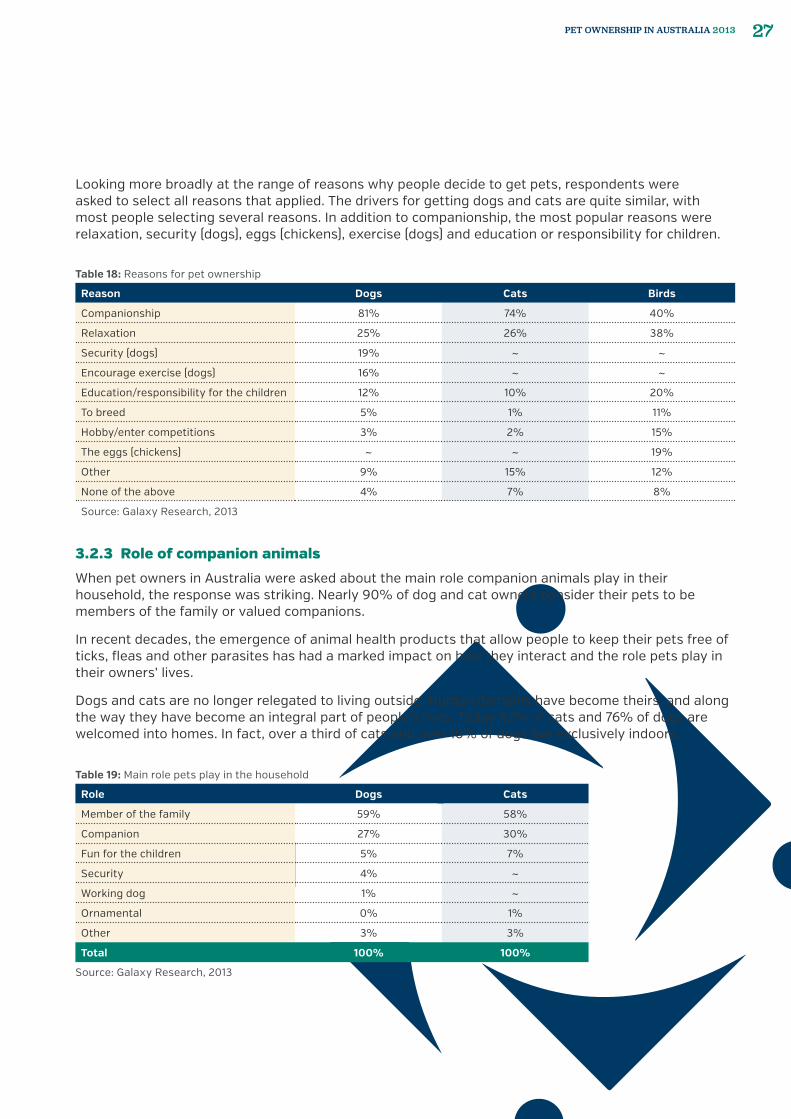
Table 18: Reasons for pet ownership
Reason Dogs Cats Birds
Companionship 81% 74% 40%
Relaxation 25% 26% 38%
Security (dogs) 19% ~ ~
Encourage exercise (dogs) 16% ~ ~
Education/responsibility for the children 12% 10% 20%
To breed 5% 1% 11%
Hobby/enter competitions 3% 2% 15%
The eggs (chickens) ~ ~ 19%
Other 9% 15% 12%
None of the above 4% 7% 8%
Source: Galaxy Research, 2013
Table 19: Main role pets play in the household
Role Dogs Cats
Member of the family 59% 58%
Companion 27% 30%
Fun for the children 5% 7%
Security 4% ~
Working dog 1% ~
Ornamental 0% 1%
Other 3% 3%
Total 100% 100%
Source: Galaxy Research, 2013
Looking more broadly at the range of reasons why people decide to get pets, respondents were asked to select all reasons that applied. The drivers for getting dogs and cats are quite similar, with most people selecting several reasons. In addition to companionship, the most popular reasons were relaxation, security (dogs), eggs (chickens), exercise (dogs) and education or responsibility for children.
3.2.3 Role of companion animals
When pet owners in Australia were asked about the main role companion animals play in their household, the response was striking. Nearly 90% of dog and cat owners consider their pets to be members of the family or valued companions.
In recent decades, the emergence of animal health products that allow people to keep their pets free of ticks, fleas and other parasites has had a marked impact on how they interact and the role pets play in their owners’ lives.
Dogs and cats are no longer relegated to living outside. Human domains have become theirs, and along the way they have become an integral part of people’s lives. Today 92% of cats and 76% of dogs are welcomed into homes. In fact, over a third of cats and over 10% of dogs live exclusively indoors.
PET OWNERSHIP IN AUSTRALIA 2013 27

Pet owners were also asked about the full range or roles that dogs and cats play in the household. The most common responses were as a member of the family, companion, fun for the children and security (in the case of dogs).
Figure 8: Main roles dogs play in the household
Member of the family 60%Companion 27%
Fun for the children 5%
Security 4%
Working dog 1%
Other 3%
Source: Galaxy Research, 2013
Figure 9: Main roles cats play in the household
Member of the family 59%Companion 30%
Fun for the children 7%
Ornamental 1%
Other 3%
Source: Galaxy Research, 2013
PET OWNERSHIP IN AUSTRALIA 201328

3.2.4 Valuable sources of information
Pet owners seek information about companion animals and pet related issues from a range of different sources, from pet shops to breeders, the Royal Society for the Prevention of Cruelty to Animals (RSPCA), veterinarians, family and friends, books, the internet and television.
While all of these sources are considered to be valuable to some degree by almost all pet owners, over half consider veterinarians to be the best source of information on pet related issues, with another quarter viewing the internet as the best source of information.
Table 20: Roles pets play in the household
Role Dogs Cats
Member of the family 78% 72%
Companion 68% 60%
Security 29% ~
Fun for the children 24% 18%
Working dog 4% ~
Ornamental 3% 4%
Other 3% 5%
Source: Galaxy Research, 2013
0%
20%
40%
60%
80%
70%
50%
30%
10%
90%
Member of the family
Companion Security Fun for the children
Role
Per
cent
age
of h
ouse
hold
s
Working dog Ornamental Other
Dogs Cats
Figure 10: Roles pets play in the household
Source: Galaxy Research, 2013
PET OWNERSHIP IN AUSTRALIA 2013 29

Table 21: Sources of information about pet related issues
Source Valuable source Best source
Veterinarians 76% 54%
The internet 64% 24%
Pet shops/specialty stores 42% 6%
RSPCA/Animal shelter 36% 4%
Family/friends/neighbours 27% 4%
Books/the library 23% 2%
Animal shows on television 23% 1%
Breeders 20% 3%
None of the above 3% 3%
Source: Galaxy Research, 2013
3.2.5 Barriers to pet ownership
While individual reasons for not having companion animals vary, the main ones are suitability of home or lifestyle, and not wanting the additional responsibility.
In some cases, especially for dogs and cats, it is not possible to keep an animal because the strata or property where they live doesn’t allow it.
Of households that don’t own a pet but would like to, around one in three (35%) say they would be prepared to pay more rent or strata fees to be able to have a pet.
This equates to nearly 600,000 or 8% of all Australian households that would be prepared to pay more rent or strata fees to be able to have companion animals.
Figure 11: Best source of information on pet related issues
Veterinarians 53%
Pet shops/specialty stores 6%
Animal shows on television 1%
RSPCA/Animal shelter 4%
Family/friends/neighbours 4%
Books/the library 2%
The internet 24%
Breeders 3%
None of the above 3%
Source: Galaxy Research, 2013
PET OWNERSHIP IN AUSTRALIA 201330

Table 22: Barriers to pet ownership
Reason for not owning a pet Dog Cat Fish Bird
Home/lifestyle not suitable 45% 35% 25% 37%
Responsibility 30% 21% 29% 23%
Cost 26% 22% 24% 21%
The strata/property where I live doesn't allow pets
20% 22% 3% 9%
Other household members don't want one
15% 21% 18% 16%
Other 13% 17% 18% 17%
Allergies 4% 13% 2% 9%
None of the above 4% 4% 12% 9%
Source: Galaxy Research, 2013Note: Multiple reasons could be selected
Table 23: Desire to own a pet
Pet type Non pet owners Existing pet owners Total
Dogs 43% 17% 26%
Cats 19% 9% 13%
Fish 10% 13% 12%
Birds 5% 13% 10%
Total 59% 41% 48%
Source: Galaxy Research, 2013
3.2.6 Desire to own a pet
Almost half of all Australians (48%) would like to own a companion animal or get an additional one. Twenty-six per cent of people would like to get a dog, making them the most popular choice, followed by cats, with 13% wanting to get a cat.
Of those who do not currently have a companion animal, the majority (59%) would like one. Of those people who do have a companion animal, two out of five (41%) would like another one.
3.2.7 Planning to get a pet
More than 1.1 million Australian households (14.9%) are planning to get a companion animal in the next 12 months.
This is split fairly evenly between existing and new pet owners: one in five (19%) non pet owning households (550,000) and one in ten (12%) existing pet owning households (605,000). For both groups, dogs are the most popular choice.
PET OWNERSHIP IN AUSTRALIA 2013 31
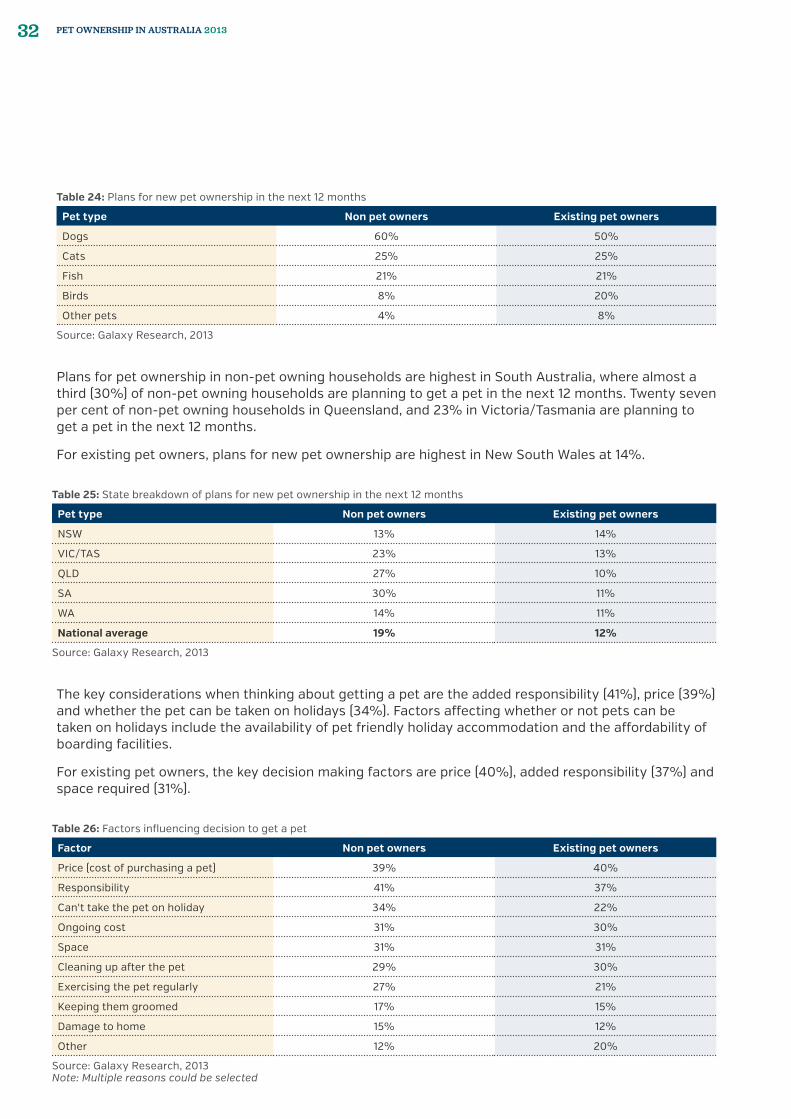
Plans for pet ownership in non-pet owning households are highest in South Australia, where almost a third (30%) of non-pet owning households are planning to get a pet in the next 12 months. Twenty seven per cent of non-pet owning households in Queensland, and 23% in Victoria/Tasmania are planning to get a pet in the next 12 months.
For existing pet owners, plans for new pet ownership are highest in New South Wales at 14%.
The key considerations when thinking about getting a pet are the added responsibility (41%), price (39%) and whether the pet can be taken on holidays (34%). Factors affecting whether or not pets can be taken on holidays include the availability of pet friendly holiday accommodation and the affordability of boarding facilities.
For existing pet owners, the key decision making factors are price (40%), added responsibility (37%) and space required (31%).
Table 25: State breakdown of plans for new pet ownership in the next 12 months
Pet type Non pet owners Existing pet owners
NSW 13% 14%
VIC/TAS 23% 13%
QLD 27% 10%
SA 30% 11%
WA 14% 11%
National average 19% 12%
Source: Galaxy Research, 2013
Table 26: Factors influencing decision to get a pet
Factor Non pet owners Existing pet owners
Price (cost of purchasing a pet) 39% 40%
Responsibility 41% 37%
Can't take the pet on holiday 34% 22%
Ongoing cost 31% 30%
Space 31% 31%
Cleaning up after the pet 29% 30%
Exercising the pet regularly 27% 21%
Keeping them groomed 17% 15%
Damage to home 15% 12%
Other 12% 20%
Source: Galaxy Research, 2013Note: Multiple reasons could be selected
Table 24: Plans for new pet ownership in the next 12 months
Pet type Non pet owners Existing pet owners
Dogs 60% 50%
Cats 25% 25%
Fish 21% 21%
Birds 8% 20%
Other pets 4% 8%
Source: Galaxy Research, 2013
PET OWNERSHIP IN AUSTRALIA 201332
3.3 PET OWNERSHIP TRENDS
3.3.1 De-sexing
Currently in Australia 78% of dogs and 91% of cats are de-sexed (Galaxy Research, 2013).
The Australian Veterinary Association (AVA) and the RSPCA both support the de-sexing of companion animals. The RSPCA and animal shelters have a policy of de-sexing animals before they are re-homed. For kittens and puppies, this usually occurs at eight weeks of age. Similarly, the Pet Industry Association of Australia’s (PIAA) National Code of Practice (2008) encourages de-sexing companion animals.
These policies, coupled with education programs (for example those run by animal shelters and city councils) aimed at pet owners about the benefits of de-sexing, appear to be having a positive impact on the number of unwanted animals. Over the past five years both the number and proportion of animals euthanased by the RSPCA has declined steadily from 77,518 or 48% in 2007-08 to 49,688 or 38% in 2011-12 (RSPCA, 2013c).
The health and behavioural benefits of de-sexing dogs and cats are well documented (National Desexing Network, 2013; RSPCA, 2013a) and include the following:
Health benefits
�� De-sexed animals generally live longer, healthier lives
�� Reduced risk of cancer and other diseases affecting the reproductive organs
�� Frequent pregnancies and raising litters of kittens and puppies can cause exhaustion in female cats and dogs
Behavioural benefits
�� Less likely to run away, wander, get into fights or get injured
�� Reduces territorial behaviour such as spraying and marking territory
�� Less likely to suffer from anti-social behaviour
�� Eliminates the ‘urge to mount’ peoples’ legs in male dogs
�� Eliminates the ‘heat’ cycle in female cats and therefore their efforts get out and roam for a mate
�� More affectionate, better companions
Cost
�� Reduces the huge cost associated with caring for and re-homing unwanted animals
�� The financial impost of de-sexing is minimal ($125 – $280 for dogs; $100 – $180 for cats (RSPCA New South Wales, 2013))when compared to the cost of a lifetime of feeding, veterinary bills and care for offspring, which averages $1,050 a year for dogs and $705 for cats
�� Registration fees are less for de-sexed animals
�� Reduced cost of treating animals injured during fights
�� Dumping puppies and kittens is an ethical cost, as well as being illegal and inhumane
PET OWNERSHIP IN AUSTRALIA 2013 33

3.3.2 Adoption
Over the past 25 years, the number of registered purebred dogs in Australia has declined by a third (Australian National Kennel Council (ANKC), 2013).
This decline comes at a time when awareness about animal welfare and the availability of dogs and puppies for adoption at animal shelters has risen strongly. Over the past ten years the RSPCA’s national statistics (RSPCA, 2013c) show a marked increase in the number of dogs and cats reclaimed or re-homed and a significant decline in the number and percentage of dogs and cats euthanased.
3.3.3 Micro-chipping
Micro-chipping and registration of dogs and cats is compulsory across most states and territories in Australia. Nationwide, 76% of dogs and 64% of cats are micro-chipped (Galaxy Research, 2013).
Micro-chipping ensures that pets are identified for life and can be reunited with their owners if they are lost. On a larger scale, it can be invaluable following a natural disaster, such as a flood or cyclone, where a large number of pets can be displaced.
In New South Wales, under the Companion Animal Act 1998, all dogs and cats must be micro-chipped at the point of sale, change of ownership or by 12 weeks of age, whichever occurs first (Department of Local Government New South Wales, 2013).
In Victoria the Domestic Animals Act 1994 requires that all dogs and cats be micro-chipped as a condition of pet registration, which is compulsory once they are three months old (Department of Primary Industries Victoria, 2013).
In Queensland the Animal Management (Cats and Dogs) Act 2008 requires micro-chipping of dogs and cats prior to sale/transfer and before they are 12 weeks old. The Australian Capital Territory has the same requirement under the Companion Animals Act 1998 (RSPCA, 2013b).
Under the Cat Act 2011 in Western Australia, only cats are required to be micro-chipped, which must be done prior to six months of age (RSPCA, 2013b).
There are no requirements for micro-chipping companion animals in South Australia or the Northern Territory (RSPCA, 2013b).
3.3.4 Pet insurance
Almost an unknown product ten years ago, the market for pet insurance has grown significantly over the past five years. With companion animals considered by most to be members of the family, pet owners are far more likely to opt for costly veterinary treatments if it means better quality of life or a longer life for their valued companions.
However, with some treatments similar to what might be found in a human hospital, pet owners can face costs which run into the thousands of dollars. This makes pet insurance an attractive option for many pet owners.
Many of the major health insurance providers such as Medibank, Allianz, Bupa, Royal Automobile Club of Queensland and HCF offer a range of different cover options for dogs, cats and other pets. The RSPCA and Woolworths also offer pet insurance products.
Currently one in ten cat owners (12%) and nearly one in five dog owners (18%) have this type of cover (Galaxy Research, 2013).
The younger generation is most likely to invest in pet insurance. Twenty per cent of Gen Y pet owners have insurance for their cats, and 27% for their dogs. In comparison, only 12% of pet owning Baby Boomers have insurance for their dogs and just 9% have insurance for their cats.
PET OWNERSHIP IN AUSTRALIA 201334
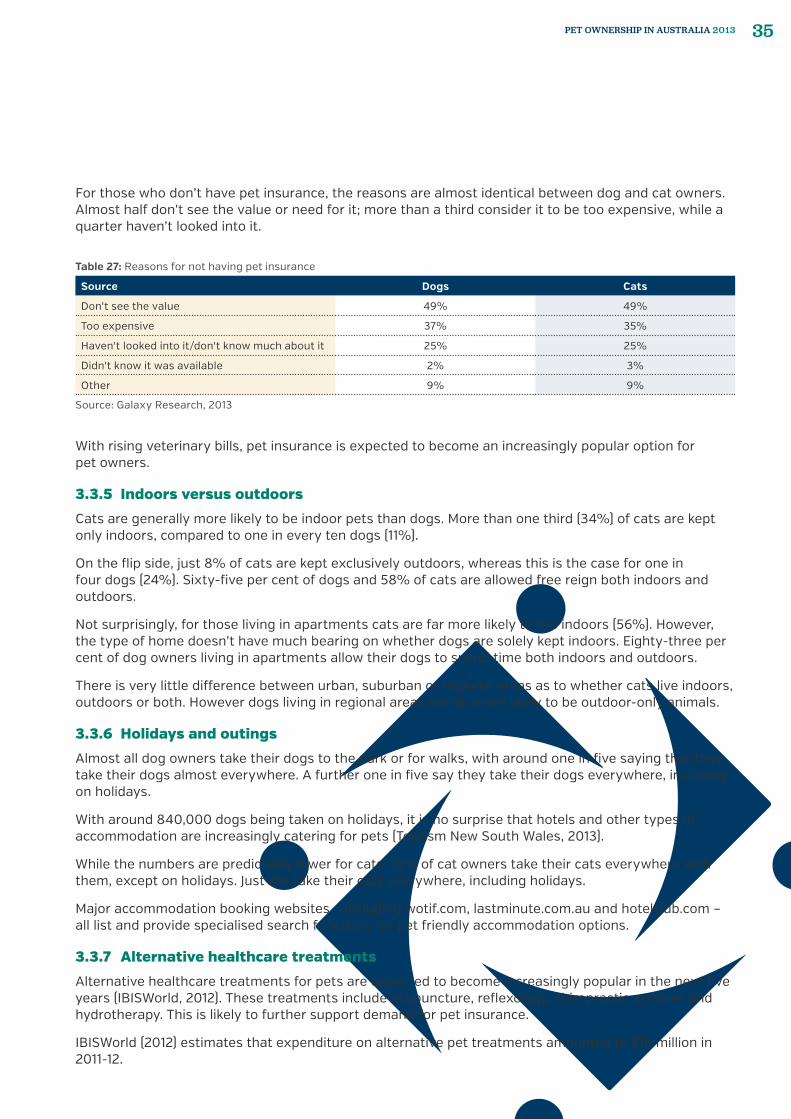
For those who don’t have pet insurance, the reasons are almost identical between dog and cat owners. Almost half don’t see the value or need for it; more than a third consider it to be too expensive, while a quarter haven’t looked into it.
With rising veterinary bills, pet insurance is expected to become an increasingly popular option for pet owners.
3.3.5 Indoors versus outdoors
Cats are generally more likely to be indoor pets than dogs. More than one third (34%) of cats are kept only indoors, compared to one in every ten dogs (11%).
On the flip side, just 8% of cats are kept exclusively outdoors, whereas this is the case for one in four dogs (24%). Sixty-five per cent of dogs and 58% of cats are allowed free reign both indoors and outdoors.
Not surprisingly, for those living in apartments cats are far more likely to live indoors (56%). However, the type of home doesn’t have much bearing on whether dogs are solely kept indoors. Eighty-three per cent of dog owners living in apartments allow their dogs to spend time both indoors and outdoors.
There is very little difference between urban, suburban or regional areas as to whether cats live indoors, outdoors or both. However dogs living in regional areas are far more likely to be outdoor-only animals.
3.3.6 Holidays and outings
Almost all dog owners take their dogs to the park or for walks, with around one in five saying that they take their dogs almost everywhere. A further one in five say they take their dogs everywhere, including on holidays.
With around 840,000 dogs being taken on holidays, it is no surprise that hotels and other types of accommodation are increasingly catering for pets (Tourism New South Wales, 2013).
While the numbers are predictably lower for cats, 10% of cat owners take their cats everywhere with them, except on holidays. Just 4% take their cats everywhere, including holidays.
Major accommodation booking websites – including wotif.com, lastminute.com.au and hotelclub.com – all list and provide specialised search functions for pet friendly accommodation options.
3.3.7 Alternative healthcare treatments
Alternative healthcare treatments for pets are expected to become increasingly popular in the next five years (IBISWorld, 2012). These treatments include acupuncture, reflexology, chiropractic services and hydrotherapy. This is likely to further support demand for pet insurance.
IBISWorld (2012) estimates that expenditure on alternative pet treatments amounted to $16 million in 2011-12.
Table 27: Reasons for not having pet insurance
Source Dogs Cats
Don't see the value 49% 49%
Too expensive 37% 35%
Haven't looked into it/don't know much about it 25% 25%
Didn't know it was available 2% 3%
Other 9% 9%
Source: Galaxy Research, 2013
PET OWNERSHIP IN AUSTRALIA 2013 35

3.3.8 Online
Online shopping is rapidly increasing in popularity in Australian, with many retailers now selling their products and services this way.
Looking at pet product sales, few pet owners rely on the internet for purchasing the majority of their pet food. However, 5% of pet owners buy the majority of their pet accessories online and 12% buy the majority of their healthcare products online.
Pet owners buying healthcare products online are far more likely to buy from Australian sites (92%) than overseas sites (9%).
The most popular healthcare products bought online are over the counter parasite treatments, specifically flea treatments (84%), worming treatments (69%) and tick treatments (47%).
Of pet owners buying healthcare products online, 15% are buying dietary supplement and 5% are buying other healthcare products.
Interestingly, there was no standout generational group for which online purchasing of pet products was most popular.
3.3.9 Social media and online communities
The rise of social media, particularly Facebook and Twitter, and online communities has seen many brands take their marketing strategies online, looking to engage directly with customers and potential customers. Examples include Pet Barn, Purina Australia (Nestle Purina) and Shmackos (Mars Australia).
Table 28: Percentage of pet products bought online
Product type Percentage
Pet healthcare products 12%
Fish food 5%
Pet products and accessories 5%
Dog food 2%
Bird food 2%
Cat food 1%
Source: Galaxy Research, 2013
PET OWNERSHIP IN AUSTRALIA 201336
PET OWNERSHIP IN AUSTRALIA 2013 37

4 MARKET VALUE SUMMARY
PET OWNERSHIP IN AUSTRALIA 201338

4.1 SUMMARYThe pet industry in Australia is estimated to be worth $8.0 billion annually.
The majority of expenditure is on dogs, at around $4.7 billion. Expenditure on cats totals around $2.4 billion.
The biggest area of expenditure, across all pet types, is food at an estimated $3 billion a year. The next biggest area of expenditure is veterinary services, followed by other pet care services.
Table 29: Expenditure by pet type
Pet type $ Million Percentage of total
Dogs 4,685 59%
Cats 2,403 30%
Birds 544 7%
Fish 325 4%
Other pets 50* 1%
Total 8,007 100%
Source: Galaxy Research, 2013; *Euromonitor International, 2012Note: * Figure includes data from both Galaxy Research & Euromonitor International
Figure 12: Expenditure breakdown by pet type
Dogs 58%Cats 30%
Birds 7%
Fish 4%
Other pets 1%*
Source: Galaxy Research, 2013; *Euromonitor International, 2012Note: * Figure includes data from both Galaxy Research & Euromonitor International
PET OWNERSHIP IN AUSTRALIA 2013 39
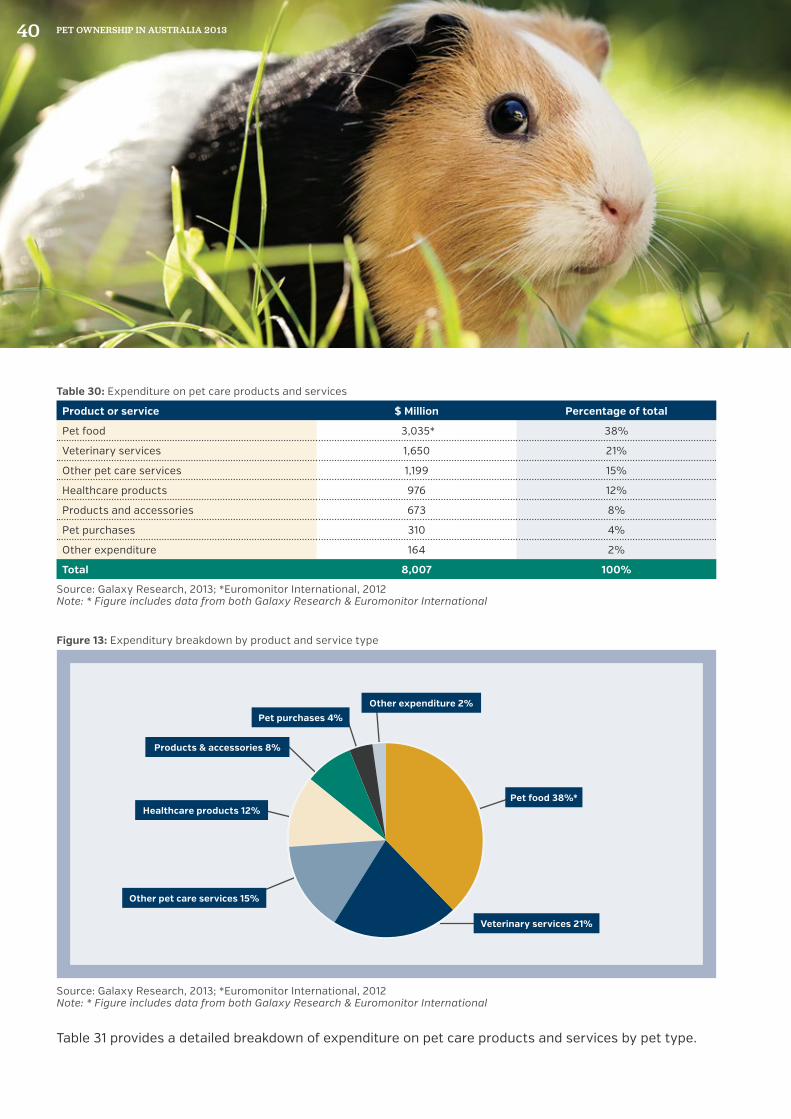
Table 30: Expenditure on pet care products and services
Product or service $ Million Percentage of total
Pet food 3,035* 38%
Veterinary services 1,650 21%
Other pet care services 1,199 15%
Healthcare products 976 12%
Products and accessories 673 8%
Pet purchases 310 4%
Other expenditure 164 2%
Total 8,007 100%
Source: Galaxy Research, 2013; *Euromonitor International, 2012Note: * Figure includes data from both Galaxy Research & Euromonitor International
Table 31 provides a detailed breakdown of expenditure on pet care products and services by pet type.
Figure 13: Expenditury breakdown by product and service type
Pet food 38%*
Veterinary services 21%
Other pet care services 15%
Healthcare products 12%
Products & accessories 8%
Pet purchases 4%Other expenditure 2%
Source: Galaxy Research, 2013; *Euromonitor International, 2012Note: * Figure includes data from both Galaxy Research & Euromonitor International
PET OWNERSHIP IN AUSTRALIA 201340

Table 31: Expenditure pet care products and services by pet type
Product or service $ Million Percentage of total
Pet food
Dogs 1,614 20.1%
Cats 1,088 13.6%
Birds 202 2.5%
Fish 82 1.0%
Other pets 49* 0.6%
Sub-total 3,035 37.9%
Pet care products
Dogs 850 10.6%
Cats 436 5.4%
Fish 191 2.4%
Birds 172 2.1%
Sub-total 1,648 20.6%
Pet care services
Dogs 1,952 24.3%
Cats 781 9.7%
Birds 95 1.2%
Fish 23 0.3%
Sub-total 2,850 35.6%
Pet purchases
Dogs 206 2.6%
Cats 53 0.7%
Fish 11 0.1%
Birds 40 0.5%
Other pets 1 0.0%
Sub-total 310 3.9%
Other expenditure
Dogs 64 0.8%
Cats 47 0.6%
Fish 18 0.2%
Birds 36 0.4%
Sub-total 164 2.0%
Total 8,007 100.0%
Source: Galaxy Research, 2013; *Euromonitor International, 2012
PET OWNERSHIP IN AUSTRALIA 2013 41

4.2 SUMMARY BY PET TYPE
4.2.1 Dogs
The average dog owning household spends $1,471 per year on their dogs. The main areas of expenditure are food ($530) and veterinary services ($358). Some dog owners have more than one dog, which makes the average per animal $1,050.
Table 32: Annual expenditure on dogs (average across all households)
Item $ Million Percentage of total expenditure
Average spend per household
($)
Average spend per animal
($)
Pet food 1,614 34% 530 379
Veterinary services 1,090 23% 358 256
Pet healthcare products 566 12% 186 133
Clipping/grooming 305 6% 100 71
Products or accessories 283 6% 93 66
Pet insurance 158 3% 52 37
Boarding/minding 149 3% 49 35
Competitions/memberships 79 2% 26 19
Training behaviour/therapy 76 2% 25 18
Walking 49 1% 16 11
Transport 46 1% 15 11
Pet purchases 206 4% ~ ~
Other 64 1% 21 15
Total 4,685 100% 1,471 1,051
Source: Galaxy Research, 2013
Figure 14: Detailed breakdown of average expenditure on dogs
Pet food 35%
Veterinary services 23%Pet healthcare products 12%
Clipping/grooming 7%
Products or accessories 6%
Pet insurance 3%
Boarding/minding 3%
Competitions/memberships 2%
Training behaviour/therapy 2%
Walking 1%Transport 1%
Pet purchases 4%
Other 1%
Source: Galaxy Research, 2013
PET OWNERSHIP IN AUSTRALIA 201342
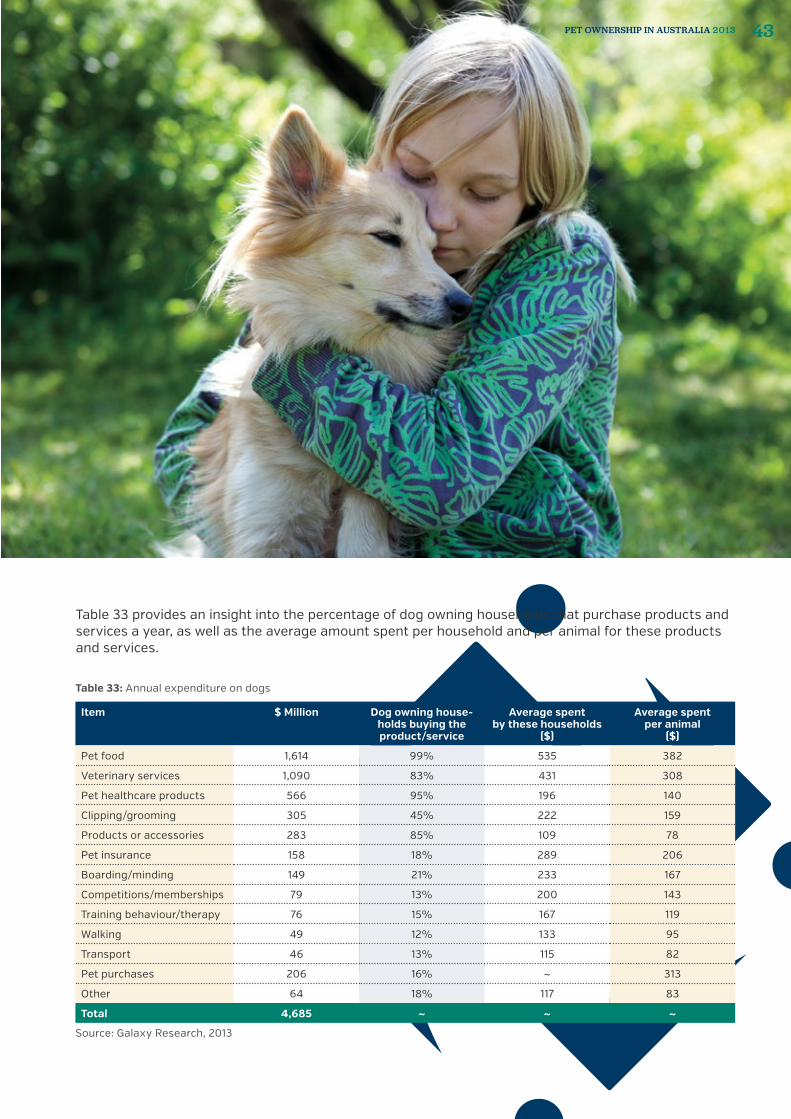
Table 33: Annual expenditure on dogs
Item $ Million Dog owning house-holds buying the product/service
Average spent by these households
($)
Average spent per animal
($)
Pet food 1,614 99% 535 382
Veterinary services 1,090 83% 431 308
Pet healthcare products 566 95% 196 140
Clipping/grooming 305 45% 222 159
Products or accessories 283 85% 109 78
Pet insurance 158 18% 289 206
Boarding/minding 149 21% 233 167
Competitions/memberships 79 13% 200 143
Training behaviour/therapy 76 15% 167 119
Walking 49 12% 133 95
Transport 46 13% 115 82
Pet purchases 206 16% ~ 313
Other 64 18% 117 83
Total 4,685 ~ ~ ~
Source: Galaxy Research, 2013
Table 33 provides an insight into the percentage of dog owning households that purchase products and services a year, as well as the average amount spent per household and per animal for these products and services.
PET OWNERSHIP IN AUSTRALIA 2013 43

Table 34: Annual expenditure on cats (average across all households)
Item $ Million Percentage of total expenditure
Average spend per household
($)
Average spend per animal
($)
Pet food 1,088 45% 489 326
Veterinary services 492 20% 221 147
Pet healthcare products 307 13% 138 92
Products or accessories 129 5% 58 39
Boarding/minding 118 5% 53 35
Pet insurance 67 3% 30 20
Clipping/grooming 47 2% 21 14
Competitions/memberships 27 1% 12 8
Training behaviour/therapy 16 1% 7 5
Transport 16 1% 7 5
Pet purchases 53 2% ~ ~
Other 47 2% 21 14
Total 2,403 100% 1,057 705
Source: Galaxy Research, 2013
4.2.2 Cats
On average, annual expenditure on cats is less than on dogs. The average cat owning household spends $1,057 per year on their cats, equivalent to $705 per animal.
Cat owners spend proportionally more on food than dog owners, with cat food making up close on half of all expenditure.
Figure 15: Detailed breakdown of average expenditure on cats
Pet food 45%
Veterinary services 20%
Pet healthcare products 13%
Clipping/grooming 2%
Products or accessories 5%
Pet insurance 3%
Boarding/minding 5%
Competitions/memberships 1%
Training behaviour/therapy 1%
Transport 1%
Pet purchases 2%
Other 2%
Source: Galaxy Research, 2013
PET OWNERSHIP IN AUSTRALIA 201344

Table 35: Annual expenditure on cats
Item $ Million Cat owning house-holds buying the product/service
Average spent by these households
($)
Average spent per animal
($)
Pet food 1,088 99% 494 329
Veterinary services 492 68% 325 217
Pet healthcare products 307 89% 155 103
Products or accessories 129 69% 84 56
Boarding/minding 118 17% 312 208
Pet insurance 67 12% 250 167
Clipping/grooming 47 14% 150 100
Competitions/memberships 27 9% 133 89
Training behaviour/therapy 16 8% 88 58
Transport 16 9% 78 52
Pet purchases 53 13% ~ 119
Other 47 15% 140 93
Total 2,403 ~ ~ ~
Source: Galaxy Research, 2013
Table 35 provides an insight into the percentage of cat owning households that purchase products and services a year, as well as the average amount spent per household and per animal for these products and services.
PET OWNERSHIP IN AUSTRALIA 2013 45

Table 36: Annual expenditure on fish (average across all households)
Item $ Million Percentage of total expenditure
Average spend per household
($)
Average spend per animal
($)
Products or accessories 149 46% 125 14
Pet food 82 25% 69 8
Pet healthcare products 43 13% 36 4
Competitions/memberships 23 7% 19 2
Pet purchases 11 3% ~ ~
Other 18 5% 15 2
Total 325 100% 264 29
Source: Galaxy Research, 2013
4.2.3 Other pets
The average fish-owning household has nine fish and spends $264 a year on their fish, or around $29 per fish. Products and accessories such as tanks, filters and ornaments make up around half of all expenditure. Fish food accounts for a quarter of the cost of keeping fish.
Table 37 provides an insight into the percentage of fish owning households that purchase products and services a year, as well as the average amount spent per household and per animal for these products and services.
Figure 16: Detailed breakdown of average expenditure on fish
Products or accessories 46%
Pet food 25%
Pet healthcare products 13%
Pet purchases 3%
Competitions/memberships 7%
Other 6%
Source: Galaxy Research, 2013
PET OWNERSHIP IN AUSTRALIA 201346

Table 37: Annual expenditure on fish
Item $ Million Fish owning house-holds buying the product/service
Average spent by these households
($)
Average spent per animal
($)
Products or accessories 149 70% 179 20
Pet food 82 96% 72 8
Pet healthcare products 43 39% 92 10
Competitions/memberships 23 14% 136 15
Pet purchases 11 ~ ~ ~
Other 18 17% 88 10
Total 325 ~ ~ ~
Source: Galaxy Research, 2013
Table 38: Annual expenditure on birds (average across all households)
Item $ Million Percentage of total expenditure
Average spend per household
($)
Average spend per animal
($)
Pet food 202 37% 197 42
Products or accessories 112 21% 109 23
Veterinary services 69 13% 67 14
Pet healthcare products 60 11% 58 12
Competitions/memberships 26 5% 25 5
Pet purchases 40 7% ~ ~
Other 36 7% 35 7
Total 544 100% 491 104
Source: Galaxy Research, 2013
The average bird-owning household spends $491 a year on their birds, which is just over $100 per bird. The biggest areas of expenditure are bird food, products and accessories such as cages and toys.
PET OWNERSHIP IN AUSTRALIA 2013 47
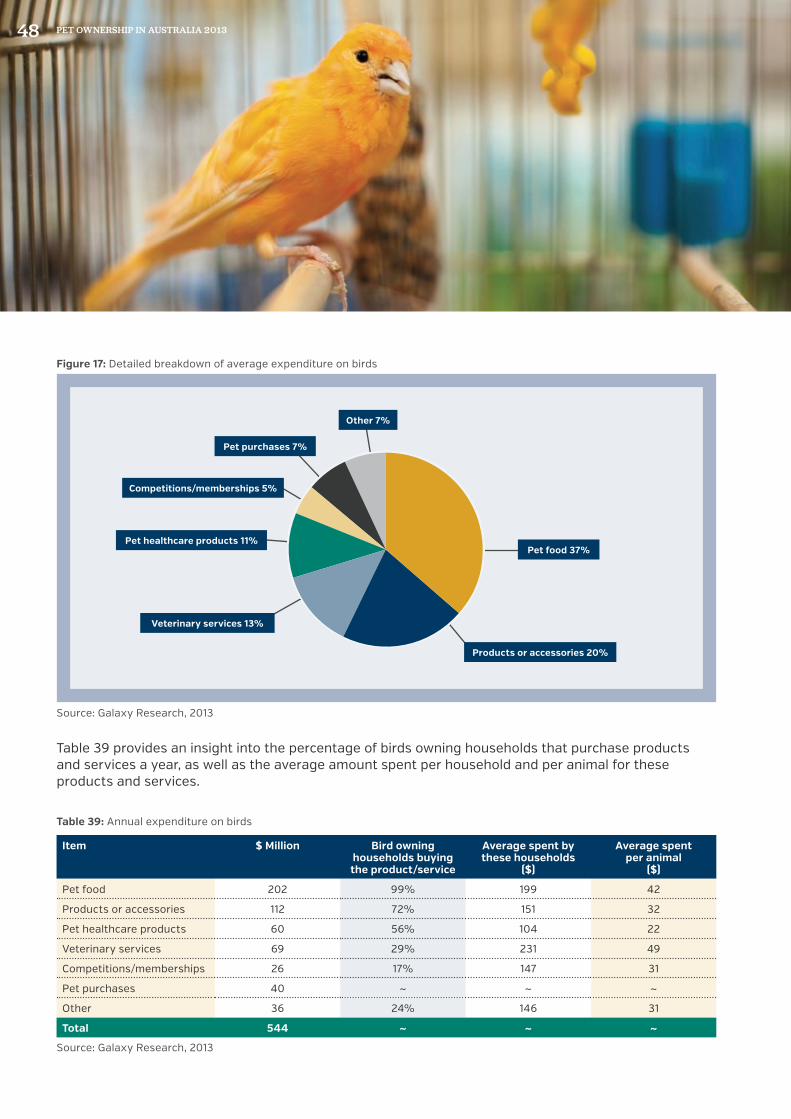
Table 39: Annual expenditure on birds
Item $ Million Bird owning households buying the product/service
Average spent by these households
($)
Average spent per animal
($)
Pet food 202 99% 199 42
Products or accessories 112 72% 151 32
Pet healthcare products 60 56% 104 22
Veterinary services 69 29% 231 49
Competitions/memberships 26 17% 147 31
Pet purchases 40 ~ ~ ~
Other 36 24% 146 31
Total 544 ~ ~ ~
Source: Galaxy Research, 2013
Table 39 provides an insight into the percentage of birds owning households that purchase products and services a year, as well as the average amount spent per household and per animal for these products and services.
Figure 17: Detailed breakdown of average expenditure on birds
Products or accessories 20%
Veterinary services 13%
Pet food 37%Pet healthcare products 11%
Pet purchases 7%
Competitions/memberships 5%
Other 7%
Source: Galaxy Research, 2013
PET OWNERSHIP IN AUSTRALIA 201348
PET OWNERSHIP IN AUSTRALIA 2013 49

5 PET PURCHASESOver the past 12 months it is estimated that 3.6 million new companion animals were procured, with an estimated total expenditure of $310 million. At $206 million, the majority of this expenditure was on dogs, followed by cats at $53 million and birds at $40 million.
PET OWNERSHIP IN AUSTRALIA 201350

Table 40: Estimated annual expenditure on pet purchases
Pet purchases Total purchased in 12 months Total expenditure ($ Million)
Fish* 2,210,226 11
Dogs 658,000 206
Cats 444,000 53
Birds* 168,423 40
Other pets* 71,733 1
Total 3,552,383 310
Source: Galaxy Research, 2013 Note: * Estimated figure based on intended purchases over the next 12 months
Table 41: Price range for dog and cat purchases
Amount paid Dogs Cats
Nothing/free 31% 49%
Up to $200 19% 32%
$201 – $500 26% 14%
$501 – $1000 19% 3%
More than $1000 4% 1%
Total 100% 100%
Source: Galaxy Research, 2013
Table 42: Pet procurement channels
Source Dogs Cats
Breeder 30% 14%
Friend/neighbour 20% 22%
Pet shop 16% 10%
RSPCA/Animal shelter 15% 22%
Inherited 3% 4%
Found/stray 2% 14%
Veterinary practice 1% 5%
Other 13% 9%
Total 100% 100%
Source: Galaxy Research, 2013
Almost half (49%) of all cats were obtained free of charge, compared to around a third (31%) of dogs. The average price paid for a new puppy or dog is $313. This is compared to the average price paid for a kitten or cat of $119.
The most common way to obtain a dog is through a breeder (30%). The second most common is from a friend or neighbour (20%), followed by a pet shop (16%), or the RSPCA or an animal shelter (15%).
The figures are somewhat different for cats, with an equal proportion (22%) being obtained from the RSPCA or an animal shelter, or from friends or neighbours. A further 14% are sourced from a breeder, with 14% found (previously stray) cats. Just 10% of cats are purchased from a pet shop.
Of all the animals owned by Australians, 16% or 658,000 dogs were acquired in the last 12 months, compared to 13% or 444,000 cats.
PET OWNERSHIP IN AUSTRALIA 2013 51

6 PET FOOD Australians have a strong emotional attachment to and value their companion animals, with most people considering them members of the family. Pet owners have become increasingly conscious of providing their pets with the best possible life (Euromonitor International, 2012). This view is powerful and clearly demonstrated in the major trends seen in the sale of pet food.
The global financial crisis had a profound effect on Australian household spending and savings patterns. While the Australian economy never dropped into a recession, job certainty was no longer assumed and Australians started spending less and saving more. This reversed the steadily declining household savings rate, a trend which had been in place since the 1970s (Euromonitor International, 2012).
Consumer spending cut backs have been most noticeable when it comes to discretionary spending. One sector that seems largely impervious to these economic downturns is pet food. In fact, pet food has been compared to baby food due to its resilient performance (Euromonitor International, 2012).
PET OWNERSHIP IN AUSTRALIA 201352

Table 43: Expenditure on pet food
Sector $ (million) Percentage of total
Dog food 1,614 53%
Cat food 1,088 36%
Bird food 202 7%
Fish food 82 3%
Other pet food 49* 2%
Total 3,035 100%
Source: Galaxy Research, 2013; *Euromonitor International, 2012
6.1 SUMMARYPet owners are currently estimated to spend $3.04 billion on pet food a year.
Dog food accounts for more than half of this at $1.6 billion, or 53%. Cat food also comprises a significant proportion at $1.1 billion or 36% of all pet food sales.
Together, dog and cat food represent almost 90% of all pet food expenditure.
6.2 TRENDSThe major trend driving consumer behaviour when it comes to pet food is the humanisation of companion animals. People prioritise spending on their pets as they would a member of their immediate family.
Figure 18: Expenditure on pet food
Dog food 53%Cat food 36%
Bird food 7%
Fish food 3%Other pet food 1%*
Source: Galaxy Research, 2013; *Euromonitor International, 2012
PET OWNERSHIP IN AUSTRALIA 2013 53

6.2.1 Premiumisation
Consumers are prepared to spend more on their pets, which has seen pet food become increasingly sophisticated, particularly in the premium end of the market. Sales of premium dog and cat food products have continued to grow steadily over the past five years, with 7% year on year growth to 2011 in current value terms (Euromonitor International, 2012).
The premiumisation of pet food is impacting the economy and mid-priced segments of the market, which are expected to come under increasing pressure as consumers trade up to premium products.
6.2.2 Packaging
Packaging has become more sophisticated to reflect the premium offerings and key selling points. For wet pet food, product offerings have tended to move away from large pack sizes to multi-pack single serve portions.
To make premium products more affordable, premium dry dog and cat food has increasingly become available in large air tight resealable packs (Euromonitor International, 2012). This has provided an attractive option for pet owners wanting to economise without sacrificing quality.
In non-grocery channels the 3kg pack size is more common, compared to 500g to 1.5kg seen more predominantly in grocery retailers. Dry pet food is most commonly packaged in flexible plastic and does not yet reflect the trend towards more sustainable packaging options (Euromonitor International, 2012).
6.2.3 Health and wellness
As Australians have become more conscious of having a healthy lifestyle and diet, so too have these become considerations when it comes to buying pet food.
Health and wellness claims have become more common in the pet food sector, a trend that is occurring at all price points, including private label offerings. An increasing number of products boast added vitamins and minerals, and/or that they address specific health concerns. These include weight control, dental hygiene and digestive health.
The idea of ‘all-natural’, preservative-free and organic products has also permeated the pet food market (Euromonitor International, 2012). There are established standards and guidelines for the use of these terms. Bodies such as Standards Australia facilitate self-regulation, whereas the Australian Competition and Consumer Commission both facilitates self-regulation and administers black letter law.
6.2.4 Segmentation
The market has become more and more segmented to offer pet owners products that address specific needs or concerns. This includes the development of products targeted to cats and dogs at different life stages, such as puppy/kitten, ‘mature’ and ‘senior’.
The health and wellness trend has also driven segmentation with different product offerings such as weight control, dental hygiene and digestive health.
6.2.5 Private label
Private label pet food offerings have increased alongside a range of other product categories on supermarket shelves, and in 2011 accounted for 10.7% of all pet food sales (Euromonitor International, 2012).
Woolworths has the largest share of the private label market, and the sixth largest share (2.4%) of the total pet food market.
PET OWNERSHIP IN AUSTRALIA 201354

6.3 DOG FOOD
6.3.1 Summary
Dog food accounts for 53% of all pet food sold, with sales totalling $1.6 billion a year; not surprising given dogs are Australia’s most popular pet.
The growing importance of health and wellness considerations in human food has flowed through to dog food product offerings. Product features include weight management, antioxidants, protein supplementation, added vitamins and minerals, omega-3 fortification and prebiotics (Euromonitor International, 2012).
6.3.2 Channels
The vast majority of dog food is purchased in supermarkets. During the past year, 81% of dog owners bought food for their dogs at the supermarket, with 69% buying the majority of their dog food from supermarkets.
There is very little crossover of brands available through grocery and non-grocery store-based retailers (Euromonitor International, 2012).
Superstores such as Pet Barn have grown in popularity, in large part due to the variety of products and lower unit prices for brands available via this channel. Almost a third (32%) of dog owners purchased food from specialty pet stores in the past year, with 16% buying the majority of their dog’s food through this channel.
Eighty-five per cent of dog owners cite supermarkets and specialty pet stores as their main source of pet food.
Table 44: Channels where dog owners purchase dog food
Channel Any purchases Most purchases
Supermarket 81% 69%
Pet shop/pet specialty store 32% 16%
Butcher 20% 3%
Veterinary practice 12% 6%
The internet/online 5% 2%
Other 2% 2%
None of the above 2% 2%
Source: Galaxy Research, 2013
6.3.3 Category and price point breakdown
Pet owners buy marginally more dry dog food than wet dog food, with treats and mixers making up approximately 16% of all dog food sales by value
Table 45: Breakdown of dog food sales (category)
Category Value Volume
Dry 44% 56%
Wet 39% 40%
Treats and Mixers 16% 4%
Total 100% 100%
Total 100% 100%
Source: Euromonitor International, 2012
PET OWNERSHIP IN AUSTRALIA 2013 55

Fairly even quantities of economy, mid-priced and premium dog food are purchased by pet owners. Given the price differences, premium dog food makes up around half of all dog food sold in terms of value; with mid-priced food around a fifth and economy dog food just over a tenth.
Table 46: Breakdown of dog food sales (price point)
Category Value Volume
Premium 50% 30%
Mid-priced 20% 34%
Treats and mixers 16% 4%
Economy 13% 31%
Total 100% 100%
Source: Euromonitor International, 2012
0%
20%
40%
60%
80%
70%
50%
30%
10%
Dry Wet Treats and Mixers
VolumeValue
Figure 19: Dog food sales by value and volume (category)
Source: Euromonitor International, 2012
0%
20%
40%
60%
80%
70%
50%
30%
10%
Premium Mid-priced Treats and Mixers Economy
VolumeValue
Figure 20: Dog food sales by value and volume (price point)
Source: Euromonitor International, 2012
PET OWNERSHIP IN AUSTRALIA 201356

6.3.4 Dog food brands
The dog food landscape is dominated by Mars Australia (Mars), which in 2011 had a 43% market share across both wet and dry dog food. Mars’ brand offerings include the leading dry dog food brand, Pedigree, which had a 14% value share in 2011. Mars has products across a range of price points and has secured its leading position by providing offerings through both grocery and non-grocery retail channels. (Euromonitor International, 2012)
Nestle Purina Petcare Australia (Nestle Purina) is the second largest player, with a 16% market share. Similar to Mars, the company operates brands across a variety of price points, available through grocery and non-grocery channels, but has fewer offerings in the economy segment. In 2007 the company acquired the Supercoat brand (now Purina Supercoat), which has become the biggest selling premium dry dog food brand, with a 21% market share in its segment. At the end of 2011 the company launched a range under the brand Ruffs, to tap into the growing demand for dog treats. (Euromonitor International, 2012)
Growing market segmentation and the desire of pet owners to buy premium products that offer health and wellness benefits have seen a rise in the number of small premium dog food brands. These include Holistic Select from Wellpet; Vitality Classic from Advanced Petcare of Australia; ZiwiPeak from ZiwiPeak; and K9 Natural from K9 Natural Foods. (Euromonitor International, 2012)
6.3.5 Private label
Private label dog food has followed the trends seen across the rest of the sector, with product offerings becoming increasingly sophisticated. In 2011, private label brands held just over a tenth (10.3%) of market share (Euromonitor International, 2012).
Woolworths is the biggest player in private label dog food products and the seventh largest player overall. Woolworths’ private label dog food accounted for 2% of all dog food sales in 2011 (Euromonitor International, 2012).
6.3.6 Prepared versus non-prepared dog food
Not all food eaten by dogs is manufactured or ‘prepared dog food’. A significant proportion consists of left-overs, table scraps and homemade food. This is referred to as ‘non-prepared pet food’. The difference between the two is known as the ‘prepared gap’.
The prepared gap is influenced by a range of socio-economic variables including time available to prepare meals and the growth in popularity of packaged human food sales, where portion sizes see less food left over for pets.
Another key variable is awareness of nutritional requirements for pets, which is influenced by product advertising and veterinary visits. The higher the proportion of prepared pet food, the more saturated the market.
While the dollar value is difficult to estimate, non-prepared dog food is estimated to account for more than half of all food consumed by dogs (Euromonitor International, 2012).
Table 47: Prepared vs non-prepared dog food
2007 2008 2009 2010 2011 2012
Prepared dog food 43.3% 42.8% 42.9% 43.2% 43.5% 43.7%
Non-prepared dog food 56.7% 57.2% 57.1% 56.8% 56.5% 56.3%
Total dog food 100.0% 100.0% 100.0% 100.0% 100.0% 100.0%
Source: Euromonitor International, 2012
PET OWNERSHIP IN AUSTRALIA 2013 57

6.4 CAT FOOD
6.4.1 Summary
Cat food accounts for over a third of all pet food sold in Australia, currently totalling approximately $1.1 billion a year.
Cat owners value their pets’ health and wellbeing and are spending more on premium food that delivers a better quality of life for their companion animals.
6.4.2 Channels
Cat owners rely on supermarkets far more so than other pet owners, with 77% citing this as their main source of cat food.
Other popular sources include pet shops and pet specialty stores (12%) and veterinary practices (6%).
6.4.3 Category and price point breakdown
In contrast to dog food, cat food sales are predominantly wet food, accounting for around two thirds of sales by value and volume. Sales of cat treats and mixers are negligible.
Table 48: Channels where cat owners purchase cat food
Channel Any purchases Most purchases
Supermarket 85% 77%
Pet shop/pet specialty store 25% 12%
Veterinary practice 15% 6%
Butcher 7% 1%
The internet/online 4% 1%
Other 2% 1%
None of the above 2% 2%
Source: Galaxy Research, 2013
PET OWNERSHIP IN AUSTRALIA 201358
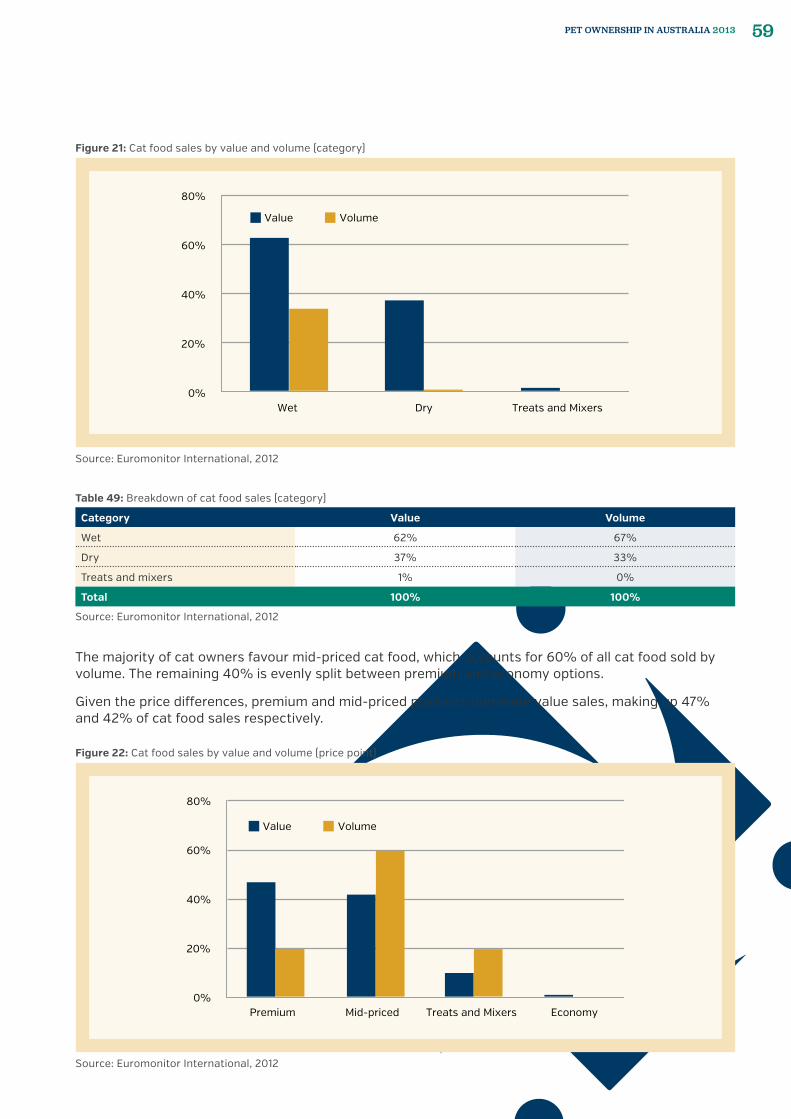
The majority of cat owners favour mid-priced cat food, which accounts for 60% of all cat food sold by volume. The remaining 40% is evenly split between premium and economy options.
Given the price differences, premium and mid-priced products dominate value sales, making up 47% and 42% of cat food sales respectively.
Table 49: Breakdown of cat food sales (category)
Category Value Volume
Wet 62% 67%
Dry 37% 33%
Treats and mixers 1% 0%
Total 100% 100%
Source: Euromonitor International, 2012
0%
20%
40%
60%
80%
Wet Dry Treats and Mixers
VolumeValue
Figure 21: Cat food sales by value and volume (category)
Source: Euromonitor International, 2012
0%
20%
40%
60%
80%
Premium Mid-priced Treats and Mixers Economy
VolumeValue
Figure 22: Cat food sales by value and volume (price point)
Source: Euromonitor International, 2012
PET OWNERSHIP IN AUSTRALIA 2013 59

Table 50: Breakdown of cat food sales (price point)
Price point Value Volume
Premium 47% 20%
Mid-priced 42% 60%
Economy 10% 20%
Treats and mixers 1% 0%
Total 100% 100%
Source: Euromonitor International, 2012
6.4.4 Cat food brands
Australia’s leading pet food manufacturer, Mars, dominates the cat food market with its well-known brands including Whiskas, Optimum and Dine. For the past five years, Mars has held almost half the value share of the cat food market. The Whiskas brand is the most popular, making up 32% of all cat food sold in 2011 (Euromonitor International, 2012).
Nestle Purina held a 25% market share in 2011. Similar to Mars, the company has broad retail distribution, with product offerings at various price points. The company’s most successful brands are Purina Gourmet and Purina Friskies. Nestle Purina is well represented in the premium segment, leading both the wet and dry cat food categories (Euromonitor International, 2012).
Pet owners’ preference for single serve options resulted in strong multipack sales of Dine, which saw the brand seize market share from Nestle Purina’s Fancy Feast. Nestle Purina responded in late 2011 by launching its own multi-pack offering.
6.4.5 Private label
Private label cat food saw a 0.4% increase in value share in 2011 and accounted for 8.8% of all sales by value. In the cat food market, the sophistication of private label products is also increasing. Products include specific health and wellness claims and are segmented by age – kitten, mature and senior.
6.4.6 Prepared versus non-prepared cat food
Over the past five years cat owners have increasingly taken advantage of the convenience of prepared cat food. On average, prepared cat food makes up around two-thirds of a cat’s diet.
6.5 OTHER PET FOOD
6.5.1 Summary
It is estimated that pet owners currently spend $333 million a year on food for fish, birds and other pets, such as rabbits, guinea pigs and reptiles. This accounts for 11% of all pet food purchased.
The majority of this is bird food, valued at around $202 million. Expenditure on fish food is estimated to be around $82 million, with $49 million spent on food for other types of pets.
Table 51: Prepared vs non-prepared cat food
2007 2008 2009 2010 2011 2012
Prepared cat food 58.1% 59.7% 61.5% 63.5% 64.4% 65.2%
Non-prepared cat food 41.9% 40.3% 38.5% 36.5% 35.6% 34.8%
Total cat food 100.0% 100.0% 100.0% 100.0% 100.0% 100.0%
Source: Euromonitor International, 2012
PET OWNERSHIP IN AUSTRALIA 201360

Table 52: Channels where bird owners purchase bird food
Channel Any purchases Most purchases
Supermarket 61% 48%
Pet shop/pet specialty store 53% 35%
The internet/online 5% 2%
Veterinary practice 5% 1%
Other 12% 10%
None of the above 3% 3%
Source: Galaxy Research, 2013
Table 53: Channels where fish owners purchase fish food
Channel Any purchases Most purchases
Pet shop/pet specialty store 51% 42%
Supermarket 50% 43%
The internet/online 7% 5%
Veterinary practice 2% 1%
Other 2% 2%
None of the above 7% 7%
Source: Galaxy Research, 2013
People who keep fish are equally likely to buy fish food from the supermarket or a specialty pet store.
6.5.3 Products and brands
Bird food products are very similar to what birds would eat in the wild. Segmentation in this category has seen offerings targeted to different species. A number of products promote calcium as a key ingredient as it is beneficial for birds’ beaks.
Mars Australia has a 36% share of the bird food market through its three brands, Trill (25%), Harmony (8%) and Golden Cob (3%). Private label bird food holds significant value share in the category, with Woolworths’ Homebrand the second biggest selling brand at 20%. Other private label brands make up another 19% of the market (Euromonitor International, 2012).
Fish food comes in a few different formats, including granules, flakes and bottom feeders, with some differentiation for different fish types such as goldfish and tropical fish.
As with bird food, small mammal and reptile food products are quite similar to what animals would eat in the wild and do not include any fortified offerings. This makes private label and economy products more attractive. Spectrum Brands Inc, with its popular Tetra brand, has a 29% value share of the fish food market (Euromonitor International, 2012).
Australian owned company Peters Pure Animal Foods was established 20 years ago and for the past 10 years has held around a one third value share in the small mammal and reptile pet food market (Euromonitor International, 2012).
6.5.2 Channels
Although supermarkets (48%) are the most common place to buy bird food, bird owners are far more likely to buy pet food from a pet shop or specialty store (35%) than dog or cat owners.
PET OWNERSHIP IN AUSTRALIA 2013 61

7 PET CARE PRODUCTS
PET OWNERSHIP IN AUSTRALIA 201362

7.1 SummaryPet owners are currently estimated to spend $1.6 billion on pet products and accessories a year. The majority of this expenditure, $976 million, is on healthcare products. The remaining $673 million is on other pet products and accessories.
For the purpose of this report, pet care products are split into ‘healthcare products’ (including tick and flea treatments, worming treatments, and supplements) and ‘products and accessories’ (including food bowls, leads, cat litter trays, and grooming items).
Although Australia’s economy has fared well through the global financial crisis and ensuing instability in Europe and the United States, confidence in Australia has taken a hit. However, despite weaker consumer confidence, pet owners have not been prepared to compromise or economise on pet care (Euromonitor International, 2012).
The dominant channel for purchasing pet products is supermarkets (44%), followed by pet shops or specialty stores (39%).
Table 54: Channels where the majority of pet care products are purchased
Distribution channel Percentage
Supermarket 44%
Pet shop/pet specialty store 39%
The internet/online 5%
Veterinary practice 4%
Pharmacy 1%
Other 3%
None of the above 3%
Total 100%
Source: Galaxy Research, 2013
Figure 23: Channels where the majority of pet care products are purchased
Supermarket 44%Pet shop/pet specialty store 39%
The internet/online 5%
Veterinary practice 4%
Pharmacy 1%
Other 3%
None of the above 3%
Source: Galaxy Research, 2013
PET OWNERSHIP IN AUSTRALIA 2013 63

7.2 PET HEALTHCARE PRODUCTS
7.2.1 Trends
Advances in pet healthcare over recent decades have enabled pet owners to ensure their dogs and cats are free of both internal and external parasites. Over time this has seen the domain of companion animals shift from outside to inside the home, helping them to become integral in the lives of most Australians.
Companion animals are now considered to be members of the family and as such pet owners place great importance on their health and wellbeing.
To keep pets in good physical condition and maximise their longevity, pet healthcare products have become an important and necessary expense for pet owners. The most common products are flea and tick treatments, worming tablets for internal parasites and, increasingly, dietary supplements.
Dietary supplementsDietary supplements usually target a specific condition, such as osteo-support. Due to the specific nature of these products, and their measured and targeted doses, their popularity does not seem to be materially impacted by the sale of fortified pet food. It is estimated that expenditure on dietary supplements has grown by 83% in current value terms over the past ten years (Euromonitor International, 2012).
Increased longevity Pets are also living longer lives (Chan, 2013), with their owners prepared to pay for expensive treatments and surgeries, where necessary, to keep them healthy for longer. This may also include veterinary prescribed medicines or healthcare products.
Pet obesity There is another, although contrary, trend that is also leading to increased expenditure on healthcare products – pet obesity. As the waistline of the average Australian has expanded, so too have their pets’. Today, more than 41% of dogs and more than 32% of cats are estimated to be clinically overweight or obese (Hill’s, 2013).
As is the case with humans, carrying additional weight poses a significant danger to pets’ health, increasing the risk of serious diseases like diabetes mellitus, hypertension, heart disease, and painful osteoarthritis (Hill’s, 2013).
7.2.2 Healthcare product and veterinary medicine manufacturing
The vast majority of healthcare products and veterinary medicines for companion animals are manufactured by ten veterinary chemical companies in Australia. Many of these are part of larger international companies that manufacture human healthcare products and medicines.
These companies are Bayer Australia Animal Health, Boehringer-Ingelheim, Elanco Animal Health, MSD Animal Health, Merial Australia, Novartis Animal Health Australasia, Zoetis (formerly Pfizer) Animal Health, Virbac Australia, Troy Laboratories Australia, and Jurox.
While the range of products available to manage health related problems, disease and illness are extensive, ten product categories account for 97% of all products sold by manufacturers. Parasiticides for dogs and cats dominate this group, making up nearly three quarters (72%) of all products sold by manufacturers.
PET OWNERSHIP IN AUSTRALIA 201364

Parasiticides include treatments for external parasites such as fleas and ticks; internal parasites such as heartworms, roundworms, hookworms and tapeworms; and treatments for both internal and external parasites.
Australia’s environmental and climatic conditions are very well suited to a wide range of internal and external parasites, many of which are also carried by native species. Common parasites include paralysis ticks and heartworms, which can be deadly.
As a result, the risk and likelihood of pets being infested or affected by parasites in Australia is much higher than in other parts of the world. Pet owners value the health and well-being of their pets, which is why parasiticides make up such a high proportion of all healthcare products sold.
Table 55: Manufacturer sales of healthcare products
Product category $ Million – 2010 $ Million – 2011 $ Million – 2012
Parasiticides – External 100.2 96.2 95.0
Parasiticides – Combined 59.7 62.4 68.2
Parasiticides – Internal 55.8 53.6 59.6
Vaccines and antisera 38.3 41.1 42.8
Antibiotics 10.4 10.9 11.5
Non-steroidal anti-inflammatories (NSAIDs) 9.2 9.2 8.8
Cardiovascular 6.2 6.3 6.5
Dermatological 3.4 3.3 2.9
Aural preparations 1.9 2.0 2.2
Sedatives & anaesthetics 1.5 1.5 2.0
Other healthcare products* 6.7 8.4 10.2
Total 292.6 294.2 309.4
Source: Animal Health Alliance, 2013Note: * Includes products where the total sales (ex-manufacturer) are $1 million or less a year
Table 56: Manufacturer sales of healthcare products – percentage breakdown
Product category Percentage – 2010 Percentage – 2011 Percentage – 2012
Parasiticides – External 34% 33% 31%
Parasiticides – Combined 20% 21% 22%
Parasiticides – Internal 19% 18% 19%
Vaccines and antisera 13% 14% 14%
Antibiotics 4% 4% 4%
Non-steroidal anti-inflammatories (NSAIDs) 3% 3% 3%
Cardiovascular 2% 2% 2%
Dermatological 1% 1% 1%
Aural preparations 1% 1% 1%
Sedatives & anaesthetics 1% 1% 1%
Other healthcare products* 2% 3% 3%
Grand Total 100% 100% 100%
Source: Animal Health Alliance, 2013Note: * Includes products where the total sales (ex-manufacturer) are $1 million or less a year
PET OWNERSHIP IN AUSTRALIA 2013 65

Eighty-two per cent of parasiticides sold by manufacturers in 2012 were for dogs, compared to 18% for cats. While there are some internal parasite treatments that can be used for dogs or cats, sales are negligible. There is relatively little year on year change in the split of parasiticide sales for dog and cats.
Treatments for external parasites are the largest by value and make up 31% of all products sold my manufacturers. Over the last three years from 2010 to 2012 there has been a 5% decline in the sales of external parasiticides.
Over this same timeframe, sales of combined treatments (for treating both internal and external parasites) and internal parasite treatments increased by 14% and 7% respectively.
Vaccines and antisera are the next largest product category, accounting for 14% of manufacturer product sales. Vaccines enable veterinarians to protect pets against a range of diseases, a number of which can be fatal, even with treatment.
Diseases most commonly vaccinated against in dogs include parvovirus, canine cough, hepatitis and distemper. In cats common diseases that vaccines protect against include feline leukaemia virus, feline enteritis, chlamydophila, feline immunodeficiency virus and feline respiratory disease.
Antibiotics, non-steroidal anti-inflammatories, cardiovascular, dermatological, aural preparations and sedatives and anaesthetics collectively account for just over 10% of all product sales.
Beyond the top ten product categories, the range of products available for the treatment of other conditions is broad. These products include treatments for behavioural problems, corticosteroids, and nutrition and metabolism products. The other healthcare categories listed in Table 59 each account for around $1 million or less in sales (ex-manufacturer) a year.
Table 57: Manufacturer sales of parasiticides
Product category $ Million – 2010 $ Million – 2011 $ Million – 2012
Dogs 175.9 171.9 183.5
Cats 39.1 40 39
Dogs and cats 0.6 0.3 0.3
Total 215.7 212.2 222.8
Source: Animal Health Alliance, 2013
Table 58: Manufacturer sales of parasiticides – percentage breakdown
Product category $ Million – 2010 $ Million – 2011 $ Million – 2012
Dogs 81.6% 81.0% 82.4%
Cats 18.1% 18.9% 17.5%
Dogs and cats 0.3% 0.2% 0.1%
Total 100.0% 100.0% 100.0%
Source: Animal Health Alliance, 2013
PET OWNERSHIP IN AUSTRALIA 201366

Table 59: Manufacturer sales of other healthcare products
Product category $ Million – 2010 $ Million – 2011 $ Million – 2012
Central nervous 0.6 0.8 1.1
Behaviour 0.8 0.9 0.9
Ophthalmic 0.9 0.7 0.7
Nutrition & metabolism 0.7 0.6 0.5
Musculoskeletal 0.4 0.4 0.4
Corticosteroids 0.4 0.4 0.3
Reproduction 0.2 0.2 0.3
Alimentary 0.3 0.3 0.2
Respiratory ~ ~ 0.1
Genitourinary 0.0 0.0 0.0
All other healthcare products 1.7 3.5 5.2
Total 6.7 8.4 10.2
Source: Animal Health Alliance, 2013
Table 60: Consumer expenditure on pet healthcare products
Pet type $ Million Percentage of total Average spend per household
($)
Average spend per animal
($)
Dogs 566 58% 186 133
Cats 307 31% 138 92
Birds 60 6% 58 12
Fish 43 4% 36 4
Total 976 100% 418 241
Source: Animal Health Alliance, 2013
7.2.3 Expenditure
Over the past ten years expenditure on pet healthcare products is estimated to have nearly doubled (Euromonitor International, 2012). In the past year, 95% of dog owners and 89% of cat owners purchased healthcare products for their pets.
Pet owners are estimated to spend $976 million on products ranging from tick and flea treatments to de-worming tablets and dietary supplements.
The majority of healthcare products purchased are for dogs, with expenditure totalling $566 million. This is an average of $186 per dog owning household. Expenditure on healthcare products for cats accounts for almost a third (31%) of the total, at $307 million or an average of $138 per household.
Healthcare expenditure for dogs is remarkably uniform across the country. There is also very little differentiation when it comes to age, city versus regional living, income bracket, dwelling type, breeds or sizes of dogs.
Amongst cat owners there is slightly more variability in expenditure patterns. It is more common for cat owners in Victoria/Tasmania (91%) to purchase healthcare products than those in other states. The figure is lowest in South Australian, where 78% of cat owners purchase healthcare products. Across the generations, 91% of Baby Boomers and 88% of Gen Y cat owners buy healthcare products.
PET OWNERSHIP IN AUSTRALIA 2013 67
7.3 PET PRODUCTS AND ACCESSORIES Pet owners are currently estimated to spend a total of $673 million on pet products and accessories a year.
Households have been spending more on pet products and accessories, which include toys, litter trays, collars, leads and carry cases. In recent years accessories have moved on from being purely functional; for instance there is now a wide range of jewellery for collars and designer clothing for dogs.
For urban pet owners, toys can play an important part in ensuring pets are mentally and physically stimulated (Euromonitor International, 2012). This is most relevant for those living in units or apartments, where dogs and cats are largely or entirely kept indoors. The range of toys for cats and dogs is seemingly endless, including toy mice, plush toys filled with catnip, fake shoe chew toys, braided rope bones, teaser wands and automated interactive laser pointers.
In line with the humanisation trend, it is becoming more common for pet owners to celebrate their pets’ birthdays and buy presents for them at Christmas. Pre-packaged Christmas stockings for dogs and cats are easily purchased online.
The generally high level of disposable income, coupled with owners’ desire to spoil their pets, has seen strong growth in the products and accessories market. Over the past 10 years it is estimated that the market for pet products and accessories (excluding healthcare and cat litter) has grown by 71% in current value terms (Euromonitor International, 2012).
Nestle Purina, through its Total Care brand, is the market leader in pet products and accessories, with a 29% market share in 2011 (Euromonitor International, 2012). However, unlike pet food and healthcare products, there are fewer barriers to entering the pet product and accessory market. Products can be tailored to niche markets, sold online and shipped to customers. In contrast, pet food requires a level of processing, packaging and storage that may be prohibitive to smaller operators. As a result there are a large number of small players active in the pet products and accessories category. Many of these sell their products online or at local markets.
Unlike all other pets, where food accounts for the majority of expenditure, for fish owners it is products and accessories. Fish owning households spend on average $125 a year on tanks, plants, ornaments and decorations, filters, pumps, lights, gravel and stones. This makes up around 47% of the cost of having a fish.
Table 61: Consumer expenditure on pet products and accessories
Pet type $ Million Percentage of total Average spend per household
($)
Average spend per animal
($)
Dogs 283 42% 93 66
Fish 149 22% 125 14
Cats 129 19% 58 39
Birds 112 17% 109 23
Total 673 100% 385 142
Source: Galaxy Research, 2013
PET OWNERSHIP IN AUSTRALIA 201368

7.4 CAT LITTEROver recent decades, advances in animal health and the prevention of transmissible diseases and parasites have seen the domain of cats move from outdoors to inside the home. Today, 92% of cats spend part or all of their time indoors.
At the same time, urbanisation has seen the number and proportion of Australians living in units, apartments, semi-detached houses and townhouses increase (ABS, 2013b).
Although strata restrictions limit pet ownership, these two factors combined to see an increase in the sales of cat litter by 4% in current value terms in 2012 (Euromonitor International, 2012).
Sustainability has become a driving trend in cat litter, with biodegradable and organic products readily available. Some cat litter is flushable and can be disposed of down the toilet.
In the past ten years, expenditure on cat litter increased by 64% to reach an estimated total of $123 million in 2012 (Euromonitor International, 2012).
PET OWNERSHIP IN AUSTRALIA 2013 69

8 PET CARE SERVICES
PET OWNERSHIP IN AUSTRALIA 201370

8.1 SUMMARYThe range of pet care services and number of providers has grown in response to the changing needs of pet owners. As pets have become an important part of the family and cherished companions, their owners have been increasingly prepared to spend sometimes considerable amounts of money to ensure they are happy and healthy.
Pet owners are currently estimated to spend $2.8 billion on pet care services a year. The majority of this expenditure (58%) is on veterinary services. The next largest area of expenditure is clipping and grooming (12%), followed by boarding and minding (9%), and pet insurance (8%).
The rise in popularity of reality television shows has spilt over into the pet care space, with shows dedicated to veterinary practices and animal behaviourists. These shows have raised awareness about pet care and specialist services available including healthcare, grooming, and behavioural training (IBISWorld, 2012).
Table 62: Expenditure on pet care services
Item $ Million Percentage of total
Veterinary services 1,650 58%
Clipping and grooming 351 12%
Boarding and minding 267 9%
Pet insurance 225 8%
Competitions and memberships 154 5%
Training behaviour and therapy 92 3%
Walking 49 2%
Transport 61 2%
Total 2,849 100%
Source: Galaxy Research, 2013
Figure 24: Expenditure on pet care services
Veterinary services 58%
Clipping and grooming 12%
Boarding and minding 9%
Pet insurance 8%
Competitions and memberships 6%
Training behaviour and therapy 3%
Walking 2%
Transport 2%
Source: Galaxy Research, 2013
PET OWNERSHIP IN AUSTRALIA 2013 71

8.2 SERVICE PROVIDERSThe range and number of pet care service providers is growing. As an indication, there are nearly 15,000 service providers listed in the Yellow Pages telephone directory (2013).
8.3 VETERINARY SERVICES
8.3.1 Trends
Increased awareness about animal health issues and responsible pet ownership, coupled with the desire maximise the longevity of pets, is driving demand for veterinary services.
Veterinarians are considered to be the most important source of information about companion animals, therefore fulfilling an important education role for pet owners.
When pet owners were asked what role they felt veterinarians played, 85% said the treatment of sick animals, 70% said to keep pets healthy and 59% said to provide preventative advice.
Table 63: Pet care service providers
Type of service provider NSW VIC QLD SA WA TAS ACT NT Total
Veterinary clinics/surgeries 2,183 1,762 1,626 564 534 160 133 54 7,016
Dog and cat clipping and grooming 924 780 743 282 291 70 73 17 3,180
Dog boarding kennels 498 400 318 146 248 77 23 22 1,732
Cat boarding homes 450 368 311 113 146 67 34 17 1,506
Dog and cat minding – in home 17 13 16 3 6 1 4 ~ 60
Dog breeders 134 99 96 45 48 16 10 2 450
Cat breeders 4 6 20 3 5 1 1 ~ 40
Animal welfare organisations 115 102 104 37 49 24 4 8 443
Bird breeders and dealers 41 37 27 36 13 2 1 1 158
Pet cemeteries, crematoriums and supplies 44 41 51 8 9 7 2 2 164
Pet transport services 57 34 33 7 17 8 2 3 161
Total 4,467 3,642 3,345 1,244 1,366 433 287 126 14,910
Source: Yellow Pages, 2013
Table 64: Role of veterinarians
Role Percentage
Treating them when they are sick 85%
Keeping pets healthy 70%
Preventative advice 59%
None of the above 2%
Total 100%
Source: Galaxy Research, 2013Note: Pet owners may view veterinarians as having a number of roles
PET OWNERSHIP IN AUSTRALIA 201372
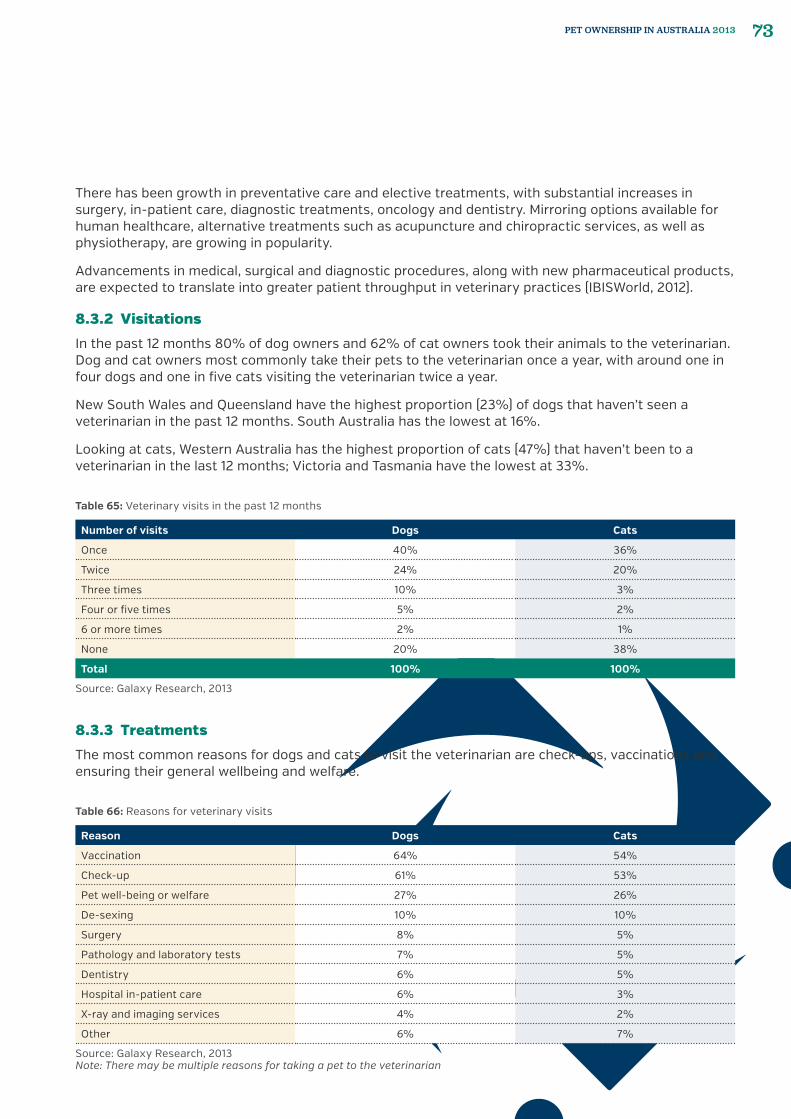
There has been growth in preventative care and elective treatments, with substantial increases in surgery, in-patient care, diagnostic treatments, oncology and dentistry. Mirroring options available for human healthcare, alternative treatments such as acupuncture and chiropractic services, as well as physiotherapy, are growing in popularity.
Advancements in medical, surgical and diagnostic procedures, along with new pharmaceutical products, are expected to translate into greater patient throughput in veterinary practices (IBISWorld, 2012).
8.3.2 Visitations
In the past 12 months 80% of dog owners and 62% of cat owners took their animals to the veterinarian. Dog and cat owners most commonly take their pets to the veterinarian once a year, with around one in four dogs and one in five cats visiting the veterinarian twice a year.
New South Wales and Queensland have the highest proportion (23%) of dogs that haven’t seen a veterinarian in the past 12 months. South Australia has the lowest at 16%.
Looking at cats, Western Australia has the highest proportion of cats (47%) that haven’t been to a veterinarian in the last 12 months; Victoria and Tasmania have the lowest at 33%.
8.3.3 Treatments
The most common reasons for dogs and cats to visit the veterinarian are check-ups, vaccinations and ensuring their general wellbeing and welfare.
Table 65: Veterinary visits in the past 12 months
Number of visits Dogs Cats
Once 40% 36%
Twice 24% 20%
Three times 10% 3%
Four or five times 5% 2%
6 or more times 2% 1%
None 20% 38%
Total 100% 100%
Source: Galaxy Research, 2013
Table 66: Reasons for veterinary visits
Reason Dogs Cats
Vaccination 64% 54%
Check-up 61% 53%
Pet well-being or welfare 27% 26%
De-sexing 10% 10%
Surgery 8% 5%
Pathology and laboratory tests 7% 5%
Dentistry 6% 5%
Hospital in-patient care 6% 3%
X-ray and imaging services 4% 2%
Other 6% 7%
Source: Galaxy Research, 2013Note: There may be multiple reasons for taking a pet to the veterinarian
PET OWNERSHIP IN AUSTRALIA 2013 73

8.3.4 Expenditure
Pet owners are currently estimated to spend $1.7 billion on veterinary services a year.
Lower (less than $100 dollars a year) to mid-range ($100 – $200 per year) expenditure on veterinary services generally indicates normal or routine check-ups or procedures. Households with an annual income of less than $50,000 are more likely to spend nothing or less than $100 a year on veterinary services (for both cats and dogs) than those on higher incomes.
Households with an income of more than $100,000 are most likely to spend between $100 and $200 on veterinary services for their cats. Dog owning households in the same bracket most commonly spend between $200 and $500 per year on veterinary services.
Higher range expenditure ($200 – $2000 for cats and $500 – $2000 for dogs) tends to indicate a health issue requiring additional treatment. Interestingly, income level doesn’t seem to be a discriminating factor when it comes to expenditure in this range, further evidencing the importance and value pet owners place on the lives and health of their pets.
Only when expenditure exceeds $2000 a year are higher income-earning households more likely to bear the cost.
8.4 OTHER PET CARE SERVICES Annual expenditure on other pet care services is estimated to total $1.2 billion.
There are a large number of diverse businesses offering pet care services in Australia. In addition to the well-established services such as clipping and grooming, boarding and minding, dog walking and transport, newer services are also available and increasing in popularity. These include pet insurance, doggy day care, pet fitness classes, burial and cremation, and pet photography.
Generally pet owners living in New South Wales spend the most on other pet care services, with South Australian pet owners spending the least. Across the generations, younger pet owners (Gen Y) spend more on these services than their Gen X or Baby Boomer counterparts.
8.4.1 Dogs
Australians are estimated to have spent $862 million on other pet care services for their dogs in 2012.
The three most popular services accounted for 70% of dog owners’ expenditure in this area.
Table 67: Expenditure on veterinary services
Pet type $ Million Percentage of total Average spend per household
($)
Average spend per animal
($)
Dogs 1,090 66% 358 256
Cats 492 30% 221 147
Birds 69 4% 67 14
Total 1,650 100% 646 417
Source: Galaxy Research, 2013
PET OWNERSHIP IN AUSTRALIA 201374
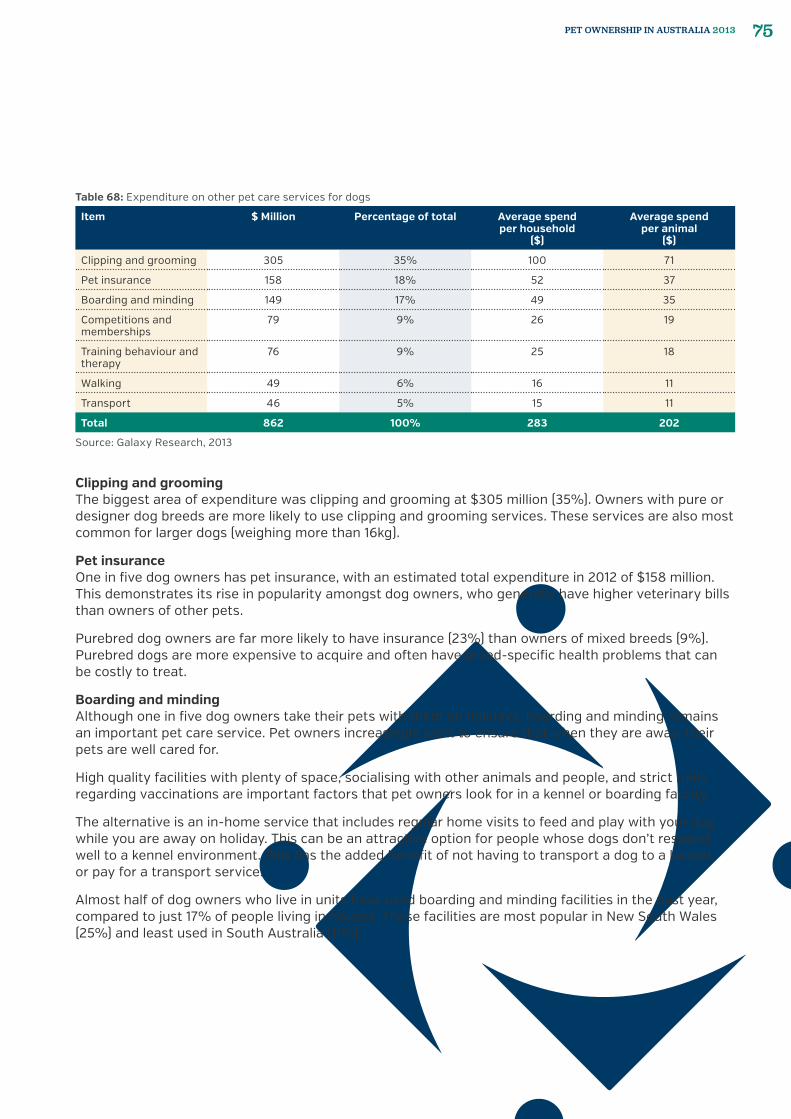
Clipping and groomingThe biggest area of expenditure was clipping and grooming at $305 million (35%). Owners with pure or designer dog breeds are more likely to use clipping and grooming services. These services are also most common for larger dogs (weighing more than 16kg).
Pet insuranceOne in five dog owners has pet insurance, with an estimated total expenditure in 2012 of $158 million. This demonstrates its rise in popularity amongst dog owners, who generally have higher veterinary bills than owners of other pets.
Purebred dog owners are far more likely to have insurance (23%) than owners of mixed breeds (9%). Purebred dogs are more expensive to acquire and often have breed-specific health problems that can be costly to treat.
Boarding and mindingAlthough one in five dog owners take their pets with them on holidays, boarding and minding remains an important pet care service. Pet owners increasingly want to ensure that when they are away, their pets are well cared for.
High quality facilities with plenty of space, socialising with other animals and people, and strict rules regarding vaccinations are important factors that pet owners look for in a kennel or boarding facility.
The alternative is an in-home service that includes regular home visits to feed and play with your dog while you are away on holiday. This can be an attractive option for people whose dogs don’t respond well to a kennel environment. This has the added benefit of not having to transport a dog to a kennel, or pay for a transport service.
Almost half of dog owners who live in units have used boarding and minding facilities in the past year, compared to just 17% of people living in houses. These facilities are most popular in New South Wales (25%) and least used in South Australia (11%).
Table 68: Expenditure on other pet care services for dogs
Item $ Million Percentage of total Average spend per household
($)
Average spend per animal
($)
Clipping and grooming 305 35% 100 71
Pet insurance 158 18% 52 37
Boarding and minding 149 17% 49 35
Competitions and memberships
79 9% 26 19
Training behaviour and therapy
76 9% 25 18
Walking 49 6% 16 11
Transport 46 5% 15 11
Total 862 100% 283 202
Source: Galaxy Research, 2013
PET OWNERSHIP IN AUSTRALIA 2013 75
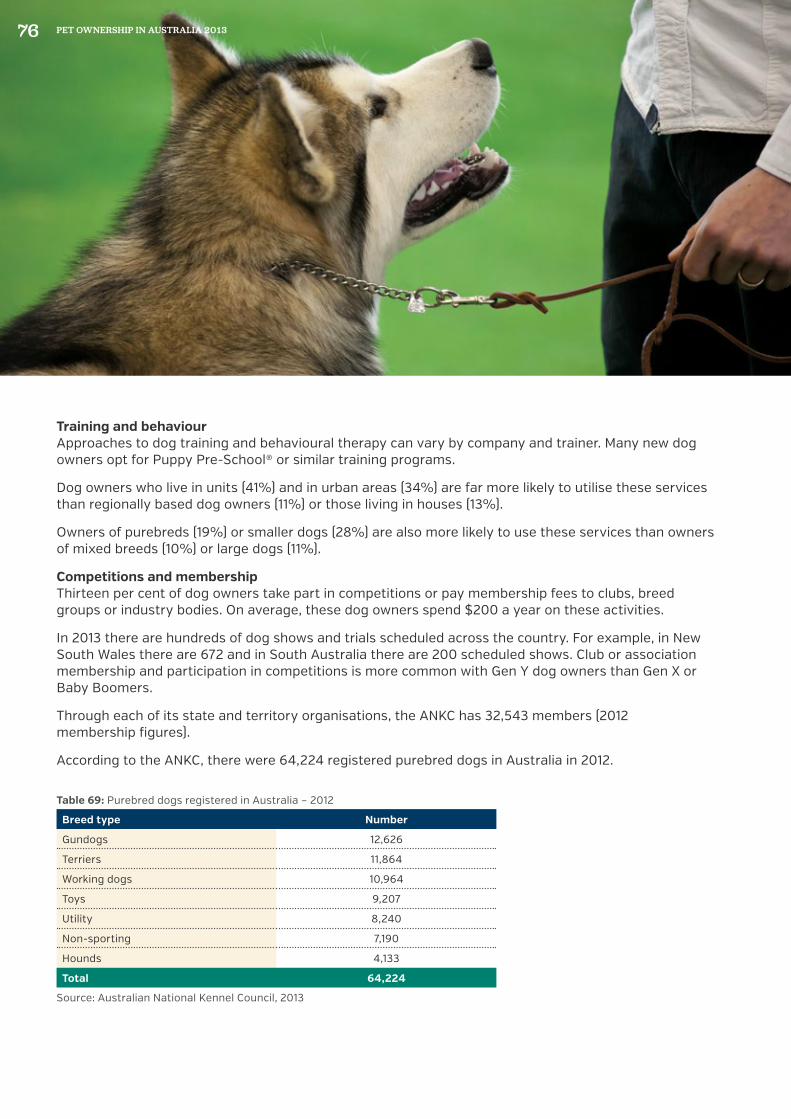
Training and behaviourApproaches to dog training and behavioural therapy can vary by company and trainer. Many new dog owners opt for Puppy Pre-School® or similar training programs.
Dog owners who live in units (41%) and in urban areas (34%) are far more likely to utilise these services than regionally based dog owners (11%) or those living in houses (13%).
Owners of purebreds (19%) or smaller dogs (28%) are also more likely to use these services than owners of mixed breeds (10%) or large dogs (11%).
Competitions and membershipThirteen per cent of dog owners take part in competitions or pay membership fees to clubs, breed groups or industry bodies. On average, these dog owners spend $200 a year on these activities.
In 2013 there are hundreds of dog shows and trials scheduled across the country. For example, in New South Wales there are 672 and in South Australia there are 200 scheduled shows. Club or association membership and participation in competitions is more common with Gen Y dog owners than Gen X or Baby Boomers.
Through each of its state and territory organisations, the ANKC has 32,543 members (2012 membership figures).
According to the ANKC, there were 64,224 registered purebred dogs in Australia in 2012.
Table 69: Purebred dogs registered in Australia – 2012
Breed type Number
Gundogs 12,626
Terriers 11,864
Working dogs 10,964
Toys 9,207
Utility 8,240
Non-sporting 7,190
Hounds 4,133
Total 64,224
Source: Australian National Kennel Council, 2013
PET OWNERSHIP IN AUSTRALIA 201376

Walking Dog owners spend approximately $49 million on dog walking a year. These services are often provided by small or single person operators, who also offer pet minding services.
Just 12% of dog owners use dog walking services; these dog owners are more likely to be men (18%) than women (7%). As might be expected, this service is utilised most by those dog owners who work full time.
Transport Around 13% of dog owners have used transport services in the last year, spending a total of $46 million.
Pet transport is primarily used by people who are going on holiday or moving cities, states or countries. There are currently 161 pet transport service providers listed in the Yellow Pages.
These services are more likely to be used by West Australian dog owners (19%), and those with smaller (16%) or purebred dogs (16%).
National airlines Qantas and Virgin Australia and regional airlines Regional Express and Skywest offer pet transport services.
PET OWNERSHIP IN AUSTRALIA 2013 77

Boarding and mindingOver the past year, 17% of cat owners have used boarding and minding services, spending a total of $118 million, making it the largest area of expenditure when it comes to other pet care services.
These services are most commonly used by cat owners living in units (31% compared to 15% of those living in houses). Just 5% of cat owners in South Australia have used boarding and minding services in the last year, compared to 22% in New South Wales.
Pet insurancePet insurance is also growing in popularity amongst cat owners, making up nearly a quarter of expenditure on other pet care services.
It is most popular in New South Wales, where 17% of cat owners have taken out pet insurance, in contrast to just 4% of South Australian cat owners. Owners of purebred cats (22%) are nearly three times more likely to have insurance than owners of mixed breeds (8%).
8.4.2 Cats
Cat owners are estimated to spend $289 million a year on other pet care services. On average, they spend considerably less on these services than dog owners.
Table 70: Expenditure on other pet care services for cats
Item $ Million Percentage of total
Average spend per household ($)
Average spend per animal ($)
Boarding and minding 118 41% 53 35
Pet insurance 67 23% 30 20
Clipping and grooming 47 16% 21 14
Competitions and memberships 27 9% 12 8
Training behaviour and therapy 16 5% 7 5
Transport 16 5% 7 5
Total 289 100% 130 87
Source: Galaxy Research, 2013
PET OWNERSHIP IN AUSTRALIA 201378
Clipping and groomingFourteen per cent of cat owners used clipping and grooming services in the past year, spending around $47 million.
As might be anticipated, use of these services was far higher with owners of purebred cats (27% compared to mixed breeds at 10%). These services are also far more commonly used in urban areas (28%) than regional areas (5%).
Competitions and membershipsCompared to dog owners, fewer cat owners take part in competitions or are members of clubs, breed groups or fancier associations. In the past year, 9% of cat owners were involved in these activities, spending an estimated $27 million.
Training behaviour and therapyCat owners currently spend around $16 million a year on training, behaviour and therapy services.
Just 8% of cat owners use this service, spending an average of $80 each in the past 12 months.
TransportFewer cat owners use transport services than dog owners, spending a total of $16 million on these services in the past 12 months.
Only 3% of cat owners in Western Australia used transport services in the past year, compared to 13% of Victorian and Tasmanian cat owners, who used these services the most.
PET OWNERSHIP IN AUSTRALIA 2013 79

9 THE HUMAN-COMPANION ANIMAL BOND
PET OWNERSHIP IN AUSTRALIA 201380

9.1 HISTORYFor most of human history, animals have occupied a central position, with links to human emotional and physical health and wellbeing, simple companionship, recreation, economics and in spiritual and cultural traditions.
Companion animals continue to play a significant role in the lives of many Australians today, with 63% of households owning at least one pet.
There is growing research indicating the positive impact that pets can have on human wellbeing, social development and community interactions (Petcare Information and Advisory Service, 2012).
Connecting with animals has been shown to have a positive impact on the emotional and physical health of people of all ages.
Companion animals are also used to improve the wellbeing of people in socially isolating environments, such as hospitals, aged care facilities and prisons. They also have a profound effect on the hearing-and visually-impaired.
9.2 TRUSTED COMPANIONSThe main reason for acquiring a pet is companionship. Many studies have researched the bond between pets and humans and have identified that in some cases, these can be stronger than bonds formed between people (Ferry, 2007). The presence of a pet is often a welcome reprieve from the pressure of work or a busy lifestyle.
In fact 65% of all pet owners consider pets to be more dependable than friends (Galaxy Research, 2013), showing the connection that humans make with companion animals in their care.
Although pets should not be regarded as a replacement for human interaction, animal companionship can have a number of benefits for the owner. Relationships with animals are less subject to emotional burnout or fluctuations and they do not impose a strain or cause concern about continuing stability (McNicholas, et al., 2005).
9.3 PETS AS SOCIAL ENABLERS Not only do pets provide companionship for their owners, they also act as ‘ice-breakers’ and encourage contact and communication between strangers. Research has shown that people are more willing to participate in human to human interactions with a pet owner, and this may promote a feeling of social integration (Ferry, 2007).
In a study conducted by the University of Western Australia, more than 50% of dog owners and 40% of pet owners met people in their neighbourhood as a result of their pet. In addition, 80% of dog owners talked to others when out walking their dogs (Wood, 2009).
Pets are motivators for walking and encouraging people to use parks and outdoor spaces, often helping the owners to feel more involved in a neighbourhood or community through greater social contact.
PET OWNERSHIP IN AUSTRALIA 2013 81

9.4 GENERAL HEALTH BENEFITSNot only do pets encourage us to lead healthier lifestyles, but pet ownership has been found to be significantly correlated with a number of health benefits such as fewer doctor visits, lowered stress and increased social support for individuals (Ferry, 2007).
Increasing evidence also suggests that pet ownership can improve cardiovascular health, with dogs in particular acting as a stimulus for exercise. (Walsh, 2009).
Pet ownership during childhood also encourages physical activity and outdoor exercise. Research shows that children aged 5-6 in a family who own a dog are less likely to be overweight or obese compared with those who do not own a dog. (Timperio et al., 2008)
Studies show that exposure to pets in early childhood may reduce the incidence of allergies linked to asthma and help to strengthen the immune system (Gearn, et al., 2004).
A number of studies focus on the positive impact that pets can have in coping with diseases such as heart disease, dementia, AIDs and cancer (Walsh, 2009). They have also found a correlation between the treatment of chronic disease and the presence of companion animals with respect to the alleviation of depression, loneliness and low morale whilst dealing with the treatment of chronic illness (Walsh, 2009).
It’s been shown that when a pet was introduced into the home of someone suffering from Alzheimer’s (dementia), in three weeks their agitation levels significantly decreased (Wells, 2011).
9.5 MENTAL HEALTHPets can contribute significantly to a reduction in stress and overall improvement in mental health (O’Haire, 2010). Australian research (Straede and Gates, 1993) has found that cat owners have significantly better scores for psychological health than non-pet owners (Petcare Information and Advisory Service, 2012).
For many years it has also been believed that viewing animals in nature can have a calming impact on the watcher. For instance, many doctors’ surgery waiting rooms use aquariums to help calm patients before undergoing surgery (O’Haire, 2010).
9.6 PETS AND FAMILIESA family pet can offer a special kind of companionship for children of all ages. Many studies indicate that the relationship a child has with their pet is among the most important in their life (Melson, 2001). Pets also engender caring and responsibility at an early age.
Family dynamics have been changing with the incidence of single parent families on the rise. Companion animals can fill a void in a person’s life or in a family environment, offering relationships, companionship, familiarity and affection (Ferry, 2007).
PET OWNERSHIP IN AUSTRALIA 201382

9.7 PETS IN EDUCATIONThe presence of companion animals through childhood can assist with cognitive development and help facilitate learning. One study found that when a dog was introduced into classroom activities, the students demonstrated a greater improvement in their independence. (Taylor & Kuo, 2006). Where learning difficulties are present, researchers have also found benefits from interaction with companion animals.
Connections with animals can also assist children in learning about various facets of life or death, and developing responsibility through caring for an animal (Tipper, 2011).
9.8 PETS AND THE ELDERLYWith Australia’s aging population, there is an increasing emphasis on enabling the elderly to stay at home and live independently for as long as possible. Pets can provide a source of companionship, physical contact and an antidote to stress and bereavement (Wood, 2009).
It has been found that the introduction of pets into nursing homes can also help to improve the health and wellbeing of elderly residents (Michaels, 1982).
9.9 THERAPY AND PETSThe practice of using animals for therapy dates back to the 18th century when animals were introduced into mental institutions to help patients with social development during their stay.
In recent times, it is recognised as a formal therapy treatment known as “animal assisted interventions” (O’Haire, 2010) or Animal Assisted Therapy.
A number of child psychologists have researched the use of companion animals in therapy and observed that a pet bond can act as a lifeline for those who are vulnerable, particularly during times of need (Walsh, 2009).
9.10 SERVICE ANIMALSService animals are predominantly dogs and play an important role in many facets of Australian life, including assistance for people with a disability, in the detection of pests and harmful substances, and on farms.
Guide dogs are trained in various ways to enhance the quality of life for people living with blindness or impaired vision by assisting in their achievement of independence through access and mobility (Guide Dogs NSW/ACT, 2013).
Trained detector dogs are used by police in locations such as airports, seaports, mail centres and private courier depots, with 61 currently working in Australia (Australian Customs and Border Protection Service, 2012). They protect Australia from exotic pests and diseases, and assist in locating missing persons, criminals, drugs and explosives.
Australian farmers also use dogs to assist with livestock management and movement around properties.
PET OWNERSHIP IN AUSTRALIA 2013 83

10 EXPLANATORY NOTES
PET OWNERSHIP IN AUSTRALIA 201384

Note: The terms ‘pet’ and ‘companion animal’ are used interchangeably in this report.
Companion Animals: Companion animals or pets are animals, such as dogs or cats that are kept as companions in the home, or in close daily relationships with humans.
Companion animal populations: This report focusses on the ownership of dogs, cats, birds and fish. Consideration is also given to other small mammals and reptiles kept as pets.
Pleasure horses are not included. Working dogs are included where their owners also consider them to be companion animals.
Unless otherwise stated population numbers are for Australian companion animals as per the findings of the Australian Pet Ownership Survey. While pets may fulfil a variety of roles, including ‘guard dog’ or ‘working dog’, if respondents consider them to be pets, they are included in the survey and population figures.
Designer breed: A designer breed is deliberate offspring from two purebred animals of different varieties or breeds.
Dry pet food: Dry pet foods have lower moisture contents than other pet foods and can come in a number of food varieties depending on the companion animal (Euromonitor International, 2012).
Economy pet food: Includes all pet food with an economical price positioning. These products are generally sold in supermarkets, discount outlets and other non-specialist outlets (Euromonitor International, 2012).
Feral, wild or stray populations: This report relates to the ownership of companion animals. Population figures and commentary do not address feral, wild or stray populations of common household pets. Respondents of the Australian Pet Ownership Survey were asked to identify the number of pets in their household; therefore previously stray animals that have been adopted and are now viewed as pets are included.
Households: The number of households is based on the number of occupied private dwellings in Australia as reported in the 2011 Census (ABS, 2013b). This number is 7,760,319.
Human population: The 2011 Census showed there to be 21.5 million people in Australia (ABS, 2013b).
Humanisation: Humanisation occurs when the pet owner increasingly treats their companion animal as a human by paying extra attention to the nutritional and psychological needs of their pet (Knight, 2010).
Mid-priced pet food: Includes all pet food with a price positioning that falls between economy and premium. Such products are typically sold through both pet and specialist outlets, as well as supermarkets, discount outlets and other non-specialist outlets (Euromonitor International, 2012).
Mixed breed: Mixed breed animals differ from other cross-bred animals in that their parentage is undocumented or unknown.
Mixers: The essential function of a mixer in pet food is to make the main meal bulkier. Mixers are created to complement wet pet food types and may have additional benefits such as being good for teeth, although they are not considered a health care or dietary supplementary product (Euromonitor International, 2012).
Ownership rates: The percentage of households that own pets.
PET OWNERSHIP IN AUSTRALIA 2013 85

Pet care products: Items manufactured for use on or by pets, including toys, scratching posts, bowls, litter trays and grooming items.
Pet care services: Includes all pet care services including veterinary services, pet-minding, transport, clipping and grooming and walking.
Pet type: Refers to a species of animal i.e. a dog, cat, etc. as opposed to specific breeds of different species i.e. Labrador, Alsatian, German Shepard, etc.
Premium pet food: Premium pet food products are generally higher priced, or the brand positioning is considered speciality. These are typically available through specialist pet stores and supermarket outlets (Euromonitor International, 2012).
Premiumisation: Refers to pet owners seeking premium pet food options that have a higher price positioning and are branded as premium or high quality.
Private label: Refers to a brand owned by a retailer or supplier, generally a supermarket chain, (as opposed to a producer or manufacturer), with its own label, that gets its goods made by a contract manufacturer.
Private dwelling: As defined by the ABS, a private dwelling is a structure which is intended to have people live in it, and which is habitable on Census Night. Some examples of dwellings are houses, motels, flats, caravans, prisons, tents, humpies and houseboats (ABS, 2013a).
Pure breed: Purebred animals refer to companion animals that have been bred from parents of the same breed or variety and have unmixed lineage in their pedigree strain.
Regional: Those areas not considered metropolitan areas.
States and territories surveyed: Due to the relatively small number of households in the Australian Capital Territory and Tasmania, these have been included as part of New South Wales and Victoria respectively. The Northern Territory represents around 0.8% of the total number of Australian households, which would not materially impact the survey findings. For this reason, the Northern Territory is not included in the survey.
Suburban: Residential areas located on the outskirts of a metropolitan area.
Treats: Products marketed and fed not as a main meal, but more as a reward or indulgence. They include chocolate flavoured, meat, biscuit, cereal, milk, fish or yeast –based products (Euromonitor International, 2012).
Units and apartments: The Australian Pet Ownership survey groups units and apartments as one accommodation type.
Urban: Residential areas surrounding a city.
Wet pet food: Wet pet food products have a moisture content of 60-85% and are generally (not always) preserved by heat treatment. Wet pet food is packaged in steel or aluminium cans, rigid or flexible plastic, or semi-rigid aluminium trays (Euromonitor International, 2012).
Working dogs: Working dogs are included in this report where their owners consider them to also be companion animals. This may include assistance or guide dogs.
PET OWNERSHIP IN AUSTRALIA 201386

PET OWNERSHIP IN AUSTRALIA 2013 87

11 REFERENCES & SOURCES
PET OWNERSHIP IN AUSTRALIA 201388

American Pet Products Association (2009). Industry Statistics and Trends. Retrieved 10 September 2009, from www.americanpetproducts.org/press_industrytrends.asp
American Pet Products Association (2013). Industry Statistics and Trends. Retrieved 11 February 2013, from www.americanpetproducts.org/press_industrytrends.asp
Animal Health Alliance (Australia) (2013). Manufacturer sales of healthcare products.
Australian Bureau of Statistics (2013a). 2011 Census Dictionary. Retrieved 5 April 2013, from http://www.abs.gov.au/ausstats/[email protected]/Lookup/2901.0Chapter29702011
Australian Bureau of Statistics (2013b). 2011 Census QuickStats. Retrieved 4 February 2013, from http://www.censusdata.abs.gov.au/census_services/getproduct/census/2011/quickstat/0
Australian Companion Animal Council (2002). Renting with pets: A tenant’s guide. Retrieved from http://www.acac.org.au/pdf/renting_tenantguide.pdf
Australian Companion Animal Council (2006). Contribution of the pet care industry to the Australian Economy, 6th Edition.
Australian Companion Animal Council (2010). Contribution of the pet care industry to the Australian Economy, 7th Edition.
Australian Customs and Border Protection Service (2012). Detector Dog Program. Retrieved 23 July 2013, from www.customs.gov.au/site/page4241.asp
Australian National Kennel Council (2013). Membership statistics 1995-2012. Retrieved 14 March 2013, from http://www.ankc.org.au/National-Membership-Statistics.aspx
Australian National Kennel Council (2013). National Registration Analysis 1986-2012. Retrieved 14 March 2013, from http://www.ankc.org.au/National-Registration-Statistics.aspx
Barrett, C. (2011). Australia and the Great Recession. Retrieved 1 May 2013, from http://www.percapita.org.au/_dbase_upl/Australia%20and%20the%20Great%20Recession.pdf
Central Intelligence Agency – United States of America (2013) The World Factbook – Australia-Oceania :: Australia. Retrieved 1 May 2013, from https://www.cia.gov/library/publications/the-world-factbook/geos/as.html
Chan, J. (2013). Growing older gracefully – Senior Pets. Retrieved 9 April 2013, from http://dogshome.com/senior-pets/
Department of Local Government New South Wales (2013). Companion Animals Frequently Asked Questions: Microchipping and lifetime registration. Retrieved 18 February 2013, from http://www.dlg.nsw.gov.au/DLG/Documents/information/CA_FAQ.pdf
Department of Primary Industries Victoria (2013). Microchip for Life! Retrieved 18 February 2013, from http://www.dpi.vic.gov.au/pets/pet-care/microchipping
Euromonitor International (2012). Pet Care in Australia.
The European Pet Food Industry (FEDIAF ) (2013). Facts and Figures 2010. Retrieved 9 April 2013, from http://www.fediaf.org/fileadmin/user_upload/facts_and_figures_2010.pdf
Ferry, L. A. (2007). Adult Pet Attachments. ProQuest Information and Learning Company.
Gearn, J., Reardon, C., Hoffjan, S., & Nicolae, D. &. (2004). Effects of dog ownership and genotype on immune development and atopy in infancy. The Journal of Allergy and Clinical Immunology, 113(2), 307-314.
Guide Dogs NSW/ACT. (2013). Guide Dogs. Retrieved February 2013, from Guide Dogs NSW/ACT: http://www.guidedogs.com.au/guide-dogs
Hill’s (2013). PetFit: Facts about overweight pets. Retrieved 9 March 2013, from http://petfit.hillspet.com.au/Public/AboutPetFit.aspx
IBISWorld (2012). Industry Report: (X0011) Household pet products and services in Australia.
Knight, S. (2010). The increasing ‘humanisation’ of our pets. Financial Times Magazine. Retrieved 23 July 2013 from http://www.ft.com
Michaels, E. (1982). Pets and the elderly: a therapeutic friendship. CMA Journal, 127, 70-71.
McNicholas, J., Gilbey, A., Rennie, A., Ahmedzai, S., Dono, J.-A., & Ormerod, E. (2005). Pet ownership and human health: a brief review of evidence and issues. BMJ, 331(7527), 1252-1254.
Melson, G. F. (2001). Why the Wild Things Are? Animals in the Loves of Children. USA.
National Desexing Network (2013). Benefits of desexing. Retrieved 18 March 2013, from
PET OWNERSHIP IN AUSTRALIA 2013 89

http://www.ndn.org.au/benefits-of-desexing.html
New Zealand Companion Animal Council (2011). Companion Animals in New Zealand.
O’Haire, M. (2010). Companion animals and human health: Benefits, challenges and the road ahead. Journal of Veterinary Behaviour, 5, 226-234.
Office for National Statistics (United Kingdom) (2013). 2011 UK censuses. Retrieved 6 February 2013, from http://www.ons.gov.uk/ons/guide-method/census/2011/uk-census/index.html
Pet Food Manufacturers Association (2012) Annual Report 2012. Retrieved from http://www.pfma.org.uk/_assets/images/general/file/Annual%20Report%202012%20Final.pdf
Pet Food Manufacturers Association (2013a). Pet population. Retrieved 6 February 2013, from http://www.pfma.org.uk/pet-population/
Pet Food Manufacturers Association (2013b). Pet population 2008 to 2011. Retrieved 12 February 2013, from http://www.pfma.org.uk/pet-population-2008-2011/
Pet Food Manufacturers Association (2013c). The recession and your pets. Retrieved from http://www.pfma.org.uk/survey/the-recession-and-your-pets/
Pet Industry Association of Australia (2008), National Code of Practice. Retrieved from https://piaa.net.au/.../contact/Pet-Industry-Association-COP-08.pdf/
Petcare Information and Advisory Service. (2012). Pets and Community Health: How do companion animals help improve the lives of people? Research Summary.
Royal Society for the Prevention of Cruelty to Animals (2013a). Desexing. Retrieved 18 February 2013, from http://www.rspca.org.au/how-you-can-help/campaigns/desexing.html
Royal Society for the Prevention of Cruelty to Animals (2013b). Is microchipping mandatory for cats and dogs? Retrieved 18 February 2013, from http://kb.rspca.org.au/Is-microchipping-mandatory-for-cats-and-dogs_287.html
Royal Society for the Prevention of Cruelty to Animals (2013c). RSPCA Australia National Statistics 2011-2012. Retrieved from http://www.rspca.org.au/assets/files/Resources/AnnualStatistics/RSPCA%20Australia%20National%20Statistics%202011-2012.pdf
Royal Society for the Prevention of Cruelty to Animals New South Wales (2013). Owning a pet – Costs. Retrieved 9 April 2013, from http://www.rspcansw.org.au/education/pet_care/owning_a_pet/costs
Straede, C.M. & Gates, G.M. (1993). Psychological health in a population of Australian cat owners. Anthrozoos, 6(1), 30-42
Statistics New Zealand (2013). QuickStats About New Zealand’s Population and Dwellings (2006 Census). Retrieved 6 February 2013, from http://www.stats.govt.nz/Census/2006CensusHomePage/QuickStats/quickstats-about-a-subject/nzs-population-and-dwellings/population-counts.aspx
Taylor, A. F., & Kuo, F. E. (2006). Is contact with nature necessary for healthy child development? State of the evidence. In C. Spencer, & M. Blades, Children and their environments (pp. 124-140). Cambridge, UK: Cambridge University Press.
Timperio, A, Salmon, J, Chu. B and Andrianopoulos, N. (2008), Is dog ownership or dog walking associated with weight status in children and their parents? Health Promotion Journal of Australia. 19(1): 60-63
Tipper, B. (2011). ‘A dog who I know quite well’: everyday relationships between children and animals. Children’s Geographies, 9(2), 145-165.
Tourism New South Wales (2013). Pets rule in New South Wales. Retrieved from http://archive.tourism.nsw.gov.au/Sites/SiteID6/objLib20/PetsRuleInNSW.pdf
United States Census Bureau (2013). State & County QuickFacts – Population, 2012; Households, 2007-2011. Retrieved 6 February 2013, from http://quickfacts.census.gov/qfd/states/00000.html
Walsh, F. (2009). Human-Animal Bonds 1: The Relational Significance of Companion Animals. Family Process, 48(4), 462-480.
Wells, D. (2011). The value of pets for human health. The Psychologist, 24(3), 172-176.
Wood, D. L. (2009). Living Well Together: How Companion Animals can help Strengthen Social Fabric. University of Western Australia: Petcare Information & Advisory Service Pty Ltd and the Centre for the Built Environment and Health (School of Population Health).
Yellow Pages (2013). Pet services search (various). Retreived March 2013 from http://www.yellowpages.com.au
PET OWNERSHIP IN AUSTRALIA 201390

Member companies of the Animal Health Alliance (Australia)
TROY LOGO to be supplied
Is there an EPS version available?
PET OWNERSHIP IN AUSTRALIA 2013 91
Animal Health Alliance (Australia) Ltd www.animalhealthalliance.org.au Level 2 AMP Building, 1 Hobart Place, Canberra ACT 2601 Email: [email protected] +61 (2) 6257 9022