Embed Size (px)
Citation preview
PETERHEAD CCS PROJECT FRONT MATTER
Doc. no.: PCCS-05-PT-ZG-0580-00001-Initial In Place Volumes Estimate Revision:K02
The information contained on this page is subject to the disclosure on the front page of this document. iv
PPeetteerrhheeaadd CCCCSS PPrroojjeecctt
Doc Title: -Initial In Place (IIP) Volumes Estimate Report
Doc No. PCCS-05-PT-ZG-0580-0001 Date of issue: Revision:
12/09/2014 K02
DECC Ref No: 11.119 Knowledge Cat: KKD-Subsurface
KEYWORDS Goldeneye, CCS, Static Model, Full field simulation model, CO2, Petrel, MoReS, Initially in-place volumes, Stochastic model.
Produced by Shell U.K. Limited ECCN: EAR 99 Deminimus
© Shell U.K. Limited 2014. Any recipient of this document is hereby licensed under Shell UK Limited's copyright to use, modify, reproduce, publish, adapt and enhance this document.
Important Notice Information provided further to UK CCS Commercialisation Programme (the “Competition”)
The information set out herein (the “Information”) has been prepared by Shell U.K. Limited and its sub-contractors (the “Consortium”) solely for the Department of Energy & Climate Change in connection with the Competition. The Information does not amount to advice on CCS technology or any CCS engineering, commercial, financial, regulatory, legal or other solutions on which any reliance should be placed. Accordingly, no member of the Consortium makes (and the UK Government does not make) any representation, warranty or undertaking, express or implied, as to the accuracy, adequacy or completeness of any of the Information and no reliance may be placed on the Information. Insofar as permitted by law, no member of the Consortium or any company in the same group as any member of the Consortium or their respective officers, employees or agents accepts (and the UK Government does not accept) any responsibility or liability of any kind, whether for negligence or any other reason, for any damage or loss arising from any use of or any reliance placed on the Information or any subsequent communication of the Information. Each person to whom the Information is made available must make their own independent assessment of the Information after making such investigation and taking professional technical, engineering, commercial, regulatory, financial, legal or other advice, as they deem necessary.

PETERHEAD CCS PROJECT FRONT MATTER
Doc. no.: PCCS-05-PT-ZG-0580-00001-Initial In Place Volumes Estimate Revision:K02
The information contained on this page is subject to the disclosure on the front page of this document. v
Table of Contents EXECUTIVE SUMMARY 1 1. INTRODUCTION 2 2. OBJECTIVES 2 3. STATIC VOLUMES 3
3.1. Static in-place volume calculation 3 3.2. Factors controlling in-place volumes 4 3.3. Stochastic IIP volume assessment 5
4. DYNAMIC VOLUMES 9 4.1. In-place volumes from upscaled SRM 9
5. CONCLUSIONS 12 6. GLOSSARY OF TERMS 13 7. GLOSSARY OF UNIT CONVERSIONS & WELL NAMING 13
List of Tables Table 3-1—GIIP calculated from each of the suite of SRMs generated for the Goldeneye
carbon capture and storage (CCS) project, classified by zone. 3 Table 3-2—GIIP & STOIIP probability for the Captain Sandstone reservoir based on 381 runs
of the production team model. 5 Table 4-1—Equivalent quantities in SRM and FFSM. Gross Bulk Volume (GBV) 9 Table 7-1: Unit Conversion Table 13 Table 7-2—Well name abbreviations 14
Table of Figures Fig. 3-1—Tornado plot showing impact of three key uncertainties addressed by the suite of
SRMs created for the Goldeneye CCS project 4 Fig. 3-2—Reservoir zonation uncertainties. Well paths projected onto lines of section. Fluid
contacts extended for clarity. 6 Fig. 3-3—Well locations and uncertainties. 7 Fig. 3-4—GIIP probability distribution based on 381 runs of the production team model 8 Fig. 4-1—Comparison of different volumes calculated from SRM3.1 in (Petrel), during initial
import into dynamic simulator and after upscaling (Reduce upscaled/MoReS).10 Fig. 4-2—Comparison of GIIP calculated from SRM3.1 in (Petrel) and FFSM (MoReS) 11
PETERHEAD CCS PROJECT 0.Executive summary
Doc. no.: PCCS-05-PT-ZG-0580-00001-Initial In Place Volumes Estimate Revision:K02
The information contained on this page is subject to the disclosure on the front page of this document. 1
Executive summary The objective of this report is to document the range of Initially-In-Place (IIP) hydrocarbon volumes indicated by the suite of static models created to investigate the suitability of the Goldeneye field for CO2 sequestration for the Peterhead CCS Project. A second objective is to demonstrate the robustness of the upscaling process from the static model suite to the dynamic Full Field Simulation Model suite by comparing the IIP volumes in both. The volumes provide input to the derivation of CO2 storage capacity for the Goldeneye site. The storage capacity is documented for the project in the Dynamic Modelling (Full Field Modelling) report. There has been no change from the Longannet CCS Project version of this report save for a refocusing and minor improvements to its clarity. Initially in-place hydrocarbon volumes were calculated for the entire suite of Static Reservoir Models (SRMs). The Gas Initially In-Place (GIIP) volumes derived from the model suite have a range between 706 and 792 Bscf, [19.99 x10⁹ m3 and 22.43 x10⁹ m3] which all fall within the probabilistic P15 to P85 expectation range from the field calculated in the late stage of field life by the Goldeneye asset production team (705 and 799 Bscf, respectively [19.96 x10⁹ m3 and 22.63 x10⁹ m3]). They additionally compare with the in-place volume indicated by production data gathered from the field to end of field life. From this it is possible to say that the range of scenarios created for exploring CCS potential are representative of the field. Three sensitivities expected to have an impact on the behaviour of CO2 in the Full Field Simulation Model (FFSM) were investigated with the SRM suite of models. Of the three, the internal reservoir zonation has the greatest volumetric impact (-9.6% to +4.8%, when compared to the production team’s base case model – SRM1), the position of the northern stratigraphic pinchout has the next largest impact (-5.3% to +1.2%), and the angle of dip of the western flank of the field has the least effect, leading to a maximum in-place volume reduction of only 1.5%. As a quality assurance/quality control step, one of the SRMs has been upscaled into the dynamic simulator and IIP volumes from this FFSM have been compared with the source SRM. A comparison of these showed only small variations in hydrocarbon volumes in the two realisations of the model (3.25%), due to differences in resolution between the two. The models are, therefore, deemed suitable for dynamic simulation and history matching to observed production data. Note: none of the figures included in this report should be interpreted, in any way, as statements pertaining to SEC (Securities and Exchange Commission) compliant proved or expectation reserves or scope for recovery.

PETERHEAD CCS PROJECT 1.Introduction
Doc. no.: PCCS-05-PT-ZG-0580-00001-Initial In Place Volumes Estimate Revision:K02
The information contained on this page is subject to the disclosure on the front page of this document. 2
1. Introduction A suite of SRMs has been built to allow the investigation of CO2 injection and sequestration performance of the Goldeneye reservoir1. Using the hydrocarbon saturation model designed for the field, IIP hydrocarbon volumes have been calculated for each realisation of the field. This allows for the assessment of each scenario against the same volume calculations derived from the previous production team realisations of the field (which includes a stochastic distribution) as well as the in-place volume indicated by the production data gathered from the field. Finally, an estimate of in-place volumes, combined with the volume of recovered hydrocarbons, will contribute to the estimation of pore space voidage and, hence, to the storage capacity calculation and the volume of hydrocarbon that remains present in the structure post-cessation of production. It is key to note that this is storage in a depleted hydrocarbon field. As such, the storage volume is more defined and determined by the accurately known produced hydrocarbon volume than by the rock volume uncertainty. Where the original volumes do play a part, however, assessment of the volume of remaining, unproduced hydrocarbons will allow for fluid mixing to be taken into account when modelling refill efficiency. Reference to third party software in this document is solely for informational purposes to assist in understanding how the work was completed, and does not amount to an endorsement of that software nor is any warranty as to its suitability given or implied. There has been no change from the Longannet CCS Project version of this report save for a refocusing and minor improvements to its clarity with an addition of an expanded Executive Summary.
2. Objectives The objective of this report is to document the range of IIP hydrocarbon volumes indicated by the suite of static models created to investigate the performance of CO2 sequestration in the Goldeneye field and to demonstrate the robustness of the upscaling process from the SRM to the FFSM by comparing the IIP volumes in both. This report is not intended to be an estimate for the ultimate storage capacity of the Goldeneye field with respect to CO2. This estimate will only be done when the FFSM has been calibrated and has been operated in prediction mode. Similarly, the agreement between IIP volumes measured from the static (and derived dynamic) reservoir models with IIP volumes indicated by historical production data will only be assessed once the dynamic model is successfully ‘history matched’. This analysis will be reported out in the storage development plan 2. Also, this report is not intended to be used for determination of proved or expected reserves, or scope for recovery.
1 PCCS-05-ZG-0580-00004 - Static Model Field Report, Key Knowledge Deliverable 11.108. 2 Shell 2013, Peterhead CCS Project Storage Development Plan, PCCS-00-PT-AA-5726-00001, Key Knowledge Deliverable 11.128

PETERHEAD CCS PROJECT 3.Static Volumes
Doc. no.: PCCS-05-PT-ZG-0580-00001-Initial In Place Volumes Estimate Revision:K02
The information contained on this page is subject to the disclosure on the front page of this document. 3
3. Static Volumes Seven SRMs have been created as initial input to the FFSM of CO2 sequestration performance within the Goldeneye field. These are labelled SRM1, SRM2.0, SRM2.1, SRM2.2, SRM2.25, SRM3.0 and SRM3.1. The specific inputs to each model and the specific uncertainties they are intended to address are fully reported in a previous document3. Note: Volumes reported in 109 standard cubic feet (scf) except where noted. shows the calculated GIIP volumes for each of the models produced. The oil rim has been excluded from this calculation.
Table 3-1—GIIP calculated from each of the suite of SRMs generated for the Goldeneye carbon capture and storage (CCS) project, classified by zone.
SRM1 SRM2.0 SRM2.1 SRM2.2 SRM2.25
SRM3 SRM3.1
GIIP (Captain) 765 706 797 768 792 728 773 GIIP (109 standard m3)
21.7 20 22.6 21.8 22.4 20.6 21.9
Captain E 93 88 95 121 94 109 118 Captain D 621 551 652 562 648 564 580 Captain C 45 61 44 50 51 55 71 Captain A 6 5 6 35 0 0 4 Captain D & E 714 640 747 683 742 673 698 Captain C, D & E 759 700 791 733 792 728 769 Note: Volumes reported in 109 standard cubic feet (scf) except where noted.
3.1. Static in-place volume calculation Calculation of in-place hydrocarbon volumes follows a stepwise process, which is advanced by the progressive application of new interpretation products:
1. Gross Rock Volume (GRV): Structural model + fluid contact(s) 2. Net Rock Volume (NRV): GRV combined with net to gross model 3. Net Pore Volume (NPV): NRV combined with porosity model 4. Hydrocarbon Pore Volume (HCPV): NPVombined with hydrocarbon saturation model 5. Initially In-Place Volume (IIP): HCPV combined with formation volume factor
(commonly abbreviated to Bo for oil or Bg for gas) For this project, all models have been built, and all volumetrics calculated, using Schlumberger’s Petrel™ software. The method of constructing each piece of data has been described at length in the static model (field) report4 and will not be re-described here.
3 PCCS-05-PT-ZG-0580-00004_Static Model Field, Key Knowledge Deliverable 11.108 4 PCCS-05-PT-ZG-0580-00004_Static Model Field, Key Knowledge Deliverable 11.108

PETERHEAD CCS PROJECT 3.Static Volumes
Doc. no.: PCCS-05-PT-ZG-0580-00001-Initial In Place Volumes Estimate Revision:K02
The information contained on this page is subject to the disclosure on the front page of this document. 4
3.2. Factors controlling in-place volumes For the current project, understanding the distribution of likely in-place hydrocarbon volumes outcomes has not been the primary focus. Instead, the focus of the work done has been to assess the geological uncertainties that are likely to affect the migration of sequestered CO2 within the Goldeneye structure. However, it is recognised that these uncertainties (reservoir zonation, the position of the northern stratigraphic pinchout and the steepness of the western flank of the field) do have an impact on the hydrocarbon volume IIP in the field, as calculated from the various different SRMs, and so this is reported here.
-10.00% -5.00% 0.00% 5.00% 10.00%
Flank
Pinchout
Zonation
Max
Min
Fig. 3-1—Tornado plot showing impact of three key uncertainties addressed by the suite of SRMs created for the Goldeneye CCS project
Note: X-axis shows change in in-place hydrocarbon volume with reference to the SRM1.
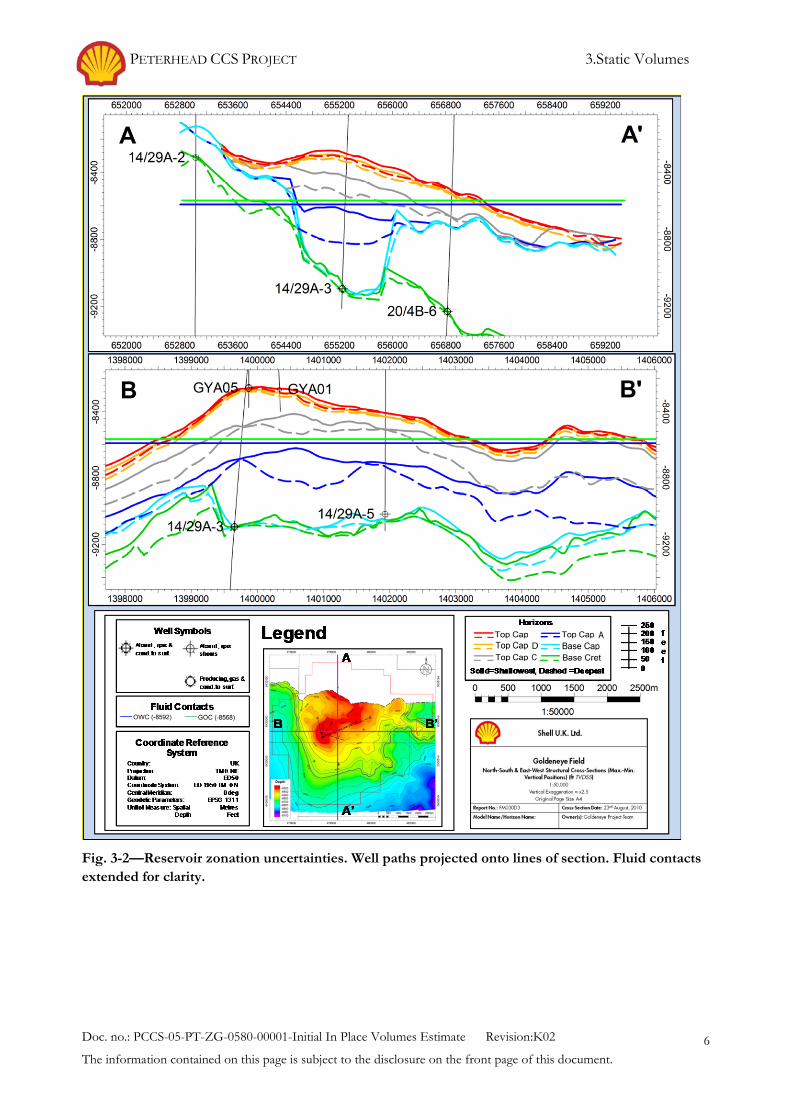
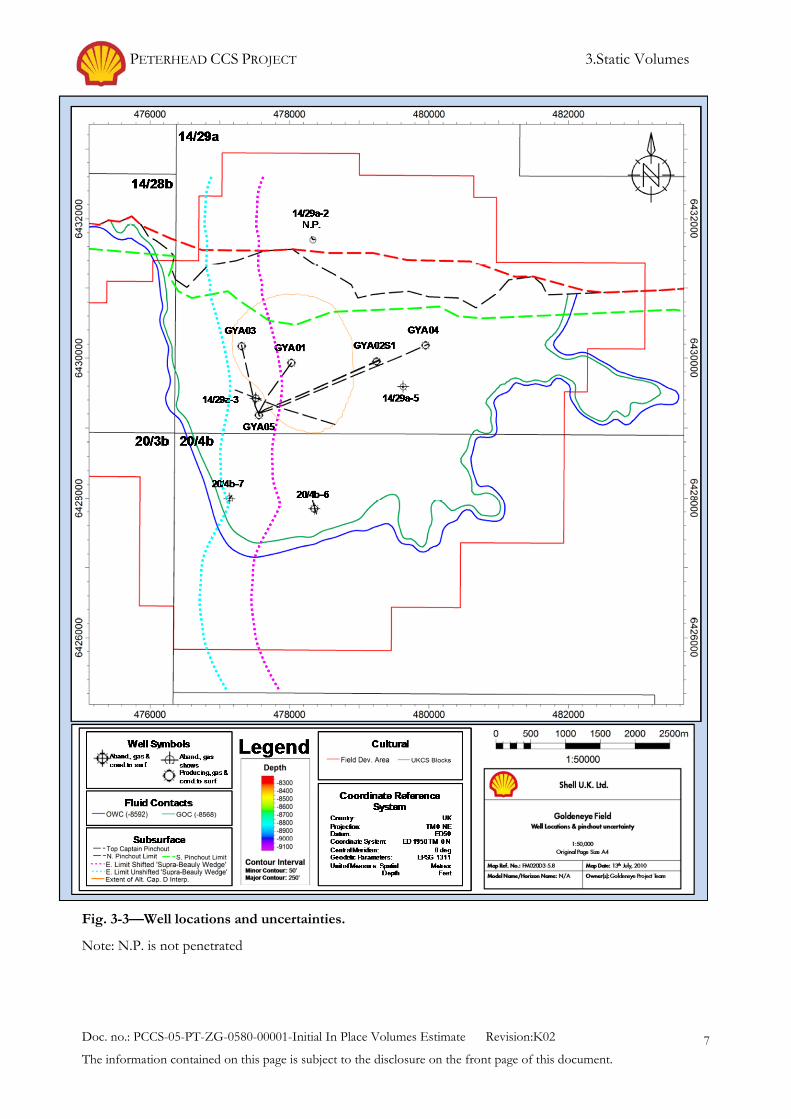
Of the uncertainties investigated, the one with the largest impact on the size of the in-place hydrocarbon volumes is the internal zonation of the reservoir. Reallocating volume between the high net to gross D unit and the low net to gross C unit can change the in-place volume between -9.6% and +4.8% (Fig. 3-1). The lowest volume is generated when using constant isochores to create the reservoir zones (the SRM3.1 approach) whilst the largest volume is associated with the approach taken in SRM2.25, where well tops are used without isochores or seismically interpreted surfaces to divide the reservoir. As well as changing the size of the reservoir from which gas is being produced, this reallocation of rock volume will affect the full field simulation, swapping volumes between an easily accessible, high quality container and a less easily accessed, low quality one. Fig. 3-2 shows the minimum (shallow) and maximum (deep) extents for each zone. Second in terms of its impact on in-place hydrocarbon volume is the position of the northerly pinch-out, which can produce a maximum reduction in GIIP of -5.3% and a maximum increase in volume of +1.2%. The position of the pinch-out has been picked, in the base case model, on the pre-stack depth migration (PreSDM) seismic data, with the extreme positions being controlled by the locations of the 14/29a-2 well (which saw no Captain Sandstone Member) and GYA03 and GYA02 (the most northerly of the producing wells, both of which encountered Captain Sandstone Member stratigraphy). Fig. 3-3 shows the most northerly and most southerly ranges of the pinch-out as modelled in the suite of SRMs considered here. Finally, a slight change in the velocity model (due to the lateral translation of the Supra-Beauly wedge, detailed in the Static Model report5) produced a very small difference (-1.5%) in in-place volume (Fig. 3-3).
5 Shell 2013, Static Model Field Report, PCCS-05-PT-ZG-0580-00004, Key Knowledge Deliverable 11.108

PETERHEAD CCS PROJECT 3.Static Volumes
Doc. no.: PCCS-05-PT-ZG-0580-00001-Initial In Place Volumes Estimate Revision:K02
The information contained on this page is subject to the disclosure on the front page of this document. 5
3.3. Stochastic IIP volume assessment As described in a previous report6, the model SRM1.0 is our attempt to reproduce the existing production team’s SRM, used as the basis for history matching and production forecasting for the Goldeneye field. During the construction of the original version of this model, the production team’s geologist investigated the range of volumetric outcomes based on the key subsurface uncertainties identified on the field, principally the exact nature of the top reservoir map and the internal reservoir zonation. 381 realisations were created and the resultant GIIP values calculated so that P10, P50 and P90 expectation cases could be extracted (Fig. 3-4).
Table 3-2—GIIP & STOIIP probability for the Captain Sandstone reservoir based on 381 runs of the production team model.
Probability GIIP (109 scf) STOIIP (106 bbl)
P10 695 27.7
P15 705 28.5
P50 753 31.5
P85 799 34.5
P90 816 35.5
Note: Workflow uses new seeds for facies and property modelling, with stochastic reservoir horizons generated for each run using the standard deviation of the top reservoir well residuals after depth conversion. Comparing the SRM models with the range from the production team’s stochastic modelling, shows that the suite of realisations that have been created for this study are representative of the mid-two thirds of the production team’s expectation range. This is to be expected for a number of reasons. Firstly, the capacity of Goldeneye to contain CO2 is mainly dependent on produced rather than in-place volumes; therefore, there is no requirement to model the entire probabilistic range of volumes. Secondly, the uncertainties that the suite of models created for this project represent are relevant to the potential migration of CO2 through the storage container. These uncertainties do not necessarily have any impact on the IIP volumes of hydrocarbon in the Goldeneye field. Finally, the objective of this study is to model downside. The reason for this is that there is confidence, based upon the estimated ultimate recovery figures for the field (nearly 550 Bscf [15.57 109 m3] of which has already been produced) that the Goldeneye field has sufficient capacity to contain the proposed volume of CO2.
6 Shell 2013, Static Model Field Report, PCCS-05-PT-ZG-0580-00004, Key Knowledge Deliverable 11.108
PETERHEAD CCS PROJECT 3.Static Volumes
Doc. no.: PCCS-05-PT-ZG-0580-00001-Initial In Place Volumes Estimate Revision:K02
The information contained on this page is subject to the disclosure on the front page of this document. 6
Fig. 3-2—Reservoir zonation uncertainties. Well paths projected onto lines of section. Fluid contacts extended for clarity.
PETERHEAD CCS PROJECT 3.Static Volumes
Doc. no.: PCCS-05-PT-ZG-0580-00001-Initial In Place Volumes Estimate Revision:K02
The information contained on this page is subject to the disclosure on the front page of this document. 7
Fig. 3-3—Well locations and uncertainties.
Note: N.P. is not penetrated

PETERHEAD CCS PROJECT 3.Static Volumes
Doc. no.: PCCS-05-PT-ZG-0580-00001-Initial In Place Volumes Estimate Revision:K02
The information contained on this page is subject to the disclosure on the front page of this document. 8
0%
10%
20%
30%
40%
50%
60%
70%
80%
90%
100%
612 626 640 654 668 682 696 710 724 738 752 766 780 794 808 822 836 850 864 878 892 906
0%
2%
4%
6%
8%
10%
12%
14%
612 626 640 654 668 682 696 710 724 738 752 766 780 794 808 822 836 850 864 878 892 906
Cum
ulat
ive
%
GIIP (Bscf)Fr
actio
n
GIIP (Bscf)
P15=
705
Bscf
P50=
753
Bscf
P85=
799
Bscf
SRM
3.1
Fig. 3-4—GIIP probability distribution based on 381 runs of the production team model
Note: Workflow uses new seeds for facies and property modelling with stochastic reservoir horizons generated for each run using the standard deviation of the top reservoir well residuals after depth conversion. Green shading indicates volume range of SRMs generated for this study. It follows that there is no benefit from generating models to represent the high in-place volume cases. Additionally, the current recovery from the field, when compared to the lowest in-place volume reported from our SRM scenarios, implies a recovery factor of 77%, a high efficiency that would be difficult to justify for a water invaded gas reservoir given the heterogeneity seen in the field.

PETERHEAD CCS PROJECT 4.Dynamic volumes
Doc. no.: PCCS-05-PT-ZG-0580-00001-Initial In Place Volumes Estimate Revision:K02
The information contained on this page is subject to the disclosure on the front page of this document. 9
4. Dynamic volumes To create the FFSM, the SRM was exported in Rescue format from the Petrel software application and imported into Shell’s dynamic simulator (MoReS), via an upscaling application, also software developed within Shell, called ‘Reduce++’. The upscaling process converts a fine scale geological model into a coarser model which can be used for history matching or forecasting with acceptable runtimes. The coarse grid block properties are derived from the properties of the underlying geological model such that their behaviour closely reflects that of the geological model. Different upscaling methods are used for different properties.
4.1. In-place volumes from upscaled SRM Table 4-1 shows the equivalent volumetric measurements in the SRM and the FFSM. Fluid saturations in the FFSM are not imported from the SRM. Instead a capillary pressure curve is used (for the SRM, saturations are derived using a saturation height function derived to match the Sw curves calculated from petrophysical analysis). The Bg used in the SRM is the one used by the production team and is not the same as the one derived from the latest pressure, volume, temperature (PVT) model7 - which is used in the FFSM.
Table 4-1—Equivalent quantities in SRM and FFSM. Gross Bulk Volume (GBV)
SRM FFSM
Bulk volume Not available
Net volume GBV : Net reservoir (rock) volume
Pore volume GBV * porosity = Net pore volume
HCPV gas Net pore volume * saturation of gas
GIIP HCPV gas / Bg
Fig. 4-1 shows comparison of net, pore and HCPV volumes and in Fig. 4-2 GIIP volumes from the SRM3.1 scenario calculated in the static reservoir modelling software (Petrel) and in the dynamic simulator, MoReS. The differences in volumes between SRM and FFSM reported for this scenario are similar to those seen in other models and their causes are also believed to be the same, so the individual volumes from the other scenarios which were imported into the dynamic simulator will not be reported here. As noted in the previous chapter, the SRM hydrocarbon volume was calculated with the production team’s value for Bg. For this project, a review of the available PVT information has led us to calculate a different value (Bg =0.783 RB/Mscf [0.004396 Sm3/Sm3]). To allow for a meaningful comparison, however, the value used in the SRM (0.766 RB/Mscf[0.004301 Sm3/Sm3]) was used to calculate GIIP in MoReS. Despite using the same Bg value, there is not an exact match between the static and dynamic versions of the model. This is probably due to the greater resolution of the Petrel version of the model. Using the production team’s Bg figure, the Petrel model reports approximately 2.8% larger GIIP from the main reservoir zone (Captain D) than the equivalent MoReS model. Using the Bg calculated from the updated PVT analysis subtracts a further 2.2% from the GIIP in MoReS, compared to that calculated in Petrel.
7 Shell 2010. PVT Modelling Report for CO2 in Goldeneye Project, UKCCS-KT-S7.21-Shell-001

PETERHEAD CCS PROJECT 4.Dynamic volumes
Doc. no.: PCCS-05-PT-ZG-0580-00001-Initial In Place Volumes Estimate Revision:K02
The information contained on this page is subject to the disclosure on the front page of this document. 10
0
10
20
30
40
50
60
70
80
90
100
Captain E Captain D Captain C Captain A
Pore volume (10^6 m3)
Petrel
Reduce voxel
Reduce upscaled
0
10
20
30
40
50
60
70
80
90
100
Captain E Captain D Captain C Captain A
Pore volume (10^6 m3)
Petrel
Reduce voxel
Reduce upscaled
0
50
100
150
200
250
300
350
400
Captain E Captain D Captain C Captain A
Net volume (10^6 m3)
Petrel
Reduce voxel (GBVV)
Reduce upscaled (GBV)
0
50
100
150
200
250
300
350
400
Captain E Captain D Captain C Captain A
Net volume (10^6 m3)
Petrel
Reduce voxel (GBVV)
Reduce upscaled (GBV)
• Overall percentage difference in net volume is 3.72%.
• Total percentage difference in pore volume is 3.73%.
• Overall percentage difference in HCPV for gas is 3.25%. (Petrel saturation height function vs. MoReS capillary pressure curves).
0.00
0.50
1.00
1.50
2.00
2.50
3.00
Captain E Captain D Captain C Captain A
HCPV Gas (10^6 Mcf)
Petrel
MoReS
0.00
0.50
1.00
1.50
2.00
2.50
3.00
Captain E Captain D Captain C Captain A
HCPV Gas (10^6 Mcf)
Petrel
MoReS
Fig. 4-1—Comparison of different volumes calculated from SRM3.1 in (Petrel), during initial import into dynamic simulator and after upscaling (Reduce upscaled/MoReS).

PETERHEAD CCS PROJECT 4.Dynamic volumes
Doc. no.: PCCS-05-PT-ZG-0580-00001-Initial In Place Volumes Estimate Revision:K02
The information contained on this page is subject to the disclosure on the front page of this document. 11
0
100
200
300
400
500
600
700
Captain E Captain D Captain C Captain A
GIIP all units (10^6 Mscf)
Petrel
Petrel HCPV/Petrel Bg
Petrel HCPV/MoReS Bg
0
100
200
300
400
500
600
700
Captain E Captain D Captain C Captain A
GIIP all units (10^6 Mscf)
Petrel
Petrel HCPV/Petrel Bg
Petrel HCPV/MoReS Bg
0100200300400500600700800900
C.D,E C,D D,E
GIIP (10^6 Mscf): C,D,E, C,D and D,E
Petrel
Petrel HCPV/Petrel Bg
MoReS HCPV/Petrel Bg
MoReS HCPV/MoReS Bg
0100200300400500600700800900
C.D,E C,D D,E
GIIP (10^6 Mscf): C,D,E, C,D and D,E
Petrel
Petrel HCPV/Petrel Bg
MoReS HCPV/Petrel Bg
MoReS HCPV/MoReS Bg
Fig. 4-2—Comparison of GIIP calculated from SRM3.1 in (Petrel) and FFSM (MoReS)
The detailed comparison of the fine scale, static model volumes and those in the coarser simulation model is only shown here for the SRM3.1 model. However, the same consistency has been demonstrated for the other models which have been exported to the dynamic realm, specifically SRM1.0, SRM2.0, SRM2.1 and SRM3.0.

PETERHEAD CCS PROJECT 5.Conclusions
Doc. no.: PCCS-05-PT-ZG-0580-00001-Initial In Place Volumes Estimate Revision:K02
The information contained on this page is subject to the disclosure on the front page of this document. 12
5. Conclusions The suite of SRMs in use to investigate Goldeneye’s suitability for CCS has a range of IIP volumes of between 706 and 792 Bscf, [19.99 x10⁹ m3 and 22.43 x10⁹ m3] giving a spread of 86 Bscf [2.44 x10⁹ m3]. All of these models, therefore, have GIIP volumes that lie between the P15 and P85 expectation volumes as calculated by the Goldeneye production team (705 and 799 Bscf, respectively [19.96 x10⁹ m3 and 22.63 x10⁹ m3]). As described in the static model (field) report8, the objective of the modelling exercise was not to evaluate the range of in-place volumes but to generate a series of scenarios that allowed the review of the impact of key subsurface uncertainties on the injection and sequestration performance of CO2 within the Goldeneye reservoir. However, it is possible to say that the scenarios created are representative of the field. The upscaling procedure that generates a full field model from the SRM input honours the IIP hydrocarbon volumes to within acceptable tolerance (3.25%). The small differences are consistent with the differences expected during upscaling. The models are, therefore, deemed suitable for dynamic simulation and history matching to observed production data.
8 Shell 2013, Static Model Field Report, PCCS-05-PT-ZG-0580-00004, KKD no. 11.108.
PETERHEAD CCS PROJECT 6.Glossary of terms
Doc. no.: PCCS-05-PT-ZG-0580-00001-Initial In Place Volumes Estimate Revision:K02
The information contained on this page is subject to the disclosure on the front page of this document. 13
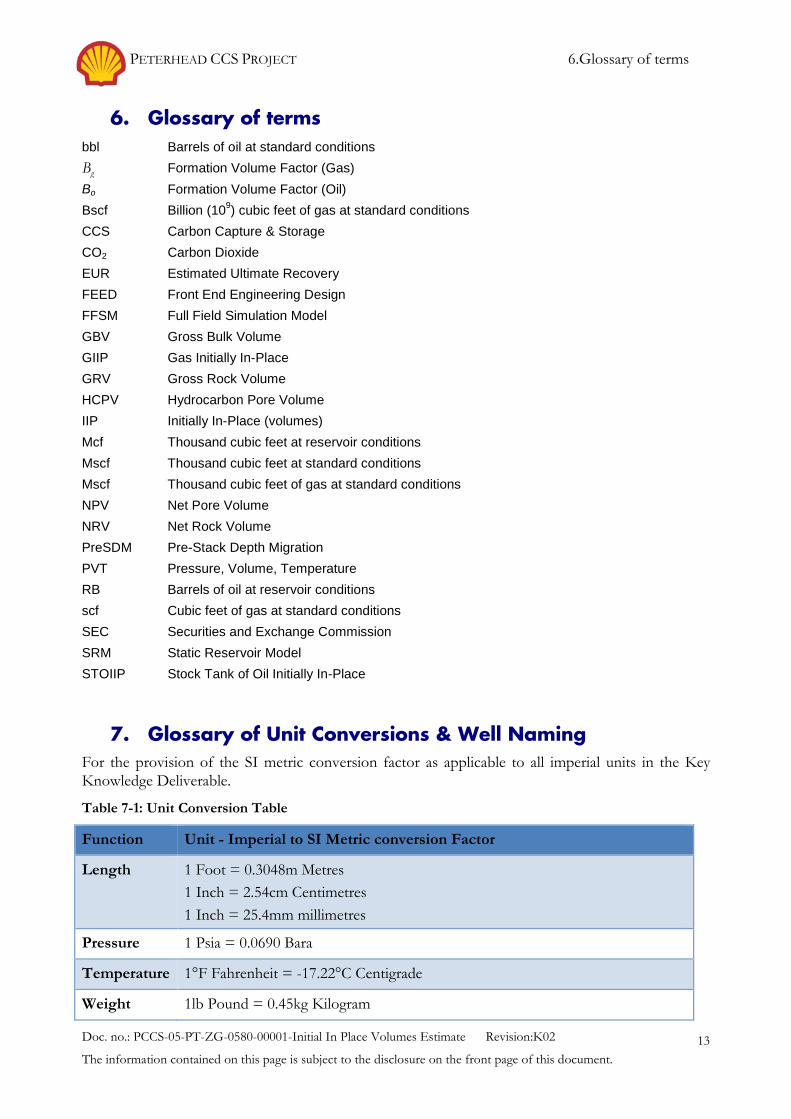
6. Glossary of terms bbl Barrels of oil at standard conditions Bg Formation Volume Factor (Gas) Bo Formation Volume Factor (Oil) Bscf Billion (109) cubic feet of gas at standard conditions CCS Carbon Capture & Storage CO2 Carbon Dioxide EUR Estimated Ultimate Recovery FEED Front End Engineering Design FFSM Full Field Simulation Model GBV Gross Bulk Volume GIIP Gas Initially In-Place GRV Gross Rock Volume HCPV Hydrocarbon Pore Volume IIP Initially In-Place (volumes) Mcf Thousand cubic feet at reservoir conditions Mscf Thousand cubic feet at standard conditions Mscf Thousand cubic feet of gas at standard conditions NPV Net Pore Volume NRV Net Rock Volume PreSDM Pre-Stack Depth Migration PVT Pressure, Volume, Temperature RB Barrels of oil at reservoir conditions scf Cubic feet of gas at standard conditions SEC Securities and Exchange Commission SRM Static Reservoir Model STOIIP Stock Tank of Oil Initially In-Place
7. Glossary of Unit Conversions & Well Naming For the provision of the SI metric conversion factor as applicable to all imperial units in the Key Knowledge Deliverable.
Table 7-1: Unit Conversion Table
Function Unit - Imperial to SI Metric conversion Factor
Length 1 Foot = 0.3048m Metres 1 Inch = 2.54cm Centimetres 1 Inch = 25.4mm millimetres
Pressure 1 Psia = 0.0690 Bara
Temperature 1°F Fahrenheit = -17.22°C Centigrade
Weight 1lb Pound = 0.45kg Kilogram
PETERHEAD CCS PROJECT 7.Glossary of Unit Conversions & Well Naming
Doc. no.: PCCS-05-PT-ZG-0580-00001-Initial In Place Volumes Estimate Revision:K02
The information contained on this page is subject to the disclosure on the front page of this document. 14
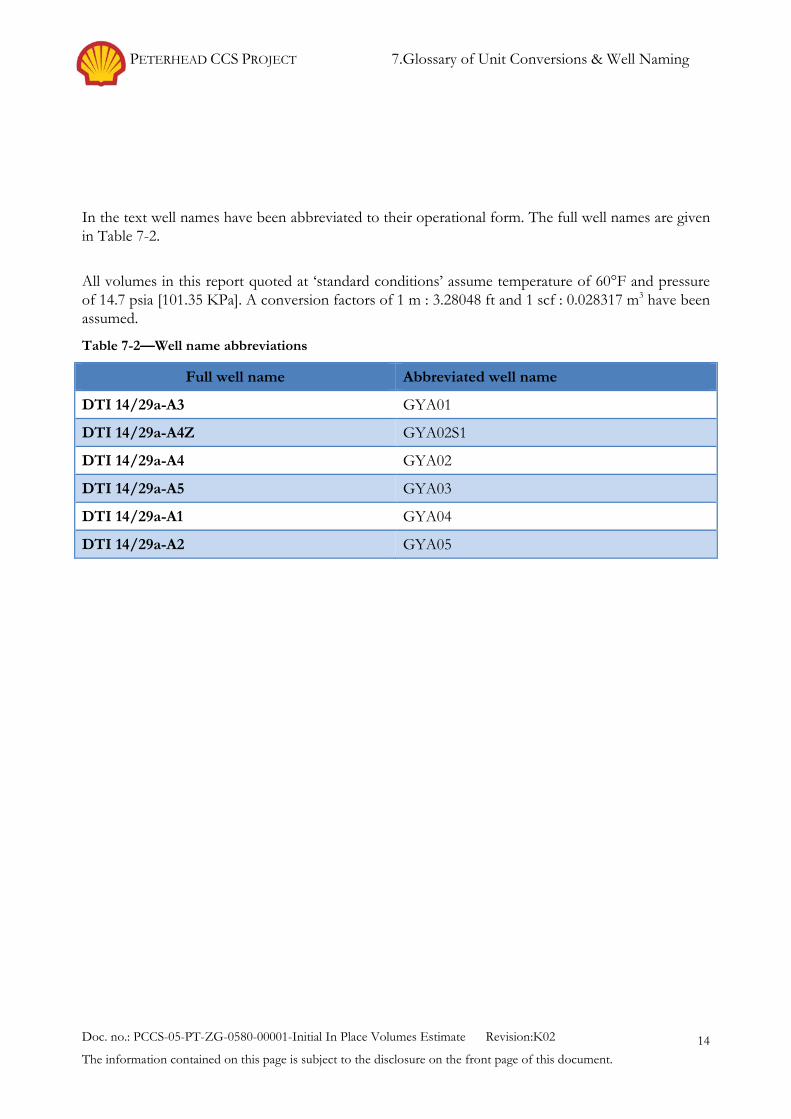
In the text well names have been abbreviated to their operational form. The full well names are given in Table 7-2. All volumes in this report quoted at ‘standard conditions’ assume temperature of 60°F and pressure of 14.7 psia [101.35 KPa]. A conversion factors of 1 m : 3.28048 ft and 1 scf : 0.028317 m3 have been assumed.
Table 7-2—Well name abbreviations
Full well name Abbreviated well name
DTI 14/29a-A3 GYA01
DTI 14/29a-A4Z GYA02S1
DTI 14/29a-A4 GYA02
DTI 14/29a-A5 GYA03
DTI 14/29a-A1 GYA04
DTI 14/29a-A2 GYA05