Embed Size (px)
Citation preview

Petrobras –Opportunities in
Brazil
Ultimo Melo MarizPurchasing Manager - E&P Services
Aberdeen - February 10th, 2010Aberdeen - February 10th, 2010
Subsea 2010 Conference
The presentation may contain forecasts about future events. Such forecasts merely reflect the expectations of the Company's management. Such terms as "anticipate", "believe", "expect", "forecast", "intend", "plan", "project", "seek", "should", along with similar or analogous expressions, are used to identify such forecasts. These predictions evidently involve risks and uncertainties, whether foreseen or not by the Company. Therefore, the future results of operations may differ from current expectations, and readers must not base their expectations exclusively on the information presented herein. The Company is not obliged to update the presentation/such forecasts in light of new information or future developments.
DISCLOSURE
Outline
Petrobras Overview
Pre-Salt Area: A New Frontier
Business Plan 2009-2013
Supplying Petrobras
Conclusions
Net Operating Revenue
US$ 87.7 billion
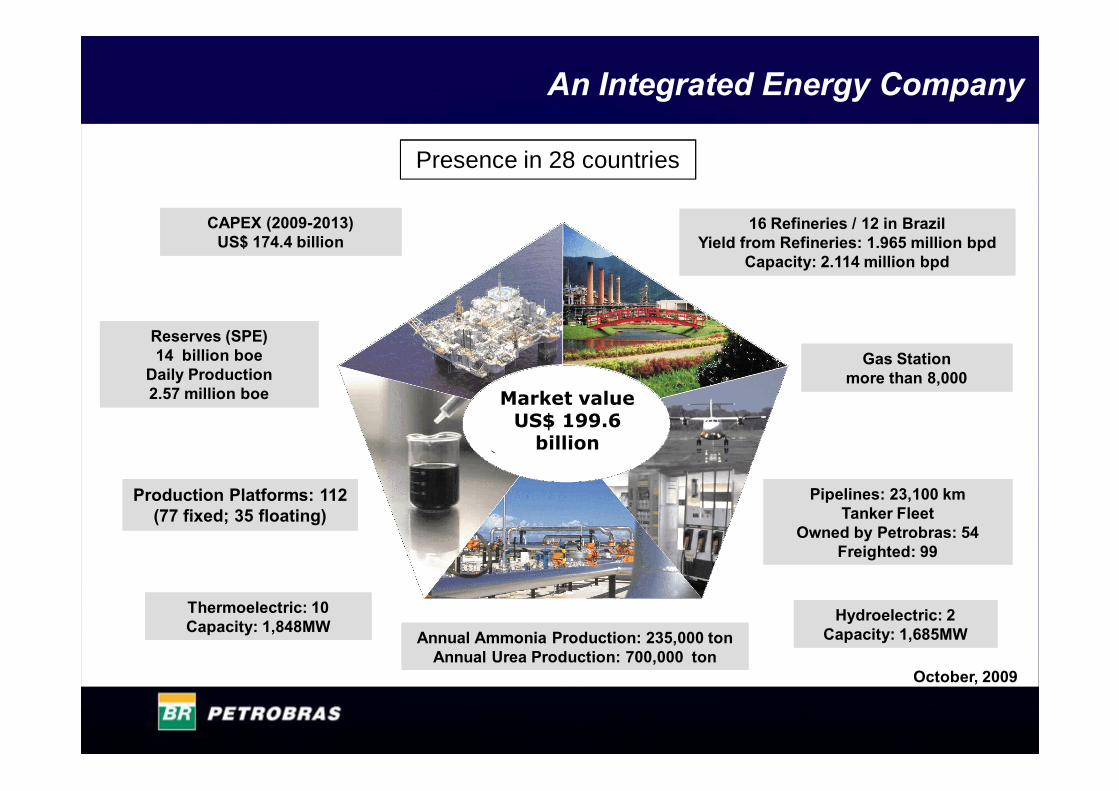
16 Refineries / 12 in BrazilYield from Refineries: 1.965 million bpd
Capacity: 2.114 million bpd
16 Refineries / 12 in BrazilYield from Refineries: 1.965 million bpd
Capacity: 2.114 million bpd
Reserves (SPE)14 billion boe
Daily Production2.57 million boe
Reserves (SPE)14 billion boe
Daily Production2.57 million boe
Thermoelectric: 10Capacity: 1,848MWThermoelectric: 10Capacity: 1,848MW
Hydroelectric: 2Capacity: 1,685MW
Hydroelectric: 2Capacity: 1,685MWAnnual Ammonia Production: 235,000 ton
Annual Urea Production: 700,000 tonAnnual Ammonia Production: 235,000 ton
Annual Urea Production: 700,000 ton
Gas Stationmore than 8,000
Gas Stationmore than 8,000
Pipelines: 23,100 kmTanker Fleet
Owned by Petrobras: 54Freighted: 99
Pipelines: 23,100 kmTanker Fleet
Owned by Petrobras: 54Freighted: 99
October, 2009
Production Platforms: 112 (77 fixed; 35 floating)
Production Platforms: 112 (77 fixed; 35 floating)
An Integrated Energy Company
CAPEX (2009-2013)US$ 174.4 billion
CAPEX (2009-2013)US$ 174.4 billion
Market valueUS$ 199.6
billion
Presence in 28 countries

A Company Driven by TechnologySuccessive records in drilling and completion
OTCOTC19921992
OTCOTC20012001
US$ 1 Billion invested in R&D in the last 5 years
US$ 1 Billion invested in R&D in the last 5 years

Domestic Exploration & ProductionProven Reserves
65.129.6
6.74.3 2.6
1.52.5
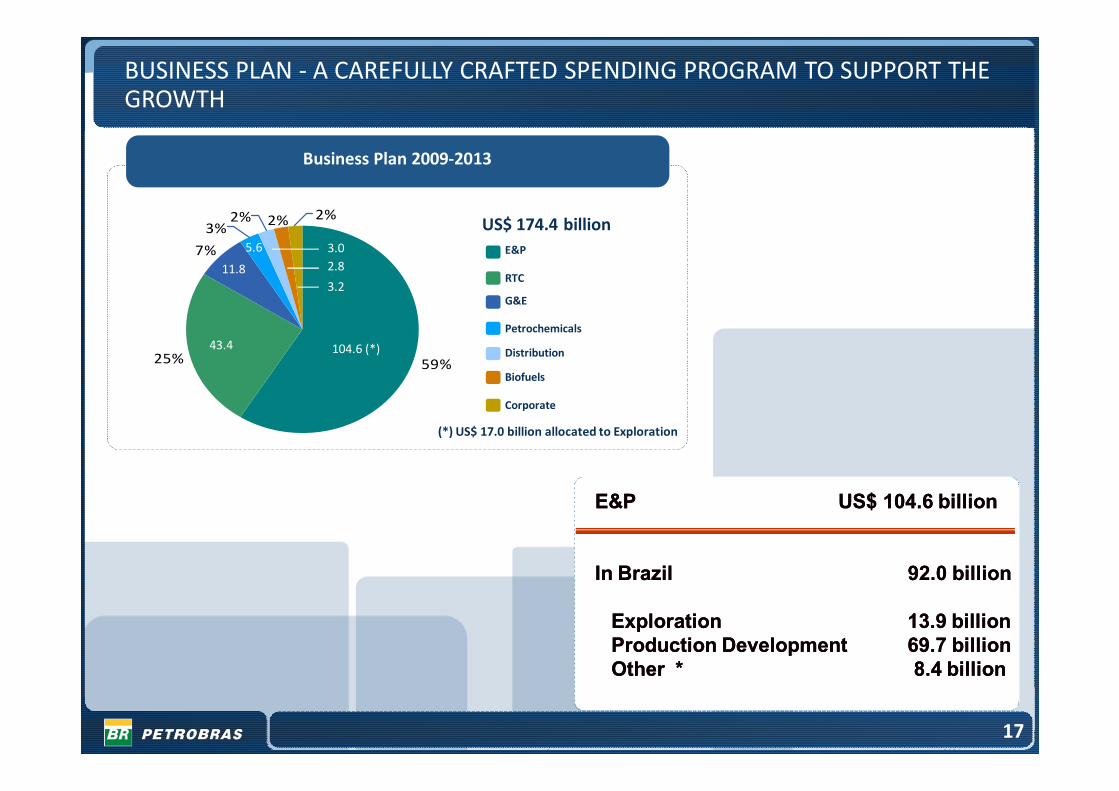
Business Plan 2009-2013
25%
2%2%
7%
3%2%
59%
E&P
RTC
G&E
Petrochemicals
Biofuels
Distribution
Corporate
US$ 174.4 billion
104.6 (*)43.4
11.8
5.6 3.02.8
3.2
(*) US$ 17.0 billion allocated to Exploration
BUSINESS PLAN - A CAREFULLY CRAFTED SPENDING PROGRAM TO SUPPORT THE GROWTH
17
In Brazil In Brazil 92.0 billion92.0 billion
Exploration 13.9 billion Exploration 13.9 billion Production Development 69.7 billionProduction Development 69.7 billionOther * 8.4 billionOther * 8.4 billion
E&P US$ 104.6 billionE&P US$ 104.6 billion

Develop an integrated global natural gas network to supply Petrobras’ markets
Discover and develop resources in Brazil and
internationally, maintaining a reserves-to-production
ratio of 15 years
Delineate and develop the pre-salt cluster and
new oil provinces in Southeast Brazil
Increase production in Brazil and abroad,
optimizing the use of existing infrastructure
Apply innovative deepwater expertise in
new high-potential frontier provinces in
Brazil and abroad
Business Plan 2009-2013 Upstream Strategy

Production in boe (barrels of equivalent oil)
1.335 1.500 1.540 1.493 1.684 1.778 1.792 1.855 2.0502.680
3.920
232252 251 265
274 277 273 321463
634
1.177
161 168163 142 126 124
142
210
409
131
223
3544
10310010910196
94852324
2001 2002 2003 2004 2005 2006 2007 2008 2009 2013 2020
Oil production - Brazil Gas production - Brazil Oil Product - International Gas Product - International
2,3082,3052,2232,0272,042
1,8121,637
2,400
Petrobras Total Production (1,000 boe)
3,655
2,757
5,7297.5% p.y.
8.8% p.y.
5.6% p.y.
Oil and GasProduction Targets

2,680
2,580
2,430
2,250
2,050
1,855
1400
1600
1800
2000
2200
2400
2600
2800
2008 2009 2010 2011 2012 2013
FPSO Frade100,000 bpd
Jun20/09
FPSO Frade100,000 bpd
Jun20/09
Parque das Conchas
FPSO Espírito Santo
100,000 bpdSep/29/09
Parque das Conchas
FPSO Espírito Santo
100,000 bpdSep/29/09
Marlim SulModule 2SS P-51
180,000 bpdJan24/09
Marlim SulModule 2SS P-51
180,000 bpdJan24/09
Marlim LesteFPSO Cidade de
Niterói100,000 bpdFeb26//09
Marlim LesteFPSO Cidade de
Niterói100,000 bpdFeb26//09
Thousand bpd
Marlim Sul
SS P-56Module 3
100,000 bpd
Marlim Sul
SS P-56Module 3
100,000 bpd
Jubarte FPSO P-57180,000 bpd
Jubarte FPSO P-57180,000 bpd
Upstream - Major Oil Projects
Tupi PilotFPSO Cidade de Angra dos Reis
100,000 bpd
Tupi PilotFPSO Cidade de Angra dos Reis
100,000 bpd
Tupi TLDFPSO BW Cidade
de S.Vicente30,000 bpdMay01/09
Tupi TLDFPSO BW Cidade
de S.Vicente30,000 bpdMay01/09
Cachalote eBaleia Franca
FPSO Capixaba100,000 bpd
Cachalote eBaleia Franca
FPSO Capixaba100,000 bpd
Roncador FPSO P-62Module 4
100,000 bpd
Roncador FPSO P-62Module 4
100,000 bpd
Marlim LesteFPU P-53
180,000 bpdNov30/08
Marlim LesteFPU P-53
180,000 bpdNov30/08ü
CachaloteFPSO Seillean
25,000 bpdDec16/08
CachaloteFPSO Seillean
25,000 bpdDec16/08 ü
ü
ü
Roncador SS P-55Module 3
180,000 bpd
Roncador SS P-55Module 3
180,000 bpd
Papa-Terra TLWP P-61 &FPSO P-63150,000 bpd
Papa-Terra TLWP P-61 &FPSO P-63150,000 bpd
Guará 1 PilotFPSO
120,000 bpd
Guará 1 PilotFPSO
120,000 bpd
Anticipation of Baleia Azul
FPSO Espadarte
100,000 bpd
Anticipation of Baleia Azul
FPSO Espadarte
100,000 bpd
BadejoFPSO Cidade Rio
das Ostras15.000 bpdMar31/08
BadejoFPSO Cidade Rio
das Ostras15.000 bpdMar31/08ü
Pre-Salt Projects
ü
ü
ü

THE PRE-SALT REGION
• Total Area: 149,000 km2• Area Under Concession: 41,772 km2 (28%)• Area Not Under Concession: 107,228 km² (72%)• Area With Petrobras Interest: 35,739 km2 (24%)
§ The large blue area represents the expected Pre-salt location, with great potential for oil presence§ Currently, there is a production acceleration program in Jubarte (Parque das Baleias) and an
extended well test in Tupi (Santos Basin)

Salt drilling
Sea bed
Evaporitic session
§ Deviation of the wells into the salt zone. § Hydraulic fracture in horizontal wells.§ Wellbore materials, resistant to high CO2 content.§ Slow penetration in the reservoir.§ Extended Reach Wells.
Pre-Salt ChallengesWell Drilling and Completion
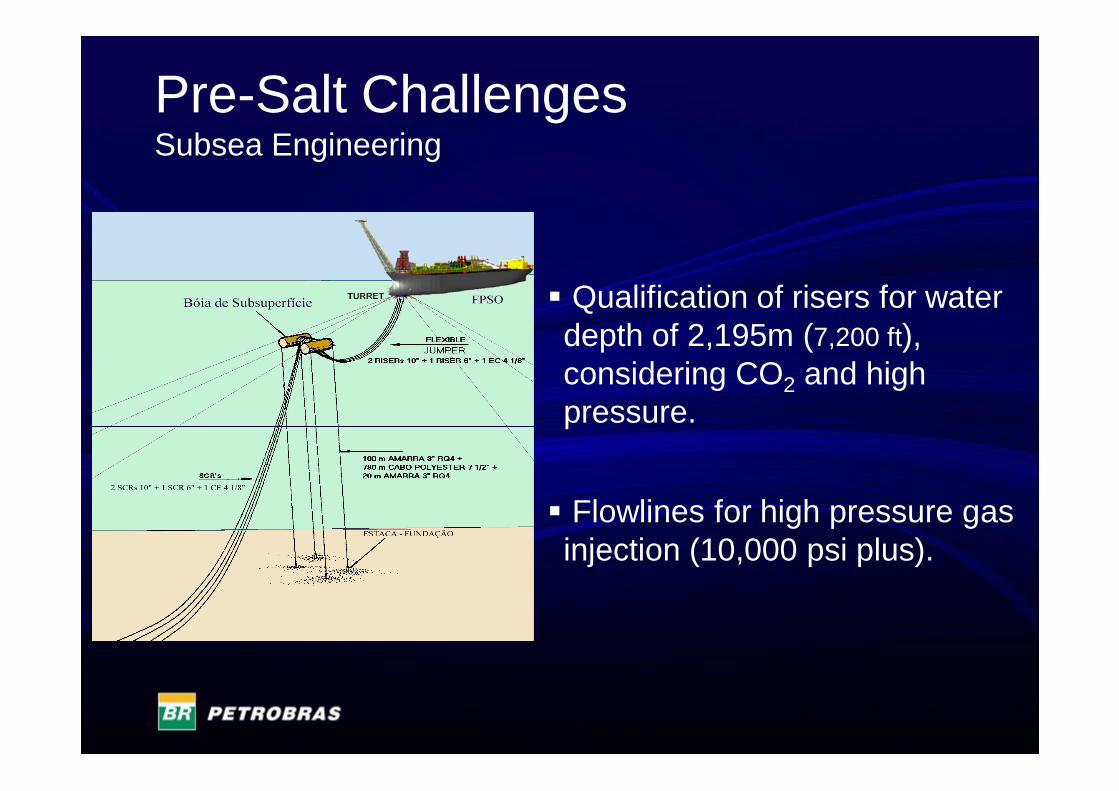
§ Qualification of risers for water depth of 2,195m (7,200 ft), considering CO2 and high pressure.
§ Flowlines for high pressure gas injection (10,000 psi plus).
Pre-Salt ChallengesSubsea Engineering
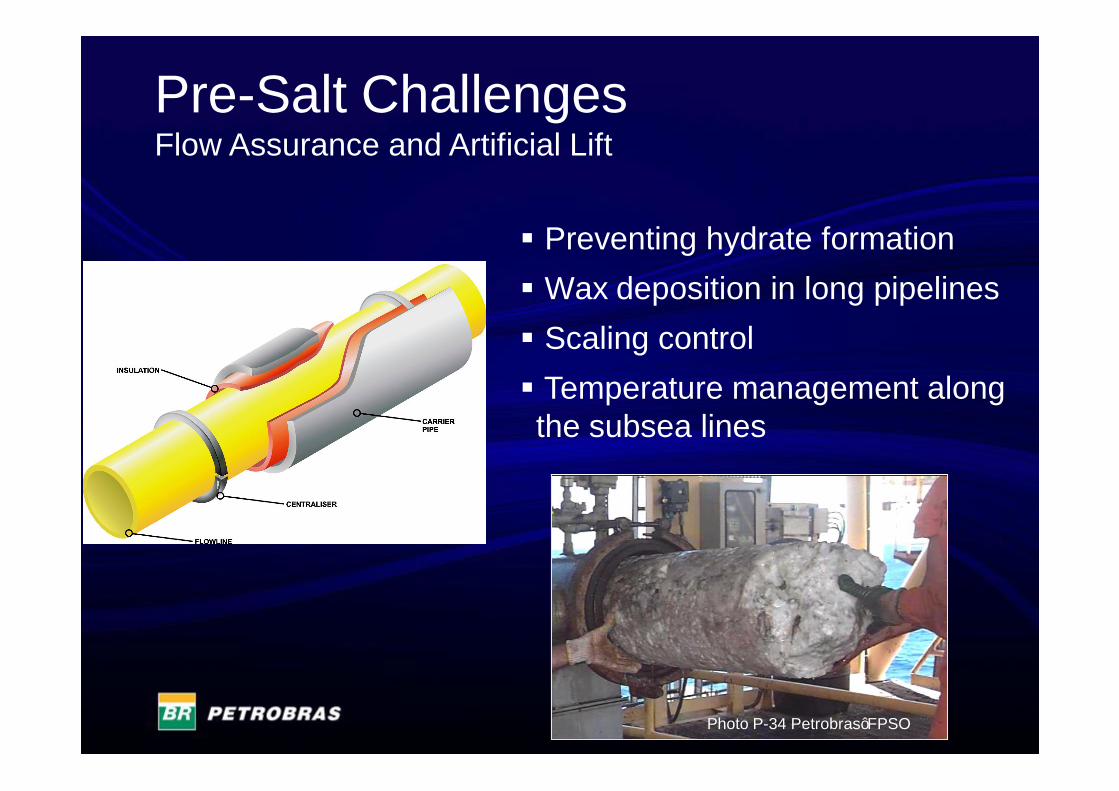
§ Preventing hydrate formation § Wax deposition in long pipelines§ Scaling control§ Temperature management along the subsea lines
Photo P-34 Petrobras’ FPSO
Pre-Salt ChallengesFlow Assurance and Artificial Lift
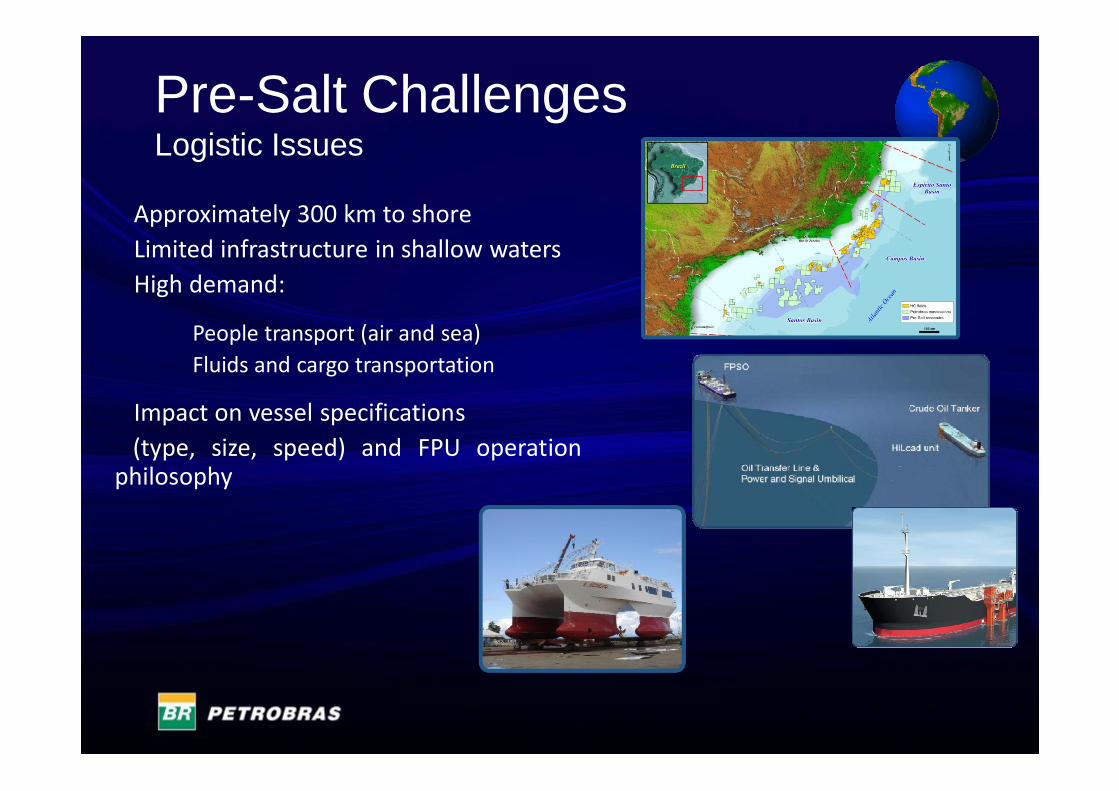
Pre-Salt ChallengesLogistic Issues
• Approximately 300 km to shore• Limited infrastructure in shallow waters• High demand:
• People transport (air and sea)• Fluids and cargo transportation
• Impact on vessel specifications(type, size, speed) and FPU operation
philosophy

16
Itens Un. TOTAL
Reactors un 280Oil and water splitter un 50Storage Tankers un 1.800Turrets un 550
Itens Un. TOTAL
Power Generators un 500Filters un 300Flares un 30
Items Un. TOTALWet Christmas Tree un 500Well Head un 500Flexible Lines km 4.000Manifolds un 30Producing pipes t 42.000Umbilical km 2.200Dry Christmas Tree un 1.700Onshore well head un 1.700
Items Un. TOTALPumps un 8.000Compressors un 700Winch un 450Crane un 200Engines un 1.000Turbines un 350Structure Steal (Hull) t 240.000
Structure Steal (Platforms Hull) t 700.000
EQUIPMENT DEMAND FOR THE NEXT 5 YEARS
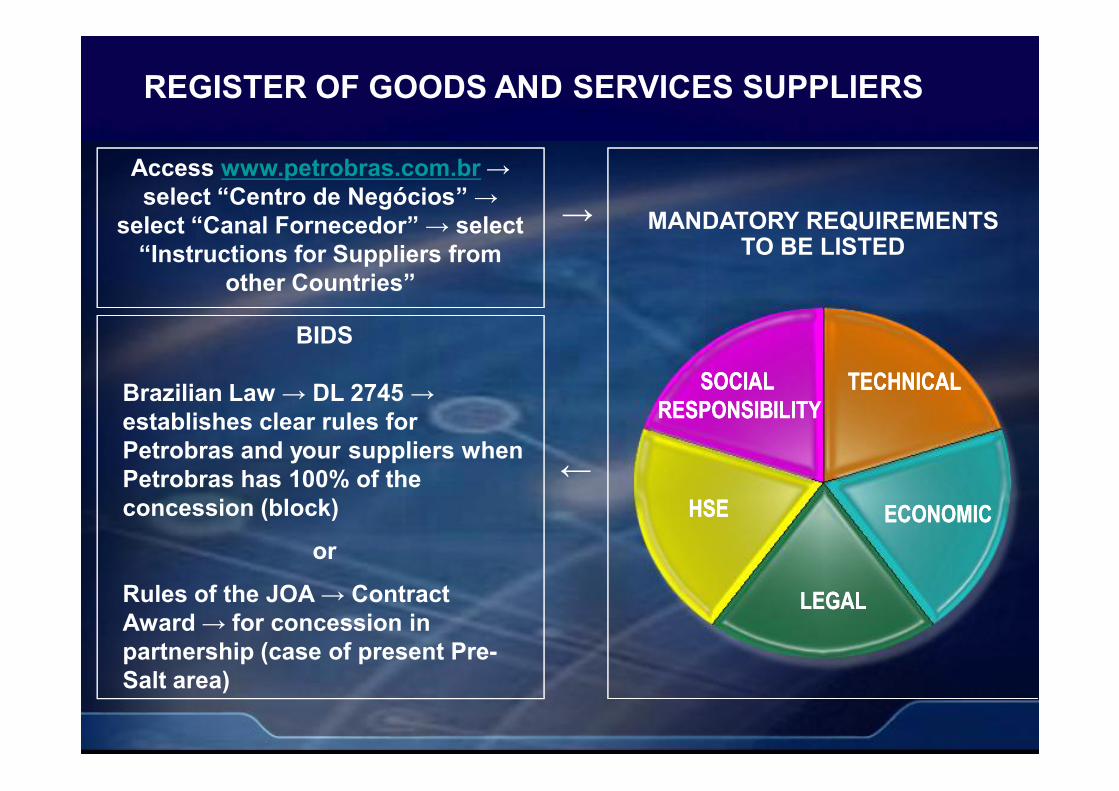
TECHNICALTECHNICAL
ECONOMICECONOMICHSEHSE
SOCIAL SOCIAL RESPONSIBILITYRESPONSIBILITY
LEGALLEGAL
MANDATORY REQUIREMENTS TO BE LISTED
REGISTER OF GOODS AND SERVICES SUPPLIERS
Access www.petrobras.com.br → select “Centro de Negócios” →
select “Canal Fornecedor” → select “Instructions for Suppliers from
other Countries”
→
→BIDS
Brazilian Law → DL 2745 → establishes clear rules for Petrobras and your suppliers when Petrobras has 100% of the concession (block)
or
Rules of the JOA → Contract Award → for concession in partnership (case of present Pre-Salt area)

What is the reason to have a Local Content Policy?
Brazilian Regulatory Agency (ANP)
Minimum Local Content
requirement in 9 bidding rounds of exploratory blocks
(since 1997)
Petrobras recognizes opportunities to improve cost effectiveness and quality standards in the local supplying market
Local suppliers usually provide After Sales faster and friendlier when compared with foreign companies
Financing Agent (BNDES – Brazilian development bank) requires minimum local content for financing
concession
The Petrobras Local Content policy is connected and contributes to the Petrobras Social Responsibility Policy
LOCAL CONTENT – SUPPLY POLICYLOCAL CONTENT – SUPPLY POLICY

üPetrobras has a robust project portfolio, which is atypical in the current economical situation
üThere are tremendous opportunities for already installed companies and newcomers in the Brazilian oil & gas supply chain due to the scale provided by Petrobras’ upstream portfolio
ü In order to carry out such portfolio, Petrobras is looking forward to establishing stable long term business relationships with all available companies that are willing to invest in Brazil
Conclusions

Thank you
For more information contact:Petróleo Brasileiro S.A – PETROBRAS
Exploration & Production
E-mail: [email protected]. República do Chile, 65 – 11th floor
ZC: 20031-912 – Rio de Janeiro, RJ+ 55 21 3224-2600