Embed Size (px)
Citation preview

PETROBRAS
1
Petrobras Strategy:Focus on Social and Environmental
Performance

PETROBRAS
2
Disclaimer
The presentation may contain forecasts about future events. Such forecasts merely reflect the expectations of the Company's management. Such terms as "anticipate", "believe", "expect", "forecast", "intend", "plan", "project", "seek", "should", along with similar or analogous expressions, are used to identify such forecasts. These predictions evidently involve risks and uncertainties, whether foreseen or not by the Company. Therefore, the future results of operations may differ from current expectations, and readers must not base their expectations exclusively on the information presented herein. The Company is not obliged to update the presentation/such forecasts in light of new information or future developments.
Cautionary Statement for US investorsThe United States Securities and Exchange Commission permits oil and gas companies, in their filings with the SEC, to disclose only proved reserves that a company has demonstrated by actual production or conclusive formation tests to be economically and legally producible under existing economic and operating conditions. We use certain terms in this presentation, such as oil and gas resources, that the SEC’s guidelines strictly prohibit us from including in filings with the SEC.

PETROBRAS
3
Petrobras
Strategic Planning
Economical Sustainability
Environmental
Social Responsibility
Acknowledgment
Governance
Summary

PETROBRAS
4
Petrobras
Strategic Planning
Economical Sustainability
Environmental Responsibility
Social Responsibility
Acknowledgment
Governance

PETROBRAS
5
Company OverviewAn integrated energy company with US$ 74 billion in gross revenue (2005 US GAAP)
Exploration and Production
• Proven Reserves: 11.8 billion boe (SEC 2005)• Oil and Gas Production: 2.22 million boed (2005)
Refining, Transport and Marketing
• 16 Refineries • Capacity: 2,114 thousand bpd• Pipelines: 18,854 miles • Vessels (own fleet): 50
Distribution• 6,933 service stations (34% share in the Brazilian
market), 746 in Argentina and 105 in Bolivia
Petrochemicals• Ethene Production: 460,000 tons/year• Styrene Production: 250,000 tons/year• Polystyrene Production: 120,000 tons/year
Natural Gas • Sales of Natural Gas: 1.83 bcf/day
Operational data includes Petrobras Energia

PETROBRAS
6
Activities in the World
Regional Presence
E&PTradingHeadquarters Gas & Power
Representation OfficeRefining
Houston
Colombia
Argentina
Angola
United KingdomUSA
BRASIL
Bolivia Rio de Janeiro
NigeriaVenezuela
EcuadorPeru
Mexico
Tanzania
Iran ChinaJapan
New York
Uruguay
Libya
EquatorialGuinea
Pakistan
Paraguay

PETROBRAS
7
309416427
593614624660
809908919945
1.2671.4481.484
SinopecRepsolStatoil
ENILukoil*Yukos*
ConocoPhillipsPetrobras
TotalChevron Texaco
Petrochina*Shell
BPExxonMobil
6.3434.026
2.9982.7472.708
2.2022.1952.114
1.2231.1751.139
524296
2.275
XOMRDS
SinopecBP
TOTCOP
PetroChinaCVX
PetrobrasYukos
RepsolLukoil
ENI**Statoil8,0
9,010,1
11,512,212,212,313,114,214,615,1
19,620,8
32,7
RepsolShell
StatoilENIBP
TotalSinopec
Chevron TexacoConocoPhillips
PetrobrasExxonMobilPetrochina*
Yukos*Lukoil*
3,33,84,3
6,89,4
11,111,511,812,113,0
17,618,5
20,122,4
RepsolSinopec*
StatoilENI
ConocoPhillips
TotalShell
PetrobrasChevron Texaco
Yukos*BP
Petrochina*Lukoil*
ExxonMobil
Publicly traded peer comparisonProven reserves (SEC - billion boe) – Dec. 2005 Oil and gas production (million boe) - 2005
Reserve life (years) – Dec. 2005 Refining capacity (thousand bpd) - 2005
Source: Evaluate Energy and Company Reports
7th
5th
9th
7th

PETROBRAS
8
Majors Average *
2,735
3,176
4,793
4,329
1,630
1,579
National Oil Companies Average **
Petrobras2,296
2,114
Product Sales (thous. bpd)
Refining (thous. bpd)Production (thous. boed)
* Majors: BP, Exxon, Total, Royal Dutch Shell, Chevron, Conoco and Repsol-YPF ** NOIC: PEMEX, PDVSA, Saudi Amraco, KPC, Pertamina and Sonatrach
*** 2004 figures, except for Petrobras (2005)Source: PIW Intelligence and Petrobras
2,217
3,400Year 2011
2011: New Refinery will add 200
thous. bpd capacity2010:
Pasadena Refinery revamp concluded – processing 70
thous. bpd of heavy oil
Vertical Integration Comparison

PETROBRAS
9
53.6% 61.6%44.4% 40.6% 40.1% 39.8%
46.4% 18.0%25.1% 23.1% 20.7% 20.4%
10.3% 9.9% 8.0% 8.3%
31.5%10.9%9.5% 20.3% 26.4% 31.2%
Oct/1992 Jul/2000 After Aug/00offering
After Jul/01offering
Dec/2003 Sep/06
Government (1) (%) Bovespa Brazil Bovespa Foreign ADRs
(1) Includes BNDES / BNDESPAR
Foreign39,8%
Free Float 46,4 38,4 55,6 59,4 59,9 60,2
Bovespa28,7%
Diversified Shareholder Base
• More than 400,000 investors in Brazil and abroad• 60% of the economic value of Petrobras in private hands• Almost 40% of the stocks with international investors
PETROBRAS
10
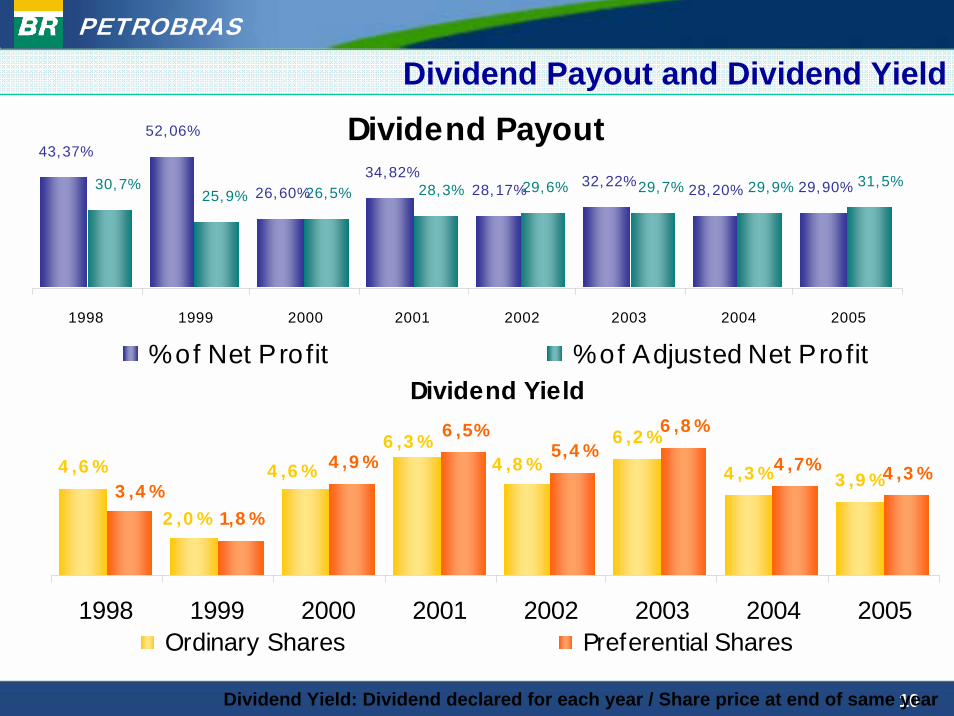
Dividend Payout43,37%
52,06%
26,60%34,82%
28,17% 32,22% 28,20% 29,90% 31,5%29,9%29,7%28,3%26,5%25,9%30,7% 29,6%
1998 1999 2000 2001 2002 2003 2004 2005
% of Net Profit % of Adjusted Net ProfitDividend Yield
4 ,6 %6 ,2 %
4 ,3 % 3 ,9 %
6 ,8 %
4 ,7% 4 ,3 %
2 ,0 %
4 ,6 %6 ,3 %
4 ,8 %3 ,4 %
1,8 %
4 ,9 %
6 ,5%5,4 %
1998 1999 2000 2001 2002 2003 2004 2005Ordinary Shares Preferential Shares
Dividend Yield: Dividend declared for each year / Share price at end of same year
Dividend Payout and Dividend Yield

PETROBRAS
11
Market Focus
Turnover (traded volume) in NYSE 1H06 daily average
US$
256
mill
ion
US$
247
mill
ion
US$
223
mill
ion
US$
359
mill
ion
US$
150
mill
ion
US$
128
mill
ion
US$
123
mill
ion
US$
118
mill
ion
US$
111
mill
ion
US$
101
mill
ion
-50
100150200250300350400
Petrobras
*
Cia. Vale
do Rio D
oce*
BP
NokiaAméri
ca M
óvil*Elan
Corp
.
CemexBHP B
illiton
Total
Tenari
sU
S$ m
illio
n
* All firm's ADR programs
Source: Bloomberg

PETROBRAS
12
A Petrobras
Strategic Planning
Economical Sustainability
Environmental Responsibility
Social Responsibility
Acknowledgment
Governance

PETROBRAS
13
Liderar o mercado de petróleo, gás natural e derivados na América Latina, atuando como empresa integrada de energia, com expansão seletiva
da petroquímica e da atividade internacional.
Growth ProfitabilityGrowth Profitability Social and Environmental Social and Environmental ResponsibilityResponsibility
Consolidate and increase
competitive advantages in
the Brazilian and South American
oil and oil products market
Develop and lead the domestic
natural gas market and perform in an integrated manner
in the gas and power market in South America
Selectively expand
international activities in an
integrated manner with the
Company’s business
Selectively expand interest
in the petrochemicals
market
Expand participation in biofuels market, lead the domestic
biodiesel production and increase
participation in the ethanol business
Operational, management, technological and human resources excellence
Lead the Latin American oil, natural gas, oil products and biofuels market, working as an integrated energy company, with selective expansion in petrochemical, renewable energy and
international activities.
Corporate Strategy
Corporate Strategy

PETROBRAS
14
Drivers Business StrategiesE&P• Focus on light oil and natural gas
production and reserve growthDownstream• Expand conversion capacity and improve
quality of refined products• Increase bio-refining capacity, biomass,
petrochemical and fertilizers businesses• Promote Brazilian biodiesel production and
export ethanolDistribution• Increase market-share in Brazil for oil
products and biofuelsGas & Energy• Develop and establish a profitable and
reliable natural gas market including LNGInternational• Expand E&P in Gulf of Mexico and Africa• Undertake investments in refining
conversion capacity and quality
Develop market and monetize natural gas reserves in Brazil
Reduce dependence on light oil and oil product imports
Improve oil product quality in Brazil and abroad
Reduce carbon intensity of operations and products
Drivers & Strategies
Exploit competitive advantage from deep water exploration technology abroad
Assure future demand and add value to heavy oil exports

PETROBRAS
15
Petrobras will be an integrated energy company with a strong international presence and a
leading force in Latin America, working with a focus on
profitability and social and environmental responsibility.
Vision 2015
PETROBRAS
16
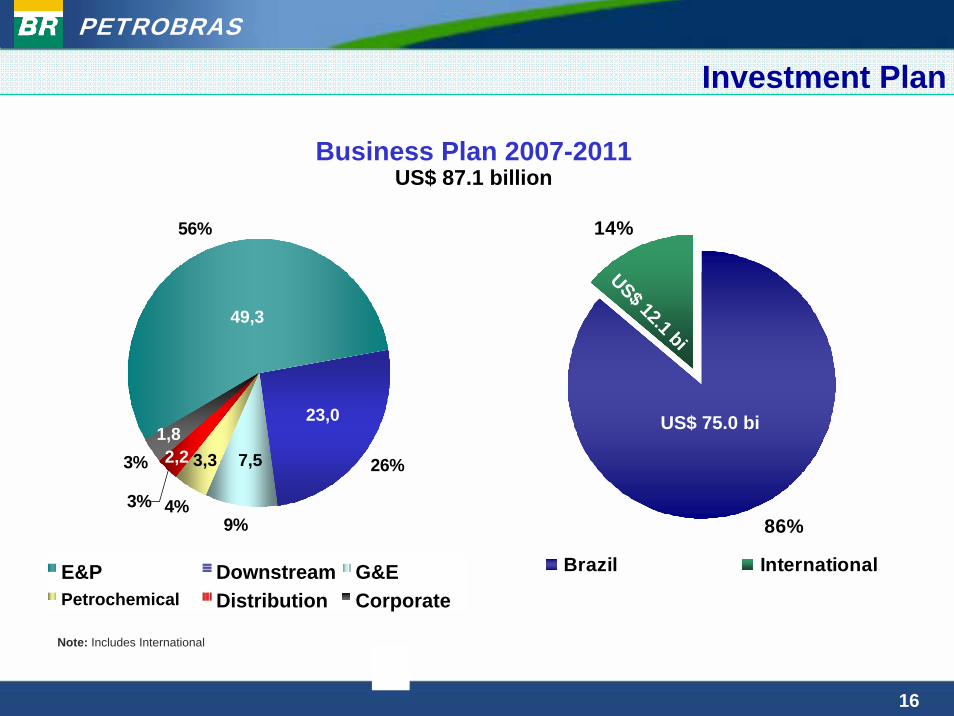
Note: Includes International
31.0
12.41.0
1.0
49.3
23.07.5
3.32.31.8
E&P Downstream G&EPetrochemical Distribution Corporate
9%4%
3% 26%
56%
3%
Business Plan 2007-2011US$ 87.1 billion
86%
14%
Brazil International
US$ 12.1 bi
US$ 75.0 bi
Investment Plan
49,3
23,0
7,53,32,21,8

PETROBRAS
17
Technological Programs: Research & Development
PROTER Refining
PROFEX Exploration
PROAMB Environment
PRAVAP Enranced Oil Recovery
PROPES Heavy Oil
INOVA Fuel Innovation
PROREC Optimization &
Reliability
PROCAP Deep Water
PROTRAN Transportation
PROGAS Gas
PROGER Renewable
Energy
PROMOBBasin Modeling

PETROBRAS
18
Petrobras
Strategic Planning
Governance
Economical Sustainability
Environmental Responsibility
Social Responsibility
Acknowledgment
PETROBRAS
19
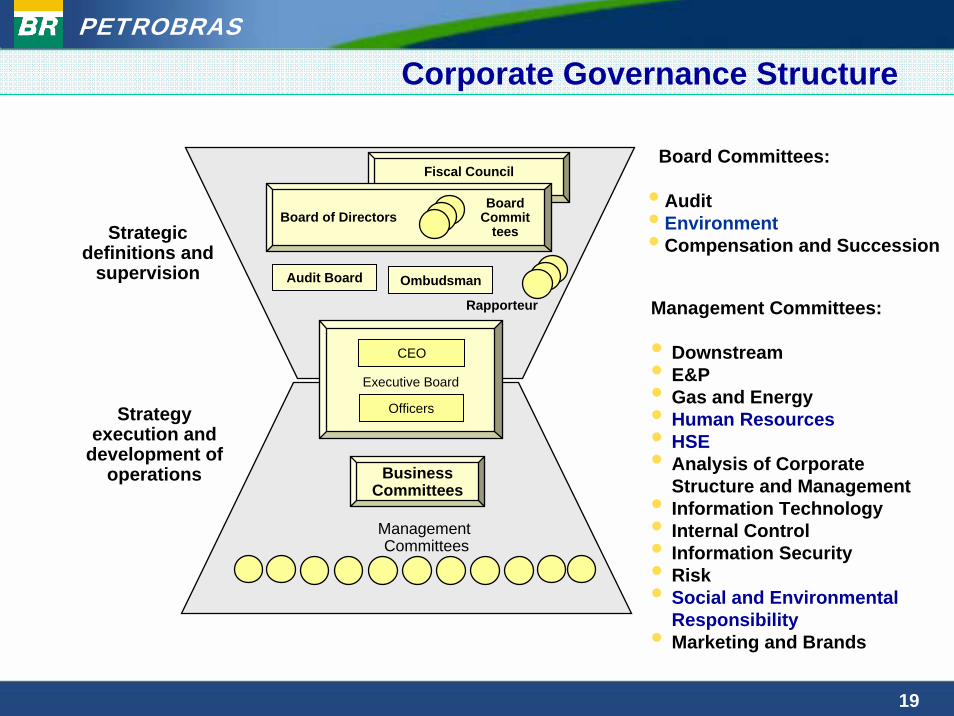
Corporate Governance Structure
Board Committees:
• Audit• Environment• Compensation and Succession
Management Committees:
• Downstream• E&P• Gas and Energy• Human Resources• HSE• Analysis of Corporate
Structure and Management• Information Technology• Internal Control• Information Security• Risk• Social and Environmental
Responsibility• Marketing and Brands
Rapporteur
Fiscal Council
Board of DirectorsBoard
Committees
Audit Board Ombudsman
Strategic definitions and
supervision
Strategy execution and
development of operations
Executive Board
CEO
Officers
Business Committees
ManagementCommittees

PETROBRAS
20
GovernancePetrobras Audit System
Internal Audit
External Audit
Audit CommitteeFiscal Council
Federal Accounts Court - TCU
Corporate Audits• Management Quality
Audit• HSE• etc
Business Unit Audits• ISO 9000• BS 8800/OHSAS
18001• ISO 14001• etc
SECCVMCNV

PETROBRAS
21
TransparencyTransparency with Stakeholders
• Signed the Partnering Against Corruption Initiative (PACI) -January/2005
• Signed the Global Compact – October/2003 – board member
• Website, Webcasts, roadshows, chats with investors and press
• Ombudsman in all subsidies
• Client Channel, Supplier channel, call center, Green telephone, emergency telephone, 0800 service phone
• Extractive Industry Transparency Initiative (EITI)
• Public selection of corporate sponsorship projects

PETROBRAS
22
General Ombudsman
• Reports directly to the Board of Directors
• Receives suggestions, complaints, claims, denunciation or exposes general problems;
• Guarantees confidentiality, independence, impartiality and neutrality
• Follows all Sarbanes-Oxley requirements;
• Forwards to the audit committee financial reports, accounting, audit and internal controls issues;
Communication and Denunciation Line
02000400060008000
10000120001400016000
2003 2004 2005
InternalDemandsExternalDemandsTotal
Num
ber o
f Dem
ands

PETROBRAS
23
Economical Sustainability
Governance
Environmental Responsibility
Social Responsibility
Acknowledgement
Petrobras
Strategic Planning

PETROBRAS
24
2 , 3 7 42 , 8 1 2
5 5 1
7 2 4
7 4 2
1 8 5
2 7 8
3 8 3
2 0 1 5
F o r e c a s t
Oil and Gas Production• 632 thous. bpd of oil exports in
2011;• US$ 49.3 billion CAPEX in the
2007-2011 period;• 3 new refineries
1 , 6 8 4 1 , 8 8 01 , 5 4 0 1 , 4 9 3
2 5 0 2 6 5 2 7 4
2 8 9
1 3 3
1 6 1 1 6 81 6 3
8 5
1 0 1
9 49 6
2 0 0 3 2 0 0 4 2 0 0 5 T a r g e t 2 0 0 6
O i l a n d N G L - B r a z i l N a t u r a l G a s - B r a z i l
O i l a n d N G L - I n t e r n a c i o n a l N a t u r a l G a s - I n t e r n a c i o n a l
2,036 2,020 2,217 2,403
3,493
4,556Thousand boed
7.8% p.a.
7.5% p.a.
T a r g e t 2 0 1 1

PETROBRAS
25
• In 2011 domestic natural gas production will double compared to 2005.
• US$ 22 billion investments in the natural gas chain in the 2007-2011 period
• Demand Flexibilization – studying LNG imports thourgh the Brazilian coast using floating storage and regasification units (FSRU or SRV)
• Quickest way to respond to increases in demand;
• More efficient and less polluting than diesel;
• ~20MM m3/day up to the end of 2008.
• US$ 1.6 billion investments up to 2011
Natural Gas Supply ExtensionNew investments will reduce the country’s dependence on imported gas
Existing Gaspipes
New Gaspipes2007-11 BP
Manaus
Belém
Recife
Salvador
São Paulo
Porto Alegre
Brasília

PETROBRAS
26
54,3% 53,1% 51,5% 50,5%
43,8%40,5% 39,7%
34,3%30,0% 29,7%
25,0%20,3%
12,9%
0,0%
10,0%
20,0%
30,0%
40,0%
50,0%
60,0%
Petr
obras
She
ll
T
otal
CNOOC
Stat
oil
BP
Exx
onMob
il
L
ukoil
Chev
ron
Conoco
Phillips
Reps
ol-YPF
Petr
oChina
Sinop
ec
Undeveloped Reserves / Total Reserves* (2005)
• Strong investments in production will optimize the development of Petrobras’proven reserves, aiming light oil production and a minimum reserve/production ratio of 15 years.
• Petrobras had a 55% success ratio for our exploration wells during 2005, with 38 wells classified as discovery or producing wells.
* Source: Evaluate Energy
Oil & Gas Reserves
17

PETROBRAS
27
Petrobras BiofuelsExperience:Going Beyond Legal Compliance
Petrobras BiofuelsExperience:Going Beyond Legal Compliance
- Brazilian Conditions - Legal Requirements- Petrobras Strategy- Research and Development
- Brazilian Conditions - Legal Requirements- Petrobras Strategy- Research and Development

PETROBRAS
28
Brazilian Conditions
Type Area(Mha)
• Total country• Native Amazon Forest• Secondary Amazon Forest and Others• Native Forests• Pasture• Temporary Cultures• Permanent Cultures• Available land• Available land with low impact (*)
851370180
619759
7.626390
Source: FAO, 2002 and EMBRAPA (*)
Land use in Brazil:
PETROBRAS
29
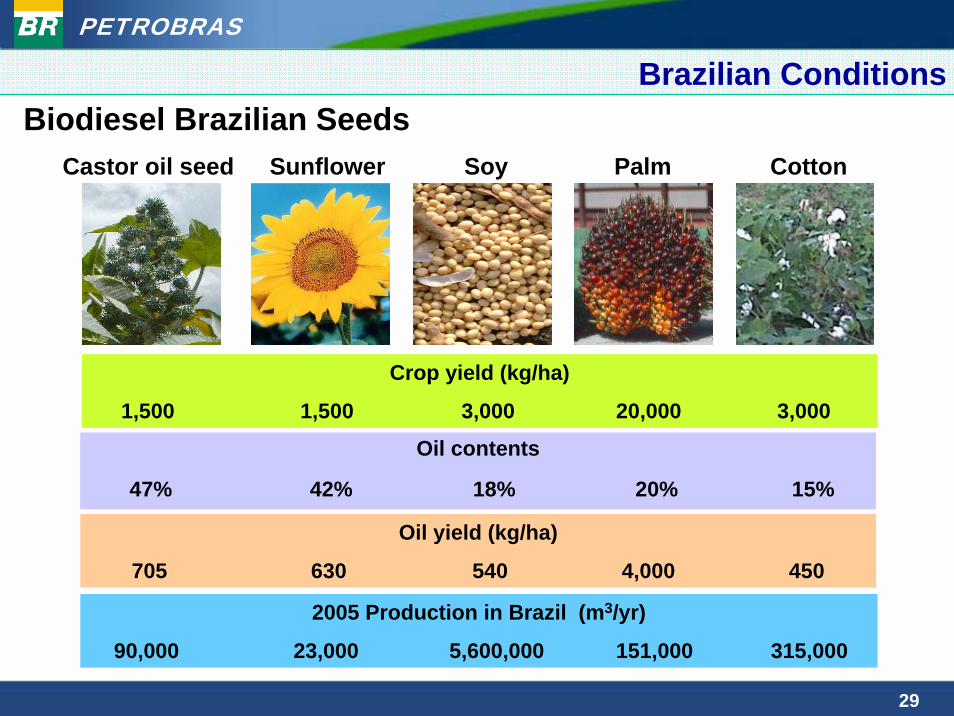
Biodiesel Brazilian SeedsCastor oil seed Sunflower Palm CottonSoy
Oil contents
47% 42% 18% 20% 15%
2005 Production in Brazil (m3/yr)
90,000 23,000 5,600,000 151,000 315,000
Oil yield (kg/ha)
705 630 540 4,000 450
Crop yield (kg/ha)
1,500 1,500 3,000 20,000 3,000
Brazilian Conditions

PETROBRAS
30
Raw Material ComparisonRaw Material Energy Output / Energy Input
Wheat 1.2
Corn 1.3 – 1.8
Sugar Beet 1.9
Sugar Cane(under Brazilian production conditions) 8.3
Raw MaterialProduction / ha
(kg)Quantity of Ethanol
/ haEnergy Output /
Energy Input
Sugar Cane 85,000 7,080 liter 8.3
Corn 10,000 4,000 liter 1.3 – 1.8
Brazilian Conditions
PETROBRAS
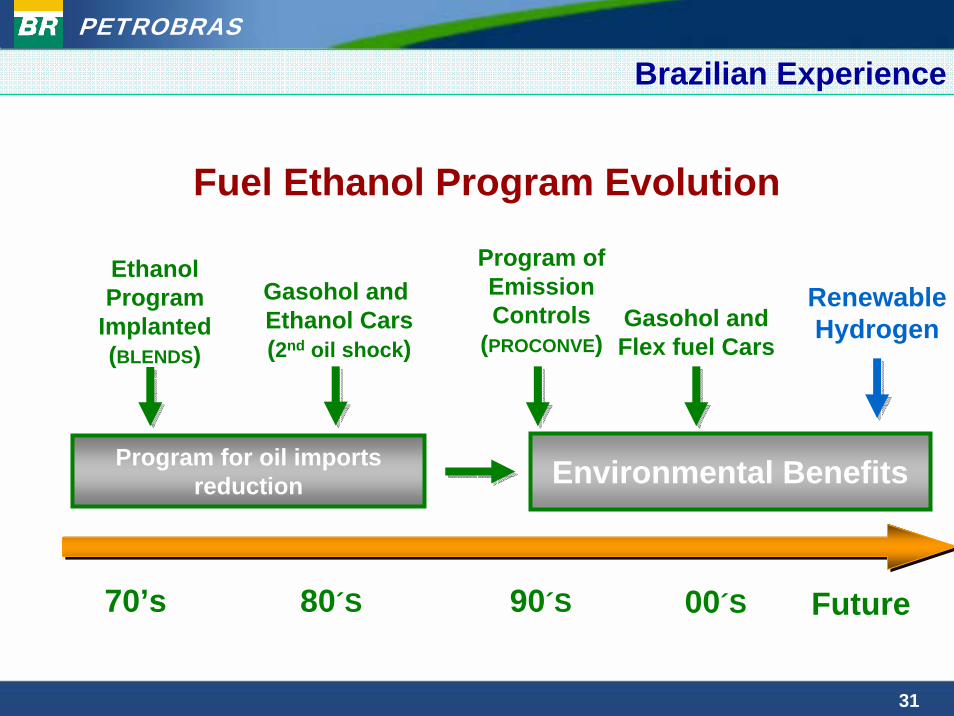
31
Fuel Ethanol Program Evolution
Brazilian Experience
Program for oil imports reduction Environmental Benefits
70’s 80´S 90´S
EthanolProgram
Implanted(BLENDS)
Gasohol and Ethanol Cars(2nd oil shock)
Program of Emission Controls
(PROCONVE)Gasohol and Flex fuel Cars
00´S
RenewableHydrogen
Future

PETROBRAS
32
Brazilian Ethanol Production
0
2,000
4,000
6,000
8,000
10,000
12,000
14,000
16,000
18,000
80/8
1
81/8
2
82/8
3
83/8
4
84/8
5
85/8
6
86/8
7
87/8
8
88/8
9
89/9
0
90/9
1
91/9
2
92/9
3
93/9
4
94/9
5
95/9
6
96/9
7
97/9
8
98/9
9
99/0
0
00/0
1
01/0
2
02/0
3
03/0
4
04/0
5
05/0
6
06/0
7
Crop Year
thou
sand
(m³/t
on)
Anhydrous Hydrous Total
2006/07Estimates
Ethanol Production
PETROBRAS
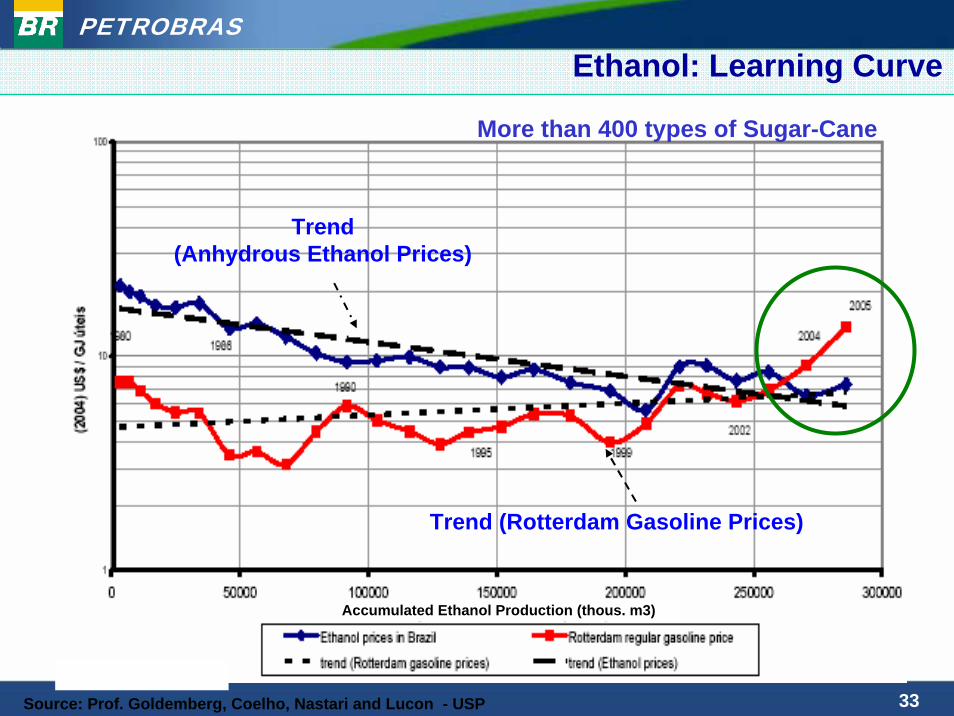
33
Ethanol: Learning Curve
Trend (Rotterdam Gasoline Prices)
Source: Prof. Goldemberg, Coelho, Nastari and Lucon - USP
Trend(Anhydrous Ethanol Prices)
More than 400 types of Sugar-Cane
Accumulated Ethanol Production (thous. m3)
PETROBRAS
34
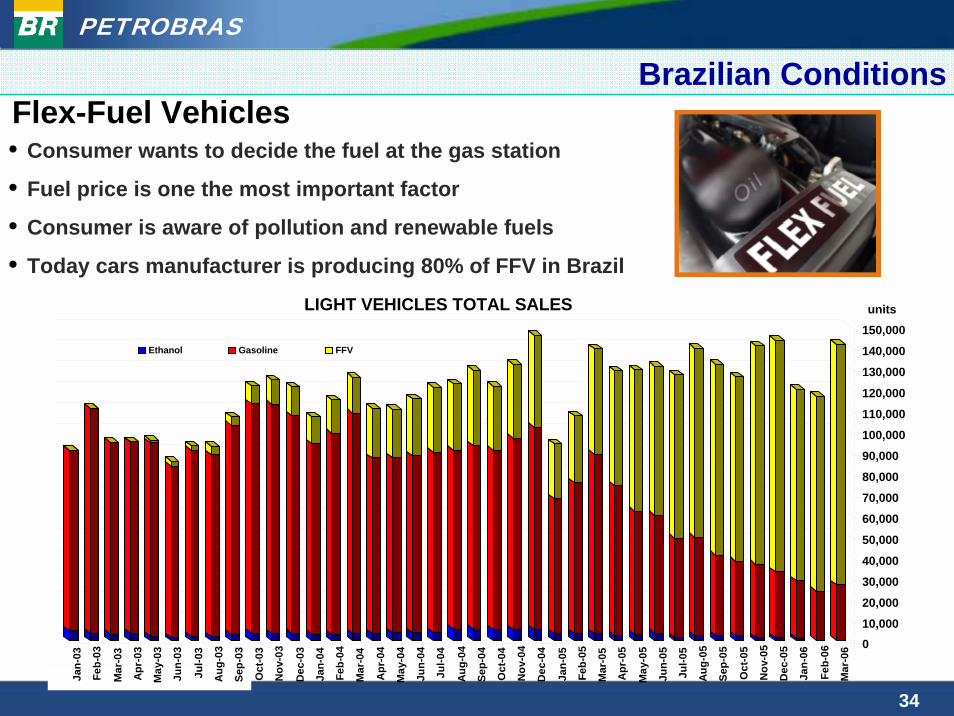
• Consumer wants to decide the fuel at the gas station
• Fuel price is one the most important factor
• Consumer is aware of pollution and renewable fuels
• Today cars manufacturer is producing 80% of FFV in Brazil
010,000
20,000
30,000
40,000
50,000
60,000
70,000
80,000
90,000
100,000
110,000
120,000
130,000
140,000
150,000
units
Jan-
03
Feb-
03
Mar
-03
Apr
-03
May
-03
Jun-
03
Jul-0
3
Aug
-03
Sep-
03
Oct
-03
Nov
-03
Dec
-03
Jan-
04
Feb-
04
Mar
-04
Apr
-04
May
-04
Jun-
04
Jul-0
4
Aug
-04
Sep-
04
Oct
-04
Nov
-04
Dec
-04
Jan-
05
Feb-
05
Mar
-05
Apr
-05
May
-05
Jun-
05
Jul-0
5
Aug
-05
Sep-
05
Oct
-05
Nov
-05
Dec
-05
Jan-
06
Feb-
06
Mar
-06
LIGHT VEHICLES TOTAL SALES
Ethanol Gasoline FFV
Flex-Fuel VehiclesBrazilian Conditions

PETROBRAS
35
LIGHT VEHICLES FLEET(thousand units)
10,46311,399 12,019
12,75513,506 14,075 14,439 14,680 14,431
(76%)
3,716
3,4713,221
2,9722,712
2,4492,230 1,996 1,820 1,678
(9%)
499
546597
632686
734764 782 810
843 (4%)
335 1,108 (6%)
1,004 (5%)807626439288
1435718
9
5
44
0
2,000
4,000
6,000
8,000
10,000
12,000
14,000
16,000
18,000
20,000
1996 1997 1998 1999 2000 2001 2002 2003 2004 2005
Gasoline Ethanol Diesel Oil CNG FFV
FFV since 2003CNG vehicles
9,088
Gradual Replacement of Conventional Engines

PETROBRAS
36
2005to
2007(2% allowable)
2008to
2012(2% required)(5% allowable)
From 2012on
(5% required)
Brazilian market0 – 5.2 million barrels
Brazilian market5.2 – 15.7 million barrels
Brazilian market15.7 million barrels
Law 11.097/2005 – established minimal percentage for biodiesel mix in diesel
• Addition of 20-25% of anhydrous ethyl alcohol fuel to gasoline as per Agriculture Ministry determination
Legal RequirementsBiodiesel Requirement
Anhydrous Ethanol Requirement

PETROBRAS
37
• Given to biodiesel producers that:• Purchase a minimum percentage of raw materials from family
agriculture: • 50% NE and semi-arid region• 10% NW and CW region• 30% SE and S region
• Sing a formal contracts with the family agriculture that includes:• Contract period• Value to purchase and price readjustment criteria • Raw material delivery conditions • Safeguards for each party• Identification and agreement that a representative of the farmers
participated in the negotiations• Assure assistance and technical training for the agriculture families
Legal RequirementsVoluntary Social Seal

PETROBRAS
38
Alíquotas de PIS/COFINS(em R$/litro)
General 0,218 Agrobusiness + N/NE + Semi-Árid + mamona/palma
0,151
Family Agriculturein any reqion 0,070
Family Agriculture + N/NE + Semi-Árid +mamona/palma 0
R$ 0,218 / litro
R$ 0,151 / litro
R$ 0,070 / litro
R$ 0,0 / litro
Federal Taxes
PETROBRAS
39
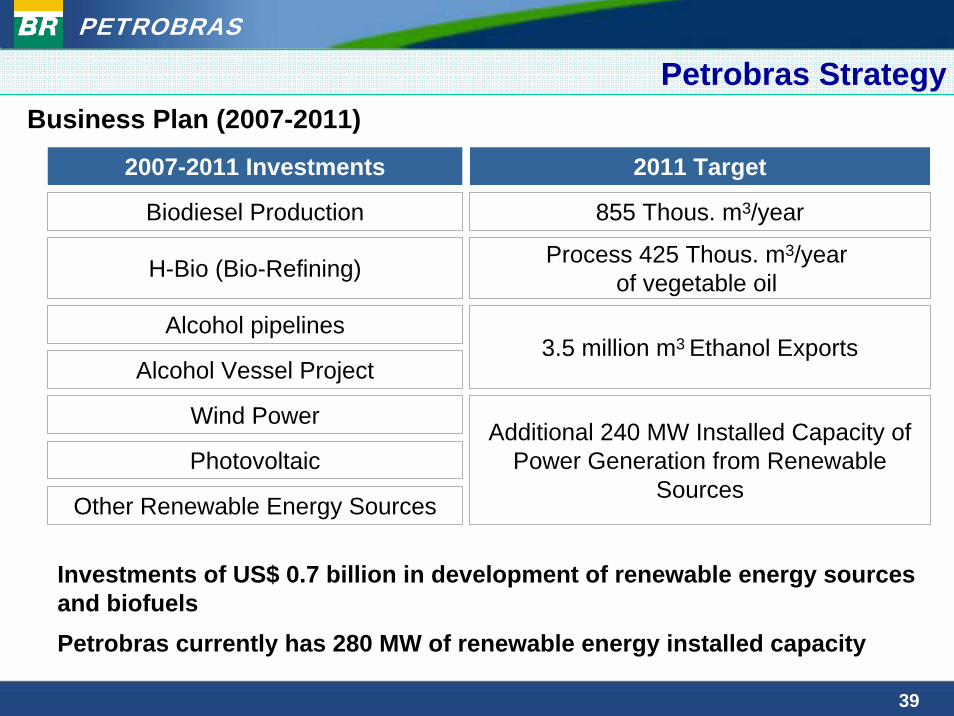
2007-2011 Investments 2011 Target
Biodiesel Production 855 Thous. m3/year
H-Bio (Bio-Refining) Process 425 Thous. m3/year of vegetable oil
Wind Power
PhotovoltaicAdditional 240 MW Installed Capacity of
Power Generation from Renewable Sources
Alcohol pipelines3.5 million m3 Ethanol Exports
Alcohol Vessel Project
Other Renewable Energy Sources
Investments of US$ 0.7 billion in development of renewable energy sources and biofuelsPetrobras currently has 280 MW of renewable energy installed capacity
Petrobras StrategyBusiness Plan (2007-2011)

PETROBRAS
40
BA
MG
CE
Montes Claros
Quixadá
semi-arid region
3 Biodiesel Production Projects
Capacity: 171 thousand m3/year
Investments: ~ US$ 60 million
Start up: 4 Q/2007
InputsFamily Agriculture: castor, pinhão manso, cotton, and palm. Complementary: soy.
All Petrobras Biodiesel has Social Fuel Seal
Candeias
Petrobras Strategy
Raw Material Costs US$/bblPinhão Manso Oil 43Palm Oil 46Soy Oil 73Animal Fat 41Source: UOP

PETROBRAS
41
Capacity Ton/year 10,000 35,000 65,000 100,000
Chemicals R$/litro 0.11 0.10 0.10 0.10
Energy R$/litro 0.05 0.02 0.02 0.02
Depreciation R$/litro 0.08 0.08 0.05 0.04
Labor R$/litro 0.11 0.04 0.02 0.015
Maintenance R$/litro 0.05 0.04 0.03 0.03
Oper Cost R$/litro 0.40 0.30 0.22 0.21
Investment US$ MM 5 8 10 12
Laboratory US$ 500,000
Biodiesel Production Cost
Source: Dedini, Intecnial, Lurgi

PETROBRAS
42
Already over 2900 stations offering Biodiesel
October 2006
September 2006
September 2006
January 2007
January 2007
October 2007
B100 sales estimates up to Dec 2006:• 26,688 m3 for 3520 stations• 25,000 m3 for 3000 large consumers
Petrobras Strategy

PETROBRAS
43
Auction Quantity(mil m3) Delivery
NOV/2005 70 JAN/DEZ/2006
MAR/2006 170 JUL/2006 TO JUN/2007
11/JUL/2006
12/JUL/2006
Ofertado 1.266Arrematado 600
10
20
30
40
JAN/DEC/2007
Biodiesel Sales in ANP´s Auction (B100 m3 )
Price(R$/L)
1,90 + ICMS
1,86+ICMS
1,75+ICMS
Voluntary Participation of Petrobras and Refap – start sales ahead of schedule
Petrobras Strategy

PETROBRAS
44
Production Chain and Technology Paths
Agribusiness
Farming
Seeds
or
or
or
Ethanol
Methanol
Glycerin + Others
Biodiesel
B2 or B5mixture
orDiesel
Distributors
DieselRefinery
Hydrogen Diesel Fractions
Stations
ProcessedOil
Crushing
Transerestification
Complementary and not competitive processes
• H-Bio: refining process that utilizes vegetable oils as an input, in order to obtain diesel oil;• Hydrogenation of a blend of diesel and vegetable oils;

PETROBRAS
45
100 liters
soy bean oil
2,1 Nm3
fuel gas96 liters
diesel oil
2,2 Nm3
propane8,8 liters
water
+ + +
Vegetable/animal oil hydrogenationRenewable Energy Research Program

PETROBRAS
46
Potential H-Bio Use
*do total de óleo de soja exportado 2288 mil m³ são de óleo bruto e 535 mil m³ de óleo refinado**volume estimado de diesel a ser importado em 2006 = 1.709 mil m3 Sources: Abiove e Petrobras
2006-2007
2008
• H-BIO in 4 refineries – using up to 256 thousand m3/year of vegetable oil • 9.1% of total soy oil export• Equivalent to 15% of Diesel imports
• H-BIO in 5 refineries• Using up tp 425 thousand m3/year of vegetable oil • 15.1 % of total soy oil export• Equivalent to 25% of Diesel imports
Main advantages:• No waste• Simple logistics• Improves diesel quality• Flexible vegetable oil source
Petrobras Strategy

PETROBRAS
47
Facts about Ethanol Market in 2005
608 x 103 KCAL
598 x 103 KCAL
512 x 103 KCAL
1718 x 103 KCAL
1 Ton Sugar Cane
SUGAR 153 KG
BAGASSE(50% UMIDADE)
276 KG
LEAVES (*)(15% HUMIDY)
165 KG
1 Ton-Field1718 x 103 KCAL
1.2 boe
1 boe1,386 x 103 KCAL
~=
• Ethanol global market is 46.5 Billion Liters (2005)
• Ethanol as a Fuel is 30.6 Billion Liters (67% of total ethanol production)
• Today the ethanol consumption is 2.6% of gasoline MKT
• 10% of ethanol in gasoline will represent 118 Billion Lt

PETROBRAS
48
Marine Terminal Rio de Janeiro
Marine Terminal São Paulo
New Ethanol Pipeline (800 km)
New Water Wayfor Ethanol Ethanol Export
8.0 Million m3 in 2012
Ethanol Export LogisticsPetrobras Strategy

PETROBRAS
49
• Recently, Petrobras incorporated Brazil-Japan Ethanol Inc.
• The company will import and distribute Brazilian-produced ethanol in Japan;
• Development of technical and commercial solutions for the reliable and long term supply of alcohol in the Japanese market;
• Petrobras will break into one of the most complex and important energy markets in the World:
• ethanol logistics distribution
• fuel distribution sector in Japan.
Brazil-Japan Ethanol Inc.
Petrobras Strategy
Others• Exploiting opportunities for sales and technology transfer in
Ecuador, Venezuela, Cuba and Nigeria.
PETROBRAS
50
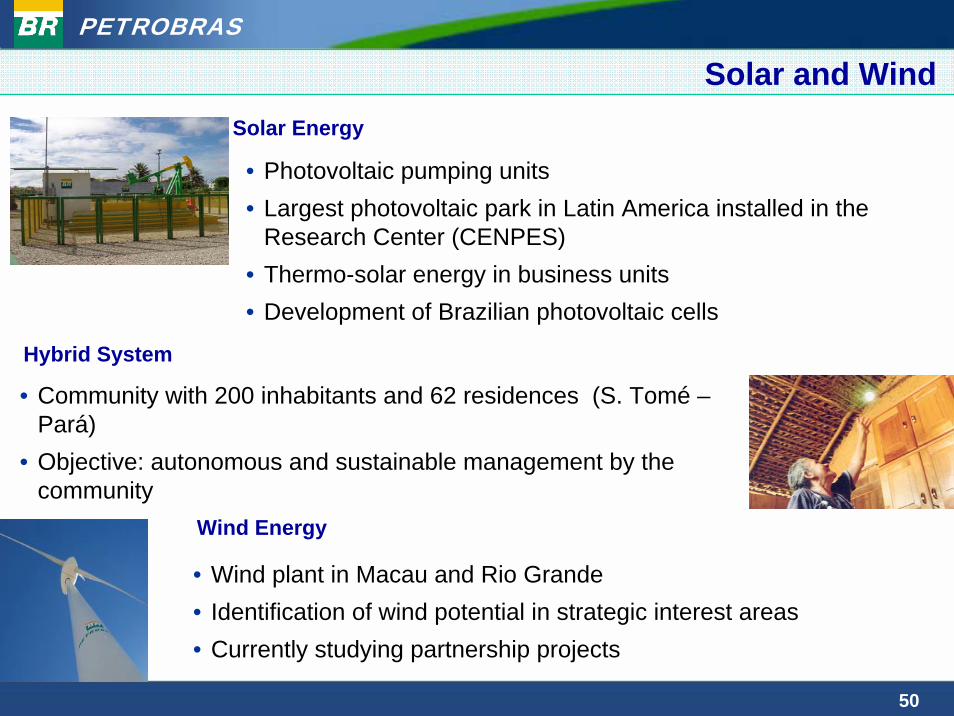
• Photovoltaic pumping units• Largest photovoltaic park in Latin America installed in the
Research Center (CENPES) • Thermo-solar energy in business units• Development of Brazilian photovoltaic cells
Solar and Wind
Wind Energy
• Wind plant in Macau and Rio Grande• Identification of wind potential in strategic interest areas • Currently studying partnership projects
Solar Energy
Hybrid System
• Community with 200 inhabitants and 62 residences (S. Tomé –Pará)
• Objective: autonomous and sustainable management by the community

PETROBRAS
51
Renewable Energy Research Program• Budget: US$ 32 million• 66 R&D projects• 6 Research Lines
• Biofuels• Biomass• Wind
• Solar Photovoltaic• Solar Thermal• Other renewables
Example: Hydrogen
• H2 sustainable production• Bio-hydrogen• H2 storage in nanotubes• Distribution and supply
technologies
Hydrogen Hybrid Bus• High-end technology• Development with local
partners• Operation will start Dec 2006

PETROBRAS
52
Lignocellulosic Bioethanol• Raw material: sugar cane bagasse
• Proprietary process
• Successful ongoing bench-scale experiments• Patent issued• End of tests: 4thQ 2006
• Pilot plant start-up: 1sQ 2008
• Demonstration plant start-up: 3rdQ 2010
Renewable Energy Research Program
PS8

Slide 52
PS8 PETROBRAS S.A.; 24/5/2004

PETROBRAS
53
Synthetic bio-fuel (BTL)
• GTL small pilot-plant on stream since 1st Q 2004
• High yield FT Catalysts patented (2004-2005)
• Combinatorial Catalysis Unit on stream since 4th Q 2005
• Start-up cold prototype unit for fluid dynamic tests: 4th Q 2006
• Start-up GTL 1 bpd pilot plant: 4th Q 2007
• Start-up integrated biomass gasification pilot plant: 2nd Q 2008
• Start-up 300 bpd demonstration plant: 4th Q 2011
Renewable Energy Research Program
PS9

Slide 53
PS9 PETROBRAS S.A.; 24/5/2004
PETROBRAS
54
Agenda
Petrobras
Strategic Planning
Economic Sustainability
Environmental Responsibility
Social Responsibility
Acknowledgement
Governance
PETROBRAS
55
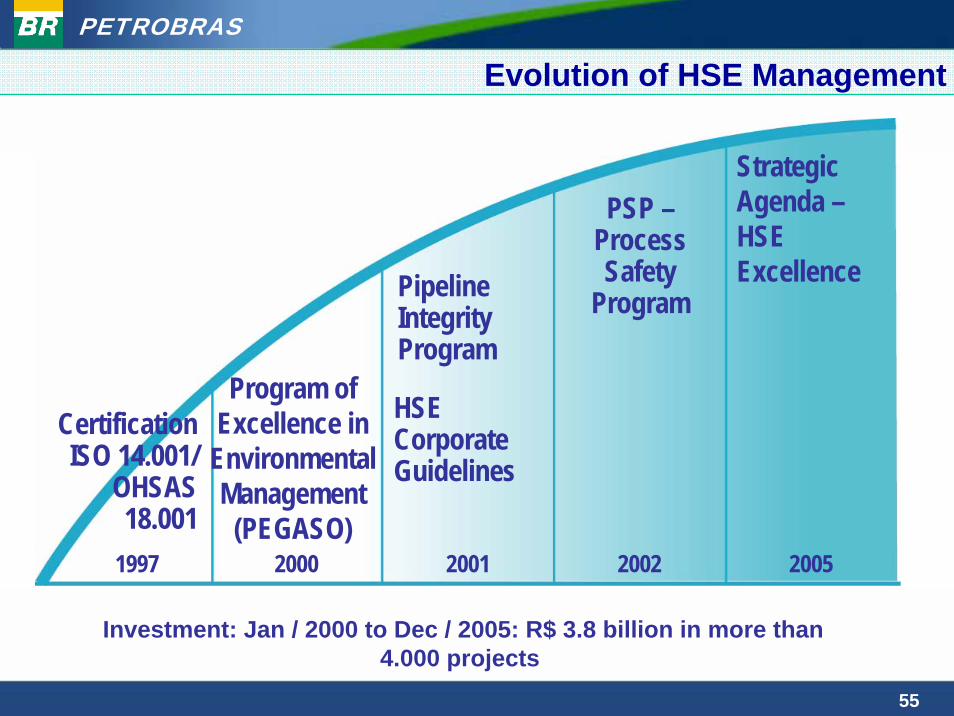
Strategic Agenda –HSE Excellence
1997 2000 2001 2002 2005
CertificationISO 14.001/
OHSAS 18.001
Program of Excellence in
Environmental Management
(PEGASO)
Pipeline Integrity Program
HSE Corporate Guidelines
PSP –Process Safety
Program
Evolution of HSE Management
Investment: Jan / 2000 to Dec / 2005: R$ 3.8 billion in more than4.000 projects

PETROBRAS
56
0.42
1.90
2.82
1.53
0.900.95
0.00
0.50
1.00
1.50
2.00
2.50
3.00
1 2 3 4 5 62000 2001 2002 20052003 2004
Spills – cubic meters
HSE Excellence Program
PEGASO
PipelineIntegrity Program
HSE CorporateGuidelines
PSP – Process Safety Program5,983
269MPL* 2011 = 601 m3
Oil and NGL Production (Mbpd)
1,846
1,323MPL* 2011 = 137,210 t
151,617
158,620
SOx Emissions – tons
Eco-efficiency of Operations
*MPL = Maximum Permissible Limit
Insurance Premium/ Insurance Value

PETROBRAS
57
0
2000
4000
6000
8000
10000
12000
bp shell Total ExxonMobil Statoil Petrobras0,00
0,501,00
1,50
2,00
2,503,00
3,50
2002 2003 2004 2005 spill/prod
Petrobras and Peers - Spills (m3) *
• Waste, Effluent and Emissions Inventory• Emissions Inventory includes: CO2, CH4, CO, SOx, NOx, N2O, MP, COV , flare
and fuel consumption• Water availability assessment in critical watersheds • Pre-qualification and audit water treatment companies
*spilled oil that reached the environment
spill
ed o
il (m
3 )spilled oil (m
3)/ production (bpd)
Eco-efficiency of Operations

PETROBRAS
58
• Investments around US$ 6.9 million in E&P:• Baseline and impact assessment of Deep Water in UN-BC (2001-2004)• Monitoring of Sergipe and Alagoas Basin (2001-2004)• Monitoring of Potiguar and Ceará Basins (2001 - 2005)
• Integrated remote sensing for surface monitoring for hydrocarbons from accidental or natural events
• Environmental sensitivity study around 108 mil km2 of pipelines and 6 thousand km around coastal terminals
• R$ 9 million research for ecosystems in Guanabara Bay
Biodiversity
PETROBRAS
59
0,00
5,00
10,00
15,00
20,00
25,00
bp Chevron Exxon Shell Total Petrobras0,00
20,00
40,00
60,00
80,00
100,00
120,00
140,00
160,00
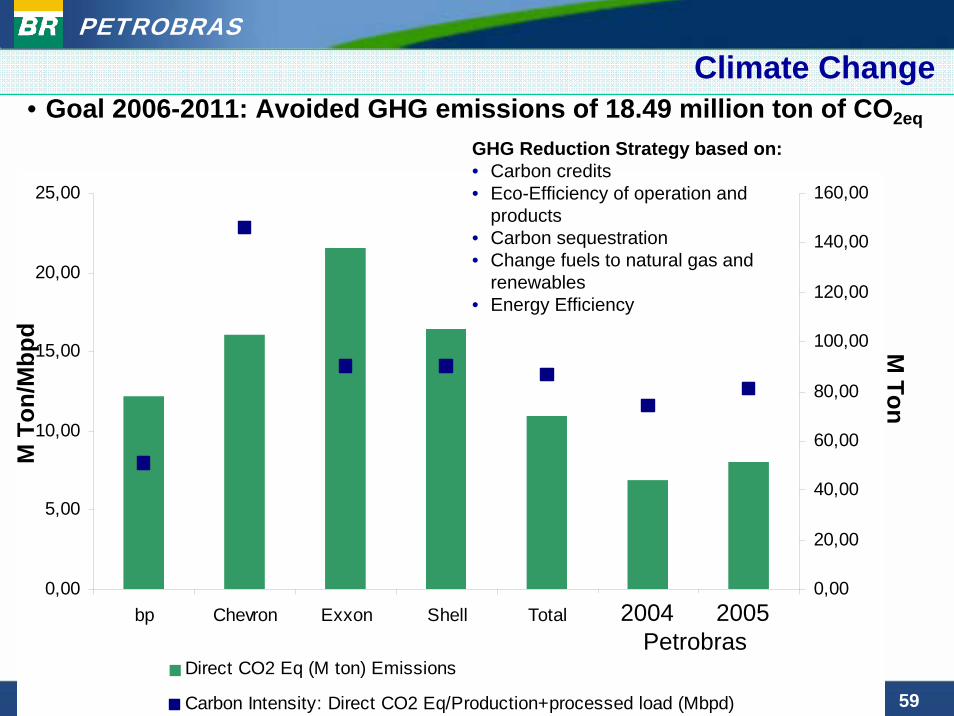
Direct CO2 Eq (M ton) Emissions
Carbon Intensity: Direct CO2 Eq/Production+processed load (Mbpd)
• Goal 2006-2011: Avoided GHG emissions of 18.49 million ton of CO2eq
Climate Change
GHG Reduction Strategy based on: • Carbon credits• Eco-Efficiency of operation and
products• Carbon sequestration• Change fuels to natural gas and
renewables• Energy Efficiency
2004 2005Petrobras
M Ton
M T
on/M
bpd

PETROBRAS
60
• CO2 Separation and Capture (4 projects)• Underground Geologic Repositories (1
project)• CO2 Carbonation (1 project)• Carbon fixation in biomass (8 projects)
• Reforestation pilot (até 50 ha)• Consortium with cultures for income
generation• Methodology validation to estimate
amount of fixed carbon• Biomes: Atlantic Forest, Amazonia
Rainforest, Cerrado, Araucária, Restinga, Caatinga
• Species accelerated growth• Microalgaes
Carbon Sequestration Projects Portfolio
Climate Change

PETROBRAS
61
Energy EfficiencyCONPET Program• EconomizAr Project – Reduced 13% of diesel consumption, equal to
approximately 50,000 bpd• Transportar – Up to 12/05,
4,600 evaluations in 2,300 vehicles from 300 companies. 57,279 ton/year CO2 avoided emissions.
• Natural gas bus powered • CONPET in School• National Award• Brazilian Label Program – Conpet
Seal
• Energy Efficiency Program in Petrobras – since 1991
471
522
488
465479479
10,5
11,110,8
10,4
9,7
10,2
430440450460470480490500510520530
2000 2001 2002 2003 2004 2005
Mill
ion
GJ
9,0
9,5
10,0
10,5
11,0
11,5
Num
ber o
f Tim
es
Petrobras Enegy Consumption
Sales/Petrobras Energy Consumption

PETROBRAS
62
Theme: WATER - Freshwater and Marine, including their biodiversity
Sponsored Projects – Petrobras Ambiental
• Module I : Public Selection
• Module II : Local Initiatives
• Module III : Existing Projects
• Module IV : Volunteers
• Self-sufficiency Planning• Environmental Education• Processes, Experiences and Results
Systematization• Accompanying and valuation instruments
The Program admits four main types of guidance:
• Recovery and conservation of environments that have a water body (surface, underground, coastal or marine)
• Implementation of integrated water resources management
• Promotion of rational use of water resources
• Environmental integrity of the water bodies around Petrobras facilities.
Investments of US$ 15 million in 186 projects
Modules I and II Requirements: The projects shall contemplate the following actions:
*Free conversion using average exchange rate

PETROBRAS
63
Agenda
Petrobras
Strategic Planning
Economic Sustainability
Environmental Responsibility
Social Responsibility
Acknowledgement
Governance

PETROBRAS
64
30%
40%
50%
60%
70%
80%
1996 1998 2000 2002 2003 2004 2005
Employees Satisfaction Index
11
9,69,4
9,5
10,4
2001 2002 2003 2004 2005
% of Women in Management Positions
HR Practices in Petrobras• Gender Commission• Ambiance Survey• Ethics Code• Woman Assistance Program• Petrobras University – 154
hours per year average of training per employee
• Personal Performance Management
• New employees training• Leader Performance
• Result: 3,17% turnover• Petrobras chosen by university
students as the dream company*
goal
Human Resources
* Source: Research accomplished in 2005 by RH Júnior Consulting

PETROBRAS
65
Supplies Qualification Requirements
TECHNICAL
LEGAL
ECONOMICHSE
QUALITY & SOCIAL
RESPONSIBILITY
ReferenceQuality:ISO 9.001Social Resp. : ETHOS
Reference:Environmental : ISO 14.001Health and Safety :OHSAS 18.001
Requirements for pre-qualifying suppliers
ACCORDING TO THE GOOD OR SERVICESOME REQUIREMENTS ARE OBLIGATORY
SOME ATTRIBUTES ARE REQUIRED FOR BEING INCLUDED IN THE DATABASE DEPENDING ON THE GOOD OR SERVICE

PETROBRAS
66
Social & Environment Responsibility in services contracts
1. SCOPE DEFINITION
2. BIDDING OR DIRECT NEGOTIATION
3. FORMALZE CONTRACT
4. MANAGEMENT AND INSPECTION
5. VALUATION AFTER CONCLUSION
S&ER REQUIREMENTS
BAD( Management, Result )
2.1 SELECTION DATABASE(Containing S&ER
Requirements)
CONTRACTOR
Goods and Services Suppliers

PETROBRAS
67
• Prominp - investments of R$ 200 million to qualify 70 thousand professionals between 2005-2007
• TEAR (Weaving Responsible Network): partnership Inter-American Development Bank, ETHOS and IBP
• 33 projects to develop new suppliers to substitute imports – R$ 53.5 million
• Pact with Government Agency (Sebrae) to include small and medium companies in the supply chain
• “Mechanics Friend Program” - since 2001 23,500 people have participated
• “Transport Quality Program” from BR – aims to reduce accidents through training and qualification
Petrobras demands high quality, but the company also helps the local market to achieve necessary standards
Goods and Services Suppliers

PETROBRAS
68
Improvement of the Supply Chain S&E Responsibility• Partneership with ETHOS Institute• Reporting to Ethos Indicators• Assessement of Results• 2003: 105 companies assessed• 2004: 195 companies assessed• 2005: 400 companies assessed
• Implementing CSR for micro and small companies• Petrobras’ Role (anchor of Oil and Gas sector): commitment, expertise, staff,
operational costs, seminars, working groups and qualification courses.
TEAR (Weaving Responsible Network): partnership Inter-American Development Bank, ETHOS and IBP
Goods and Services Suppliers
• Local baseline of Micro and Small companies• Development plan for Micro and Small companies• Qualification of Micro and Small companies to be potential suppliers for the Oil & Gas Sector• Networking and cooperation between local companies and Oil & Gas Companies, • Institutional support of Oil & Gas Companies• Network and cooperation between large, micro and small suppliers to become local suppliers
Main Initiatives of the Agreement Petrobras/Sebrae

PETROBRAS
69
• Planning (risk analysis, environmental aspects, legal compliance and goals)
• Structure and responsibility• HSE Training• Involvement and communication• Accidents and incidents treatment• Critical analysis by the administration • HSE management system audit• Organization and Cleaning• Subcontracts
HSE requirements that will be requested in every contract with adegree of flexibility that will depend on the level of the contract’s risk
1
2
3
4
OCURRANCE PROBABILITYB DA C
GRAV
ITY
QI
QIIQIII
QIV
SERVICES CATEGORIES EXAMPLE
Goods and Services Suppliers

PETROBRAS
70
Purpose:• Transmit Petrobras values in the entire supply chain
Scope• 60 large industrial clients in Brazil• Products: Gasoline, diesel and QAV (over 60% of sales)
Progressive Bonus Levels:• Level 1: HSE management system plan structured• Level 2: HSE management system implemented• Level 3: ISO 9001, ISO 14001 and OHSAS 18001
certification
Pilot Program• In Paulinia with 20 clients, over R$1million paid in bonuses
in one year.
Clients
Responsible Partnership Program

PETROBRAS
71
0
1
2
3
4
5
6
bp Shell Total ExxonMobil Petrobras
• Fatal and serious accidents videoconferences
• HSE Alerts
• Communication of the blockage actions implemented
• Indicator audit and scope analysis
• Leadership Training: Systemic Accidents, Incidents and Deviations Investigation
• Best Practices Seminar – 1,300 professionals
• Behavior audits
The performance measured by LTIF* and Fatalities has been improving as a consequence of the implementation of best practices, such as:
* Lost Time Injuries Frequency– number of accidents involving leave from work per million man-hours of risk exposure.
0
10
20
30
40
50
60
bp Shell Total ExxonMobil Petrobras
2002200320042005
LTIF*
Number of Fatal Accidents
n.a.
n.a.
Health and Safety

PETROBRAS
72
OCURRENCES RECORD
PETROBRAS’ PYRAMID
2002 2003 2004 200521 (1) 19 (1) 16 (1) 15 (1)
512 (24,38) 511 (27) 505 (32) 516 (35)---- ---- ---- 4,183 (279)---- ---- ---- -------- 226,914 490,000 515,000
(11,943) (30,625) (34,334)HHER HHER HHER HHER
333,860,291 415,886,619 484,598,772 533,029,635
INTERNATIONAL ACCIDENT PYRAMID
FATALITYACIDENTES WITH LOST
TIMEACIDENTES WITHOUT LOST
TIME
INCIDENTS
DEVIATION
1
30
300
3.000
30.000
Working in the base of the pyramid administrating deviation and applying behavioral audit reduces even more serious accidents.
Health and Safety

PETROBRAS
73
Aspects and risks linked to the work environment:
Aspects and risks linked to life style:
• Occupational Hygiene • Ergonomics • Emergency Health• Impact of the company’s activities in community health
• Program for the Health Promotion
EPIDEMIOLOGICAL VIGILANCE
Health and Safety

PETROBRAS
74
• Proposes sustainable development for communities with limited social inclusion.
• Supports communities to achieve “Local Agenda 21” with democratic participation.
Community Relations
• Identifies necessary actions for sustainable local development.• Qualifies individuals and organizations, aligning actions to Petrobras’
mission in respect to Social Responsibility.• Provides knowledge and training to communities.

PETROBRAS
75
• Input for the selection of projects and activities
• An opinion survey among communities directly impacted by exploration, production and refining activities is being held for the third time in the units located in Brazil and for the first time in Argentina, Bolivia and Colombia. More than 12,000 people will be interviewed.
• Stakeholder Relationship Activities
• Emergency Simulation Exercises
• Visits Program
• Thematic Panels
• Educational Projects
Community Relations

PETROBRAS
76
Stakeholders
CommunicationDepartment
BA/BU
Requests and
conditions
Demands consolidation
Projects selected and
approved
registration Project monitoring
Registers and
ApprovesProject
Select Socio-environmental
Projects(filter and
selection criteria)
Demand Identificat
ion
Concludes project and
issues a Report
Stakeholders
CommunicationDepartment
BA/BU
Stakeholders
CommunicationDepartment
BA/BU
Stakeholders
CommunicationDepartment
BA/BU
Approval Project monitoring
Project Monitoring
Report
Community Relations

PETROBRAS
77
60 MILLION755Total
17 MILLION311Childhood and Adolescence Fund payment
254 THOUSAND8Others
1.5 MILLION15Advanced Program of Assistance and Treatment of Disabled People
7 MILLION181Social endeavor
4 MILLION27Children and adolescents rights guarantee
11 MILLION 111Employment and income creation
20 MILLION 102Education and professional qualification for youth and adults
AMOUNT INVESTED IN 2005 (US$)
NUMBER OF PROJECTS
LINHAS DE ATUAÇÂO
Community Investments
More than 2000 volunteer workers in more than 1,200 projects
• Total Investments from 09/2003 to 12/2006 : US$ 125 million*
*Free conversion using average exchange rate

PETROBRAS
78
Community Investing• Petrobras is among the companies that invest the most on the
community well being
Source: Goldman Sachs 2005
Community Investment as a percentage of CAPEX

PETROBRAS
79
Agenda
Petrobras
Strategic Planning
Economic Sustainability
Environmental Responsibility
Social Responsibility
Acknowledgement
Governance

PETROBRAS
80
SiRi Benchmark
Othercompaniesinclude (in
alphabeticalorder): BG,
BP, Chevron, ENI,
ExxonMobil, OMV, RepsolYPF, Royal Duch Shell,
Total
Industry Average

PETROBRAS
81
Goldman Sachs

PETROBRAS
82
R2 = 0.4121
-20
-10
0
10
20
30
40
50
0 10 20 30 40 50 60 70 80 90 100
Sustainability Score (%)
RO
E 5
year
ave
rage
(%)
DJSI
DJSI
DJSI DJSI
DJSI
DJSI
DJSIDJSI
Petrobras
Dow Jones Sustainability Index
Source: Sam Research, 2004-1999 data

PETROBRAS
83
Thank You
Visit our website: www.petrobras.com.br/ri/
For more information please contact:Petróleo Brasileiro S.A – PETROBRAS
Investor Relations DepartmentRaul Adalberto de Campos– Executive Manager
E-mail: [email protected]. República do Chile, 65 – 22o andar
20031-912 – Rio de Janeiro, RJ(55-21) 3224-1510 / 3224-9947