Embed Size (px)
Citation preview
Petroleum Refinery Fenceline Monitoring Stakeholder Engagement
Webinar for State, Local and Tribal Governments
June 22, 2016
Overview
► Fenceline Monitoring Requirements
► Why Monitor for Benzene?
► What is the “Action Level”?
► What are the Benefits to the Public?
► Schedule
► Public Display of Data - Examples
► Stakeholder Input
► Additional Information
2
Fenceline Monitoring Requirements for Petroleum Refineries
► In 2015, in large part due to stakeholder input, EPA’s air pollution rule for refineries includes:
► Monitoring air concentrations of benzene along the perimeter (e.g. at the fenceline) of U.S. refineries
► Reporting the monitored benzene concentrations to EPA
► Conducting analysis and corrective action upon exceeding an established benzene concentration limit along the perimeter of these facilities
3
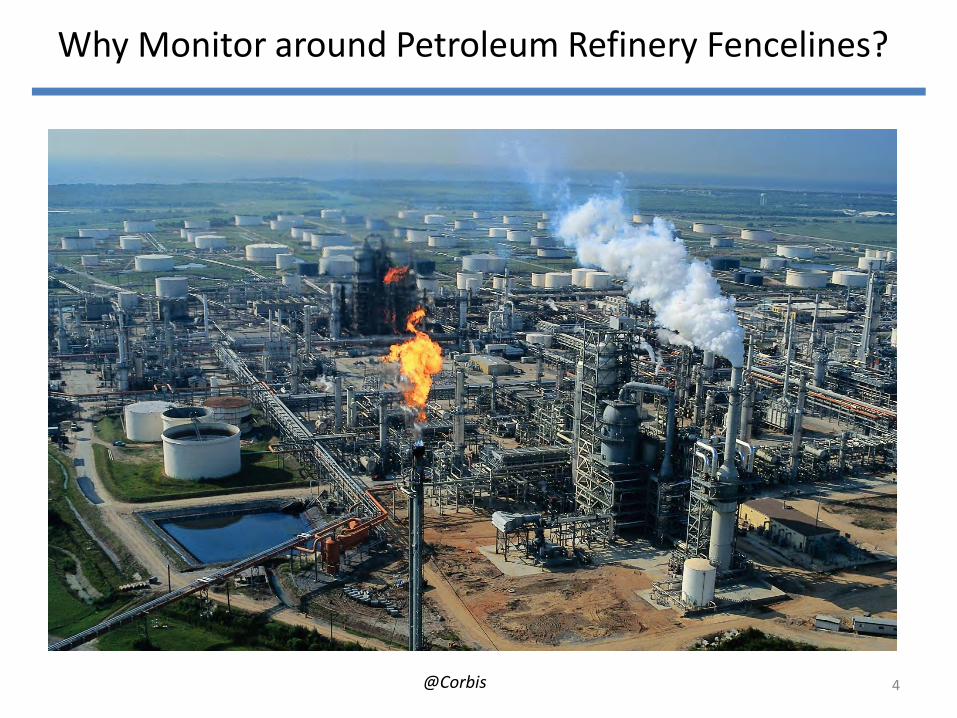
Why Monitor around Petroleum Refinery Fencelines?
4@Corbis
What is Benzene?
5
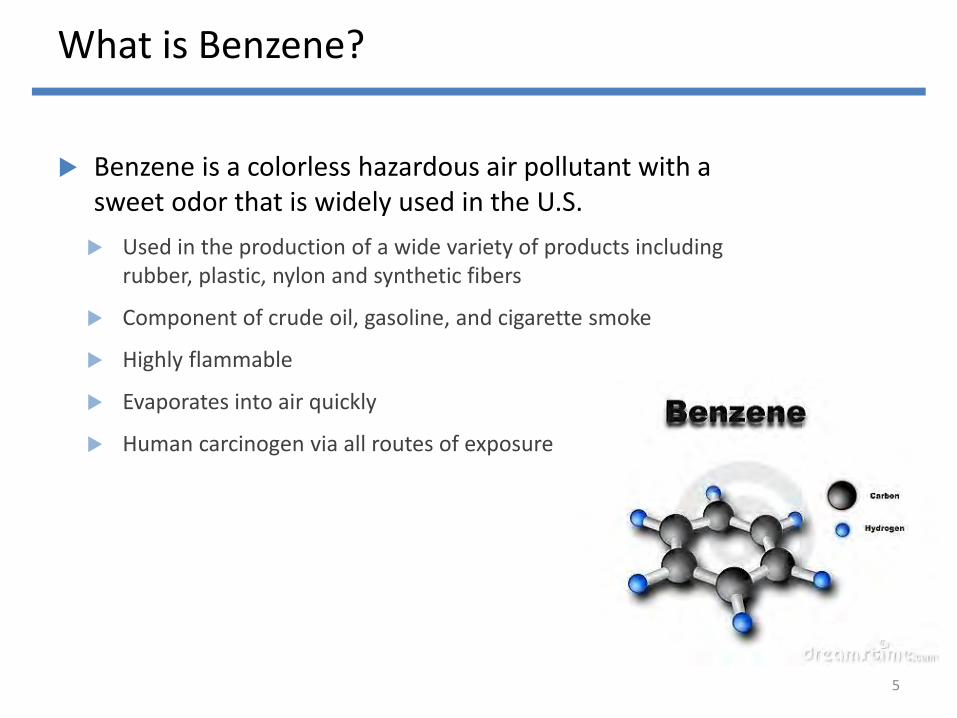
Benzene is a colorless hazardous air pollutant with a sweet odor that is widely used in the U.S.
Used in the production of a wide variety of products including rubber, plastic, nylon and synthetic fibers
Component of crude oil, gasoline, and cigarette smoke
Highly flammable
Evaporates into air quickly
Human carcinogen via all routes of exposure
Why Monitor for Benzene?
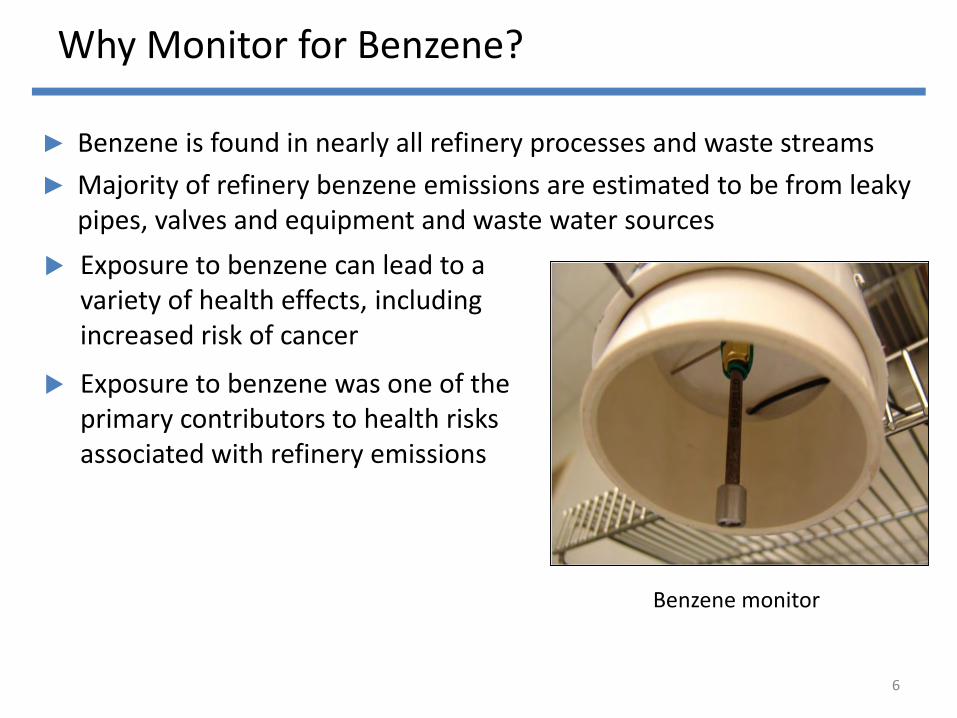
► Benzene is found in nearly all refinery processes and waste streams
► Majority of refinery benzene emissions are estimated to be from leaky pipes, valves and equipment and waste water sources
6
Exposure to benzene can lead to a variety of health effects, including increased risk of cancer
Exposure to benzene was one of the primary contributors to health risks associated with refinery emissions
Benzene monitor
Why Use Passive Diffusive Tube Monitoring?
7
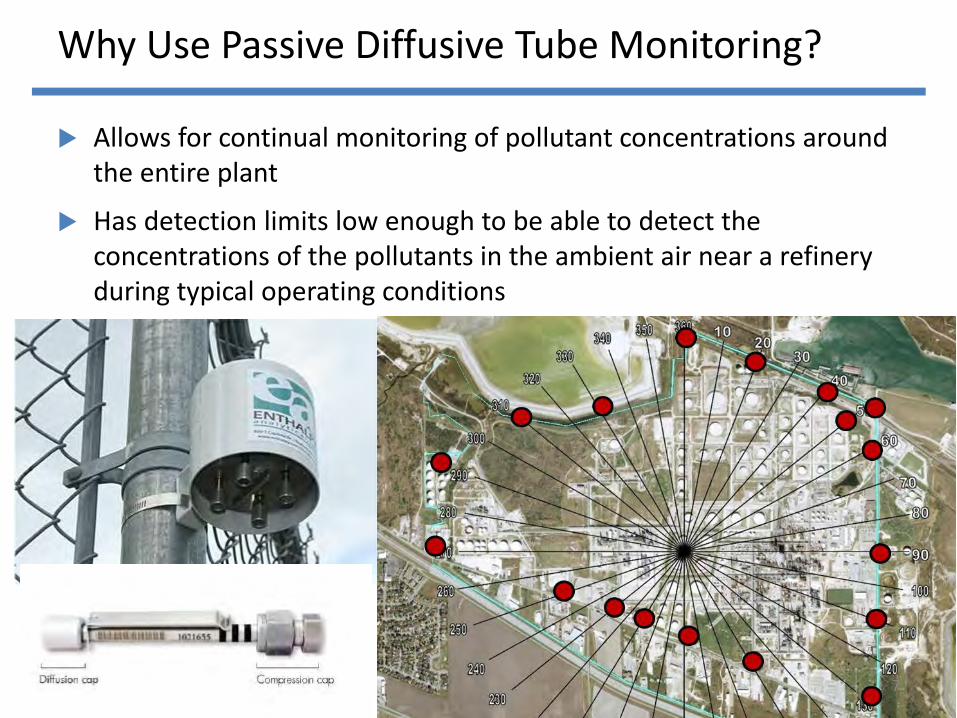
Allows for continual monitoring of pollutant concentrations around the entire plant
Has detection limits low enough to be able to detect the concentrations of the pollutants in the ambient air near a refinery during typical operating conditions
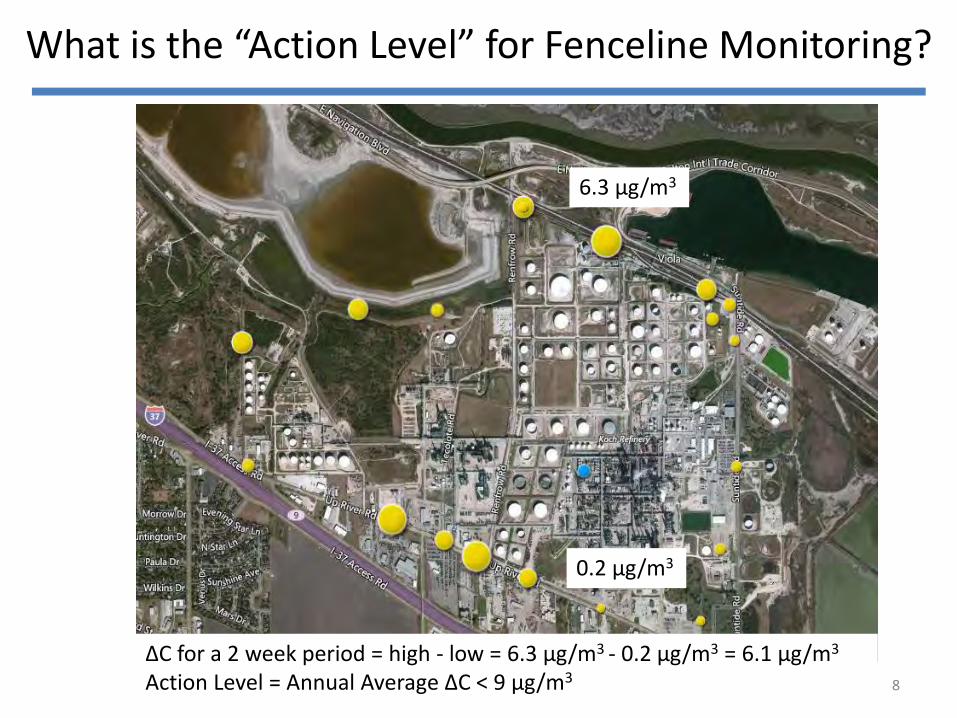
What is the “Action Level” for Fenceline Monitoring?
8
6.3 μg/m3
0.2 μg/m3
ΔC for a 2 week period = high - low = 6.3 μg/m3 - 0.2 μg/m3 = 6.1 μg/m3
Action Level = Annual Average ΔC < 9 μg/m3
What are the Benefits of Monitoring to the Public?
► Encouraging early detection and correction of problems before they rise to the corrective action level
► Identifying toxic air emissions from refinery emissions sources such as equipment leaks and wastewater systems
► Taking advantage of low concentration level sampling technology for hazardous air pollutants emitted by refineries
► Providing information on toxic air emissions to federal, state and local officials and the public
► Providing requirements for refineries to take action to correct toxic air emissions from refinery emission leaks
► Protecting public health in communities surrounding refineries
9
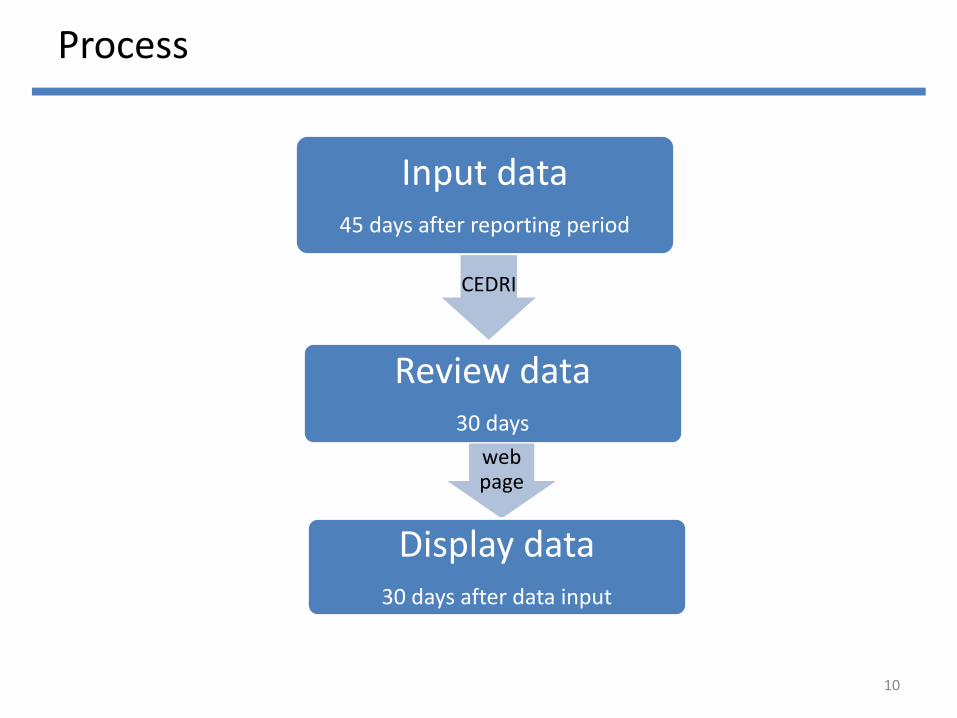
Process
10
Input data45 days after reporting period
CEDRI
Review data30 days
web page
Display data30 days after data input
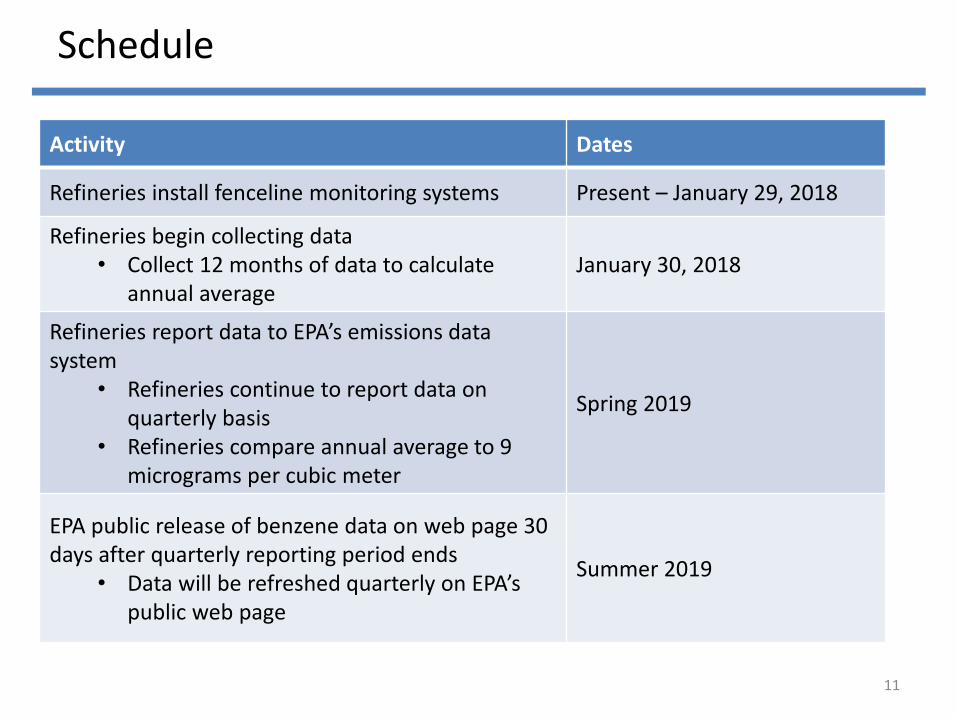
Schedule
Activity Dates
Refineries install fenceline monitoring systems Present – January 29, 2018
Refineries begin collecting data• Collect 12 months of data to calculate
annual averageJanuary 30, 2018
Refineries report data to EPA’s emissions data system
• Refineries continue to report data on quarterly basis
• Refineries compare annual average to 9 micrograms per cubic meter
Spring 2019
EPA public release of benzene data on web page 30 days after quarterly reporting period ends
• Data will be refreshed quarterly on EPA’s public web page
Summer 2019
11
CEDRI
► EPA’s Compliance and Emissions Data Reporting Interface
12
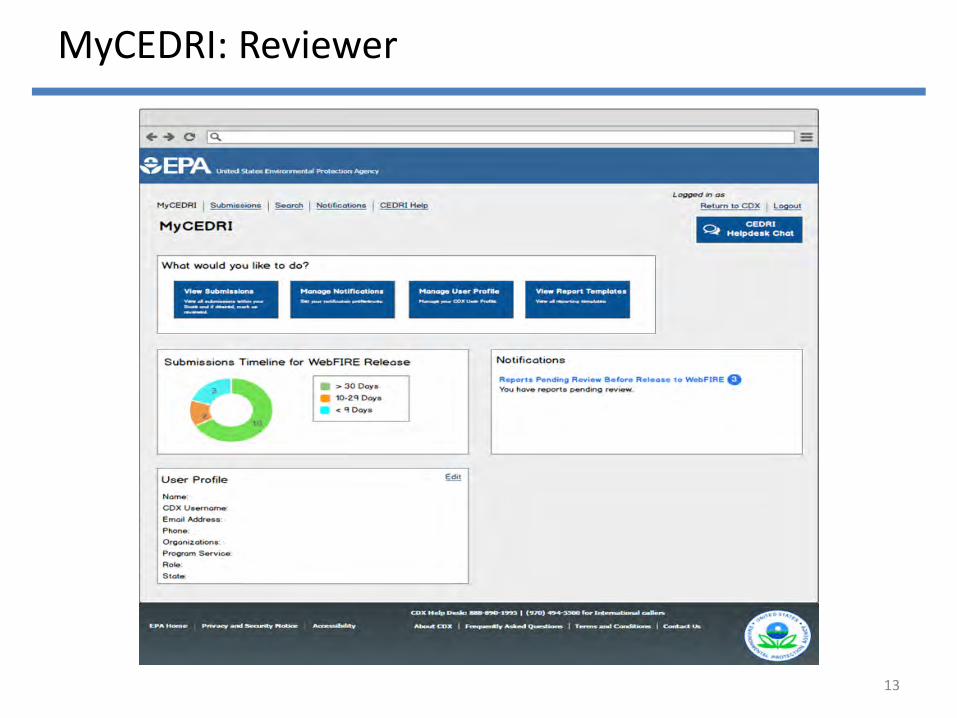
MyCEDRI: Reviewer
13
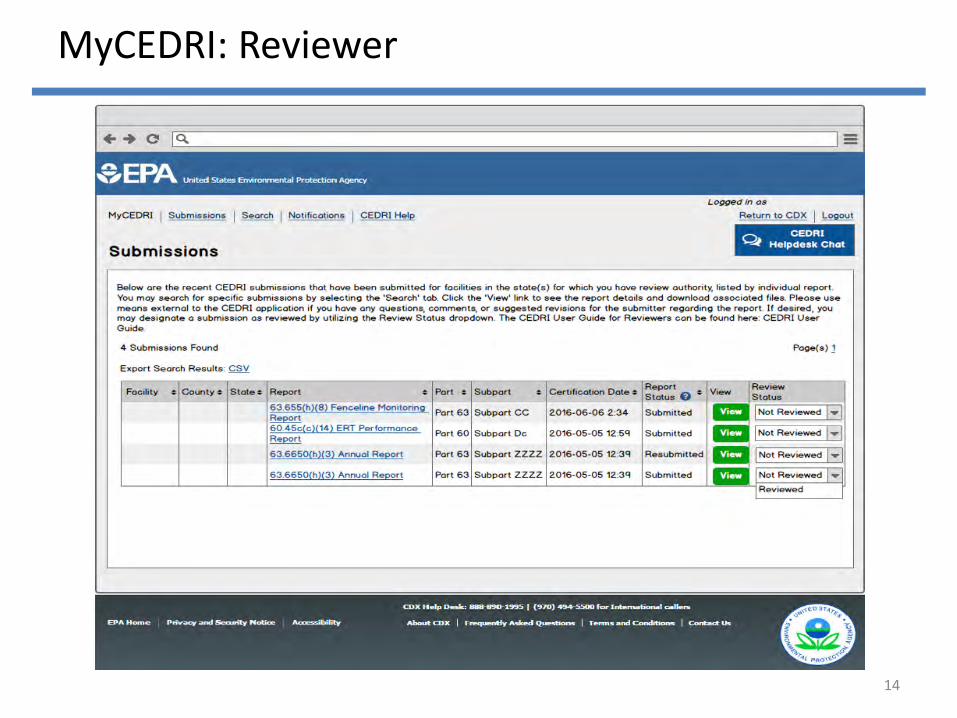
MyCEDRI: Reviewer
14
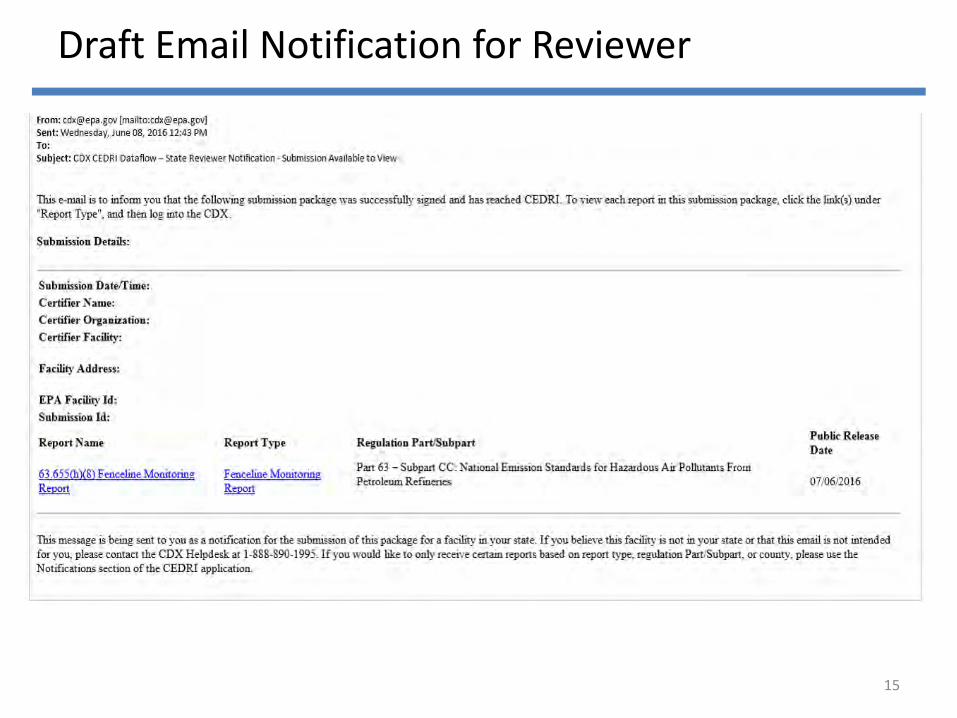
Draft Email Notification for Reviewer
15
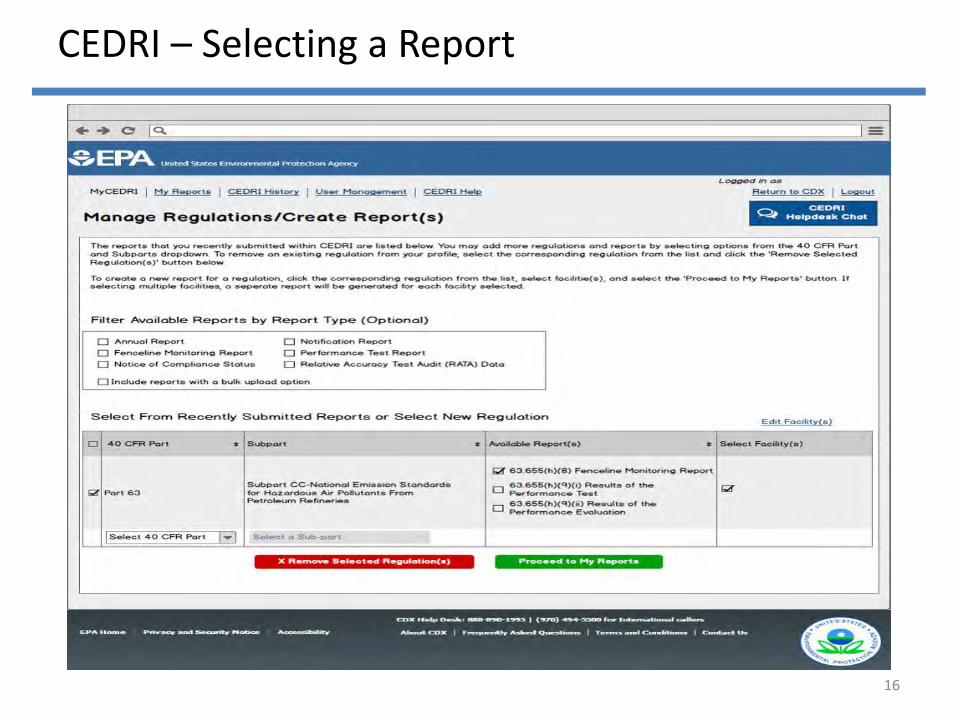
CEDRI – Selecting a Report
16
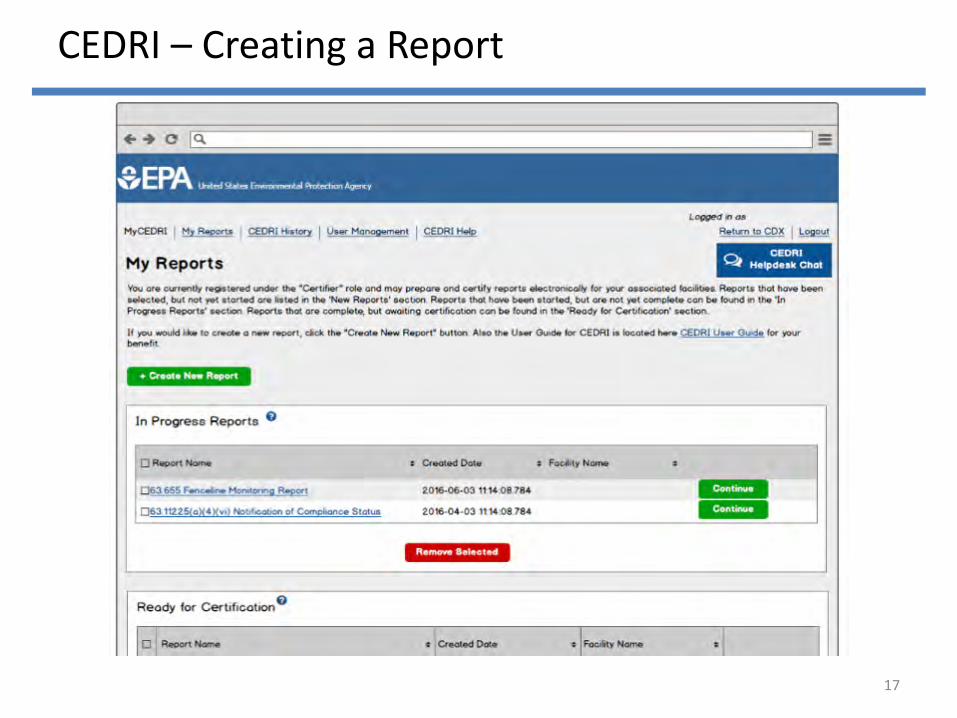
CEDRI – Creating a Report
17
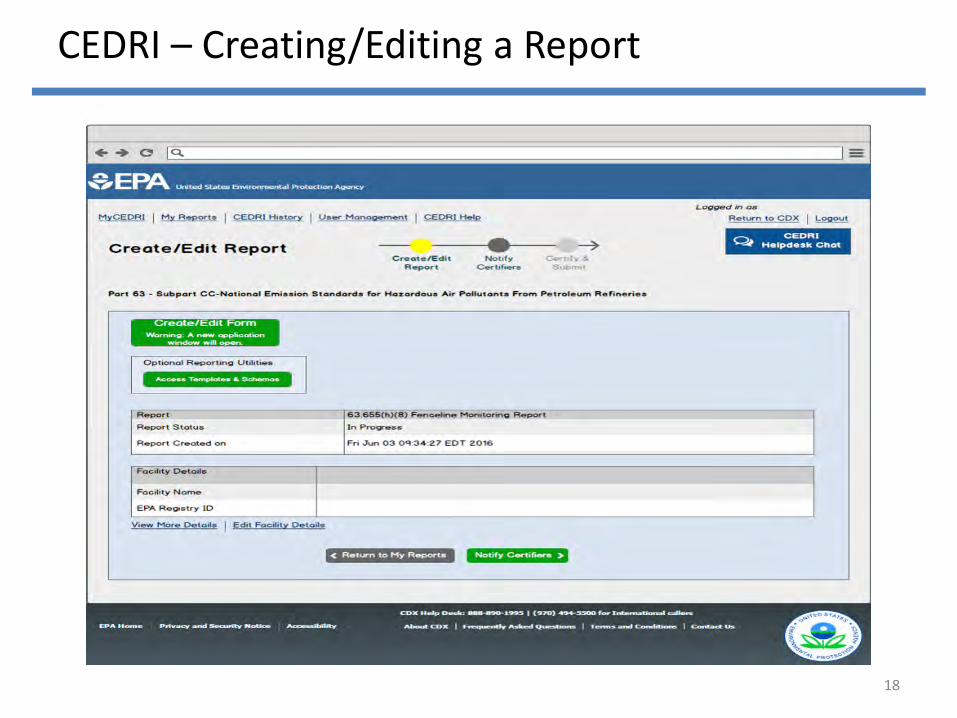
CEDRI – Creating/Editing a Report
18
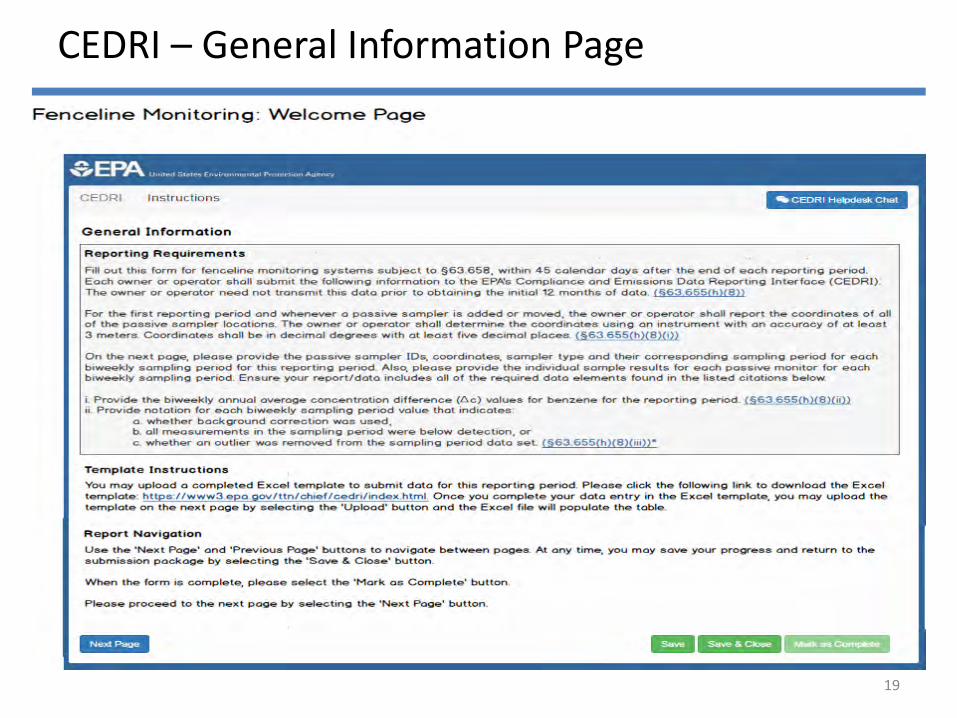
CEDRI – General Information Page
19
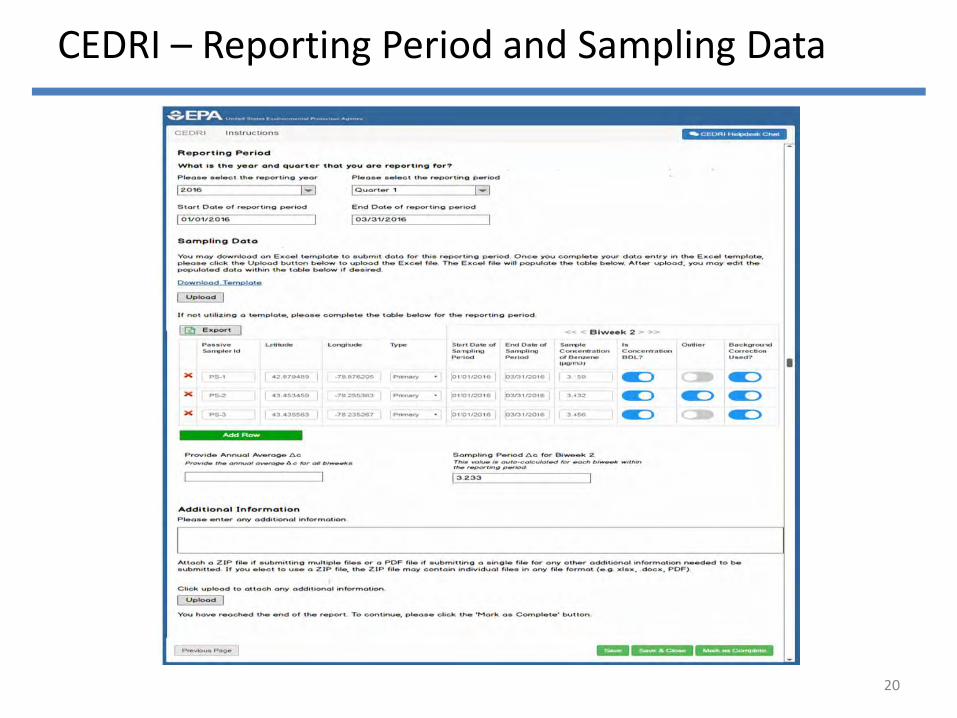
CEDRI – Reporting Period and Sampling Data
20
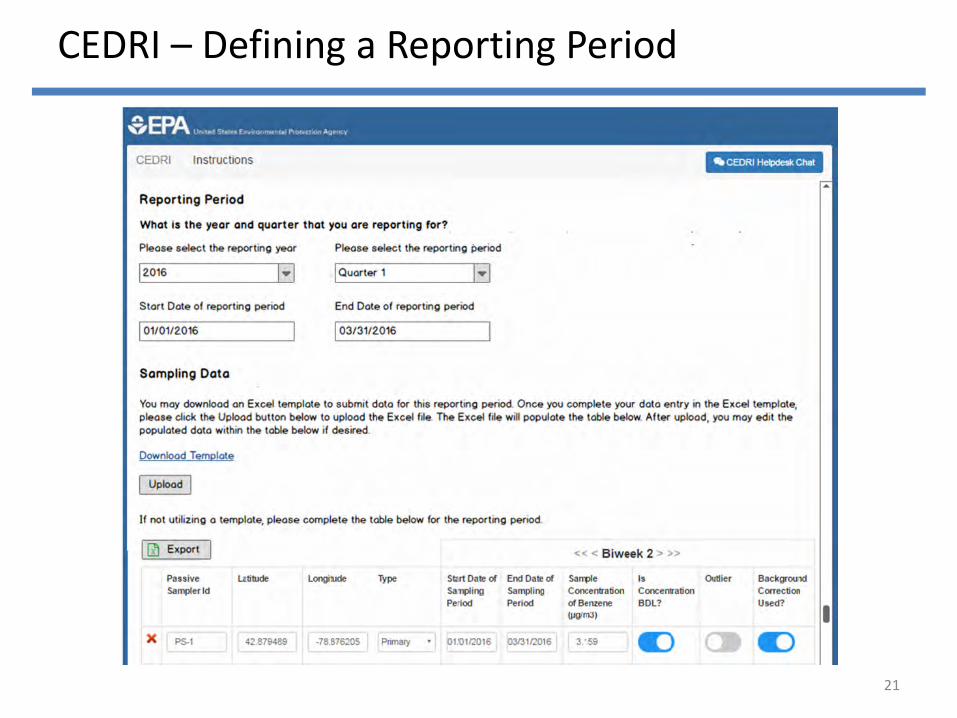
CEDRI – Defining a Reporting Period
21
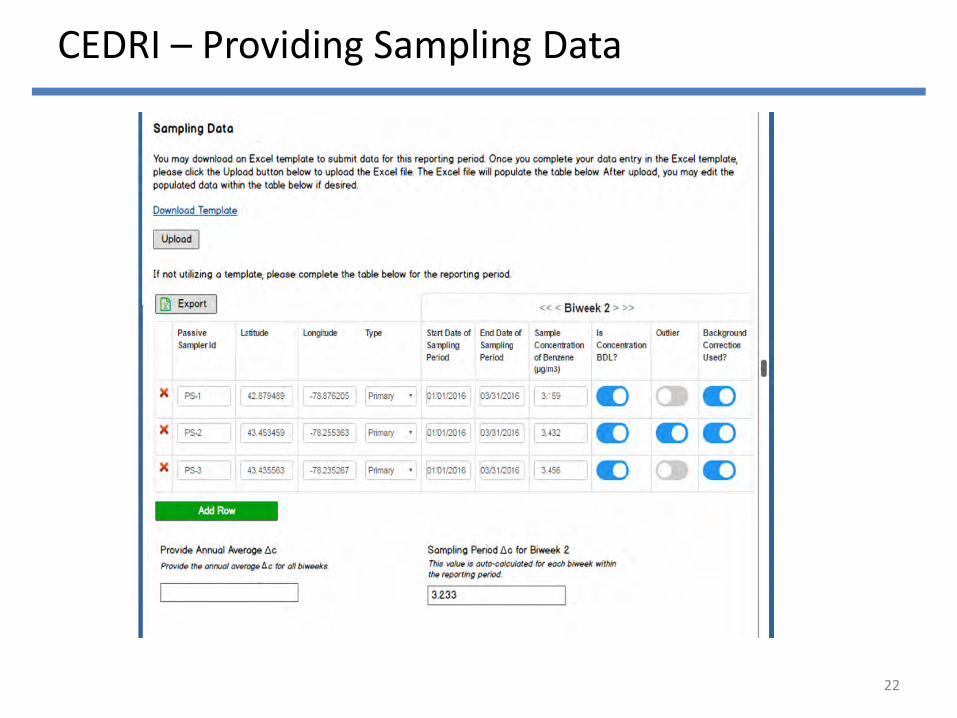
CEDRI – Providing Sampling Data
22
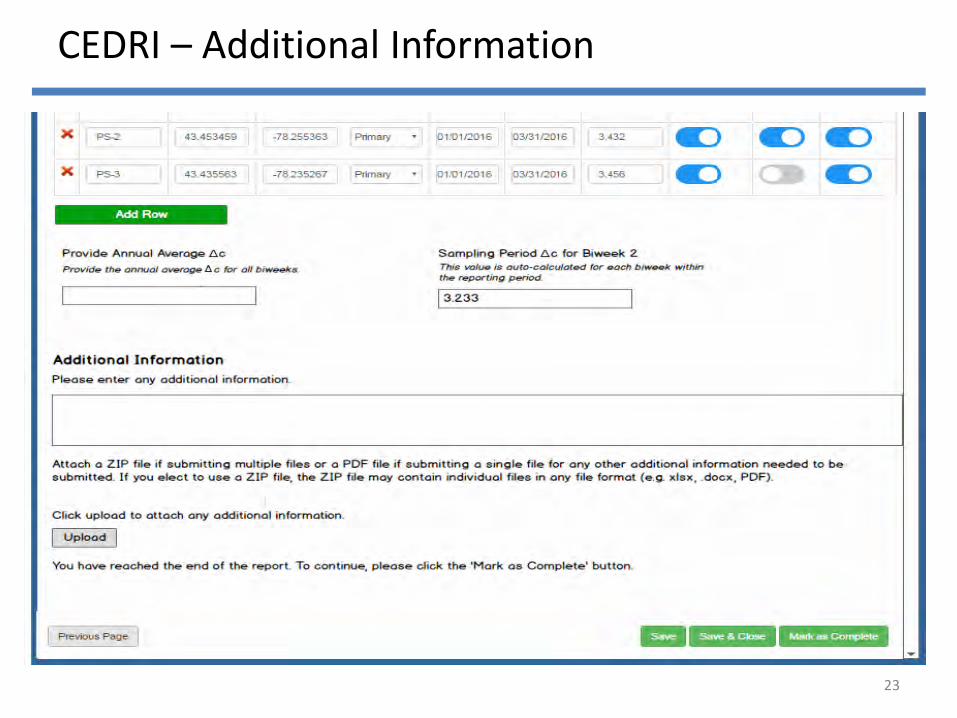
CEDRI – Additional Information
23
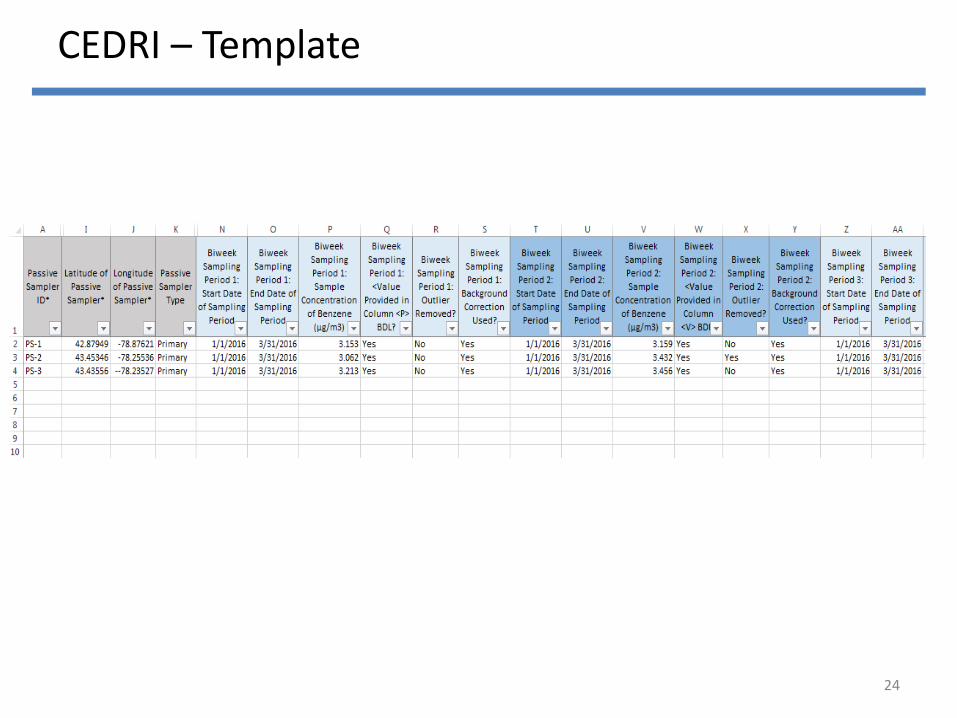
CEDRI – Template
24
Public Display of Data – Examples
► Public display of data
► EPA is designing a web page to display fenceline refinery data
► Web page will be managed by EPA
► Design will incorporate stakeholder ideas
► Available to public in the Summer 2019
25
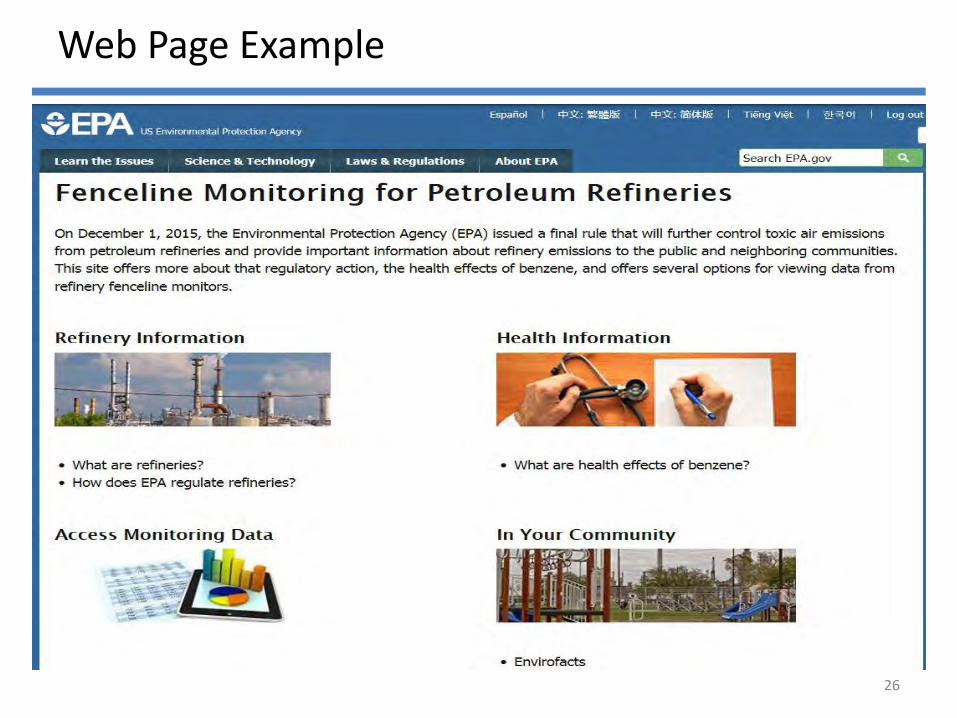
Web Page Example
26
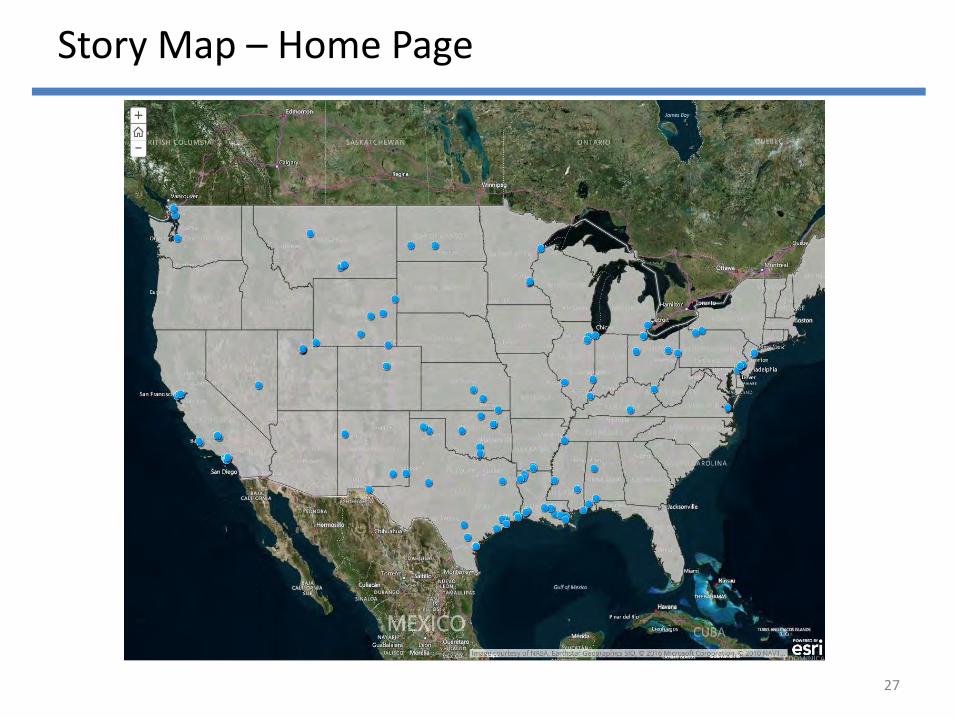
Story Map – Home Page
27
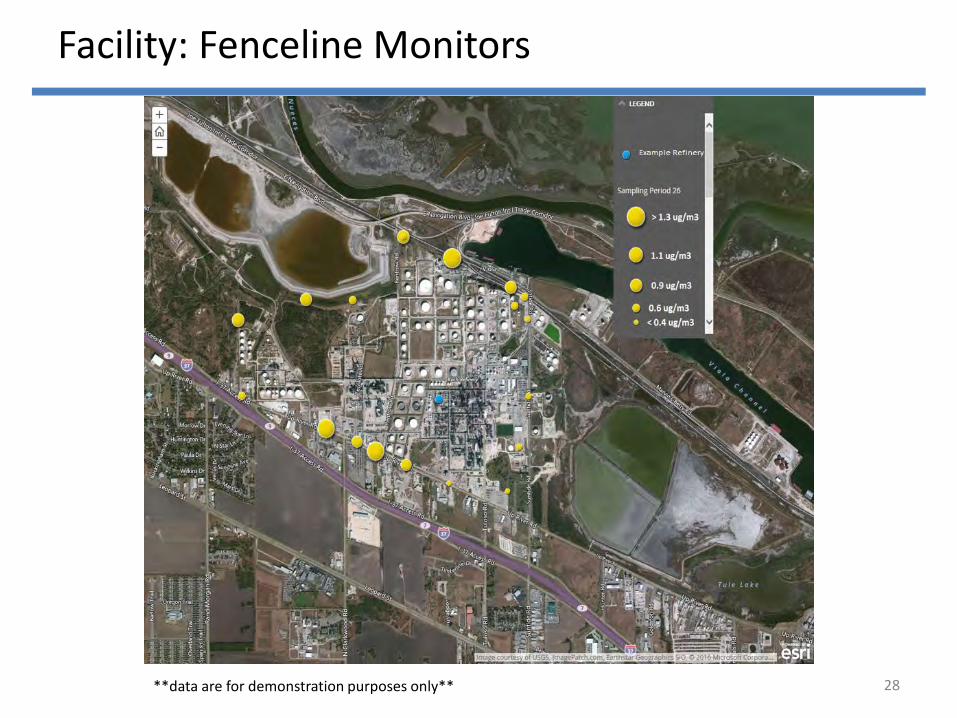
Facility: Fenceline Monitors
28**data are for demonstration purposes only**
29
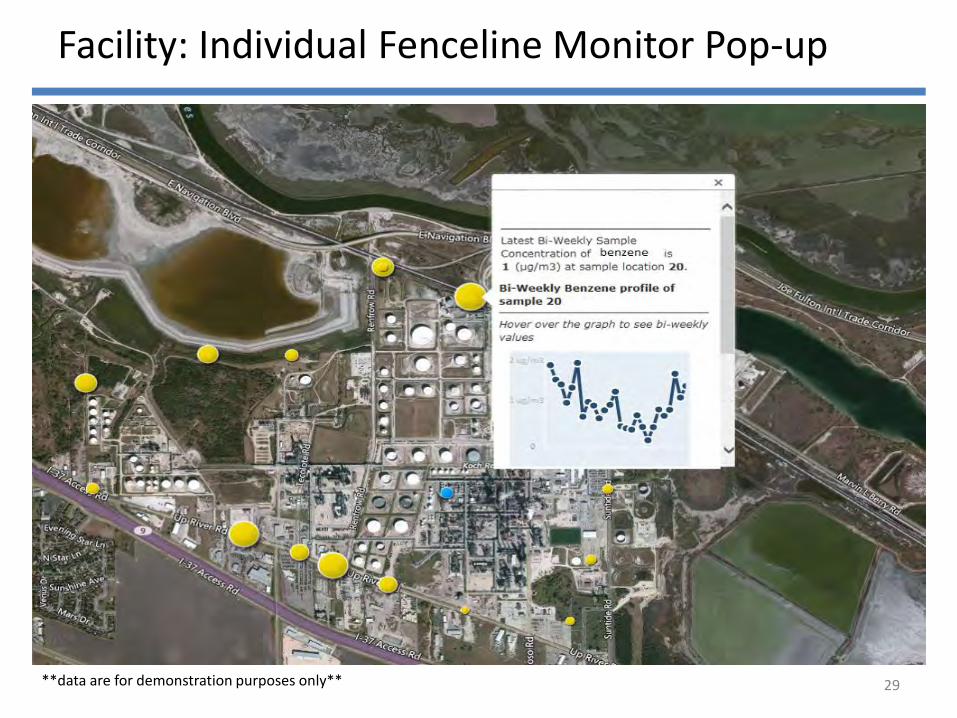
Facility: Individual Fenceline Monitor Pop-up
**data are for demonstration purposes only**
30
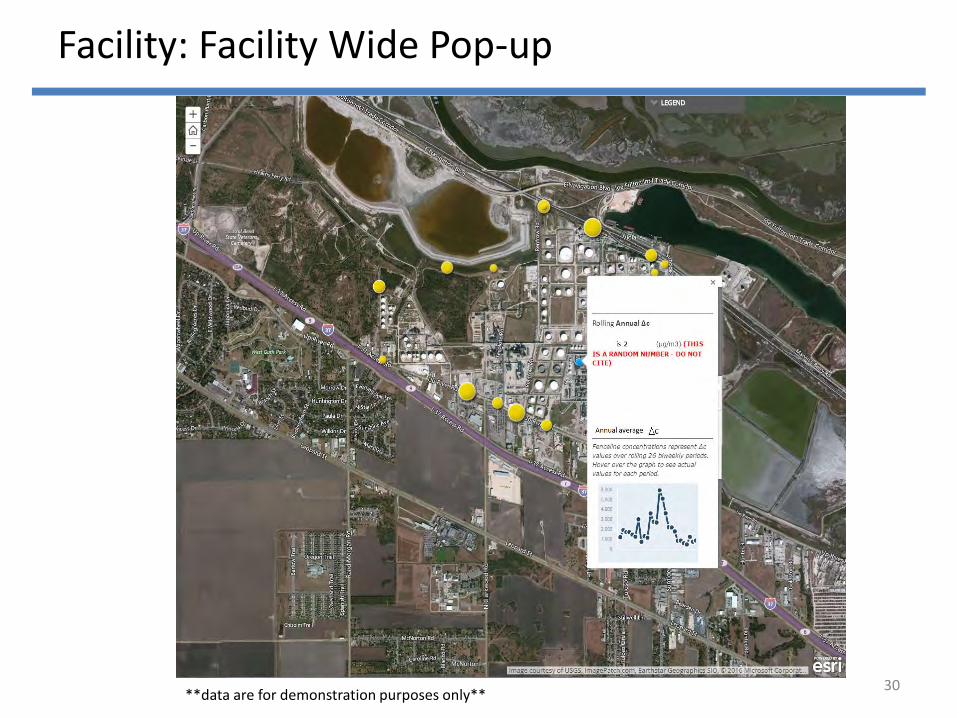
Facility: Facility Wide Pop-up
**data are for demonstration purposes only**
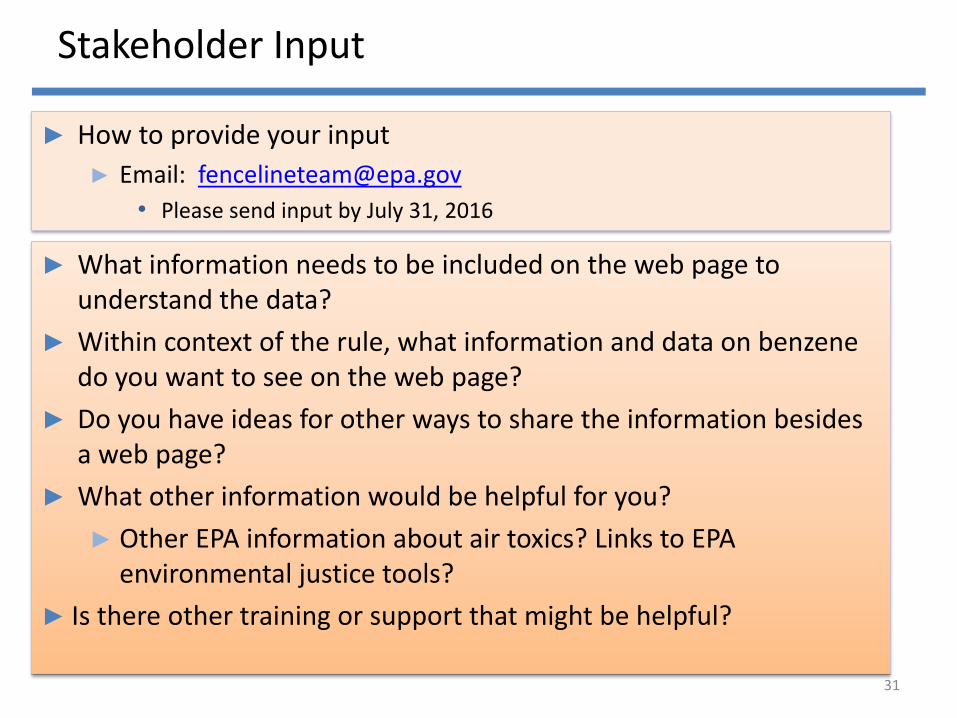
Stakeholder Input
► How to provide your input
► Email: [email protected]
• Please send input by July 31, 2016
► What information needs to be included on the web page to understand the data?
► Within context of the rule, what information and data on benzene do you want to see on the web page?
► Do you have ideas for other ways to share the information besides a web page?
► What other information would be helpful for you?
► Other EPA information about air toxics? Links to EPA environmental justice tools?
► Is there other training or support that might be helpful?
31
For updates and additional information:
https://www3.epa.gov/ttn/atw/petref.html
32
Additional Information

Appendix
33
Clean Air Act
► New Source Performance Standards (NSPS)
► CAA Section 111(b) requires to EPA to set and periodically review, emission standards for new sources of criteria air pollutants (CAP), volatile organic compounds (VOC), and other pollutants
► Air Toxics Rules: Maximum Achievable Control Technology (MACT) and Residual Risk and Technology Reviews
► CAA Section 112(d) requires EPA to set emission standards for hazardous air pollutants (HAP) based on performance of the maximum achievable control technology (MACT)
► EPA is required to conduct two reviews and update the existing standards, if necessary
• Residual Risk Assessment: To determine whether additional emission reductions are warranted to protect public health or the environment. This is a one-time review.
• Technology Reviews: To determine if better emission control approaches, practices, or processes are now available. Technology reviews are required every eight years.
34
Rulemakings
► NSPS► 1974 NSPS – covers fuel gas combustion devices, FCCU and sulfur plants
► 2008 and 2012 NSPS – covers same above and delayed cokers, flares and process heaters specifically
► MACT► 1995 MACT (known as MACT 1) covers non-combustion or evaporative sources, such as
equipment leaks, tanks, wastewater, miscellaneous process vents; amended to cover heat exchange systems, including cooling towers
► 2002 MACT (known as MACT 2) covers combustion sources: catalytic cracking units, catalytic reforming units and sulfur recovery units
► Risk and Technology Review (RTR)► 2007 – proposed risk and technology review amendments for non-combustion sources
► 2009 – withdrew amendments
► 2013 – promulgated standards for heat exchanger systems
► 2014 – proposed RTR and amendments (79 FR 36880; June 30, 2014)
► 2015 – finalized amendments
35
► 12-24 monitors (based on size of facility) are required around the perimeter of each refinery
► Additional monitors required if sources are near fenceline
► Monitors will be placed following requirements in EPA Method 325A
► Geographic coordinates for each monitoring location will be reported
36
Fenceline Monitoring – Monitor Siting
Fenceline Monitoring – Data Collection
► At least one sample collected from each individual monitoring location every two weeks
► Samples analyzed for benzene following requirements in EPA Method 325B
► The highest and lowest benzene concentration is identified for each bi-week sampling period
► The “delta C (ΔC)” for that monitoring period is calculated as the difference of these two concentrations
► 26 consecutive bi-week ΔC values are averaged to calculate an annual average ΔC value
► Collect benzene data for one year to develop first annual average ΔC value
37
Fenceline Monitoring – Data Reporting
► Upon completion of the first year of monitoring, benzene data are reported to EPA through EPA’s data management system
► Includes actual measurements for each 2 week period for each monitoring station
► Refinery owners must maintain the annual average ΔC value at or below 9 micrograms per cubic meter, µg/m3 (2.8 parts per billion by volume, ppbv)
38