Embed Size (px)
Citation preview
Petroleum Systems Modelling for Petroleum
Prospectivity Analysis in the Cooper Basin, Australia
Lisa Hall 1, Tony Hill 2, Tehani Palu1, Chris Boreham1, Dianne Edwards1, Alison Troup 3, Liuqi Wang1,
1 Geoscience Australia, ACT
2 Department of State Development, SA
3 Geological Survey Queensland, QLD
Acknowledgements:
3D Geo, Andrew Murray, Andrew Stacey, Bianca Reece, Bruce Radke, Jim Preston, Russell Korsch, Steve le Poidevin and many more
Petroleum Systems Modelling for Play Analysis in the Cooper Basin – AAPG ICE 2015
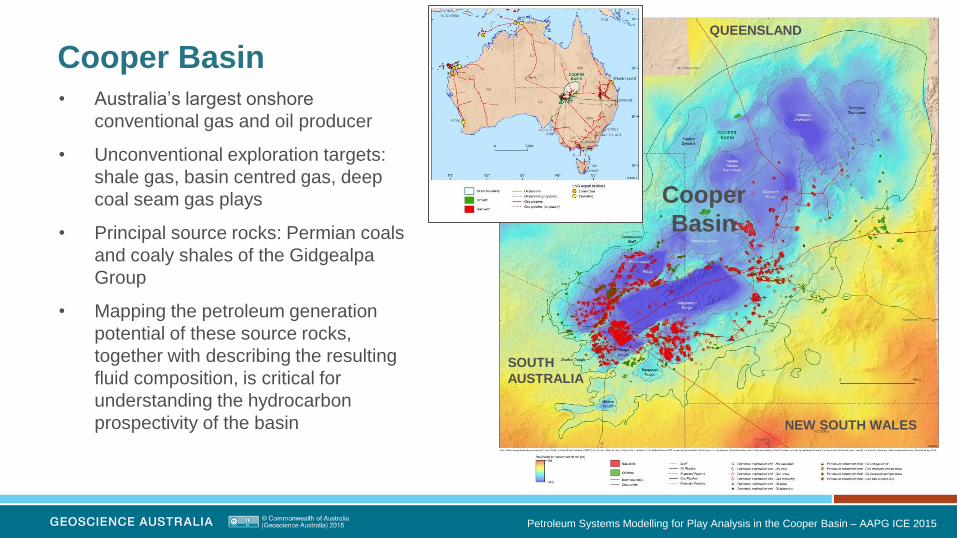
Cooper Basin • Australia’s largest onshore
conventional gas and oil producer
• Unconventional exploration targets:
shale gas, basin centred gas, deep
coal seam gas plays
• Principal source rocks: Permian coals
and coaly shales of the Gidgealpa
Group
• Mapping the petroleum generation
potential of these source rocks,
together with describing the resulting
fluid composition, is critical for
understanding the hydrocarbon
prospectivity of the basin
Cooper
Basin
QUEENSLAND
SOUTH
AUSTRALIA
NEW SOUTH WALES
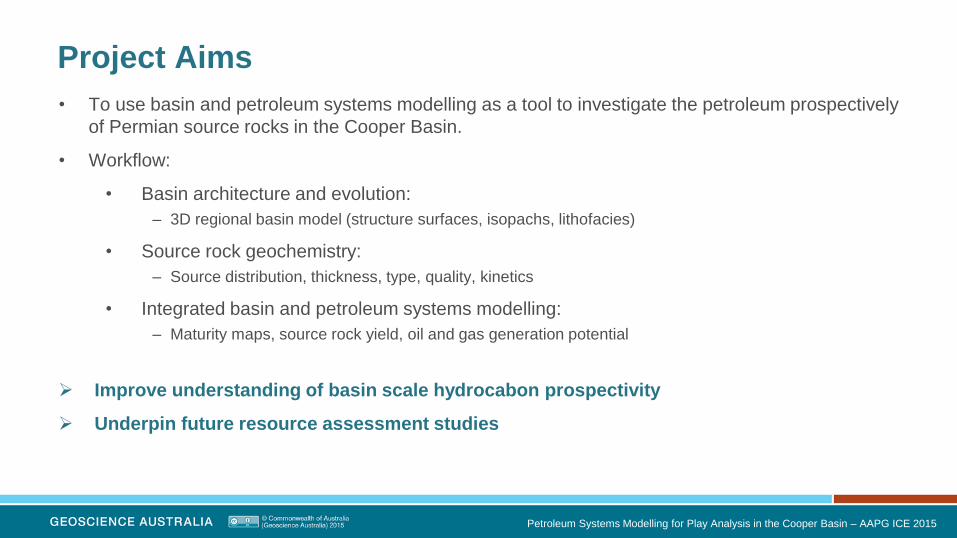
Project Aims
• To use basin and petroleum systems modelling as a tool to investigate the petroleum prospectively
of Permian source rocks in the Cooper Basin.
• Workflow:
• Basin architecture and evolution:
– 3D regional basin model (structure surfaces, isopachs, lithofacies)
• Source rock geochemistry:
– Source distribution, thickness, type, quality, kinetics
• Integrated basin and petroleum systems modelling:
– Maturity maps, source rock yield, oil and gas generation potential
Improve understanding of basin scale hydrocabon prospectivity
Underpin future resource assessment studies
Petroleum Systems Modelling for Play Analysis in the Cooper Basin – AAPG ICE 2015
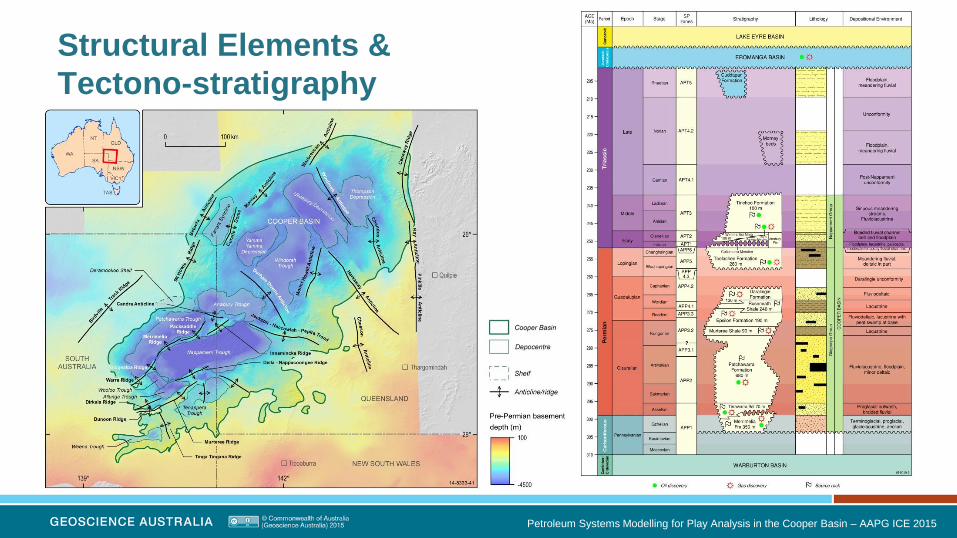
Structural Elements &
Tectono-stratigraphy
Petroleum Systems Modelling for Play Analysis in the Cooper Basin – AAPG ICE 2015
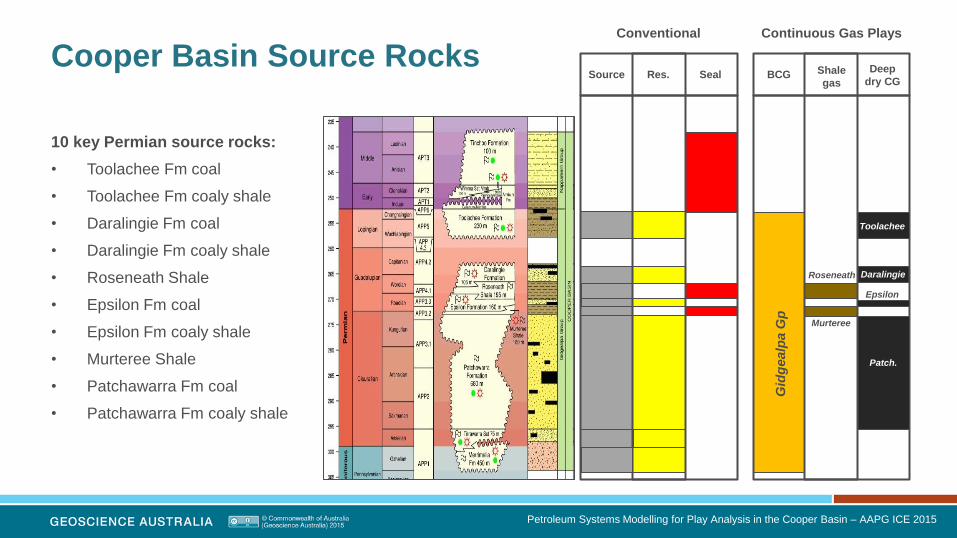
Shale
gas
Deep
dry CG BCG Source Seal Res.
Conventional Continuous Gas Plays
Gid
gealp
a G
p
Roseneath
Murteree
Toolachee
Patch.
Cooper Basin Source Rocks
Petroleum Systems Modelling for Play Analysis in the Cooper Basin – AAPG ICE 2015
10 key Permian source rocks:
• Toolachee Fm coal
• Toolachee Fm coaly shale
• Daralingie Fm coal
• Daralingie Fm coaly shale
• Roseneath Shale
• Epsilon Fm coal
• Epsilon Fm coaly shale
• Murteree Shale
• Patchawarra Fm coal
• Patchawarra Fm coaly shale
Epsilon
Daralingie
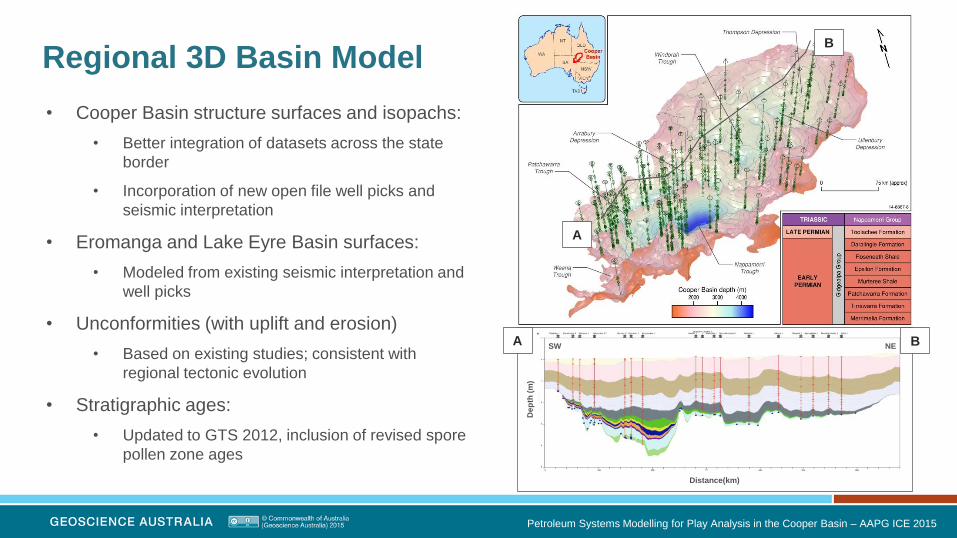
Regional 3D Basin Model
Petroleum Systems Modelling for Play Analysis in the Cooper Basin – AAPG ICE 2015
• Cooper Basin structure surfaces and isopachs:
• Better integration of datasets across the state
border
• Incorporation of new open file well picks and
seismic interpretation
• Eromanga and Lake Eyre Basin surfaces:
• Modeled from existing seismic interpretation and
well picks
• Unconformities (with uplift and erosion)
• Based on existing studies; consistent with
regional tectonic evolution
• Stratigraphic ages:
• Updated to GTS 2012, inclusion of revised spore
pollen zone ages
A
B
Distance(km)
Dep
th (
m)
SW NE A B
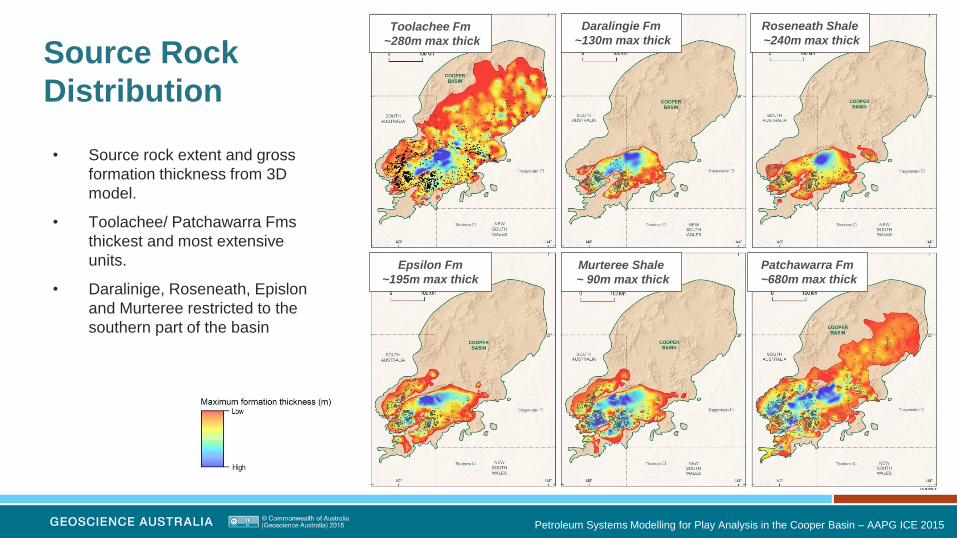
Source Rock
Distribution
Petroleum Systems Modelling for Play Analysis in the Cooper Basin – AAPG ICE 2015
• Source rock extent and gross
formation thickness from 3D
model.
• Toolachee/ Patchawarra Fms
thickest and most extensive
units.
• Daralinige, Roseneath, Epislon
and Murteree restricted to the
southern part of the basin
Toolachee Fm
~280m max thick
Daralingie Fm
~130m max thick
Roseneath Shale
~240m max thick
Epsilon Fm
~195m max thick
Murteree Shale
~ 90m max thick
Patchawarra Fm
~680m max thick
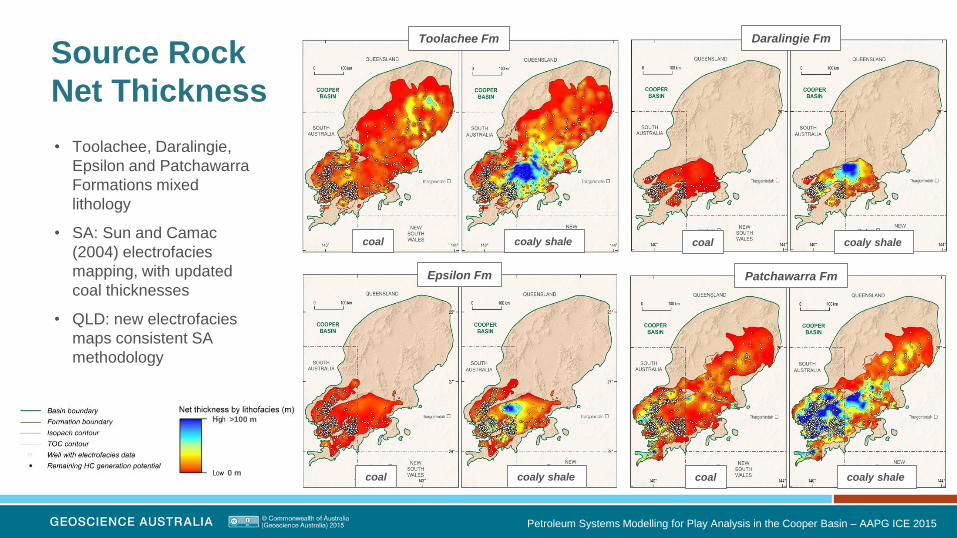
Source Rock
Net Thickness
• Toolachee, Daralingie,
Epsilon and Patchawarra
Formations mixed
lithology
• SA: Sun and Camac
(2004) electrofacies
mapping, with updated
coal thicknesses
• QLD: new electrofacies
maps consistent SA
methodology
Petroleum Systems Modelling for Play Analysis in the Cooper Basin – AAPG ICE 2015
Toolachee Fm Daralingie Fm
Epsilon Fm Patchawarra Fm
coal coaly shale coal coaly shale
coal coaly shale coal coaly shale
>100 m
0 m
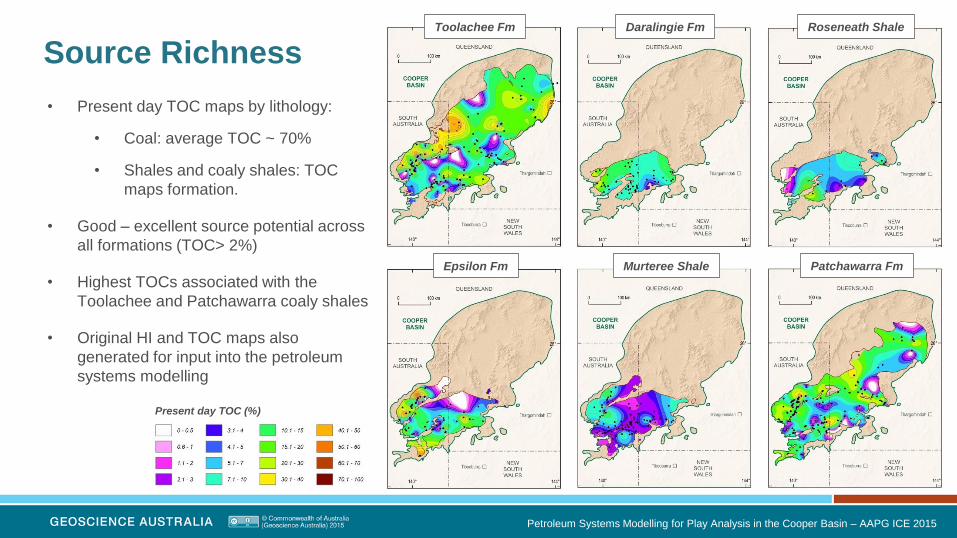
Source Richness
Petroleum Systems Modelling for Play Analysis in the Cooper Basin – AAPG ICE 2015
• Present day TOC maps by lithology:
• Coal: average TOC ~ 70%
• Shales and coaly shales: TOC
maps formation.
• Good – excellent source potential across
all formations (TOC> 2%)
• Highest TOCs associated with the
Toolachee and Patchawarra coaly shales
• Original HI and TOC maps also
generated for input into the petroleum
systems modelling
Present day TOC (%)
Toolachee Fm Daralingie Fm Roseneath Shale
Epsilon Fm Murteree Shale Patchawarra Fm
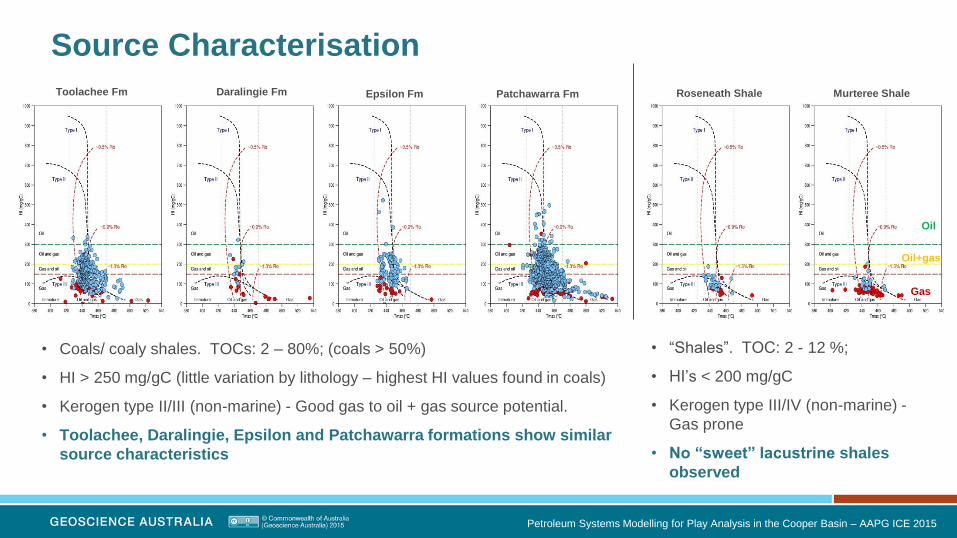
Source Characterisation
• Coals/ coaly shales. TOCs: 2 – 80%; (coals > 50%)
• HI > 250 mg/gC (little variation by lithology – highest HI values found in coals)
• Kerogen type II/III (non-marine) - Good gas to oil + gas source potential.
• Toolachee, Daralingie, Epsilon and Patchawarra formations show similar
source characteristics
Petroleum Systems Modelling for Play Analysis in the Cooper Basin – AAPG ICE 2015
• “Shales”. TOC: 2 - 12 %;
• HI’s < 200 mg/gC
• Kerogen type III/IV (non-marine) -
Gas prone
• No “sweet” lacustrine shales
observed
Toolachee Fm Roseneath Shale Daralingie Fm Murteree Shale
Oil
Oil+gas
Gas
Epsilon Fm Patchawarra Fm
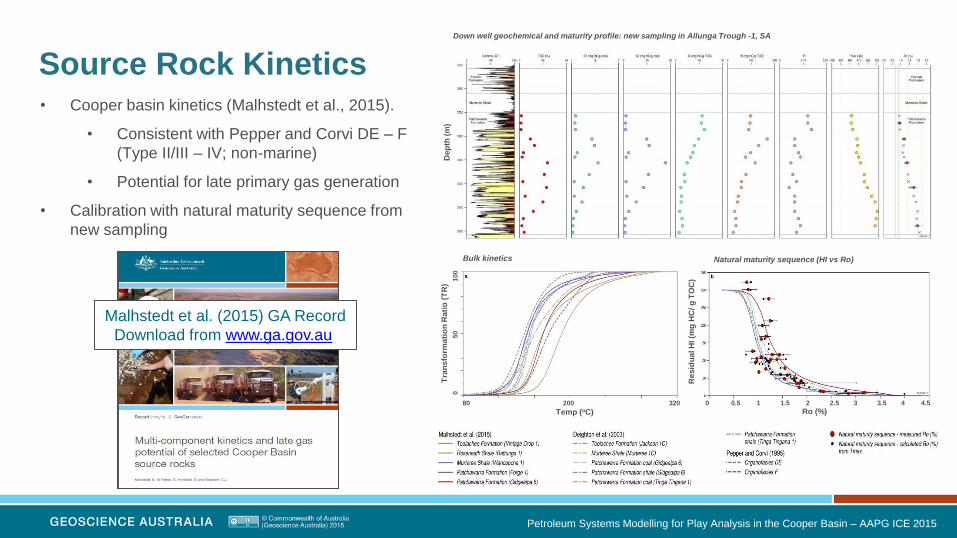
Source Rock Kinetics • Cooper basin kinetics (Malhstedt et al., 2015).
• Consistent with Pepper and Corvi DE – F
(Type II/III – IV; non-marine)
• Potential for late primary gas generation
• Calibration with natural maturity sequence from
new sampling
Petroleum Systems Modelling for Play Analysis in the Cooper Basin – AAPG ICE 2015
Down well geochemical and maturity profile: new sampling in Allunga Trough -1, SA
Malhstedt et al. (2015) GA Record
Download from www.ga.gov.au
Dep
th (
m)
80 200 320
Natural maturity sequence (HI vs Ro) Bulk kinetics
Temp (oC) Ro (%)
Res
idu
al H
I (m
g H
C/ g
TO
C)
0 5
0 1
00
Tra
ns
form
ati
on
Rati
o (
TR
)
0 0.5 1 1.5 2 2.5 3 3.5 4 4.5
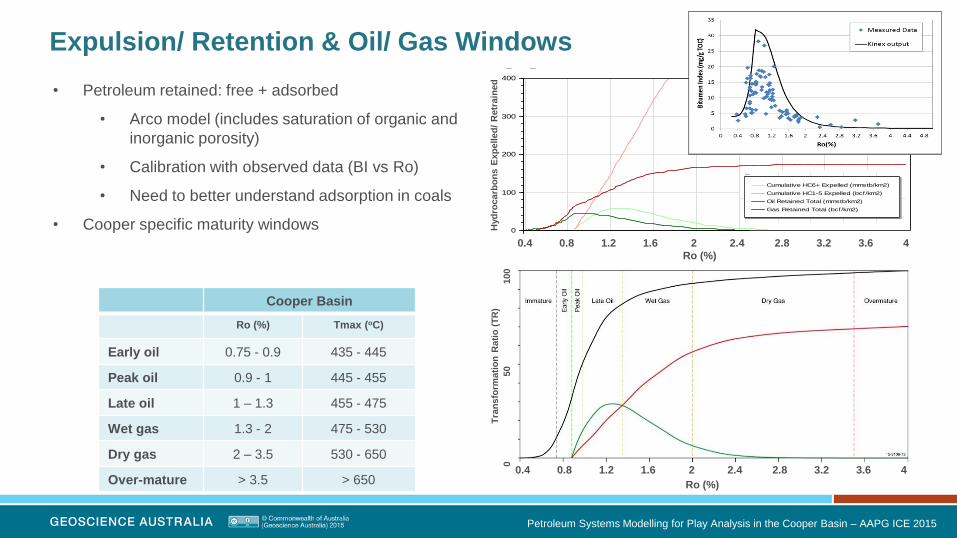
Expulsion/ Retention & Oil/ Gas Windows
• Petroleum retained: free + adsorbed
• Arco model (includes saturation of organic and
inorganic porosity)
• Calibration with observed data (BI vs Ro)
• Need to better understand adsorption in coals
• Cooper specific maturity windows
Petroleum Systems Modelling for Play Analysis in the Cooper Basin – AAPG ICE 2015
Cooper Basin
Ro (%) Tmax (oC)
Early oil 0.75 - 0.9 435 - 445
Peak oil 0.9 - 1 445 - 455
Late oil 1 – 1.3 455 - 475
Wet gas 1.3 - 2 475 - 530
Dry gas 2 – 3.5 530 - 650
Over-mature > 3.5 > 650
0 0.4 0.8 1.2 1.6 2 2.4 2.8 3.2 3.6 4
TSI: Vitrinite-ARCO (%Ro)
0
100
200
300
400
Cum
ulat
ive
HC
6+ E
xpel
led
(mm
stb/
km2)
Cumulative HC6+ Expelled (mmstb/km2)
Cumulative HC1-5 Expelled (bcf/km2)
Oil Retained Total (mmstb/km2)
Gas Retained Total (bcf/km2)
Tra
nsfo
rmati
on
Rati
o (
TR
) Ro (%)
0
50
100
Ro (%)
0.4 0.8 1.2 1.6 2 2.4 2.8 3.2 3.6 4
Hyd
rocarb
on
s E
xp
elled
/ R
etr
ain
ed
0 0.4 0.8 1.2 1.6 2 2.4 2.8 3.2 3.6 4
TSI: Vitrinite-ARCO (%Ro)
0
100
200
300
400
Cum
ulat
ive
HC
6+ E
xpel
led
(mm
stb/
km2)
Cumulative HC6+ Expelled (mmstb/km2)
Cumulative HC1-5 Expelled (bcf/km2)
Oil Retained Total (mmstb/km2)
Gas Retained Total (bcf/km2)
0.4 0.8 1.2 1.6 2 2.4 2.8 3.2 3.6 4
0 0.4 0.8 1.2 1.6 2 2.4 2.8 3.2 3.6 4
TSI: Vitrinite-ARCO (%Ro)
0
100
200
300
400
Cum
ulat
ive
HC
6+ E
xpel
led
(mm
stb/
km2)
Cumulative HC6+ Expelled (mmstb/km2)
Cumulative HC1-5 Expelled (bcf/km2)
Oil Retained Total (mmstb/km2)
Gas Retained Total (bcf/km2)
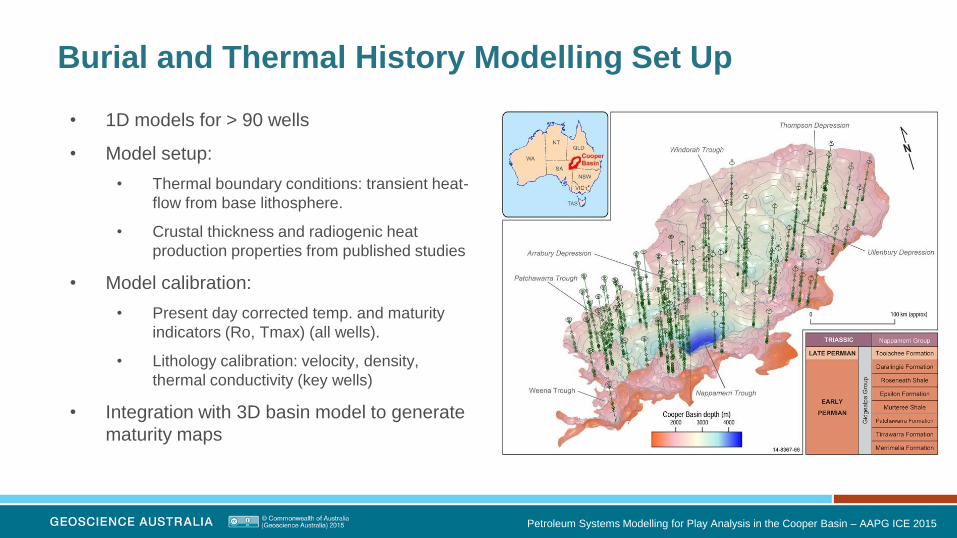
Burial and Thermal History Modelling Set Up
Petroleum Systems Modelling for Play Analysis in the Cooper Basin – AAPG ICE 2015
• 1D models for > 90 wells
• Model setup:
• Thermal boundary conditions: transient heat-
flow from base lithosphere.
• Crustal thickness and radiogenic heat
production properties from published studies
• Model calibration:
• Present day corrected temp. and maturity
indicators (Ro, Tmax) (all wells).
• Lithology calibration: velocity, density,
thermal conductivity (key wells)
• Integration with 3D basin model to generate
maturity maps
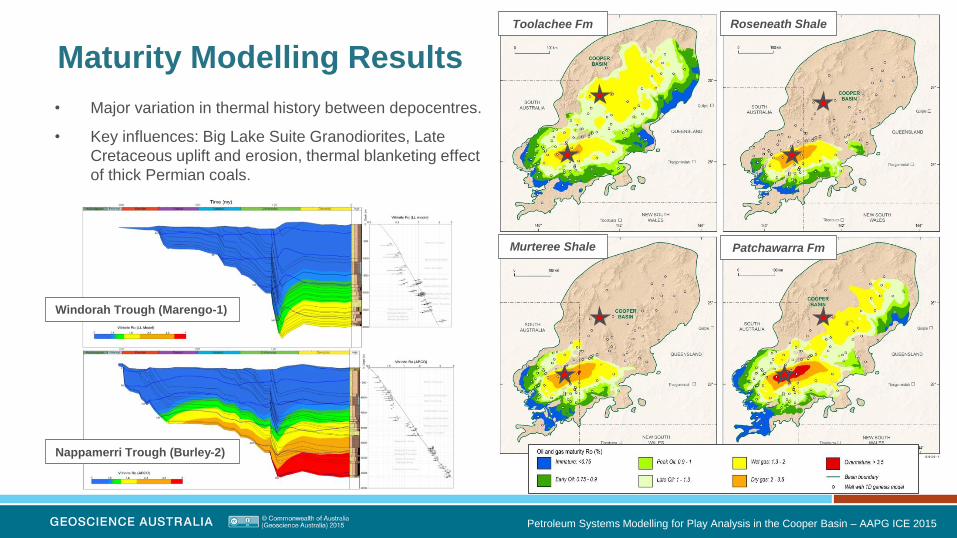
Maturity Modelling Results
Petroleum Systems Modelling for Play Analysis in the Cooper Basin – AAPG ICE 2015
• Major variation in thermal history between depocentres.
• Key influences: Big Lake Suite Granodiorites, Late
Cretaceous uplift and erosion, thermal blanketing effect
of thick Permian coals.
Nappamerri Trough (Burley-2)
Windorah Trough (Marengo-1)
Toolachee Fm Roseneath Shale
Murteree Shale Patchawarra Fm
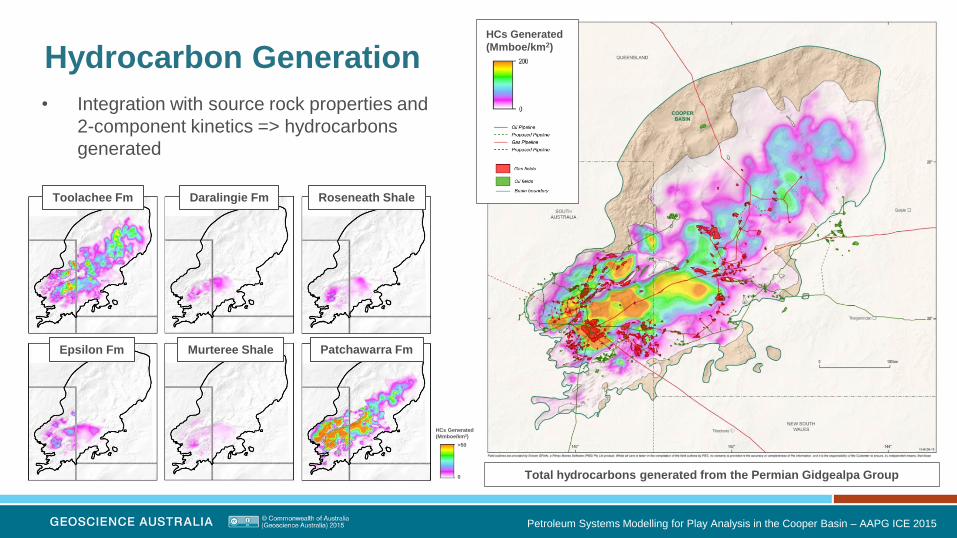
Hydrocarbon Generation
Petroleum Systems Modelling for Play Analysis in the Cooper Basin – AAPG ICE 2015
• Integration with source rock properties and
2-component kinetics => hydrocarbons
generated
Roseneath Shale Toolachee Fm
Total hydrocarbons generated from the Permian Gidgealpa Group
Daralingie Fm
Patchawarra Fm Epsilon Fm Murteree Shale
HCs Generated
(Mmboe/km2)
HCs Generated
(Mmboe/km2)
>50
0
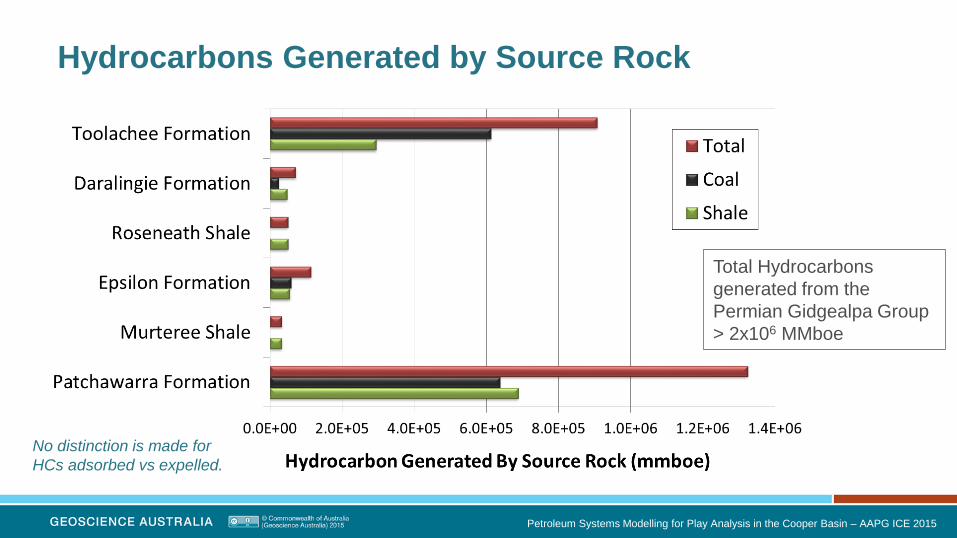
Hydrocarbons Generated by Source Rock
Petroleum Systems Modelling for Play Analysis in the Cooper Basin – AAPG ICE 2015
Total Hydrocarbons
generated from the
Permian Gidgealpa Group
> 2x10⁶ MMboe
No distinction is made for
HCs adsorbed vs expelled.
2000
2000
2000
20002000
3000
3000
3000
4000
4000
4000
4000 4000
4000
5000
5000
6000
400 500 600 700
6800
6900
7000
7100
7200
Mid Patch source GOR of Expelled Petroleum (scf/bbl) 0 Ma
0 1000 2000 3000 4000 5000
160 km
u29945 Sep 11 2015
4
4
4 44
4
4
4 4
4
4
4
44
8
888
8 8
8
8
8
8
8
12
12
12
12
12 1
2
12
12 1212
12 1212
12
12
12
16
1616
16
16
16
16 16
20
20
20
20
20
24
24
24
24
24
2832
400 500 600 700
6800
6900
7000
7100
7200
Mid Patch source Oil Expelled (mmbbl/km2) 0 Ma
0 10 20 30 40
80 km
u29945 Sep 29 2015
10
1010 1010
10
10
10
10
10
1010
20
20
20
20
20
20
20
20 20
20
20
20
20
20
30
30 30
30
30
30
30
3030
30
30
30
30
30
30
40
40
40
40
40
40
40
50
50
50
50
50
60
60
60
70
70
8090
400 500 600 700
6800
6900
7000
7100
7200
Mid Patch source Gas Expelled (bcf/km2) 0 Ma
0 40 80 120
80 km
u29945 Sep 29 2015
4
4 4
4
44
4
4
44
4 44
4
4
4
4
4
4
4
44
4
44
4
4
4
8
8
8
8
8
8
88 8
8 8
8
8
8
8
8
8
8
8
8
8
12
12
12
12
12
12
1212
16
16
20
2428
400 500 600 700
6800
6900
7000
7100
7200
Mid Patch source Oil retained Total (mmstb/km2) 0 Ma
0 10 20 30 40
80 km
u29945 Sep 29 2015
10
101010
10
10
10
101010
10
10
1010
10
10
10
20
20
20
20
20
2020
2020
20
20
20
20
20
2020
20
20
20
30
3030
30
30
30
30
4040
40
40
40
40
50
50
400 500 600 700
6800
6900
7000
7100
7200
Mid Patch source Gas retained Total (bcf/km2) 0 Ma
0 20 40 60 80
80 km
u29945 Sep 29 2015
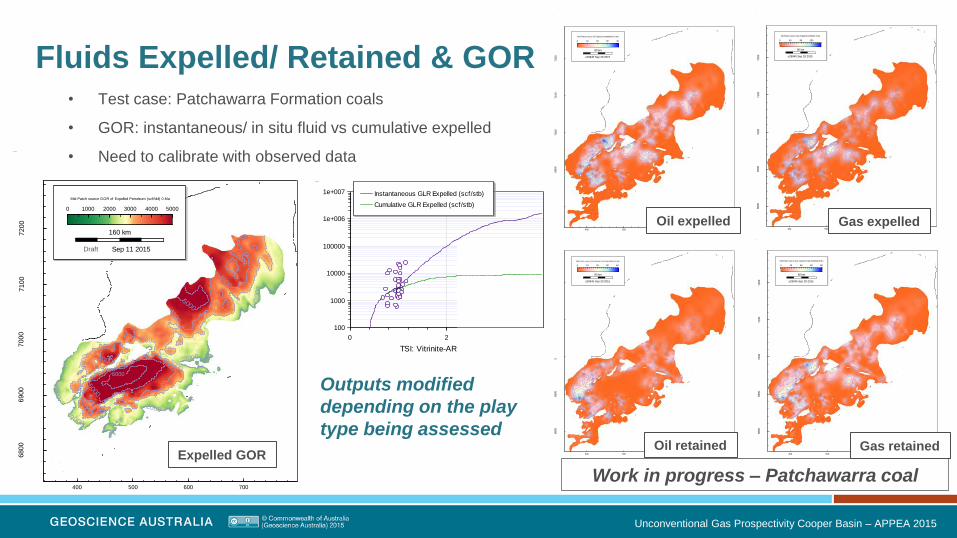
Fluids Expelled/ Retained & GOR • Test case: Patchawarra Formation coals
• GOR: instantaneous/ in situ fluid vs cumulative expelled
• Need to calibrate with observed data
Unconventional Gas Prospectivity Cooper Basin – APPEA 2015
Work in progress – Patchawarra coal
Oil expelled
Oil retained
Gas expelled
Gas retained
0 2 4
TSI: Vitrinite-ARCO (%Ro)
100
1000
10000
100000
1e+006
1e+007
Insta
nta
ne
ou
s G
LR
Exp
elle
d (
scf/
stb
)
Instantaneous GLR Expelled (scf/stb)
Cumulative GLR Expelled (scf/stb)
Outputs modified
depending on the play
type being assessed
Expelled GOR
Draft
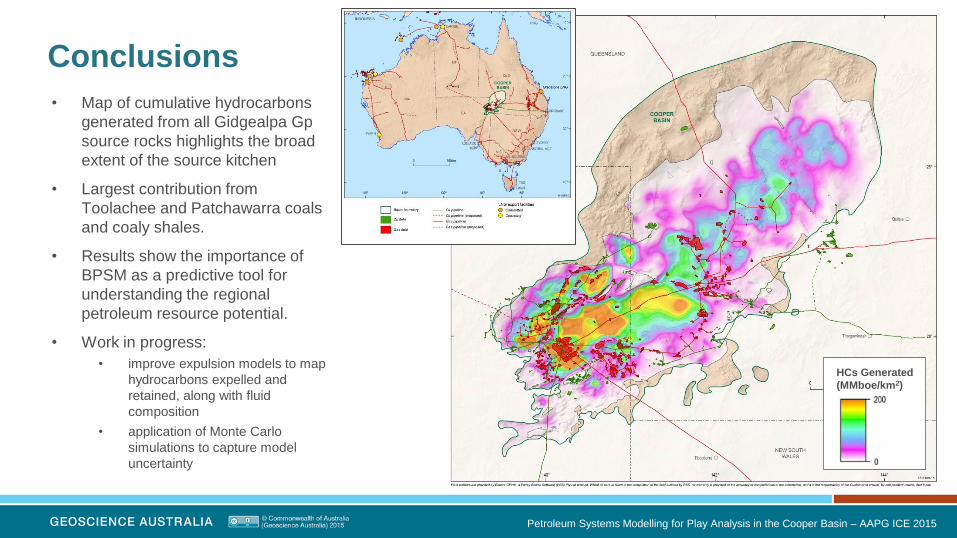
Conclusions
• Map of cumulative hydrocarbons
generated from all Gidgealpa Gp
source rocks highlights the broad
extent of the source kitchen
• Largest contribution from
Toolachee and Patchawarra coals
and coaly shales.
• Results show the importance of
BPSM as a predictive tool for
understanding the regional
petroleum resource potential.
• Work in progress:
• improve expulsion models to map
hydrocarbons expelled and
retained, along with fluid
composition
• application of Monte Carlo
simulations to capture model
uncertainty
Petroleum Systems Modelling for Play Analysis in the Cooper Basin – AAPG ICE 2015
HCs Generated
(MMboe/km2)
Phone: +61 2 6249 9111
Web: www.ga.gov.au
Email: [email protected]
Address: Cnr Jerrabomberra Avenue and Hindmarsh Drive, Symonston ACT 2609
Postal Address: GPO Box 378, Canberra ACT 2601
Please visit us at the following locations: • Basin Modeling Poster Session, Wed 10am - # P20
• Australian Government Petroleum Booth - # 529
This paper is published with the permission of the CEO, Geoscience Australia