Embed Size (px)
Citation preview
International Journal of Petroleum and Petrochemical Engineering (IJPPE)
Volume 4, Issue 1, 2018, PP 55-69
ISSN 2454-7980 (Online)
DOI: http://dx.doi.org/10.20431/2454-7980.0401007
www.arcjournals.org
International Journal of Petroleum and Petrochemical Engineering (IJPPE) Page | 55
Petrophysical Analysis of Sylhet Gas Field Using Well Logs and
Associated Data from Well Sylhet #, Bangladesh
Abdullah Al Fatta1, Md. Shofiqul Islam
1, Md. Farhaduzzaman
2
1Department of Petroleum & Mining Engineering, Shahjalal University of Science & Technology, Sylhet,
Bangladesh
2Petroleum Engineering Department, Sylhet Gas Fields Limited (A company of Petrobangla), Sylhet,
Bangladesh
1. INTRODUCTION
Reservoir characterization involves the integration of a vast amount of seismic data, geophysical well
logs and geological samples [1]. The oil and gas industry uses wireline logs to obtain a continuous
record of a formation's rock properties. Petrophysical evaluation has a unique opportunity to observe
the relationship between porosity and saturation [2]. The determinations of reservoir quality and
formation evaluation processes are largely depended on quantitative evaluation of petrophysical
analysis. It becomes necessary therefore, to know the complete reservoir architecture of the reservoir
which includes the internal and external geometry, its model, as well as the distribution of the
reservoir properties. These reservoir properties are classified into two groups, viz.: static (such as
porosity, permeability, heterogeneity, net pay, and thickness) and dynamic (fluid flow within the
reservoir) [3].
Petrophysical log interpretation is one of the most useful and important tools to characterize the
reservoir property [4]. Well log data helps to identify permeable zones and productive zones for
hydrocarbon. It distinguishes the interfaces of oil, gas or water of a particular reservoir. Permeable
zones may contain either hydrocarbon or water or both. Petrophysical study involves the analysis of
different parameters of reservoirs including lithology, volume of shale, porosity, water saturation,
hydrocarbon saturation, permeability, hydrocarbon movability and pore geometry by using
appropriate well log data.
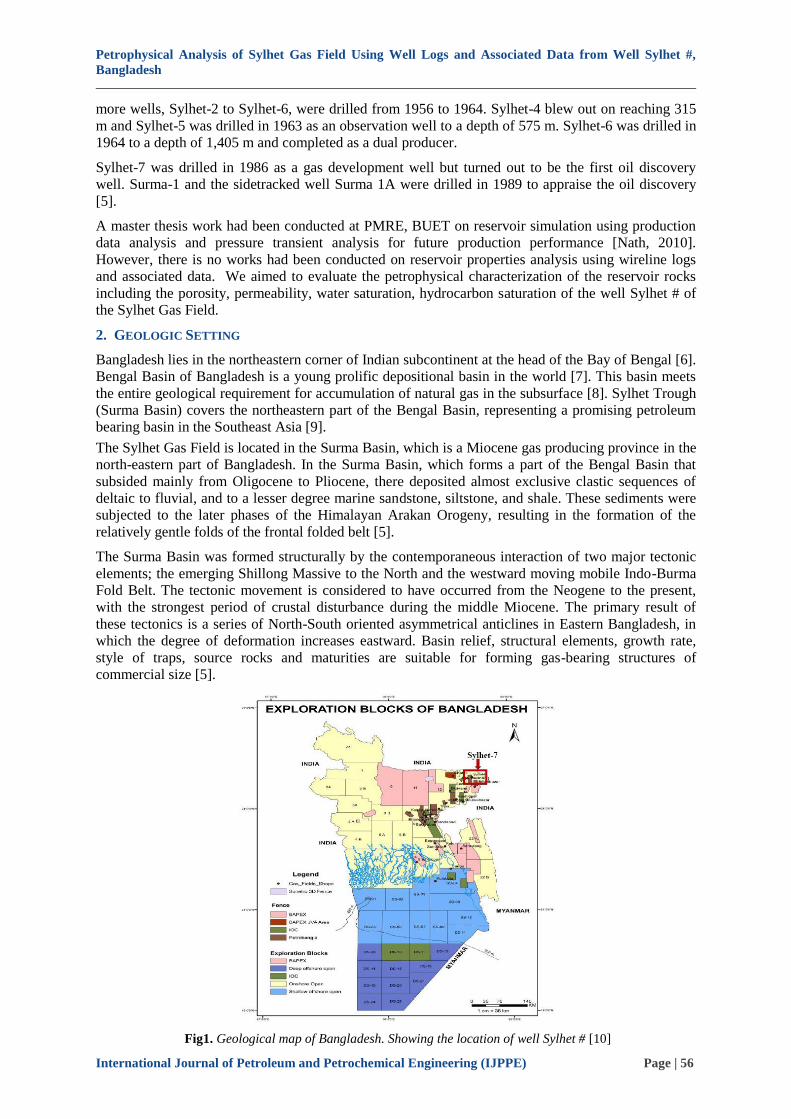
The Sylhet Gas Field is the only oil and gas producing field of Bangladesh which is located in the
northern-east of the Sylhet city of the country (Fig. 1). It was the first discovery of hydrocarbon in
Bangladesh. The Sylhet structure was delineated by Pakistan Petroleum Limited (PPL) after recording
single fold seismic. Gas was discovered in 1955 by drilling the Sylhet-1 well, which was the first gas
discovery well in Bangladesh. Unfortunately, the well blew out leaving a crater. Subsequently five
Abstract: The present study has been conducted to evaluate the petrophysical properties of Sylhet Gas Field
based on different logs data such as gamma-ray, spontaneous potential, density, neutron, resistivity, caliper
and sonic logs. Quantitative properties including shale volume, porosity, permeability, fluid saturation, HC
movability index and bulk volume of water were carried out using the well logs. Fourteen permeable zones
were identified where six zones were found gas-bearing, one was oil bearing and the rest were water bearing.
Computed petrophysical parameters across the reservoir provided average porosity as ranging from 16 to
26%, the permeability values range from 52 to 349 mili Darcy (mD) and the average hydrocarbon
saturations are 75%, 68%, 77%, 76%, 63%, 73%, and 63% for reservoir Zone 1, Zone 2, Zone 3, Zone 4,
Zone 5, Zone 6 and Zone 7 respectively. Hydrocarbon was found moveable in the reservoir since all the
hydrocarbon movability index value was less than 0.70. An average bulk volume of water ranged from 0.04 to
0.08. Analyzed data indicate that the reservoirs are sandstone dominating with minor amount of shale and
are at irreducible water saturation. The petrophysical parameters supported a hydrocarbon reservoir with
good to very good quality which provide satisfactory hydrocarbon production.
Keywords: Sylhet Gas Field, Surma Basin, Petrophysical analysis, Porosity, Permeability, HC saturation
*Corresponding Author: Md. Shofiqul Islam, Department of Petroleum & Mining Engineering, Shahjalal
University of Science & Technology, Sylhet, Bangladesh
Petrophysical Analysis of Sylhet Gas Field Using Well Logs and Associated Data from Well Sylhet #,
Bangladesh
International Journal of Petroleum and Petrochemical Engineering (IJPPE) Page | 56
more wells, Sylhet-2 to Sylhet-6, were drilled from 1956 to 1964. Sylhet-4 blew out on reaching 315
m and Sylhet-5 was drilled in 1963 as an observation well to a depth of 575 m. Sylhet-6 was drilled in
1964 to a depth of 1,405 m and completed as a dual producer.
Sylhet-7 was drilled in 1986 as a gas development well but turned out to be the first oil discovery
well. Surma-1 and the sidetracked well Surma 1A were drilled in 1989 to appraise the oil discovery
[5].
A master thesis work had been conducted at PMRE, BUET on reservoir simulation using production
data analysis and pressure transient analysis for future production performance [Nath, 2010].
However, there is no works had been conducted on reservoir properties analysis using wireline logs
and associated data. We aimed to evaluate the petrophysical characterization of the reservoir rocks
including the porosity, permeability, water saturation, hydrocarbon saturation of the well Sylhet # of
the Sylhet Gas Field.
2. GEOLOGIC SETTING
Bangladesh lies in the northeastern corner of Indian subcontinent at the head of the Bay of Bengal [6].
Bengal Basin of Bangladesh is a young prolific depositional basin in the world [7]. This basin meets
the entire geological requirement for accumulation of natural gas in the subsurface [8]. Sylhet Trough
(Surma Basin) covers the northeastern part of the Bengal Basin, representing a promising petroleum
bearing basin in the Southeast Asia [9].
The Sylhet Gas Field is located in the Surma Basin, which is a Miocene gas producing province in the
north-eastern part of Bangladesh. In the Surma Basin, which forms a part of the Bengal Basin that
subsided mainly from Oligocene to Pliocene, there deposited almost exclusive clastic sequences of
deltaic to fluvial, and to a lesser degree marine sandstone, siltstone, and shale. These sediments were
subjected to the later phases of the Himalayan Arakan Orogeny, resulting in the formation of the
relatively gentle folds of the frontal folded belt [5].
The Surma Basin was formed structurally by the contemporaneous interaction of two major tectonic
elements; the emerging Shillong Massive to the North and the westward moving mobile Indo-Burma
Fold Belt. The tectonic movement is considered to have occurred from the Neogene to the present,
with the strongest period of crustal disturbance during the middle Miocene. The primary result of
these tectonics is a series of North-South oriented asymmetrical anticlines in Eastern Bangladesh, in
which the degree of deformation increases eastward. Basin relief, structural elements, growth rate,
style of traps, source rocks and maturities are suitable for forming gas-bearing structures of
commercial size [5].
Fig1. Geological map of Bangladesh. Showing the location of well Sylhet # [10]
Petrophysical Analysis of Sylhet Gas Field Using Well Logs and Associated Data from Well Sylhet #,
Bangladesh
International Journal of Petroleum and Petrochemical Engineering (IJPPE) Page | 57
3. MATERIALS AND METHOD
Data for this present study were collected from the Sylhet Gas Field Limited (A Company of
Petrobangla) with proper permission. The photocopy of the image of gamma ray (GR), resistivity
(deep, medium and shallow), sonic, SP, neutron, density, bit size and caliper logs of well Sylhet # and
some associated reports of that well were collected. The photocopy of the image of the logs were
converted to images (TIFF format) by scanning. The scanned TIFF images were then converted to
digital (text format) data by using the GetData Graph Digitizer 2.26 and Didger 3 software. The
digital data also then transferred to Excel 2016 software for the analysis. The log values, lithology and
calculated parameters were graphically represented and interpreted using Strater 2.5.704 and Adobe
Illustrator software.
3.1. Formation Temperature Determination
Formation temperature (Tf) is important in log analysis, because the resistivity of the drilling mud
(Rm), the mud filtrate (Rmf), and the formation water (Rw) vary with temperature [11]. We followed
the western Atlas Logging Services, 1985, to determine the formation temperature as follows,
AMSTFDTD
AMSTBHTT f
… (1)
Where,
AMST = Annual Mean Surface Temperature, BHT = Bottom Hole Temperature, FD = Formation
Depth, Tf = Formation temperature.
3.2. Water Resistivity Determination
Formation water resistivity (Rw) of the hydrocarbon bearing zone was calculated by the following
method [12],
)./(T
.
we
.
T
wew
f
f
R.
.RR
850log
04260
2
919log
1
105
101310 … …… (2)
Where,).T.(
ssp
mfwefRR
13306110
(3)
776
776
.T
.TRR
f
msmfsmf … …………….. (4)
Rw=Water Resistivity, Rmf =Resistivity of Mud Filtrate.
3.3. Shale Volume Determination
Shale volume was determined by using the gamma ray index from a gamma ray log [11] and then
shale volume was determined according to Larionov (1969) formula for Tertiary rocks,
minmax
minlog
GRGR
GRGRIGR
………………………………………………………… …………………(5)
Where,
IGR = Gamma ray index, GRlog = Gamma ray reading of formation, GRmin = Minimum gamma ray
(clean sand or carbonate), GRmax = Maximum gamma ray (shale).
Larionov (1969) for Tertiary rocks,
)(.V GR*I.sh 120830
73 ………………………………..……………………………………… ...… (6)
3.4. Porosity Determination from Porosity Logs
The porosity was determined by using the Sonic Log with Wyllie time-average equation [13],
Petrophysical Analysis of Sylhet Gas Field Using Well Logs and Associated Data from Well Sylhet #,
Bangladesh
International Journal of Petroleum and Petrochemical Engineering (IJPPE) Page | 58
mafl
mas
ΔtΔt
ΔtΔtΦ
log………………………… …………………………………………………… .(7)
Where, Φs= Sonic-derived porosity, ∆tma = Interval transit time in the matrix (Sandstone= 55.5
µsec/ft), ∆tlog = Interval transit time in the formation, ∆tfl = Interval transit time in the fluid in the
formation (freshwater mud = 189 µsec/ft).
Correction for Shale effect also conducted using the sonic log according to the equation [14],
mafl
mashsh
pmafl
mase
ΔtΔt
ΔtΔtV
CΔtΔt
ΔtΔtΦ
1log (8)
The hydrocarbon effect was corrected by using the following empirical formula by Hilchie (1978)
[11].
70.ΦΦs (Gas) … …..…… (9)
80.ΦΦs (Oil) (10)
3.5. Density Porosity
The porosity was also calculated by the following formula according to [11]:
flma
bmaD
ρρ
ρρΦ
(11)
Where,
ΦD = density derived porosity, ρma = matrix density (Sandstone = 2.644 g/cm3), ρb = formation bulk
density (the log reading), ρfl = fluid density (Fresh water=1 g/cm3).
For Shaly Formation, the porosity using the density log was calculated by the formula of [15],
Shale
NshaleDDe V.
.
ΦΦΦ 130
450 (12)
3.6. Neutron Log
Neutron logs are porosity logs that measure the hydrogen concentration in a formation. In clean
formations (i.e., shale-free) where the porosity is filled with water or oil, the neutron log measures
liquid filled porosity (ΦN, PHIN, or NPHI) [11].
For Shale effect, the porosity using the neutron log is [15],
Shale
NshaleNNe V.
.
ΦΦΦ 030
450 (13)
3.7. Combined Porosity
By using density porosity and neutron porosity measurement pairs above, the combined porosity was
calculated as [11],
2
22DeNe
ND
ΦΦΦ
(14)
Where, ΦND = Neutron-density shale-corrected porosity, ΦNe = Shale-corrected neutron porosity, ΦDe
= Shale-corrected density porosity
3.8. Water Saturation Determination
Water Saturation is the amount of pore volume in a rock that is occupied by formation water. After
the shale-corrected porosity has been determined, the water saturation can be calculated. A variety of
techniques are being used to determine the water saturation determination [11]. In this study, Fertl
(1975), Schlumberger (1975), Simandoux (1963) formula were used to evaluate the water saturation.
They are as follows, Fertl, 1975 [16]:
Petrophysical Analysis of Sylhet Gas Field Using Well Logs and Associated Data from Well Sylhet #,
Bangladesh
International Journal of Petroleum and Petrochemical Engineering (IJPPE) Page | 59
22
12
shsh
t
ww
VaVa
R
R
ΦS (15)
Schlumberger, 1975 [15]:
)V.(R.
Φ
R)V.(R.
Φ
R
V
S
shw
tshwsh
Sh
w
0140
0120
2
22
(16)
Simandoux, 1963 [17]:
sh
sh
wtsh
shww
R
V
RR
Φ
R
V
Φ
R.S
22
2
540 (17)
3.9. Bulk Volume of Water
The product of a formation’s water saturation (Sw) and its porosity (φ) is the bulk volume of water
(BVW) [11].
ΦSBVW W (18)
Where,
BVW = Bulk volume water, Sw = Water saturation of uninvaded zone, Φ= Porosity
3.10. The moveable hydrocarbon index
The moveable hydrocarbon index by the ratio method is [11],
2
1
wmf
txo
xo
w
/RR
/RR
S
S (19)
Where,
xow SS / = Moveable hydrocarbon index, Rxo = Shallow resistivity from measurements such as
laterolog-8, microspherically focused log, or microlaterolog, Rt = True formation resistivity (i.e., deep
induction or deep laterolog corrected for invasion), Rmf = Resistivity of mud filtrate at formation
temperature.
3.11. Permeability Determination
Permeability was calculated using the following formulas,
Wyllie and Rose [18]:
23
250
wirrS
ΦK (Medium gravity oils) (20)
2
3
79
wirrS
ΦK (Dry gas) (21)
Where,
K = Permeability in millidarcy, φ = Porosity, Sw irr = Water saturation (Sw) of a zone at irreducible
water saturation.
Timur [19]:
22293
wirr
.
S
ΦK (22)
Petrophysical Analysis of Sylhet Gas Field Using Well Logs and Associated Data from Well Sylhet #,
Bangladesh
International Journal of Petroleum and Petrochemical Engineering (IJPPE) Page | 60
Coates and Dumanoir [20]:
A first step in the Coates and Dumanoir permeability formula is calculation of values for two
constants: C and W [11].
C=23+465×ρh-188× ρh2) (23)
Where,
C = constant in Coates and Dumanoir permeability formula, ρh = hydrocarbon density in g/cm3
2
1
2
2
22log753
./RRΦ.W tirrw (24)
Where,
W = Constant in Coates and Dumanoir permeability formula, φ = Porosity, Rw = Formation water
resistivity at formation temperature, Rt irr = Deep resistivity from a zone at irreducible water saturation
(Sw irr).
Once determined, the constants C and W can be used to calculate permeability.
2
4
2
tirrw
W
/RRW
ΦCK
(25)
Where,
K = Permeability in millidarcy (md), C = Constant based on hydrocarbon density, W = Constant, φ =
Porosity,
Rt irr = Deep resistivity from a zone at irreducible water saturation (Sw irr), Rw = Formation water
resistivity at formation temperature.
4. RESULTS AND DISCUSSIONS
4.1. Lithology of the Well
The petrophysical techniques are also invaluable methods for mapping and identifying lithologies. The lithology
can be interpreted through using gamma ray (GR), spontaneous potential (SP), resistivity (LLD and
LLS), and density log (RHOB) [21]. However, the lithology of different strata is also can be
determined on the basis of reference values of density, gamma ray and resistivity of different rock
types [7]. Moreover, there are many techniques that can assist geologists with lithologic determination
and mapping such as the Neutron-density lithology plot, Neutron-sonic lithology plot, Density-sonic
lithology plot, M-N lithology plot, Matrix identification plot (ρmaa vs. ∆tmaa) etc. Schlumberger
Neutron-density cross-plot and Neutron-sonic lithology plot were used for lithology determination.
The gamma ray log was used to map clean (shale-free) sandstones vs. shaly sandstones and
carbonates. Shale exhibited relatively high GR count rates due to presence of potassium ions in the
lattice structure of clay mineral. On the other hand, reservoir rock (calcite, dolomite, quartz) exhibited
relatively low GR count rates [22]. In the sandstone zones, the average gamma ray value ranges from
60-82 API (Fig. 4.3), which indicates the presence of sandstone. In shale zones, GR exhibits relatively
high value where in mixed zones it is in medium range (Fig. 4.3).
The spontaneous potential (SP) log was also used to map clean (shale-free) sands vs. shaly sands. The
technique is called alpha (α) mapping [23] where the presence of shale in a formation decreases the
SP response. They were very negative in the sandstone zones showing an average SP values ranged
from -61 to 18 mV (Fig. 4.3). In the shale zones, the deflection was very negative to positive (Fig.
4.3).
Using the SP, GR and resistivity log, a total nine sandstone zones and seven shale zones were
identified for the well Sylhet #, Sylhet Gas Field (Fig. 4.1). There are three sand-shale mixed zones
were also identified (Fig. 4.1).
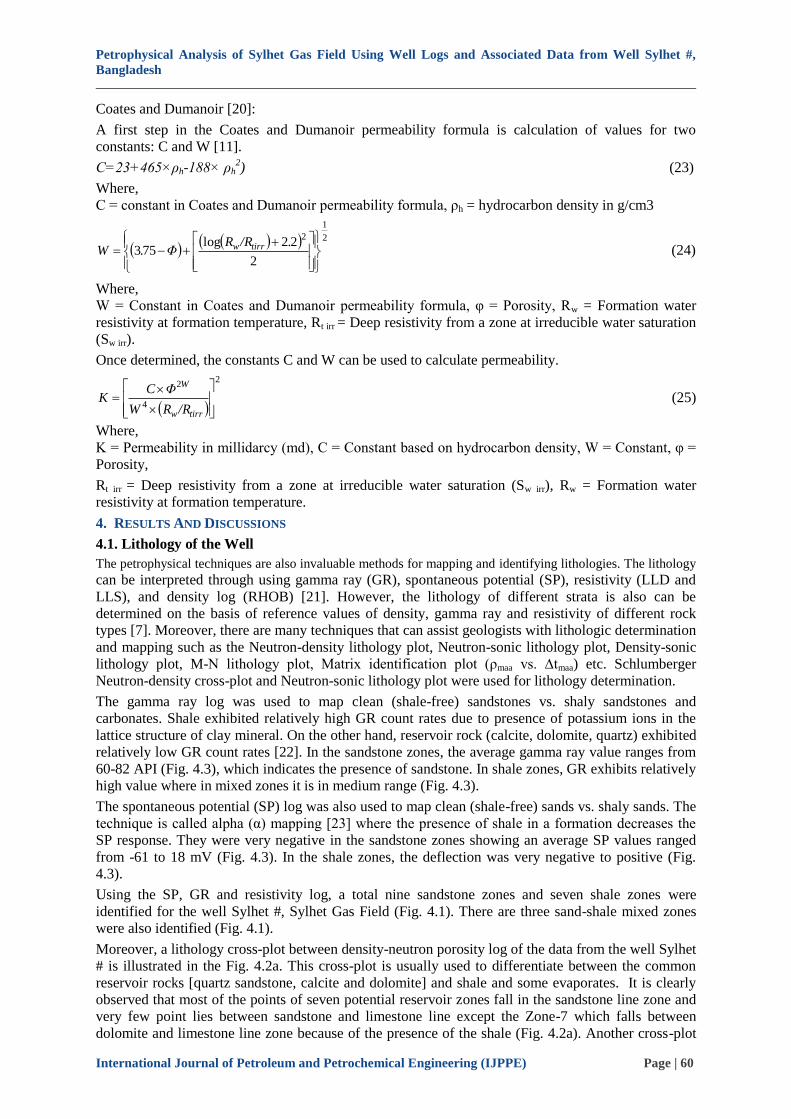
Moreover, a lithology cross-plot between density-neutron porosity log of the data from the well Sylhet
# is illustrated in the Fig. 4.2a. This cross-plot is usually used to differentiate between the common
reservoir rocks [quartz sandstone, calcite and dolomite] and shale and some evaporates. It is clearly
observed that most of the points of seven potential reservoir zones fall in the sandstone line zone and
very few point lies between sandstone and limestone line except the Zone-7 which falls between
dolomite and limestone line zone because of the presence of the shale (Fig. 4.2a). Another cross-plot
Petrophysical Analysis of Sylhet Gas Field Using Well Logs and Associated Data from Well Sylhet #,
Bangladesh
International Journal of Petroleum and Petrochemical Engineering (IJPPE) Page | 61
between the sonic-neutron log was used to differentiate between the common reservoir rocks when
clay content was negligible (Fig. 4.2b). It was also used to differentiate between a single known
reservoir rock and shale and to identify evaporate minerals. The values of neutron porosity was
entered on the x-axis and the sonic slowness (Δt) were entered on the y-axis to find their intersection
point, which described the cross-plot porosity and the lithology composition of the formation. It is
clear that the potential reservoir zones are sandstone dominated and a very few amounts of other
compositions are also present in the sandstone zones (Fig. 4.2b).
The reservoir rock the gas field is mainly sandstones of Bokabil and upper Bhuban Formation was
deposited under repeated transgressions and regressions of Miocene time. The Bokabil formation
usually consists of fine to medium–grained sandstones with alternating mudstone or siltstone. The
middle part of the Bokabil is more are naceous deposited under deltaic to shallow marine settings
exposed throughout the south – east fold belt of Bengal basin and forms natural gas reservoirs in in
the Bengal basin (Uddin & Lundberg, 1999). Deposition of reservoir rocks were occurred in fluvial
deltaic to estuarine environments. The tectonics and geological setting of the study area have been
greatly influenced by late Himalayan collision phase (Curiale et al., 2002).
Fig4.1. Lithology of different formations of the well Sylhet-#
Neutron Porosity, NPHI (%)
Fig4.2a. Density-Neutron cross-plot for lithology and
porosity determination, in case of fresh water, liquid-
filled boreholes (after Schlumberger) [24].
Fig. 4.2b Sonic-Neutron cross-plot for lithology
determination (after Schlumberger) [24].
Petrophysical Analysis of Sylhet Gas Field Using Well Logs and Associated Data from Well Sylhet #,
Bangladesh
International Journal of Petroleum and Petrochemical Engineering (IJPPE) Page | 62
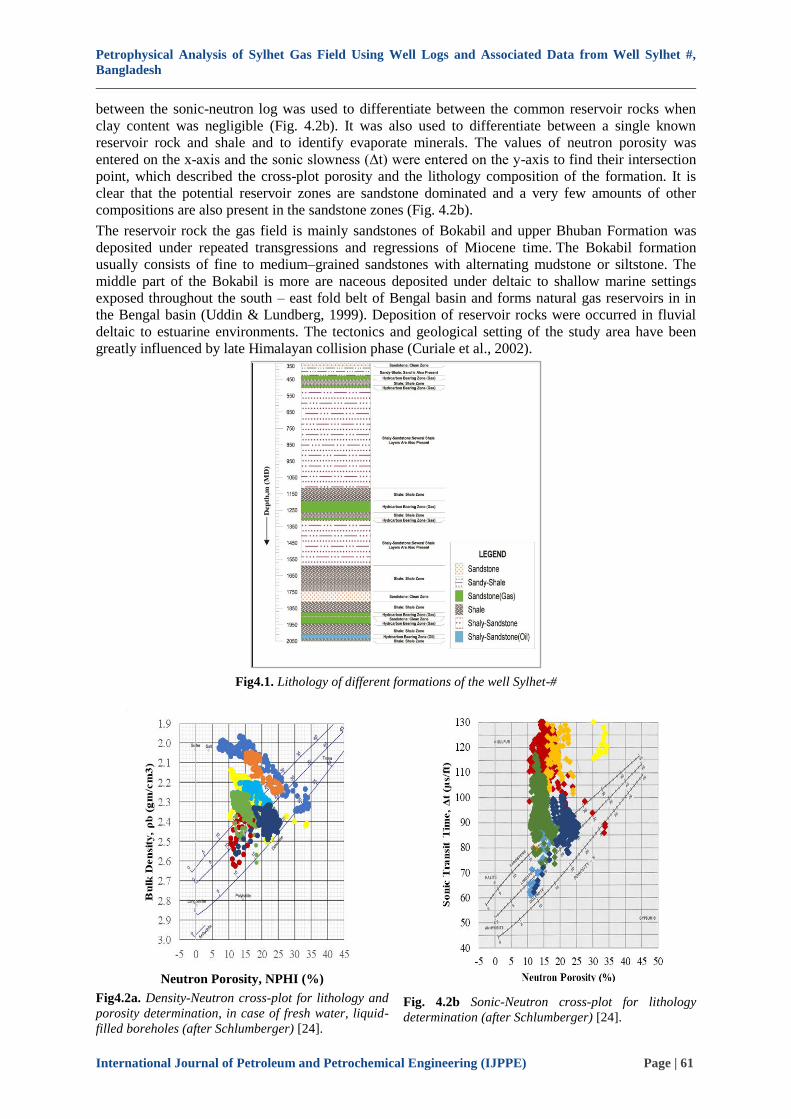
4.2. Permeable Zones in the well
Hydrocarbon-bearing zones in the well Sylhet-# were identified with the help of SP, GR, resistivity
(deep resistivity log (ILD) & shallow resistivity log (MSFL)), sonic, neutron and density log
responses. For this purpose, resistivity logs are the best option to detect gas-bearing zones [6]. Seven
(07) hydrocarbon bearing zones were identified in which six were gas-bearing and one was oil-
bearing zone (Table 4.1). Graphical representation of composite log response of Zone-3 (depth
between 1192 to 1263 m) is shown in Fig. 4.3. Other zones can also be represented similarly (not
shown). In these six gas-bearing zones, gamma ray log showed low response and SP log showed high
values as these deflects from shale base line (Fig. 4.3). The resistivity log response in the gas-bearing
zones was very high (Fig. 4.3). In these gas bearing zones, the ILD value was higher than the MSFL
(Fig. 4.3). Very low neutron and low density log responses support that hydrocarbon are gas type
[11]. This is a Neutron-density crossover. In water bearing zones the ILD value was lower than the
MSFL or medium resistivity log (LL-3) (Fig. 4.3).
Table4.1. Permeable Zones of the Well Sylhet #
Depth Range (m) (MD) Zone Type Thickness (m) Remark
428-450 Hydrocarbon Bearing 22 Zone-1
488-500 Hydrocarbon Bearing 12 Zone-2
850-875 Water Bearing 25
1083-1113 Water Bearing 30
1192-1263 Hydrocarbon Bearing 71 Zone-3
1297-1311 Hydrocarbon Bearing 14 Zone-4
1311-1321 Water Bearing 10
1560-1590 Water Bearing 30
1621-1640 Water Bearing 19
1740-1800 Water Bearing 60
1874-1898 Hydrocarbon Bearing 24 Zone-5
1901-1944 Hydrocarbon Bearing 43 Zone-6
1944-2009 Water Bearing 65
2009-2033 Hydrocarbon Bearing 24 Zone-7
Fig4.3. Composite log response of Zone-3(Gas) of well Sylhet #
Table4.2. Different Log Parameters and their Average Values Calculated from the HC Bearing Zones of the
Well Sylhet #
HC
Zones
Depth, m
(MD)
GR
(API)
RILD
(Ohm-m)
MSFL
(Ohm-m)
Sonic, ΔT
(ms/ft)
RHOB
(g/cc)
NPHI (%)
Petrophysical Analysis of Sylhet Gas Field Using Well Logs and Associated Data from Well Sylhet #,
Bangladesh
International Journal of Petroleum and Petrochemical Engineering (IJPPE) Page | 63
Zone-1 428-450 85 71 36 164 2.1 16
Zone-2 488-500 79 54 32 161 2.1 19
Zone-3 1194-1263 70 95 46 115 2.2 15
Zone-4 1297-1311 80 37 33 116 2.3 18
Zone-5 1874-1898 66 33 36 87 2.4 15
Zone-6 1901-1944 60 69 35 95 2.3 14
Zone-7 2009-2033 81 22 25 88 2.4 22
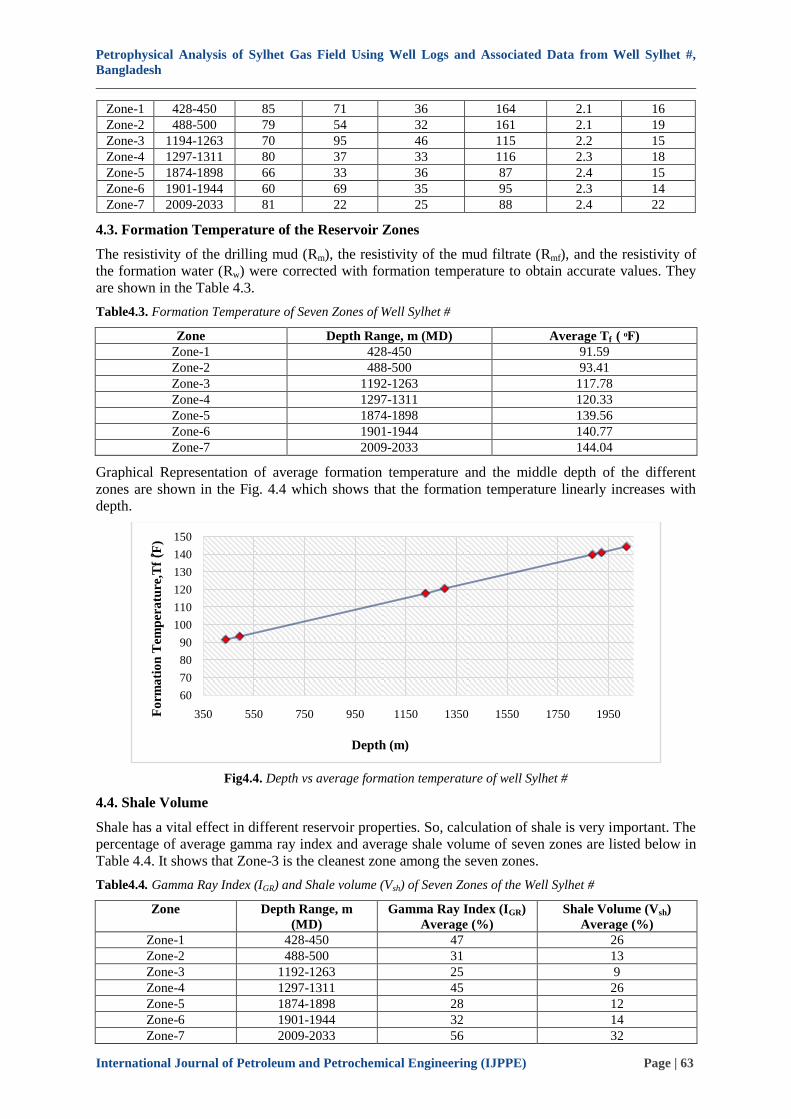
4.3. Formation Temperature of the Reservoir Zones
The resistivity of the drilling mud (Rm), the resistivity of the mud filtrate (Rmf), and the resistivity of
the formation water (Rw) were corrected with formation temperature to obtain accurate values. They
are shown in the Table 4.3.
Table4.3. Formation Temperature of Seven Zones of Well Sylhet #
Zone Depth Range, m (MD) Average Tf ( ͦF)
Zone-1 428-450 91.59
Zone-2 488-500 93.41
Zone-3 1192-1263 117.78
Zone-4 1297-1311 120.33
Zone-5 1874-1898 139.56
Zone-6 1901-1944 140.77
Zone-7 2009-2033 144.04
Graphical Representation of average formation temperature and the middle depth of the different
zones are shown in the Fig. 4.4 which shows that the formation temperature linearly increases with
depth.
Fig4.4. Depth vs average formation temperature of well Sylhet #
4.4. Shale Volume
Shale has a vital effect in different reservoir properties. So, calculation of shale is very important. The
percentage of average gamma ray index and average shale volume of seven zones are listed below in
Table 4.4. It shows that Zone-3 is the cleanest zone among the seven zones.
Table4.4. Gamma Ray Index (IGR) and Shale volume (Vsh) of Seven Zones of the Well Sylhet #
Zone Depth Range, m
(MD)
Gamma Ray Index (IGR)
Average (%)
Shale Volume (Vsh)
Average (%)
Zone-1 428-450 47 26
Zone-2 488-500 31 13
Zone-3 1192-1263 25 9
Zone-4 1297-1311 45 26
Zone-5 1874-1898 28 12
Zone-6 1901-1944 32 14
Zone-7 2009-2033 56 32
60
70
80
90
100
110
120
130
140
150
350 550 750 950 1150 1350 1550 1750 1950Fo
rma
tio
n T
emp
era
ture
,Tf
(ͦF)
Depth (m)
Petrophysical Analysis of Sylhet Gas Field Using Well Logs and Associated Data from Well Sylhet #,
Bangladesh
International Journal of Petroleum and Petrochemical Engineering (IJPPE) Page | 64
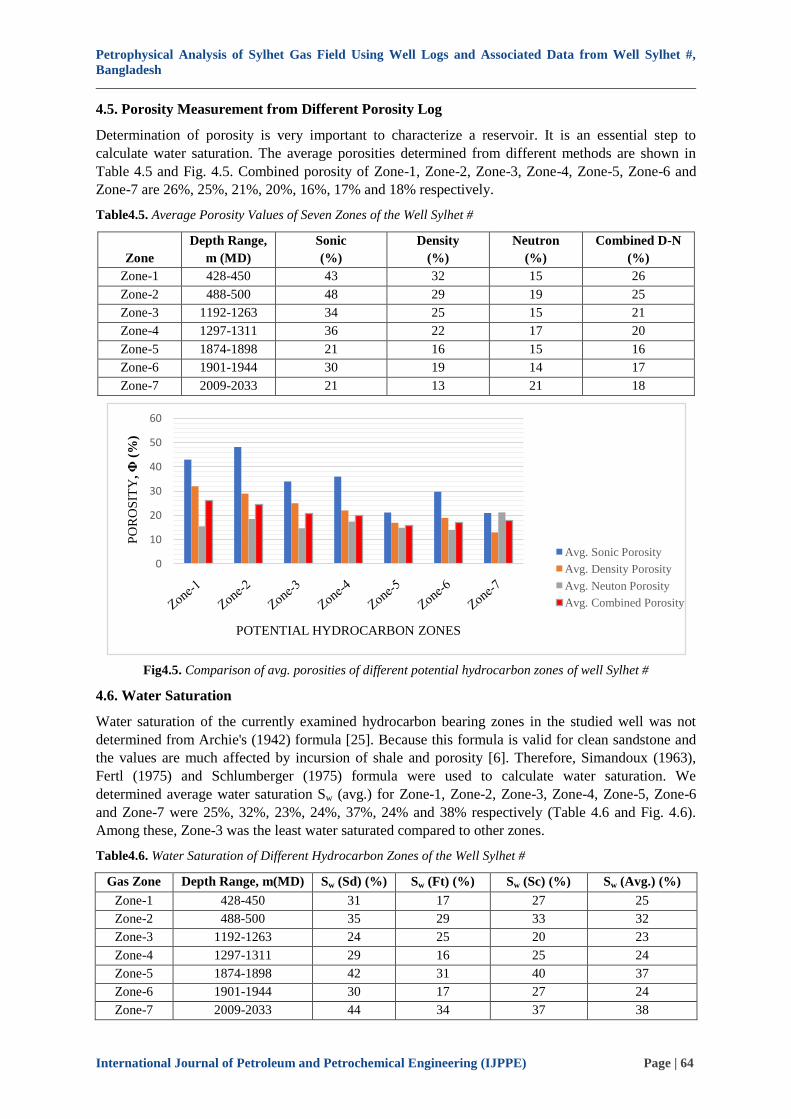
4.5. Porosity Measurement from Different Porosity Log
Determination of porosity is very important to characterize a reservoir. It is an essential step to
calculate water saturation. The average porosities determined from different methods are shown in
Table 4.5 and Fig. 4.5. Combined porosity of Zone-1, Zone-2, Zone-3, Zone-4, Zone-5, Zone-6 and
Zone-7 are 26%, 25%, 21%, 20%, 16%, 17% and 18% respectively.
Table4.5. Average Porosity Values of Seven Zones of the Well Sylhet #
Zone
Depth Range,
m (MD)
Sonic
(%)
Density
(%)
Neutron
(%)
Combined D-N
(%)
Zone-1 428-450 43 32 15 26
Zone-2 488-500 48 29 19 25
Zone-3 1192-1263 34 25 15 21
Zone-4 1297-1311 36 22 17 20
Zone-5 1874-1898 21 16 15 16
Zone-6 1901-1944 30 19 14 17
Zone-7 2009-2033 21 13 21 18
Fig4.5. Comparison of avg. porosities of different potential hydrocarbon zones of well Sylhet #
4.6. Water Saturation
Water saturation of the currently examined hydrocarbon bearing zones in the studied well was not
determined from Archie's (1942) formula [25]. Because this formula is valid for clean sandstone and
the values are much affected by incursion of shale and porosity [6]. Therefore, Simandoux (1963),
Fertl (1975) and Schlumberger (1975) formula were used to calculate water saturation. We
determined average water saturation Sw (avg.) for Zone-1, Zone-2, Zone-3, Zone-4, Zone-5, Zone-6
and Zone-7 were 25%, 32%, 23%, 24%, 37%, 24% and 38% respectively (Table 4.6 and Fig. 4.6).
Among these, Zone-3 was the least water saturated compared to other zones.
Table4.6. Water Saturation of Different Hydrocarbon Zones of the Well Sylhet #
Gas Zone Depth Range, m(MD) Sw (Sd) (%) Sw (Ft) (%) Sw (Sc) (%) Sw (Avg.) (%)
Zone-1 428-450 31 17 27 25
Zone-2 488-500 35 29 33 32
Zone-3 1192-1263 24 25 20 23
Zone-4 1297-1311 29 16 25 24
Zone-5 1874-1898 42 31 40 37
Zone-6 1901-1944 30 17 27 24
Zone-7 2009-2033 44 34 37 38
0
10
20
30
40
50
60
PO
RO
SIT
Y, Φ
(%)
POTENTIAL HYDROCARBON ZONES
Avg. Sonic Porosity
Avg. Density Porosity
Avg. Neuton Porosity
Avg. Combined Porosity
Petrophysical Analysis of Sylhet Gas Field Using Well Logs and Associated Data from Well Sylhet #,
Bangladesh
International Journal of Petroleum and Petrochemical Engineering (IJPPE) Page | 65
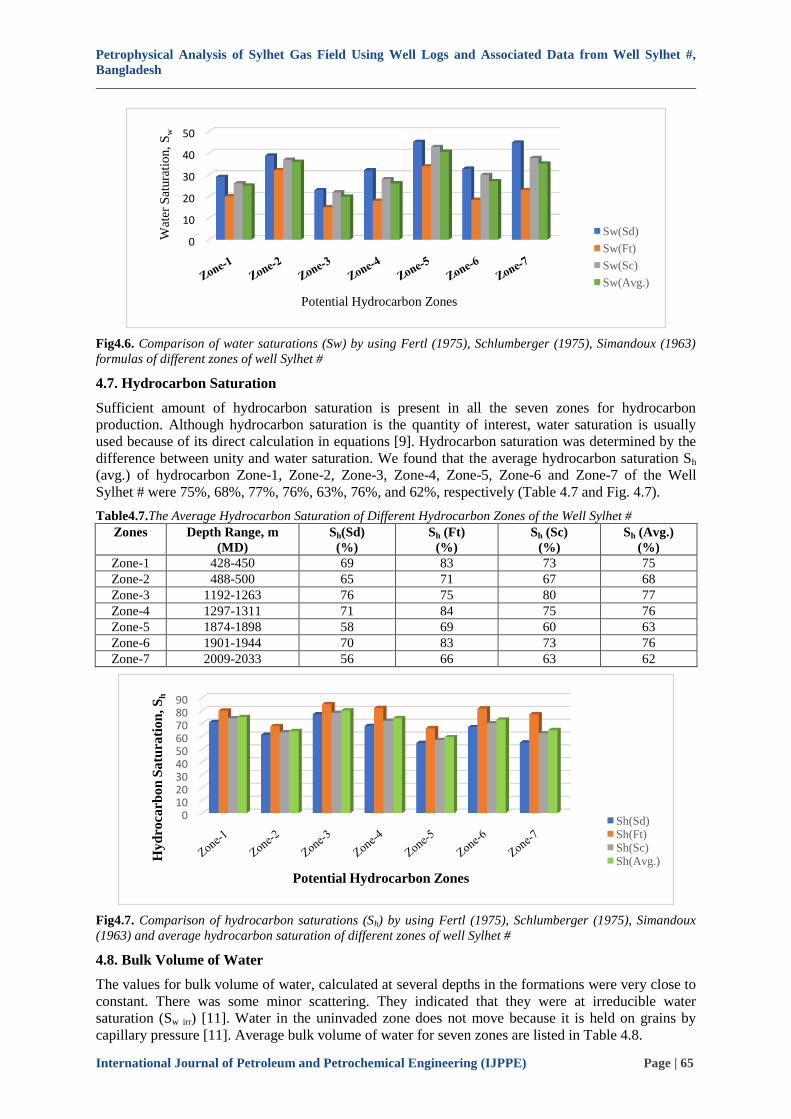
Fig4.6. Comparison of water saturations (Sw) by using Fertl (1975), Schlumberger (1975), Simandoux (1963)
formulas of different zones of well Sylhet #
4.7. Hydrocarbon Saturation
Sufficient amount of hydrocarbon saturation is present in all the seven zones for hydrocarbon
production. Although hydrocarbon saturation is the quantity of interest, water saturation is usually
used because of its direct calculation in equations [9]. Hydrocarbon saturation was determined by the
difference between unity and water saturation. We found that the average hydrocarbon saturation Sh
(avg.) of hydrocarbon Zone-1, Zone-2, Zone-3, Zone-4, Zone-5, Zone-6 and Zone-7 of the Well
Sylhet # were 75%, 68%, 77%, 76%, 63%, 76%, and 62%, respectively (Table 4.7 and Fig. 4.7).
Table4.7.The Average Hydrocarbon Saturation of Different Hydrocarbon Zones of the Well Sylhet #
Zones Depth Range, m
(MD)
Sh(Sd)
(%)
Sh (Ft)
(%)
Sh (Sc)
(%)
Sh (Avg.)
(%)
Zone-1 428-450 69 83 73 75
Zone-2 488-500 65 71 67 68
Zone-3 1192-1263 76 75 80 77
Zone-4 1297-1311 71 84 75 76
Zone-5 1874-1898 58 69 60 63
Zone-6 1901-1944 70 83 73 76
Zone-7 2009-2033 56 66 63 62
Fig4.7. Comparison of hydrocarbon saturations (Sh) by using Fertl (1975), Schlumberger (1975), Simandoux
(1963) and average hydrocarbon saturation of different zones of well Sylhet #
4.8. Bulk Volume of Water
The values for bulk volume of water, calculated at several depths in the formations were very close to
constant. There was some minor scattering. They indicated that they were at irreducible water
saturation (Sw irr) [11]. Water in the uninvaded zone does not move because it is held on grains by
capillary pressure [11]. Average bulk volume of water for seven zones are listed in Table 4.8.
0
10
20
30
40
50
Wat
er S
atura
tio
n,
Sw
Potential Hydrocarbon Zones
Sw(Sd)
Sw(Ft)
Sw(Sc)
Sw(Avg.)
0102030405060708090
Hyd
roca
rbon
Satu
rati
on
, S
h
Potential Hydrocarbon Zones
Sh(Sd)Sh(Ft)Sh(Sc)Sh(Avg.)
Petrophysical Analysis of Sylhet Gas Field Using Well Logs and Associated Data from Well Sylhet #,
Bangladesh
International Journal of Petroleum and Petrochemical Engineering (IJPPE) Page | 66
4.9. Moveable Hydrocarbon Index
In seven HC bearing gas and oil zones, the moveable hydrocarbon index, Sw/Sxo is less than 0.7. So,
hydrocarbons will move during invasion [11]. Average moveable hydrocarbon index for seven zones
are listed in Table 4.8.
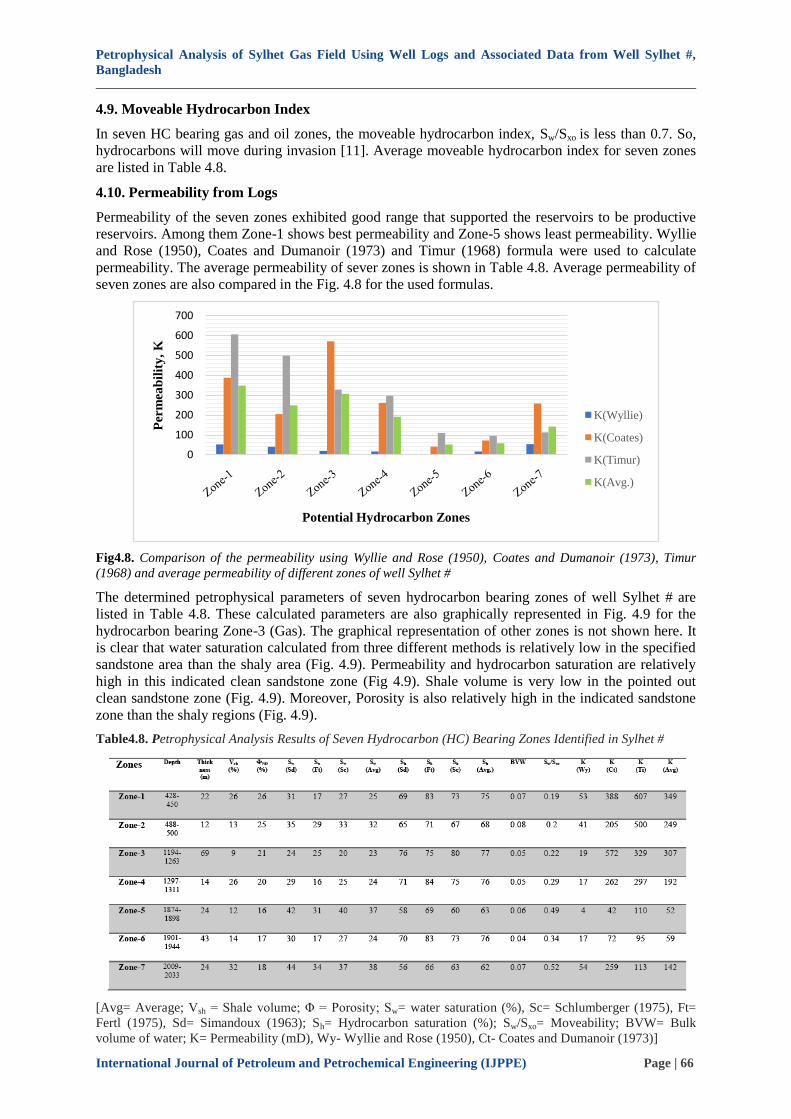
4.10. Permeability from Logs
Permeability of the seven zones exhibited good range that supported the reservoirs to be productive
reservoirs. Among them Zone-1 shows best permeability and Zone-5 shows least permeability. Wyllie
and Rose (1950), Coates and Dumanoir (1973) and Timur (1968) formula were used to calculate
permeability. The average permeability of sever zones is shown in Table 4.8. Average permeability of
seven zones are also compared in the Fig. 4.8 for the used formulas.
Fig4.8. Comparison of the permeability using Wyllie and Rose (1950), Coates and Dumanoir (1973), Timur
(1968) and average permeability of different zones of well Sylhet #
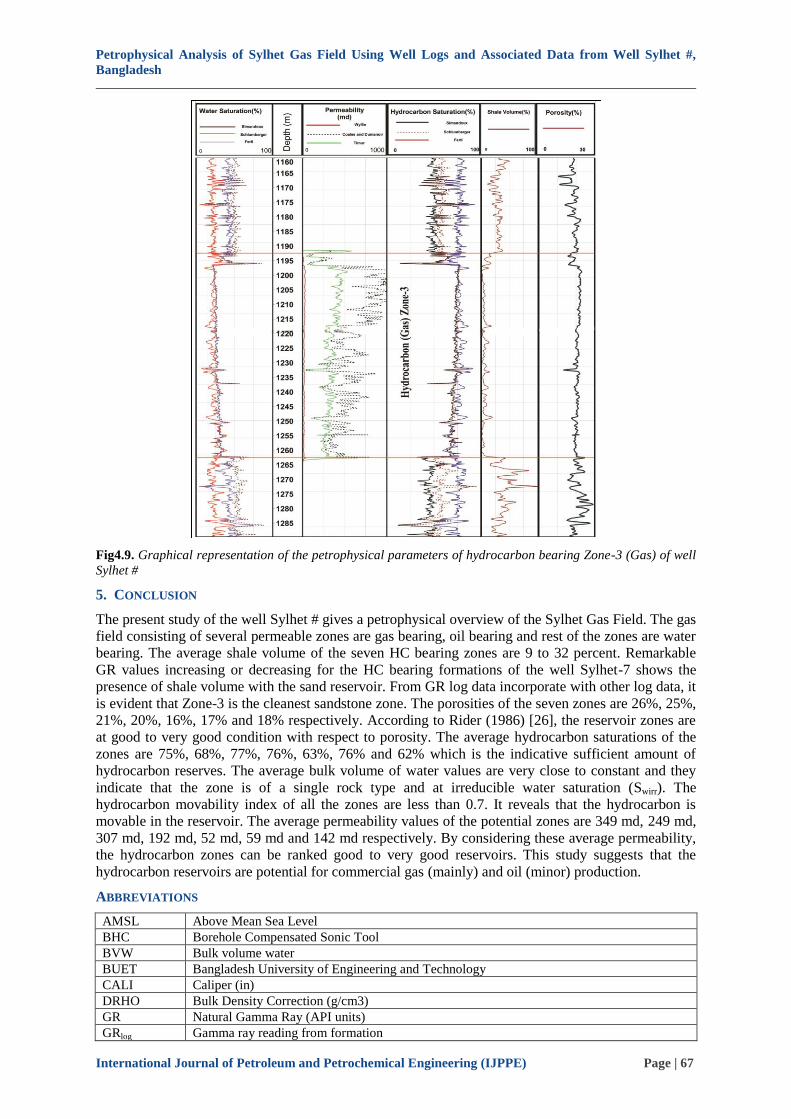
The determined petrophysical parameters of seven hydrocarbon bearing zones of well Sylhet # are
listed in Table 4.8. These calculated parameters are also graphically represented in Fig. 4.9 for the
hydrocarbon bearing Zone-3 (Gas). The graphical representation of other zones is not shown here. It
is clear that water saturation calculated from three different methods is relatively low in the specified
sandstone area than the shaly area (Fig. 4.9). Permeability and hydrocarbon saturation are relatively
high in this indicated clean sandstone zone (Fig 4.9). Shale volume is very low in the pointed out
clean sandstone zone (Fig. 4.9). Moreover, Porosity is also relatively high in the indicated sandstone
zone than the shaly regions (Fig. 4.9).
Table4.8. Petrophysical Analysis Results of Seven Hydrocarbon (HC) Bearing Zones Identified in Sylhet #
[Avg= Average; Vsh = Shale volume; Φ = Porosity; Sw= water saturation (%), Sc= Schlumberger (1975), Ft=
Fertl (1975), Sd= Simandoux (1963); Sh= Hydrocarbon saturation (%); Sw/Sxo= Moveability; BVW= Bulk
volume of water; K= Permeability (mD), Wy- Wyllie and Rose (1950), Ct- Coates and Dumanoir (1973)]
0
100
200
300
400
500
600
700
Per
mea
bil
ity
, K
Potential Hydrocarbon Zones
K(Wyllie)
K(Coates)
K(Timur)
K(Avg.)
Petrophysical Analysis of Sylhet Gas Field Using Well Logs and Associated Data from Well Sylhet #,
Bangladesh
International Journal of Petroleum and Petrochemical Engineering (IJPPE) Page | 67
Fig4.9. Graphical representation of the petrophysical parameters of hydrocarbon bearing Zone-3 (Gas) of well
Sylhet #
5. CONCLUSION
The present study of the well Sylhet # gives a petrophysical overview of the Sylhet Gas Field. The gas
field consisting of several permeable zones are gas bearing, oil bearing and rest of the zones are water
bearing. The average shale volume of the seven HC bearing zones are 9 to 32 percent. Remarkable
GR values increasing or decreasing for the HC bearing formations of the well Sylhet-7 shows the
presence of shale volume with the sand reservoir. From GR log data incorporate with other log data, it
is evident that Zone-3 is the cleanest sandstone zone. The porosities of the seven zones are 26%, 25%,
21%, 20%, 16%, 17% and 18% respectively. According to Rider (1986) [26], the reservoir zones are
at good to very good condition with respect to porosity. The average hydrocarbon saturations of the
zones are 75%, 68%, 77%, 76%, 63%, 76% and 62% which is the indicative sufficient amount of
hydrocarbon reserves. The average bulk volume of water values are very close to constant and they
indicate that the zone is of a single rock type and at irreducible water saturation (Swirr). The
hydrocarbon movability index of all the zones are less than 0.7. It reveals that the hydrocarbon is
movable in the reservoir. The average permeability values of the potential zones are 349 md, 249 md,
307 md, 192 md, 52 md, 59 md and 142 md respectively. By considering these average permeability,
the hydrocarbon zones can be ranked good to very good reservoirs. This study suggests that the
hydrocarbon reservoirs are potential for commercial gas (mainly) and oil (minor) production.
ABBREVIATIONS
AMSL Above Mean Sea Level
BHC Borehole Compensated Sonic Tool
BVW Bulk volume water
BUET Bangladesh University of Engineering and Technology
CALI Caliper (in)
DRHO Bulk Density Correction (g/cm3)
GR Natural Gamma Ray (API units)
GRlog Gamma ray reading from formation
Petrophysical Analysis of Sylhet Gas Field Using Well Logs and Associated Data from Well Sylhet #,
Bangladesh
International Journal of Petroleum and Petrochemical Engineering (IJPPE) Page | 68
GRmax Gamma Ray Maximum
GRmin Gamma Ray Minimum
HC Hydrocarbon
IGR Gamma Ray Index
ILD Deep Resistivity (ohm)
ILM Medium Resistivity (ohm)
MSFL Microspherically Focused Log (ohm)
mD Milli Darcy
MD Measured Depth
NPHI Neutron Porosity (%)
Petrobangla Bangladesh Oil, Gas and Mineral Corporation
PPL Pakistan Petroleum Limited
PMRE Petroleum and Mineral Resources Engineering
Rm Resistivity of Drilling Mud
Rmf Resistivity of Mud Filtrate
Rt Resistivity of Uninvaded Zone
Rw Resistivity of Formation Water
Rxo Resistivity of Flushed Zone
Rt irr Deep resistivity from a zone at irreducible water saturation
RHOB Bulk Density (g/cm3)
SGFL Sylhet Gas Fields Limited (A Company of Petrobangla)
SP Spontaneous or Self Potential
SSP Static SP
Sh Hydrocarbon Saturation
Sw Water Saturation
Sw irr Irreducible Water Saturation
Sxo Water Saturation of Flushed Zone
Vsh Shale Volume
TVD True Vertical Depth
W Constant
Φ Porosity
Φs Sonic-derived porosity
ΦSe Effective (shale-corrected) sonic porosity
ΦD Density Porosity
ΦNe Shale-corrected neutron porosity
ΦDe Shale-corrected density porosity
ΦDsh Density porosity of a nearby shale
ΦN Neutron Porosity
ΦN-D Combined Neutron-Density Porosity
ρb Bulk Density
ρmatrix Matrix Density
ρh Hydrocarbon Density
REFERENCES
[1] Shofiqul, I. M., and Nusrat, J. L., Reservoir characterization of Habiganj gas field. International Journal of
Oil, Gas and Coal Engineering, 1(1), 7-15, (2013).
[2] Sakurai, S., Grimaldo-Suarez, F. M., Aguilera-Gomez, L. E., and Rodriguez-Larios, J. A., Estimate of
lithology and net gas sand from wireline logs: Veracruz and Macuspana Basins, Mexico, Gulf Coast Asso.
Geol. Soc. Transac, 52, 871-881 (2002).
[3] Horsfall, O., Davies, D., and Davies, O., Hydrocarbon Reservoir Characterization Using Well Log in
Niger Delta Basin of Nigeria, International Journal of Applied and Natural Sciences (IJANS), 4(5), (2015).
[4] Asquith, G. B. and Gibson, R. C., Basic well log analysis for geologist, The AAPG, Houston, 1982.
[5] RPS Energy, Sylhet Geological Study, Prepared for Petrobangla, Dhaka, Bangladesh, (2009).
[6] Farhaduzzaman, M., Islam, M. A., Abdullah, W. H., and Dutta, J., Log based petrophysical analysis of
mio-pliocene sandstone reservoir encountered in well Rashidpur 4 of Bengal Basin in
Bangladesh, Bangladesh Journal of Scientific and Industrial Research, 51(1), 23-34, (2016).
[7] Islam, A. R. M. T., and Islam, M. A., Evaluation of Gas Reservoir of the Meghna Gas Field, Bangladesh
Using Wireline Log Interpretation, Universal Journal of Geoscience, 2(2), 62-69, (2014).
Petrophysical Analysis of Sylhet Gas Field Using Well Logs and Associated Data from Well Sylhet #,
Bangladesh
International Journal of Petroleum and Petrochemical Engineering (IJPPE) Page | 69
[8] Islam, A. R. M. T., Habib, M. A., Islam, M. T., and Mita, M. R., Interpretation of wireline log data for
reservoir characterization of the Rashidpur Gas Field, Bengal Basin, Bangladesh. IOSR Journal of Applied
Geology and Geophysics (IOSR-JAGG), 1(4), 47-54, (2013).
[9] Islam, M. S., Hosain, M., Jolly, Y. N., Hossain, M. S., Akter, S., and Kabir, J., Geochemical Analysis of
the Reservoir Rocks of Surma Basin, Bangladesh. Geosciences, 5(1), 1-7, (2015).
[10] Petrobangla, Petrobangla Annual Report 2013, Petrobangla, Dhaka, (2013).
[11] Asquith, G. B., Krygowski, D., and Gibson, C. R., Basic well log analysis (Vol. 16), Tulsa: American
association of petroleum geologists, 2004.
[12] Enikanselu, P. A., and Adekanle, A., A Fortran Programme for Computing Formation (Connate) Water
Resistivity from Spontaneous Potential Logs, American-Eurasian Journal of Scientific Research, 3(2),
172-177, (2008).
[13] Wyllie, M. R. J., Gregory, A. R., and Gardner, G. H. F., An experimental investigation of factors affecting
elastic wave velocities in porous media, Geophysics, 23(3), 459-493, (1958).
[14] Atlas, D., Log Interpretation Charts, Houston, Dresser Industries. Inc., (1979).
[15] Schlumberger, A., A guide to well site interpretation of the gulf coast, Schlumberger Well Services,
Houston., (1975).
[16] Fertl, W. H., Shaly-sand analysis in development wells, Soc, Professional Well Log Analysis, In 16th Ann
Logging Symp. Trans., Paper A., (1975).
[17] Simandoux, P., Dielectric measurements on porous media, application to the measurements of water
saturation: study of behavior of argillaceous formations. Revue de l’Institut Francais du Petrol, 18
(supplementary issue), 93-215, (1963).
[18] Wyllie, M. R. J., and Rose, W. D., Some theoretical considerations related to the quantitative evaluation of
the physical characteristics of reservoir rock from electrical log data, Journal of Petroleum
Technology, 2(04), 105-110, (1950).
[19] Timur, A., An investigation of permeability, porosity, and residual water saturation relationships,
In SPWLA 9th annual logging symposium, Society of Petrophysicists and Well-Log Analysts, January 8-
17, (1968).
[20] Coates, G., and Dumanoir, J. L., A new approach to improve log-derived permeability; Society of
Professional Well Log Analysis. In 14th Ann. Logging Symp. Trans. Paper R., (1973).
[21] Well log analysis for reservoir characterization. (2017, March 23). Retrieved from http:// wiki. aapg.org/
Well_log_analysis_for_reservoir_characterization.
[22] Ahammod, S., Hai, M. A., Islam, M. R., and Abu, S. M., Petro-Physical Analysis of Reservoir Rock Of
Fenchuganj Gas Field (Well# 03) Using Wireline Log, 3(8), 37, (2014).
[23] Atlas, D., Log review I. Dresser Atlas Division, Dresser Industries., (1974).
[24] Charts, Schlumberger Log Interpretation, Schlumberger Limited, New York., (2009).
[25] Archie, G. E., The electrical resistivity log as an aid in determining some reservoir characteristics,
Transactions of the AIME, 146(01), 54-62, (1942).
[26] Rider, M. H., The geological interpretation of well logs, Blackie, Glasgow., 1986.
Citation: Abdullah Al Fatta et.al, (2018). Petrophysical Analysis of Sylhet Gas Field Using Well Logs and
Associated Data from Well Sylhet #, Bangladesh, International Journal of Petroleum and Petrochemical
Engineering (IJPPE), 4(1), pp.55-69, DOI: http://dx.doi.org/10.20431/2454-7980.0401007
Copyright: © 2018 Abdullah Al Fatta et.al, (2018). This is an open-access article distributed under the terms of
the Creative Commons Attribution License, which permits unrestricted use, distribution, and reproduction in any
medium, provided the original author and source are credited