Embed Size (px)
Citation preview

PFAS Analytical Methods –
New Hampshire’s Experience
October 10, 2018
PFAS Analytical Methods Application, Comparison,
and Lab Accreditation
Brandon Kernen, PG
New Hampshire Department of Environmental Services

Presentation Overview1) PFAS Sampling In New Hampshire
• Public water systems
• Other sites and media
2) ASDWA’s Primer on Sampling for PFAS in Public
Water Systems
• Analytical options • Causes for variability in results
• Target analytes • Interpreting data
• Reporting limits • Sample collection procedures
• Identifying a qualified
laboratory
• Development of new analytical
methods

• Ambient Groundwater Quality Standard (clean-up and
enforceable drinking water standard of 70 ppt for
PFOA/PFOS combined (based on health criteria only)
• Per state law, must initiate rulemaking for MCLs by 1/1/19
for PFOA, PFOS, PFNA and PFHxS (considers health
benefits, costs and technical feasibility)
• Per state law, must develop a plan and budget for
developing surface water quality standards by 1/1/20
• Per state law, has clear authority to regulate air emissions
to protect water quality
PFAS Regulation in NH

PFAS Sampling Timeline in NH
2013-2015 UCMR 3
(21 water systems / 80 sources)
2014 – DoD / Superfund Sampling
(3 major water supply wells)
2016 – Sampling of wells around two air emissions sites
(1000+ wells)
Present –
Statewide
sampling
(3000+ multi-
media samples)

Potential PFAS
Sources/
Targeted
Sampling
State-wide
Surface Water
Sampling
Waste Sites Sampling
New Sources
of Water for
Public Water
Systems
Air Emissions
Public Water
Systems
Wastewater/Biosolids
Groundwater
at Wastewater
Discharge
Sites
Sampling for
PFAS in NH
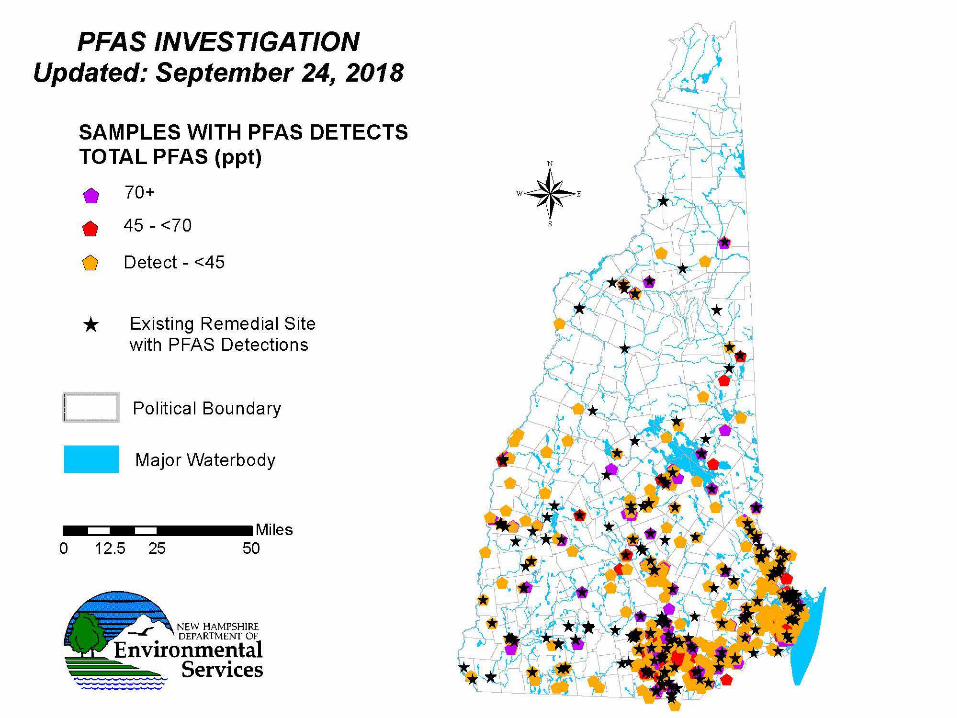

~2,900 water samples
~2,300 sample locations
http://nhdes.maps.arcgis.com/apps/View/index.html?appid=66
770bef141c43a98a445c54a17720e2&extent=-
73.5743,42.5413,-69.6852,45.4489

Public Water System Sampling in New Hampshire
Combined PFOA &
PFOS Result
Number of Public Water
System Sources
Percentage
Greater than 70 ppt 7 1.6%
Greater than 60 ppt 9 2.1%
Greater than 50 ppt 9 2.1%
Greater than 40 ppt 10 2.3%
Greater than 30 ppt 17 4.0%
Greater than 20 ppt 32 7.5%
Greater than 10 ppt 57 13.3%
Greater than 5 ppt 73 17.0%
Number of Sources Tested = 429
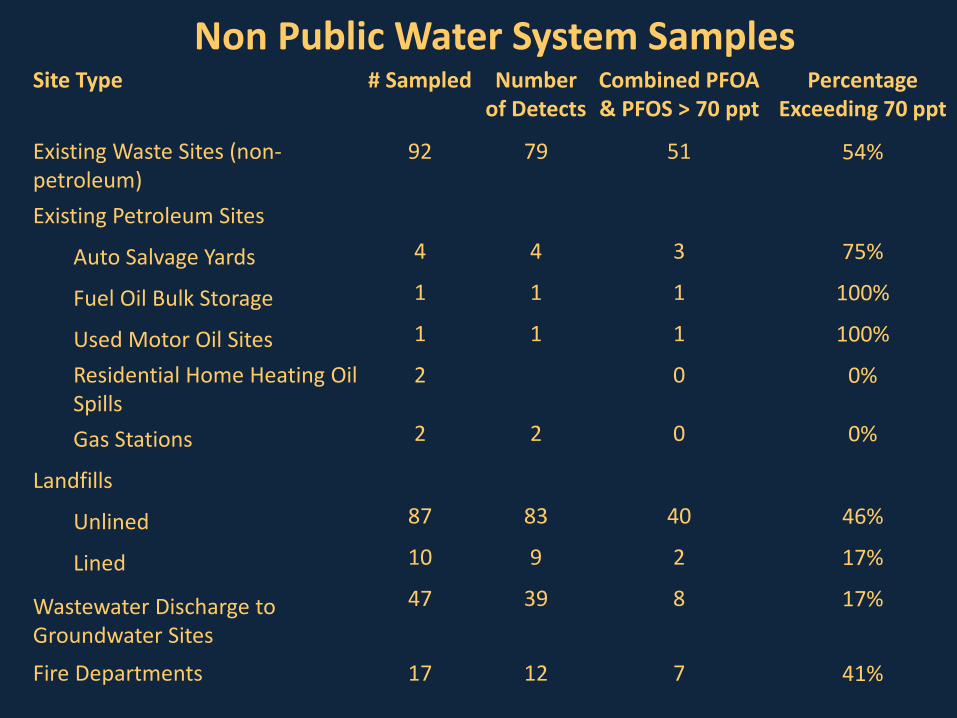
Non Public Water System SamplesSite Type # Sampled Number
of Detects
Combined PFOA
& PFOS > 70 ppt
Percentage
Exceeding 70 ppt
Existing Waste Sites (non-
petroleum)
92 79 51 54%
Existing Petroleum Sites
Auto Salvage Yards 4 4 3 75%
Fuel Oil Bulk Storage 1 1 1 100%
Used Motor Oil Sites 1 1 1 100%
Residential Home Heating Oil
Spills
2 0 0%
Gas Stations 2 2 0 0%
Landfills
Unlined 87 83 40 46%
Lined 10 9 2 17%
Wastewater Discharge to
Groundwater Sites
47 39 8 17%
Fire Departments 17 12 7 41%


Topic 1: Selecting an Analytical Method
1) EPA Method 537 Rev 1.1Pros
• Only standard method used
by commercial labs
• Method developed by
USEPA
• Cost less than other
methods
Cons
• Cost more than Method 537
• Labs use their own
proprietary method/method
different from lab to lab
2) Isotope Dilution Pros
• Considered the best method
by many chemists
• Can be used for non-drinking
water samples
• Can include more analytes
than Method 537
• Makes corrections for matrix
interference
Cons
• Includes only 14 analytes
• Not intended for non-
drinking water samples
• Corrections are not made to
account for matrix
interference

Topic 2: Finding a Qualified Laboratory
• National Environmental Laboratory Accreditation Program http://lams.nelac-institute.org/Search) by selecting a common PFAS chemical
such as perfluorooctanoic acid (PFOA) under the “Analyte” pulldown tool; and
• The Department of Defense https://www.denix.osd.mil/edqw/accreditation/accreditedlabs/ by selecting
EPA 537 or “EPA 537 Mod” under the “Method” pull down tool.
• Some states may have their own accreditation or certification
programs
Laboratory Accreditation Programs
Note: Isotope dilution is sometimes called “Method 537 Modified” even though it is
completely different than Method 537
Other approaches to verify laboratory performance
• Periodically split samples and send to multiple laboratories
• Conduct double blind proficiency testing studies with labs you work with
• Request that the lab provides the results of historical proficiency testing
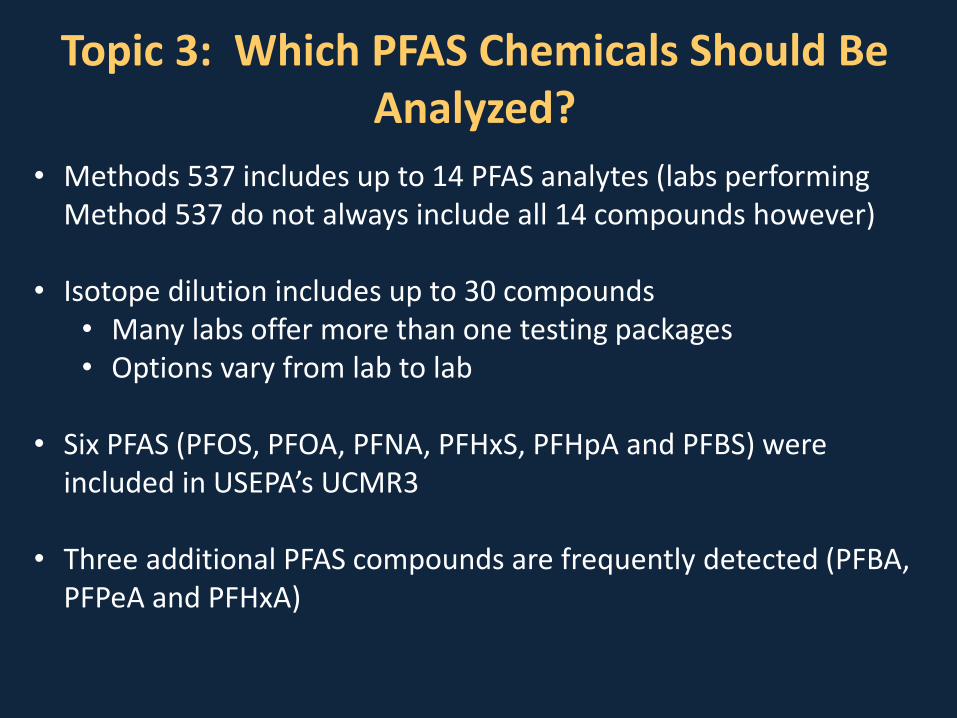
Topic 3: Which PFAS Chemicals Should Be
Analyzed?
• Methods 537 includes up to 14 PFAS analytes (labs performing
Method 537 do not always include all 14 compounds however)
• Isotope dilution includes up to 30 compounds
• Many labs offer more than one testing packages
• Options vary from lab to lab
• Six PFAS (PFOS, PFOA, PFNA, PFHxS, PFHpA and PFBS) were
included in USEPA’s UCMR3
• Three additional PFAS compounds are frequently detected (PFBA,
PFPeA and PFHxA)

Topic 3: Which PFAS Chemicals Should Be
Analyzed? (continued)
Benefits of using methods with an extended list of analytes
• Collect as much information as possible when sampling
• Assist with fingerprinting/segregating potential sources of
contamination
• Future health studies may be completed and guidelines issued
for additional PFAS compounds
• Some states are developing health guidelines using an additive
approach/summing up the concentration of up to five PFAS
compounds.
Challenges of using methods with an extended list of analytes
• The may be no health guidelines for some of the detected PFAS
• Cost per analysis may be higher
• More data processing and reporting
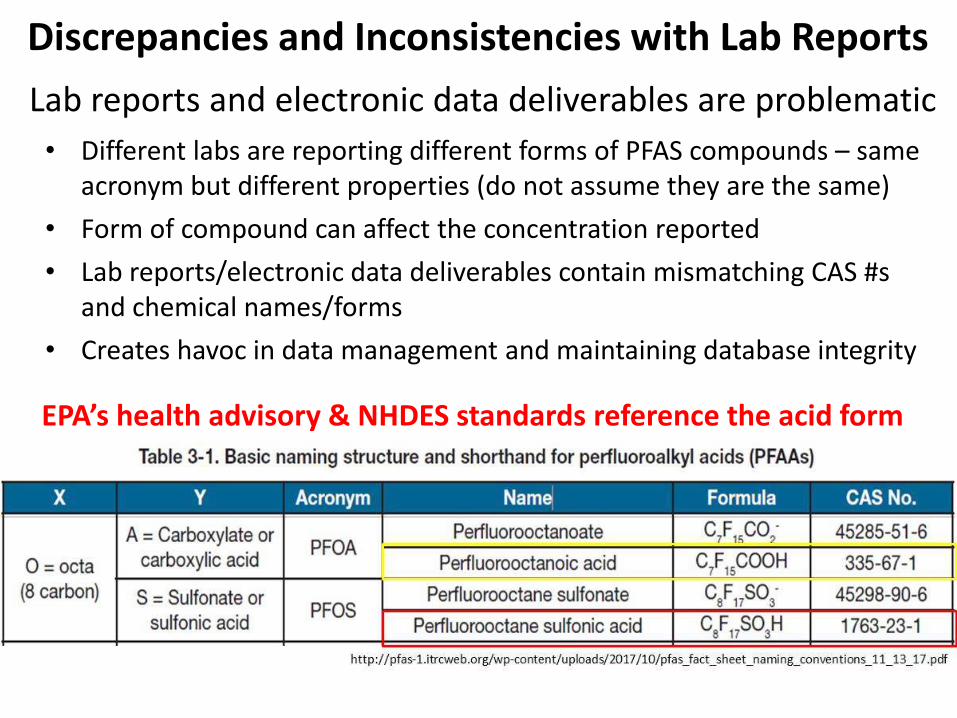
Lab reports and electronic data deliverables are problematic
Discrepancies and Inconsistencies with Lab Reports
• Different labs are reporting different forms of PFAS compounds – same
acronym but different properties (do not assume they are the same)
• Form of compound can affect the concentration reported
• Lab reports/electronic data deliverables contain mismatching CAS #s
and chemical names/forms
• Creates havoc in data management and maintaining database integrity
EPA’s health advisory & NHDES standards reference the acid form

Topic 4: What Reporting Limit Should Be Used?
• Reporting limits of at least 2-4 ng/L should be utilized
• Many labs performing isotope dilution achieve limits below
1 ng/L
• Method 537 has reporting limits ranging from 2.9-14 ng/L
• Benefits of low reporting limits
• Improve utility of the data in the event health advisories
are lowered and use an additive approach
• Track concentration trends
• Fingerprint source of contamination

Topic 5: Topic 5: Technical Issues that Cause
Variability in Testing Results
Linear and Branched Isomers
• Prior to September 2016, Method 537 did not specify if
branched isomers of PFOA should be measured and reported
(some labs included it & others did not)
• PFOA was produced by Dupont & 3M
• PFOA from Dupont contained only linear isomers of PFOA
• PFOA from 3M contained 70% linear & 30% branched
isomers
• Results from some samples analyzed prior to September 2016
may be underreported by 30% if contaminated with PFOA that
was manufactured by 3M
Topic 5: Topic 5: Technical Issues that Cause
Variability in Testing Results (continued)Expected Accuracy of Testing Results and Common Biases
Based on NHDES’ Experience
• Expected accuracy of analytical testing is +/-50% (higher
than data from UCMR3 because high reporting limits
were used)
• NHDES typically observed an accuracy of approximately
-20% (biased low)
• NHDES split sample studies generally showed
• Different labs reported similar results
• Method 537 & isotope dilution reported similar
results
• Occasional significant over reporting or under reporting
occurred

Topic 5: Topic 5: Technical Issues that Cause
Variability in Testing Results (continued)
• Standards do not exist for many PFAS with branched isomers –
labs estimate concentration using linear isomers
• Labs interpret branched isomers differently because the peaks on
the chromatograph are less pronounced
• Certified standard from different vendors can cause results to
vary by as much as 20%
ID Analyte Results Using Standard
“A” Calibration Curve
ppt
Results Using Standard
“B” Calibration Curve
ppt
1 PFOA 59 79
2 PFOA 104 132
3 PFOA 50 70
4 PFOA 49 63
5 PFOA 61 76
6 PFOA 54 73
7 PFOA 86 136

Topic 6: Sample Collection Procedures• Low detection limits combined with the widespread use of items
with PFAS increases the potential for sampling errors
• However, drinking water sampling agents and operators are
qualified to complete the sampling
• Sampling taps and plumbing should be free of materials containing
Teflon
• Samplers should wear well laundered cotton clothing without the
use of softeners
• Samplers should not wear cosmetics, moisturizers, hand cream
and related products
• Avoid the use of traditional weatherproof field books/paper
• Samplers should wash hands and wear nitrile gloves
• Field blanks and trip blanks should be periodically used – With
each batch of samples or some other predetermined frequency

Topic 7: Interpretation of Results• Compare results against USEPA’s health advisory or state
guidance – ITRC maintains a table of standards and
guidance values for other states and countries.
• The detection of low levels of PFAS do not mean there is
a major source of PFAS Contamination at low levels
could be associated with:
• Teflon in components of the plumbing system??
• Chemical feed tanks/tubing??
• Regional septic systems or other numerous and
dispersed uses and releases of PFAS.
• Lab blanks, trip blank, field blanks and duplicates are
especially important when assessing low-level
detections