Embed Size (px)
Citation preview

Pharmaceuticals and Personal Care Products in the Sacramento River
Final Report: Activities from May – June 2008
Prepared for the State Water Resources Control Board
By
Minta Schaefer Michael L. Johnson
Aquatic Ecosystems Analysis Laboratory Center for Watershed Sciences University of California, Davis
October 2009
TABLE OF CONTENTS
TABLE OF CONTENTS ...................................................................................................................................... 2 LIST OF TABLES ............................................................................................................................................... 2 LIST OF ACRONYMS ....................................................................................................................................... 3 EXECUTIVE SUMMARY ................................................................................................................................... 4 BACKGROUND ................................................................................................................................................ 5 INTRODUCTION .............................................................................................................................................. 7 MONITORING SITES ....................................................................................................................................... 7 FIELD METHODS ............................................................................................................................................. 8 CHEMICAL ANALYSES ..................................................................................................................................... 9 RESULTS AND DISCUSSION ............................................................................................................................ 9 REFERENCES ..................................................................................................................................................13 APPENDIX I: CHEMICAL ANALYSIS STANDARD OPERATING PROCEDURES .................................................14
CLEANING POCIS-POST DEPLOYMENT .....................................................................................................15 EXTRACTION OF POCIS ............................................................................................................................16 FILTRATION OF POCIS EXTRACT ..............................................................................................................18 PREPARATION OF SPMDS FOR DIALYSIS ...................................................................................................19 DIALYSIS OF SPMDS .................................................................................................................................21 DIALYSATE FILTRATION PRIOR TO GPC CLEAN-UP ..................................................................................24 GENERAL USE OF THE KUDERNA-DANISH CONCENTRATOR ......................................................................26 CALIBRATION PROCEDURES FOR GEL PERMEATION CHROMATOGRAPH ....................................................29 SYSTEMS GPC) AND SAMPLE EXTRACT CLEAN-UP ...................................................................................29 WPCL METHOD SUMMARY ......................................................................................................................40
LIST OF TABLES Table 1 Monitoring Station Summary ............................................................................................................ 7 Table 2 Deployment and Retrieval Summary ................................................................................................ 9 Table 3 Results of PPCP chemical analyses. .................................................................................................10

List of Acronyms AEAL Aquatic Ecosystems Analysis Laboratory CDFG California Department of Fish and Game cfs cubic feet per second COC Chain of Custody DL Detection Limit EPA Environmental Protection Agency mgd million gallons per day MDL Minimum Detection Limit NA Not Applicable ND Not Detected NPDES National Pollutant Discharge Elimination System pH Power of Hydrogen POCIS Polar Organic Chemical Integrated Sampler QA Quality Assurance QC Quality Control RL Reporting Limit SOP Standard Operating Procedure SPMD Semi-Permeable Membrane Device SRCSD Sacramento Regional County Sanitation District SRWTP Sacramento Regional Wastewater Treatment Plant SWRCB State Water Resources Control Board UCD University of California Davis USGS United States Geological Service

4
EXECUTIVE SUMMARY
A pilot study was conducted by the University of California, Davis (UCD) Aquatic Ecosystems Analysis Laboratory (AEAL) for the State Water Resources Control Board to evaluate the presence of pharmaceuticals and personal care products (PPCPs) in the Sacramento River. The pilot study included monitoring for PPCPs at four locations within the Sacramento River near the location where effluent is discharged from the Sacramento Regional Wastewater Treatment Plant (SRWTP). Passive sampling devices including polar organic contaminant integrated samplers (POCIS) and semi-permeable membrane devices (SMPDs) were used for the monitoring effort. The monitoring locations included one site upstream and three sites downstream of the treatment plant effluent discharge location. Caffeine, trimethoprim, sulfamethoxazole, gemfibrozil, fluoxetine, ibuprofen, carbamazepine, xylene, nonylphenol, and nonylphenol ethoxylates were detected at one or more monitoring site during this pilot study. Concentrations of detected PPCPs are consistent with those found in other monitoring studies. While PPCPs are recognized surface water pollutants, the ecological implication of the widespread presence of these contaminants is largely unknown. All of the compounds detected in the monitoring effort have been shown to have an adverse effect on one or more aquatic species. However, a thorough assessment of the chronic toxicity of any of these compounds or any other PPCP to aquatic organisms is not yet available. In addition to the general paucity of knowledge of this issue, information on the presence of PPCPs and effects on aquatic populations in the Bay-Delta system are extremely limited, the results of this pilot study suggest a need for further investigation in the Bay-Delta ecosystem.

5
BACKGROUND
Pharmaceuticals and personal care products (PPCPs) are recognized surface water pollutants, in widespread use worldwide, and can be found at trace levels in surface waters around the globe (Kolpin et al. 2002; Bendz et al. 2005; Kim et al. 2007). The organic pollutants classified as PPCPs include thousands of chemical compounds. The United States Environmental Protection Agency (USEPA) defines PPCPs as products that include prescription and over-the-counter therapeutic drugs, veterinary drugs, fragrances, cosmetics, sunscreen products, diagnostic agents (e.g., contrast agents used in magnetic resonance imaging and indicators in pregnancy tests), and nutraceuticals (e.g., vitamins and dietary supplements) (USEPA 2009). Biologically active metabolites and environmental degradation products of specific PPCPs are also included in the category. Naturally synthesized and excreted hormones and steroids are often grouped with PPCPs because of environmental concentrations comparable to their synthetic analogs and similar chemical behavior and effects on aquatic organisms (Routledge et al. 1998). Other organic contaminants are frequently studied along with PPCPs and originate from products such as flame retardants, surfactants, plasticizers, and pesticides although these compounds are not classified as PPCPs. The definition of PPCPs used in this report is (Petrovic 2007): .
“the universe of chemicals encompassed in the scope of PPCPs will be defined to include all chemicals used for humans, domestic animals, or agricultural crops that: (i) treat disease, (ii) alter or improve physiological, cosmetic, or emotional function, appearance, or status, (iii) prevent disease (prophylaxis) or maintain health, (iv) help in the diagnosis or monitoring of health or disease, or (v) serve to formulate the active ingredient into a commercial product (e.g., excipients and delivery vehicles). The scope includes all preparations intended for topical, pulmonary, or parenteral (injection) administration or ingestion, as well as suppositories and enemas. The obvious galaxies of chemicals in this universe are the diverse arrays of human and veterinary prescription and OTC medications. But others include diagnostic agents (e.g., X-ray contrast media, radiopharmaceuticals), vaccines, and ‘nutraceuticals’ (bioactive dietary supplements such as huperzine A and "functional foods) and food supplements (including vitamins)… Illicit drugs, in particular, comprise an unknown but possibly significant fraction of total drug usage, and consequently contribute to individual environmental residues and to the overall environmental loading of PPCPs”.
Wastewater treatment plant effluent is the most significant source for human
PPCPs and animal husbandry operations, including Concentrated Animal Feeding Operations (CAFOs) and factory farming, are the most important in terms of veterinary PPCP (Daughton and Ternes 1999; Brain et al. 2008). After ingestion by humans or animals, parent compounds and metabolites (products of reactions within the body) are

6
excreted through urine and feces and released into wastewater streams and septic systems or onto land associated with animal husbandry operations (Daughton and Ternes 1999). Runoff from animal husbandry operations carries PPCPs into receiving water bodies. In addition to excretion, PPCPs are disposed of by placing them into home plumbing systems. The relative contributions of excretion and disposal are unknown though it is expected that disposal is minor (Heberer 2002). Use within the general population rather than use within hospitals represents the primary origin of PPCPs in municipal wastewater (Kümmerer 2008). In the United States, general population use is reported to account for 75% of the municipal wastewater PPCP load and in the United Kingdom, the figure is reported as 70% (Kümmerer 2009). Bathing washes any topical PPCPs or compounds excreted in perspiration into waste streams. Existing wastewater treatment systems are not designed to remove PPCPs and a cost-effective treatment option is not currently available (Ternes 1999; Bolonga 2008). However, wastewater treatment processes can reduce the concentrations of some PPCPs to varying degrees.
The Sacramento Regional Wastewater Treatment Plant (SRWTP) is operated by
the Sacramento Regional County Sanitation District (SRCSD) and treats wastewater generated by a residential population of over one million in addition to commercial and industrial customers within a 368-square-mile area. Prior to discharge, wastewater is treated to secondary standards followed by chlorination and dechlorination. The SRWTP permitted discharge flow or permitted capacity is 181 million gallons per day (mgd) or 280.01 cubic feet per second (cfs). According to the 2020 Master Plan for the facility, in the year 2000, average flows were approximately 154 mgd and a planned expansion will increase capacity to 218 mgd by 2020. Effluent is discharged into the Sacramento River via a 400-foot diffuser located on the bed of the Sacramento River, perpendicular to flow, just south of the Freeport Bridge.

7
INTRODUCTION
The State Water Resources Control Board (SWRCB) executed a contract with the University of California, Davis (UCD) Aquatic Ecosystems Analysis Laboratory (AEAL) to conduct a pilot study to evaluate the presence of PPCPs in the Sacramento River. Four locations near the effluent of the SRWTP were evaluated using passive sampling devices. Polar organic contaminant integrated samplers (POCIS) and semi-permeable membrane devices (SMPDs) were used at each of the monitoring locations. The POCIS membranes are designed to sequester polar organic compounds while the SPMD membranes trap nonpolar, hydrophobic compounds. Most PPCPs are polar organic compounds. Extraction of compounds sequestered by the SPMDs is a proprietary patented process conducted by Environmental Sampling Technologies (EST) in St. Joseph, Missouri. Extraction of the compounds sequestered by the POCIS devices as well as the analysis of the extract from both types of passive samplers was conducted by the California Department of Fish and Game (CDFG) Water Pollution Control Laboratory (WPCL) in Rancho Cordova, California. MONITORING SITES
Four sites along the Sacramento River were selected based on distance from the SRWTP outfall and the locations regularly monitored by SRWTP staff to comply with National Pollutant Discharge Elimination System (NPDES) permit requirements (Table 1). The first site was used as a control and located at the southernmost portion of Freeport Marina. Freeport Marina is upstream of the Freeport Bridge along the east bank of the river and is approximately 100 meters upstream from the discharge point for treatment plant effluent. This is the control site used in NPDES monitoring by the SRWTP. The second site was approximately 30 feet from the west bank and 525 meters downstream from the effluent diffuser. Site three was at Cliff’s Marina, approximately 1,180 meters downstream of plant discharge. The second of two NPDES monitoring sites is at Cliff’s Marina. A private dock 1,900 meters downstream of the effluent at the east bank was the fourth site.
Table 1 Monitoring Station Summary
Site ID Site Name Latitude/Longitude 519RX001 Freeport Marina 38.45624/-121.50153 519RX002 West Bank 38.45051/-121.50234 519RX003 Cliff’s Marina RX 38.44461/-121.50108 519RX004 Private Dock 38.43851/-121.50447

8
FIELD METHODS
The POCIS and SMPDs were purchased from EST and stored at 20 °C prior to deployment. The devices may be stored prior to deployment at room temperature for up to one month or below 5 °C for one year. The devices remained in the sealed shipping containers, which contained argon gas, until deployment. During travel to the monitoring sites, the sealed shipping containers holding the devices were placed on ice.
Three POCIS and three SPMDs were deployed at each of the four monitoring
sites. At each site, the devices were contained within one cylindrical, 30 by 16 centimeter perforated metal canister. Deployment occurred on May 28, 2009 and the samplers were removed on June 29, 2009 (Table 2). As SPMDs are also vapor phase samplers, time exposed to air after removal from the shipping containers until they were submerged was minimized (Table 2). The canister at site 519RX001 was suspended into the water column via a cable looped around a U-bolt that attached the floating dock to a vertical piling at the southernmost portion of Freeport Marina. Sinker weights were attached to the end of an additional cable, which was affixed to the bottom of the canister. The canisters at sites 519RX003 and 519RX004 were suspended from a wing dam at Cliff’s Marina and a private dock, respectively, in the same manner as at site 519RX001. At site 519RX002, a 20-foot cable was attached below the water surface to the support structure of an irrigation pump located at the western river bank. This cable was attached to the top of the canister along with foam buoys. Another cable was attached to the bottom of the canister, extended to the river bed, and was kept in place by a 30-pound weight. Permission from the respective owners was obtained for all four sites before the devices were deployed.
The canisters were examined weekly during the monitoring period to ensure that
flow through the canister was unobstructed and theft, vandalism, or other physical damage had not occurred. The canisters at sites 519RX001, 003, and 004 were removed once weekly in order to check for physical damage to the devices and to remove any material that may have accumulated on the canister. Canisters were removed for no longer than 15 seconds and wiped with a small clean, towel to remove accumulated biofilm. The towel was dry and no materials from the towel could be transferred to the sampling devices. Very little biofilm was found on the canisters and no other material such as branches, floating algae, or trash were found attached to the canisters during any of the weekly visits. Due to access limitations, site 519RX002 was observed from the west bank of the Sacramento River adjacent to the site on a weekly basis. No physical damage was observed to any of the four canisters or sampling devices during the monitoring period. Upon removal, the devices were returned to the shipping containers and placed on ice for transport to the laboratories.

9
Table 2 Deployment and Retrieval Summary
Site ID Latitude/Longitude
Time Deployed on
5/28/09
Depth from Surface/River
Depth
SPMD Air Exposure
Time (mm:ss)
Time Retrieved
on 6/29/09 519RX001 38.45624/-121.50153 1:57 p.m. 4’8”/17’ 02:56 12:27 p.m. 519RX002 38.45051/-121.50234 12:32 p.m. 4’2”/10’ 06:01 10:52 a.m. 519RX003 38.44461/-121.50108 11:54 a.m. 6’6”/21’5” 05:27 11:25 a.m. 519RX004 38.43851/-121.50447 1:37 p.m. 4’1”/12’ 02:04 11:54 a.m.
CHEMICAL ANALYSES
After removal from the Sacramento River on June 29, the sampling devices were transported to WPCL or EST. The POCIS devices were placed on ice in the shipping containers and transported to the WPCL in Rancho Cordova on June 29. The SPMD devices were placed on ice and shipped in a Styrofoam cooler on June 29 via overnight delivery to EST in St. Joseph, Missouri. The cooler was received by EST on June 30, 2009. Sequestered compounds were extracted from the SPMD membranes by EST according to the Standard Operating Procedures (SOP) provided in Appendix II. The SPMD extract for each site and one dialysis blank ampoule were shipped to the UCD campus and received on July 14, 2009. The SPMD extract was then transported to the WPCL in Rancho Cordova on July 14, 2009. A chain of custody (COC) form was used to document the transfer of the devices and extract between parties.
The POCIS and SPMD extract was analyzed for widely used PPCPs, many of which
have been found in other monitoring studies. These included antibiotics, a lipid regulator, an anti-inflammatory, a selective serotonin reuptake inhibitor (SSRI), a natural estrogen hormone, an anti-epileptic, caffeine, an anti-bacterial, and polycyclic musks. The samples were also tested for two surfactant compounds. Analyses were conducted by the WPCL. Appendix I includes SOPs for the analytical processes used. The analyses were not exhaustive in that numerous additional compounds could have been included in the analyses. RESULTS AND DISCUSSION
None of the analytes were detected in the POCIS or SPMD membranes at site 519RX001 (Table 3), the site upstream of the discharge location. Caffeine, trimethoprim, sulfamethoxazole, gemfibrozil, fluoxetine, and xylene were detected at site 519RX002. The passive samplers at site 519RX003 sequestered trimethoprim, sulfamethoxazole, ibuprofen, carbamazepine, fluoxetine, nonylphenol, and nonylphenol ethoxylates. Trimethoprim, sulfamethoxazole, gemfibrozil, carbamazepine, fluoxetine, xylene, nonylphenol, and nonylphenol ethoxylates were found at site 519RX004.

10
Table 3 Results of PPCP chemical analyses.
POCIS Analyte
Method Detection
Limit (µg/L)
Reporting Limit (µg/L)
Concentration (µg/L) Site ID
519RX001 519RX002 519RX003 519RX004 Caffeine (stimulant) 0.020 0.050 ND 7.50 ND ND Carbadox (antibiotic) 0.002 0.005 ND ND ND ND Sulfathiazole (antibiotic) 0.010 0.020 ND ND ND ND Lincomycin (antibiotic) 0.020 0.050 ND ND ND ND Sulfamerazine (antibiotic) 0.005 0.010 ND ND ND ND Sulfamethizole (antibiotic) 0.005 0.010 ND ND ND ND Sulfamethazine (antibiotic) 0.005 0.010 ND ND ND ND Trimethoprim (antibiotic) 0.002 0.005 ND 2.00 28.3 26.3 Sulfachloropyridazine (antibiotic) 0.005 0.010 ND ND ND ND Sulfamethoxazole (antibiotic) 0.005 0.010 ND 5.92 13.0 13.0 Sulfadimethoxine (antibiotic) 0.002 0.005 ND ND ND ND Tylosin (antibiotic) 0.050 0.100 ND ND ND ND Roxithromycin (antibiotic) 0.050 0.100 ND ND ND ND Erythromycin hydrate (antibiotic metabolite) 0.005 0.010 ND ND ND ND Gemfibrozil (lipid regulator) 0.002 0.005 ND 19.3 ND 214 Ibuprofen (non-steroidal antiinflammatory) 0.020 0.050 ND ND 182 ND Triclosan (antibacterial) 0.020 0.050 ND ND ND ND Chlorotetracycline (antibiotic) 0.010 0.020 ND ND ND ND Doxycycline (antibiotic) 0.010 0.020 ND ND ND ND Oxytetracycline (antibiotic) 0.010 0.020 ND ND ND ND Tetracycline (antibiotic) 0.010 0.020 ND ND ND ND 17β-estradiol (natural hormone) 0.100 0.200 ND ND ND ND Carbamazepine (antiepileptic) 0.005 0.010 ND ND 45.6 43.2 Fluoxetine (antidepressant) 0.005 0.010 ND 17.6 20.8 20.8 Ambretta (polycyclic musk) 0.200 0.500 ND ND ND ND Ketone (polycyclic musk) 0.020 0.050 ND ND ND ND Moskene (polycyclic 0.050 0.100 ND ND ND ND

11
POCIS Analyte
Method Detection
Limit (µg/L)
Reporting Limit (µg/L)
Concentration (µg/L) Site ID
519RX001 519RX002 519RX003 519RX004 musk) Xylene (polycyclic musk) 0.100 0.200 ND 1140 ND 100 Nonylphenol (surfactant) 0.500 2.00 ND ND 160 68.5 Nonylphenol Ethoxylates (surfactant) 0.500 2.00 ND ND 800 730
SPMD Analyte
Ambretta (polycyclic musk) 0.200 0.500 ND ND ND ND Ketone (polycyclic musk) 0.020 0.050 ND ND ND ND Moskene (polycyclic musk) 0.050 0.100 ND ND ND ND Xylene (polycyclic musk) 0.100 0.200 ND ND ND ND Nonylphenol (surfactant) 0.500 2.00 ND ND ND ND Nonylphenol Ethoxylates (surfactant) 0.500 2.00 ND ND ND ND µg/L – micrograms per liter ND – not detected
Caffeine, trimethoprim, sulfamethoxazole, gemfibrozil, fluoxetine, ibuprofen, carbamazepine, xylene, nonylphenol, and nonylphenol ethoxylates were detected at one or more monitoring site during this pilot study. A literature review accompanies this report and is titled Pharmaceuticals and Personal Care Products in Surface Water – Occurrence, Fate and Transport, and Effect on Aquatic Organisms. A section of the literature review summarizes what is known about PPCPs in the Bay-Delta system. As described in that document, concentrations of detected PPCPs are consistent with those found in other monitoring studies. Very little is known about the effects of PPCPs on aquatic organisms and ecosystems and even less information is available for the Bay-Delta system. In brief, studies have demonstrated that antibiotics such as trimethoprim and sulfamethoxazole can impact algae and zooplankton populations; gemfibrozil has been found to bioaccumulate in fish though experiments used concentrations greater than those detected in monitoring studies; fluoxetine may also bioaccumulate in fish and result in decreased activity in fish and freshwater crustaceans; ibuprofen resulted in decreased activity in the freshwater crustacean Gammarus pulex in one study and inhibited enzyme function in Japanese medaka (Oryzias latipes); another drug in the same class as ibuprofen (non-steroidal anti-inflammatory), diclofenac has been shown to illicit liver, gill, and kidney cytopathology in rainbow trout (Oncorhynchus mykiss); carbamzepine is very persistent in surface waters and in one study caused decreased survival of the midge Chironomus riparius though the doses used exceeded

12
environmentally relevant concentrations (Oetken 2005); and, finally, polycyclic musks such as xylene and surfactants have demonstrated adverse effects to aquatic organisms though available studies did not utilize environmentally relevant concentrations. None of the studies that led to these summarized findings were conducted in or related to the Bay-Delta ecosystem. Several questions remain unanswered. First, many studies on the “toxicity” of these compounds on aquatic organisms use mortality as an endpoint. Although there are some data available for chronic effects, in general it is not known whether the concentrations of PPCPs found in this study can result in effects on aquatic organisms, and there is virtually no information available for effects on species in the Delta. It is possible that compounds such as antibiotics could have effects on the bacterial and phytoplankton community in the Delta given their demonstrated effects in laboratory studies. Second, the monitoring locations used in this study were immediately downstream of the SRWTP when compared to the size of the entire Delta. However, other WWTP do exist in the Delta and it is unclear how the concentrations of these compounds are distributed across the Delta in time and space. As a result, it is unclear if the compounds measured in this pilot study are at concentrations capable of causing chronic effects to aquatic organisms in the Delta.

13
REFERENCES Bendz, D., N. A. Paxeus, et al. (2005). "Occurrence and fate of pharmaceutically active
compounds in the environment, a case study: Hoje River in Sweden." Journal of Hazardous Materials 122(3): 195-204.
Brain, R. A., M. L. Hanson, et al. (2008). Aquatic plants exposed to pharmaceuticals: Effects and risks. Reviews of Environmental Contamination and Toxicology, Vol 192. 192: 67-115.
Bolonga, N., A.F. Ismaila, M.R. Salimb, T. Matsuurad (2008). "A review of the effects of emerging contaminants in wastewater and options for their removal." Desalination 239: 229-246.
Daughton, C. G. and T. A. Ternes (1999). "Pharmaceuticals and personal care products in the environment: Agents of subtle change?" Environmental Health Perspectives 107: 907-938.
Heberer, T. (2002). "Occurrence, fate, and removal of pharmaceutical residues in the aquatic environment: a review of recent research data." Toxicology Letters 131(1-2): 5-17.
Kim, S. D., J. Cho, et al. (2007). "Occurrence and removal of pharmaceuticals and endocrine disruptors in South Korean surface, drinking, and waste waters." Water Research 41(5): 1013-1021.
Kolpin, D. W., E. T. Furlong, et al. (2002). "Pharmaceuticals, hormones, and other organic wastewater contaminants in US streams, 1999-2000: A national reconnaissance." Environmental Science & Technology 36(6): 1202-1211.
Kümmerer, K. (2001). "Drugs in the environment: emission of drugs, diagnostic aids and disinfectants into wastewater by hospitals in relation to other sources - a review." Chemosphere 45(6-7): 957-969.
Kümmerer, K. (2009). "Antibiotics in the aquatic environment - A review - Part I." Chemosphere 75(4): 417-434.
Petrovic, M., Barcelo, Damia Eds. (2007). Analysis, Fate and Removal of Pharmaceuticals in the Water Cycle, 50. Comprehensive Analytical Chemistry. Amsterdam, Elsevier Science.
Routledge, E. J., D. Sheahan, et al. (1998). "Identification of estrogenic chemicals in STW effluent. 2. In vivo responses in trout and roach." Environmental Science & Technology 32(11): 1559-1565.
Ternes, T. (1999). "Preface - Drugs and hormones as pollutants of the aquatic environment: determination and ecotoxicological impacts." Science of the Total Environment 225(1-2): 1-2.
USEPA. (2009). "Pharmaceuticals and Personal Care Products, Basic Information." Retrieved 10 June 2009, 2009, from http://www.epa.gov/ppcp/

14
APPENDIX I: CHEMICAL ANALYSIS STANDARD OPERATING PROCEDURES

15
SOP E-51
Standard Operating Procedure
Cleaning POCIS-Post Deployment
OBJECTIVE To describe the procedure for cleaning the POCIS sampler of debris collected
during deployment in preparation for extraction SCOPE This procedure applies to all POCIS projects received at EST Lab. RESPONSIBILITIES Management and/or laboratory staff who perform the cleanup of POCIS
received at EST Lab must adhere to these guidelines MATERIALS -Metal pan -Soft bristled brush -Tap water -Solvent rinsed aluminum foil PROCEDURE
A. Fill pan with contaminant-free water. Gently swish device in water to remove loose debris. Use a soft brush to clean bolts and wing nuts. Use caution to avoid touching the membrane surface as it could compromise the membrane. The cleaning procedure’s purpose is to remove any material that could potentially fall into the column while rinsing out the sequestration medium.
B. Place POCIS on methanol rinsed foil until ready for the extraction phase.
PAGE 1 OF 1 PAGES

16
SOP E-52 Standard Operating Procedure
Extraction of POCIS
OBJECTIVE
To describe the procedure for extracting the sequestration medium from the POCIS in preparation for enrichment and analyses
SCOPE
This procedure applies to all POCIS projects received at EST Lab.
RESPONSIBILITIES
Management and/or laboratory staff who perform extraction of the POCIS received at EST Lab must adhere to these guidelines
MATERIALS
-Chromatography column(s) 1cm i.d. and 120mL reservoir -Stopcock assembly with glass tip and viton “o” rings -Column holder -Glass wool -Long glass rod -Methanol (Pesticide or nanograde) -Methanol in wash bottle -Toluene -Methylene Chloride -125mL flat bottom flask -Funnel -Tweezers -Gloves -Solvent rinsed aluminum foil
PAGE 1 OF 2 PAGES

17
SOP E-52 PROCEDURE A. Cover work area with solvent rinsed aluminum foil. B. Fit stopcock to chromatography column and, using glass rod, firmly seat a plug of
glass wool (1-2cm) on top of the stopcock. Place chromatography columns (one per POCIS) in holder, add funnel, and rinse column with Methanol. Allow to drain into a beaker and discard waste. Place 125mL flat bottom flask under column. C. Using gloves, hold the POCIS horizontally to remove the hardware. D. Hold POCIS over the funnel and separate the washers. E. Use tweezers to separate the membranes and wash the sequestration medium
into the column with the wash bottle of Methanol. Rinse the funnel with Methanol. (The rinse portion is not included in the amount of extraction solvent used). Add another plug of glass wool to top of sample to prevent it from washing up the sides of the column when adding the extraction solvent (s).
F. Extraction of OASIS HLB (pharmaceuticals) is done with 40mL Methanol. G. Extraction of SX-3Ambersorb/Isolute ENV+(pesticides, hormones) is done with
50mL of 1:1:8 Methanol:Toluene:Methylene Chloride. H. Close stopcock and add appropriate solvent(s). Open stopcock and allow extract
to drip at a slow but steady rate into the 125mL flask. I. Roto-vap or evaporate (over UHP nitrogen) the extract to a volume of 1 to2mL
and filter through glass fiber filter paper using Methanol as the transfer solvent.
PAGE 2 OF 2 PAGES

18
SOP E-53
Standard Operating Procedure
Filtration of POCIS Extract OBJECTIVE To describe the procedure for filtering the POCIS extract. SCOPE This procedure applies to all POCIS projects received at EST Lab. RESPONSIBILITIES Management and/or laboratory staff who perform filtration of POCIS extract
must adhere to these guidelines. MATERIALS -Baked 9" Pasteur Pipets -Fisher G6 glass fiber filter paper (5mm squares) -Scissors and tweezers (solvent rinsed) -Wire or glass rod capable of seating the filter paper (solvent rinsed) -Screw top test tubes -Test tube rack -Pasteur pipet holder PROCEDURE A. Put filter paper into pipet with tweezers and seat gently with rod or wire. B. Place pipets into holder with a labeled test tube under each one to collect the sample. C. Wet filter paper with Methanol, and quantitatively transfer sample to filter pipet using Methanol, or other suitable solvent, as the transfer solvent. D. Rinse several times with transfer solvent and add rinse to filter pipet. E. Allow to filter completely then add about 0.5mL transfer solvent to filter as the final rinse.
PAGE 1 OF 1 PAGES

19
SOP E-14
Standard Operating Procedure
Preparation of SPMDs for Dialysis
OBJECTIVE
To describe the procedure used when SPMDs are received for the field or laboratory exposures.
SCOPE
This SOP describes the procedures for the clean-up and preparation of SPMDs for dialysis after they have been client-deployed or laboratory exposed.
RESPONSIBILITIES
All EST Personnel involved in the analysis and quality control of SPMDs must adhere to these procedures.
EQUIPMENT/SUPPLIES
- Flat stainless steel tray S Clean brush (toothbrush) S 1 N Hydrochloric Acid in 800 mL beaker S Rinse bottle of Acetone S Rinse bottle of IPA S Tap water S SPMD Pre-dialysis Condition Sheet
1. PROCEDURE
2. For SPMDs on Spider Carriers
1. Fill out the necessary information on the SPMD Pre-dialysis
Condition Sheet. Transfer any markings from the outside of the shipping can to the sheet.
PAGE 1 OF 3 PAGES

20
SOP E-14
2. Open the shipping containers (cans, etc.) With the filed deployed SPMD Spider Carriers. Carefully remove the carriers, rinse the strips with free flowing tap water.
1. Inspect each membrane carefully for holes or abraded areas.
Note which membranes have holes on the Pre-dialysis Condition Sheet.
b. Carefully unhook the membrane and unwind it from the posts. Be
sure to re-inspect for holes and abrasions. Note any found on Pre-dialysis Condition Sheet and place heat seals as close as possible to either side of the holes.
3. Place the SPMDs in the flat stainless steel tray. Use tap water and a clean
brush to remove all surface bacteria, algae, sediment, inorganic salts, and other material. If the SPMDs have additional seals or loops outside the lipid containment (end) seals, cut them off and discard. (This portion of the sampler is usually covered with biofouling that cannot easily be removed.)
4. Drain the water off the SPMDs and swirl them in a beaker containing
hexane rinsed with1 N hydrochloric acid for about 30 seconds. The preparation of 1N HCl is as follows:
1. Add 33 mL [HCl] to 400 mL water in the separatory funnel.
2. Rinse three times with 200 mL hexane
5. Thoroughly rinse the SPMDs with tap water to remove the acid.
6. Remove all surface water from SPMD using two fingers then rinse with
acetone followed by IPA.
7. With dry hands, slide the membrane between index and middle fingers, wringing off all excess solvent. Allow to dry. Proceed to SOP E-15 ADialysis of SPMDs@.
PAGE 2 OF 2 PAGES

21
SOP E-15
Standard Operating Procedure
Dialysis of SPMDs
OBJECTIVE
To describe the procedures for setting up and executing an SPMD dialysis. SCOPE
This SOP applies to the dialysis of any length or width of SPMD and is standard for all operations.
RESPONSIBILITIES
All EST personnel involved in the analysis and quality control of SPMDs must adhere to this SOP.
EQUIPMENT/SUPPLIES
S Canning jars or other suitable glass containers and screw-type lids S Aluminum foil (hexane rinsed) S Optima grade hexane S Graduated cylinder S 18 C incubator S Labels
PROCEDURES
1. Sample Set-up and Procedure
1. Obtain clean, annealed canning jars or other clean glass jars that have screw-type lids. These containers should be cleaned as per SOP E-9 and solvent rinsed with hexane. Aluminum foil for under lids should likewise be rinsed. The lids should form a tight seal. (Make sure the rubber ring on the cap is facing upwards.
PAGE 1 OF 3 PAGES

22
SOP E-15
1. The volume of the jar or container should be as small as possible but still allow headspace above the solvent dialysate.
2. There should be only one SPMD per container of dialysate
3. The amount of solvent used should be no less than 125 mL per SPMD.
Make sure the solvent covers the entire SPMD. Note the amount of solvent used on the Pre-dialysis Condition Sheet.
4. Wash hands thoroughly using dishwashing detergent
5. Coil or loop the SPMD and place in jar so that the edge lies flat on the
bottom. Keep in mind that the SPMD mut be submerged in the solvent and cannot be sticking out above the solvent. Therefore take care when coiling or looping to insure this. Use solvent rinsed tongs to place in jar if necessary.
6. Pour the solvent in carefully making sure that the membrane is not
moved as to float out of the solvent. A small watch glass may be needed to hold the SPMD down.
7. Place the solvent rinsed aluminum foil on the jar and screw the lids down
tight.
8. Label the jars and carefully place in 18C incubator for 18 hours.
9. Label another set of dialysis jars and pour the dialysate into the empty jar refilling the original jar with the same amount of hexane. Cap second set of jars as per #7 and put both jars back into the 18C incubator for another 8 hours.
10. Using solvent rinsed tongs, at the end of the second incubation period,
remove the SPMD and rinse with hexanes into the dialysate jar. Discard the SPMD and return jars to incubator until ready to concentrate.
PAGE 2 OF 3 PAGES

23
SOP E-15
2. Controls
1. Prepare as in SOP E-12, a fresh SPMD for dialysis blank and set up dialysis
as above for samples. This determines background for a fresh SPMD.
2. A process blank should also be set up, this consists of a volume of solvent equivalent to that used for the samples, but with no SPMD. This will be processed equivalent to the samples. This will determine the background contamination through the whole procedure.
3. Based on client desires, spiked SPMDs may be prepared and dialyzed.
Spiking solutions may be in-house or customer supplied and are performed as per SOP E-31, and treated the same as the samples.
PAGE 3 OF 3 PAGES

24
SOP E-21
Standard Operating Procedure
Dialysate Filtration Prior to GPC Clean-up
OBJECTIVE
To outline the steps taken to filter the dialysates after dialysis. SCOPE
This SOP defines the filtration of particles (dust, dirt, sediment, mineral deposits, dander, etc.) from the extracts before further processing.
RESPONSIBILITIES
All EST personnel involved in SPMD processing and analysis must adhere to these procedures.
EQUIPMENT/SUPPLIES
S pasteur pipets S glass fiber filters (Fisher G6) S optima grade hexane or optima grade methylene chloride
PROCEDURE
1. Transfer and Concentration of SPMD Dialysate
1. After second dialysis, the membranes are removed, with solvent-washed tongs, from their jars and discarded.
2. The dialysate is quantitatively transferred, using a minimum of
three hexane rinses, to a 500mL K-D flask and concentrated according to SOP E-44.
PAGE 1 OF 2 PAGES

25
SOP E-21
3. After the sample is concentrated to around 15mL in the concentrator
tube it is further evaporated according to SOP E-33.
4. When the dialysate is at a 0.5 to 1.0mL volume it is ready to filter.
2. Insert a small piece of glass fiber filter into a disposable pasteur pipet, and tap down with a long, solvent rinsed piece of wire. Pre-rinse this Acolumn@ several times with methylene chloride if the sample is to undergo GPC and hexane if it is to be ampulated.
3. Carefully (DO NOT drip any of the sample while it is concentrated in a small
volume) transfer the sample to the filter and allow it to drain until it stops.
4. Rinse the flask carefully with one to two mL of solvent and filter this wash through the column. Repeat this wash a minimum of three times.
5. Use only one filter Acolumn@ per sample.
6. Proceed, if necessary, to the GPC (SOP E-19) if this is requested by the client. If
GPC is not requested and the sample is to be ampulated for analysis elsewhere proceed to SOP E-32.
PAGE 2 OF 2 PAGES
26
SOP E-44
Standard Operating Procedure
General Use of the Kuderna-Danish Concentrator
OBJECTIVE
To outline the steps for general evaporating of samples using the K-D concentrator. SCOPE
This SOP details the steps for reducing the volume of samples by evaporation, utilizing the Kuderna-Danish concentrator at EST. RESPONSIBILITIES
All EST personnel involved in the preparation, fractionation, or analysis of samples must adhere to these procedures. EQUIPMENT/SUPPLIES
-- Kuderna-Danish 500 mL flask
-- 15 mL concentrator tube
-- Snyder tube ( Supelco Lot 031198 64693-U or equivalent) --Joint clasp
--Glass bead or broken pieces of pasteur pipette (boil easer)
PAGE 1 OF 3 PAGES

27
--Ring stand with clamp suitable to hold K-D flask
--Hot water bath
--Foil sleeve (for conserving heat)
--Hexane for rinsing glassware EQUIPMENT/SUPPLIES CONTINUED
--Glass funnel
--Thermometer PROCEDURE
A. Set Up
1. Rinse K-D flask with hexane (over waste container) and attach to clamp on ring stand.
2. Rinse 15 mL concentrator tube with hexane (over waste container) and attach
to K-D flask using a slight twisting motion to assure stability. Apply a joint clasp for added security.
3. Drop in one glass bead or small amount of broken pasteur pipette as a boil easer.
4. Rinse glass funnel with hexane (over waste container) and use to add sample to the K-D flask. Taking care to quantitatively transfer all the sample. Rinse down edge of sample flask, funnel and funnel stem into K-D flask.
5. Rinse Snyder tube with hexane (over waste container) and put on top of K-D flask.
PAGE 2 OF 3 PAGES
28
B. Evaporation
1. Put apparatus into hot water bath keeping water level below the clamp level
and the concentrator tube about five millimeter from the bottom of the bath. Wrap the apparatus in foil to conserve heat. Do not let the temperature rise above 70 ⁰C.
2. Allow sample to evaporate to about 1 mL. Quickly remove from heat and rinse apparatus through the snyder tube, using a swirling motion, with hexane.
3. Remove the joint clasp and remove the water condensation from the joint of the K-Dflask and concentrator tube. Remove tube and rinse end of K-D flask with hexane into the concentrator tube. This sample must now be concentrated further using nitrogen gas. (See SOP E-33)
PAGE 3 OF 3 PAGES

29
SOP E-19
Standard Operating Procedure
Calibration Procedures for Gel Permeation Chromatograph Systems GPC) and sample Extract Clean-up
OBJECTIVE
To describe the procedures used for the calibration and sample clean-up using the GPC system at EST Labs.
SCOPE
A calibration sample must be run at the beginning of each GPC clean-up. This calibration chromatogram is the basis for deter- mining fraction collection and dump times.
RESPONSIBILITIES
All EST personnel who are engaged in the GPC clean-up of samples must perform this calibration procedure.
EQUIPMENT/SUPPLIES
B GPC Calibration Log Sheet (Attachment I) B HPLC Pump: SSI Model 300 B Autosampler: Alcott 718 B Fraction Collector: Foxy II B UV HPLC Detector: Applied Biosystems 759A B Recorder: Varian Model 4290
PAGE 1 OF 11 PAGES

30
SOP E-19
EQUIPMENT/SUPPLIES
-- Size Exclusion/GPC Columns: a. 7.8mm ID x 50mm phenogel guard column b. 300mm x 21.20mm phenogel 10μm 100A column
-- Mobile Phase: Methylene Chloride + 2% MeOH -- Calibration Solution: 100mL methylene chloride solution containing:
82.00μg/mL DEHP (dioctyl phthalate) 3.78μg/mL Biphenyl 18.75μg/mL Coronene 16.50μg/mL Naphthalene 0.0021g/100mL Sulfur
PROCEDURE
1. All sample preparations should be quantitatively transferred to conical auotsampler vials using methylene chloride as the solvent, and the volume adjusted to 1.25mL.
2. When ready to begin, turn on the detector, pump and the
recorder so that they will warm up. The detector range (A.U.F.S.) setting should be 2.048.
3. Set flow rate at 3.0mL/minute. CAUTION: The system pressure should never be above 1000 psi. Change frit in guard column if pressure is high.
PAGE 2 OF 11 PAGES

31
SOP E-19
4. Load an autosampler vial with the calibration solution. Place the vial in the number one position of the carousel. (Do not use foam vial support with flat bottom vial.)
5. Check the detector absorbence meter if stable at 0.033 (or close to). 6. Program the autosampler to make one injection from the number
one position (method 2). Program the autosampler as follows:
1. On/Off switch is at the rear of the instrument on the left side. Press switch to turn instrument on.
2. Press FUNCTION button on front of autosampler, then press #7-(METHOD)
3. Use the 9(DOWN) arrow key to move indicator arrow (6) to ARun Method@ and push the <ENTER> button.
4. Screen will read AEnter Method # ___. Press #2 button to enter method #2 and press <ENTER> key.
5. Method #2 parametersBto access parameters press
FUNCTION button then #7(METHOD). Indicator arrow (6) should be pointing at AEdit@ (use arrow keys to move it to
Aedit@.
PAGE 3 OF 11 PAGES

32
SOP E-19
Press <ENTER> button. Screen will read AStep #1", use arrow keys to move screen.
a. Start Vial #1 b. End Vial #1 c. Standard vial NONE d. Injections 1 1. Injection volume 250μL f. Run Time 30 minutes g. Event Time 1-2-3 all 0.0 h. Rinse vial NONE i. Another Step? Push Aclear@ button for ANO@.
6. Editing Injection parametersBput indicator arrow to Aedit@ press
<ENTER> button. a. Injection type PARTial b. Fill Rate 20 c. Delay Time 10 d. Needle Depth 29 e. Pre-Injection volume 5 f. Pre-Air Volume 10 g. Withdraw Volume 250 h. Post-air Volume 10 i. Rinse Strokes 1 j. Rinse Rate 100 k. Exit <ENTER>
7. Pressing FUNCTION button and CLEAR button will return you
to first screen.
PAGE 4 OF 11 PAGES

33
SOP E-19
8. To run calibration sample press FUNCTION then #7 (METHOD) use arrow key to put indicator arrow () on ARUN@ and push the <ENTER> button. Enter the number A2" for the method number
and push <ENTER>. The autosampler will automatically begin the injection. The needle will go into the injection port and release the sample into the injection loop. When it has completed this you will hear a short buzz as the loop is closed. Immediately upon hearing this press the AINJ A@ button on the integrator. CAUTION: do not press too long on this button as it also shuts off the integrator and will do so if held too long.
9. Wait for the five peaks to elute completely, then stop the chart
and remove the chromatogram. Sign and date the chromatogram.
10. Transfer the retention time of the DEHP peak (first peak out) and
the retention time of the Biphenyl peak (second peak out) to their respective lines on the GPC Calibration Log Sheet (see Attachment I). Do the same for the Coronene peak (fourth peak out) and the
sulfur peak (fifth peak out). Line A of the GPC Calibration Log Sheet is obtained by subtracting the Biphenyl peak retention time from the DEHP retention time and multiplying by 0.4. This gives a point 40% of the distance between the DEHP and Biphenyl peaks. Line B is obtained by subtracting the Coronene retention time from the sulfur retention time and multiplying by 0.7. The time of the collection window is now in tenths of a minute and must be changed to minutes and seconds for the Foxy Fraction Collector. To do this, multiply the tenths of seconds by 60 to convert to seconds. Enter the seconds from line A on line C and from line B on line D. Subtract line C from line D to obtain the total dump time. Change the tenths of minutes to seconds by multiplying by sixty and record this number on the GPC Calibration Log sheet.
PAGE 5 OF 11 PAGES

34
SOP E-19
11. Programming the Foxy 200 Fraction Collector
1. Turn the system on.
2. Put the required number of test tubes in the rack. The numbering order is as follows: first row, 1-6 runs left to right; second row, 7-12 runs right to left; third row, 13-18
runs left to right; fourth row, 19-24 runs right to left; et al. The rack will hold 36 test tubes.
3. The first LCD screen will look like this:
Run A Edit A Load Quick Review
Signify that editing program A by pushing Key B (The letter located immediately beneath Edit A.)
The LCD screen will then look like this:
Time/Drop/Vol Peak Delay Page 2
(The Time/Drop/Vol and the Peak will be flashing). Push the A Key (under Time/Drop/Vol) because the fraction will be collecting by time.
The LCD screen will then look like this:
Time Drop Volume 4 Column Push the A Key (underneath the flashing Time) to signify collection to be done by time.
PAGE 6 OF 11 PAGES

35
SOP E-19
Next, the screen will read:
Will you use time windows/peak detection in the
program?
In response, signify yes (for time windows) by pressing D (underneath the flashing YES).
The LCD will then show this:
Programming for: (Press A or C keys) Rack 1 (Front Rack) Rack 2 (Back Rack)
Press A to signify use of the front rack.
The screen will then read:
Rack 1 (Front Rack) Select and Enter
Tube size: 25/28mm 36 tubes
The screen will now read:
Peak = Rack 1 Nonpeak = Drain
Press <enter> If these options are not shown, press A until they appear, then press <enter>
The LCD will display:
PAGE 7 OF 11 PAGES

36
SOP E-19
Enter Peak Fraction size for Rack 1
_:_ _ (hrs:min:sec) Enter line E of the GPC Calibration Log Sheet <enter> The LCD will now display: Time/Drop/Vol Peak Delay Page 2 Press B to indicate that the Apeak@ is to be collected The screen will now read: Press A to select peak detection mode Mode: Time windows only Press <enter>. If the screen shows a peak detection
mode other than Time windows only, press A until it does, then press <enter>.
The screen will now read: Window 1 _:_ _ to _ _:_ _ Exit
Initially, the first numbers will be flashing. Press <enter> if they are correct or overwrite them (line C of the GPC Calibration Log Sheet) and press <enter>, if needed. Now, the second set of numbers will be flashing. Press <enter> if they are correct or overwrite them ( line D of the GPC Calibration Log Sheet) then press <enter>.
PAGE 8 OF 11 PAGES
37
SOP E-19
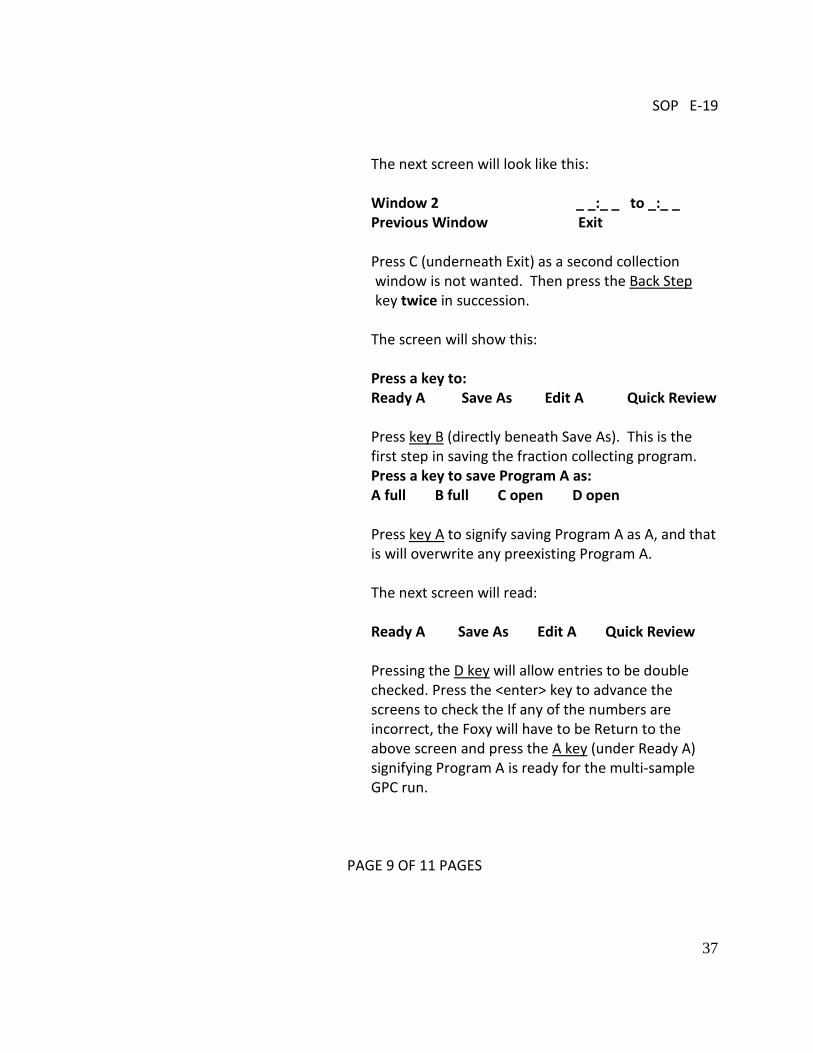
The next screen will look like this: Window 2 _ _:_ _ to _:_ _ Previous Window Exit Press C (underneath Exit) as a second collection window is not wanted. Then press the Back Step key twice in succession.
The screen will show this: Press a key to: Ready A Save As Edit A Quick Review Press key B (directly beneath Save As). This is the first step in saving the fraction collecting program. Press a key to save Program A as: A full B full C open D open Press key A to signify saving Program A as A, and that is will overwrite any preexisting Program A. The next screen will read: Ready A Save As Edit A Quick Review Pressing the D key will allow entries to be double checked. Press the <enter> key to advance the screens to check the If any of the numbers are incorrect, the Foxy will have to be Return to the above screen and press the A key (under Ready A) signifying Program A is ready for the multi-sample GPC run.
PAGE 9 OF 11 PAGES

38
SOP E-19
The screen will look like this: Ready Press a key to: Run A Edit A Load Quick Review Press A key to run fraction collector Program A. The Foxy 200 faction collector will, at that point,only be waiting for the ISS-200 to electronically signal that the first sample has been injected to begin Program A. (The fraction collector clock will begin with the first auto injection, and will be reset after the fraction collector=s total run time has elapsed. The fraction collector timing function will begin again with every subsequent auto injection).
12. Beginning Multiple Sample Clean-up
1. Load samples that were previously condensed into conical,
reservoir bottomed vials into the autosampler carousel. Use the equivalent of one SPMD per vial. (Use the foam vial supports).
2. Press <Function> <Method> (7) on the autosampler panel. The screen will read: AEdit Method@, ARun Method@,
ACopy Method@. To check the parameters of the program push <enter> while the arrow (6) is pointing to AEdit Method@.
PAGE 10 OF 11 PAGES

39
SOP E-19
3. Enter method number one (1). Press <enter> pad. The screen should now read AEdit Method #1" with the arrow (6) pointing to Aedit step@. Press <enter>.
4. Enter step #1, press <enter>. Screen should now
read, AMethod 1" AStep 1" PART With the arrow () pointing at AStart Vial@ 1 Move arrow () to AFinal Vial@ using the down
arrow key. Enter the correct number corresponding to the number of samples to be run.
5. Use down arrow key to check other parameters.
They should read the same as for the calibration check with the exception of the volume injected. For the samples the volume should be 1250 μL.
6. Use down arrow key to put arrow (6) on AExit@.
Press <enter>.
7. Screen will return to AEDIT METHOD #1". Use down arrow key to put arrow (6) on AEdit injection parameters@. Press <enter>. These should also read the same as with the calibration method 2, with the same exception of volume; which should be 1250 μL.
8. Use down arrow keys to put arrow (6) at AExit@
and press <enter>.
9. Press <Function> then <clear> to put auto sampler to start of run. Screen will read AReady Select a function@. Press <Function> then <Method> (7) Move arrow (6) to ARun Method@, <enter>, Method #1, <enter> . Auto sampler will begin the program and automatically signal the fraction collector to start after the injection has been made.
PAGE 11 OF 11 PAGES

40
WPCL Method Summary September 2, 2009
1. Musks
This method is for the determination of trace levels of selected nitro musk compounds in POCIS filter samples. The sample filters, control blank and quality control filters were sonicated in dichloromethane for 60 minutes, centrifuged for 30 minutes, dried using sodium sulfate and finally concentrated using Micro-KD technique. Analysis was performed by gas chromatography with a Mass Spectrometer Ion Trap Detector (operated in MS/MS mode). A surrogate and internal standard are employed for QA/QC purposes. The reporting limit is 0.050-0.500 ppb (ug/L).
2. Surfactants and Pharmaceuticals
The sample filters, control blank filters, and quality control filters were sonicated in methanol, centrifuged and analyzed using high performance liquid chromatography. Surfactants; Nonylphenol (NP) and nonylphenolethoxylate (NPE) were analyzed by high-performance liquid chromatography with fluorescence detector and confirmed by liquid chromatography mass detector operated in negative and positive mode for NP and NPE, respectively. The reporting limit is 0.020 ppb (µg/L) Pharmaceutical target compounds were determined following EPA 1694 method guidelines using An Agilent liquid chromatography 6410 triple quadrupole MS/MS system, the mass detector was operated with atmospheric pressure electrospray ionization (API-ES) source in positive and negative ion modes. The method detection limits range from 0.002 to 0.050 µg/L. The SPMD dialysates for musk were run on the instrument as is and analyzed the same as the POCIS filter samples. The dialysates for surfactant and pharmaceuticals were solvent exchanged from hexane to methanol by nitrogen blow down procedure and also analyzed same as the POCIS filter samples.