Embed Size (px)
Citation preview
PHASE 1: SYSTEMS PLANNING
Last Week: Project Initiation Project Initiation
Reasons for Systems Projects Sources of Systems Projects Systems Request
Preliminary Investigation Technical Feasibility Economic Feasibility Operational Feasibility
Feasibility Report
1

PHASE 1: SYSTEMS PLANNING
This Week: Project Management Project Planning
Project Staffing
Project Monitoring and Control
2

PROJECT MANAGEMENT
Introduction A process of planning and controlling the
development of a system within a specified time frame at a minimum cost with the right functionality.
The project manager creates a work plan, staffs the project, and puts techniques into place to help him or her control and direct the project through the entire SDLC.
3

PROJECT MANAGEMENT
4

PROJECT MANAGEMENT
5
PROJECT MANAGEMENT
Introduction The deliverable for project management is a project plan that
describes the project team members’ roles, deliverable phases, cost of each deliverable, timeline for each deliverable, and so on.
Having a project plan at the beginning keeps the project under
control in terms of time and cost. It also helps to stop the project at any step if the project runs over budget or the business policy of the sponsor-company changes over time.
6
STEPS OF PROJECT MANAGEMENT
Project Planning Identifying tasks and estimate time and cost required
Project Staffing Identify and arrange for project staff with required technical and
interpersonal skills.
Project Scheduling Creating a schedule that records and keeps track of all the tasks that
need to be accomplished over the life of the project.
Project Monitoring and Control
Guiding, supervising, coordinating and monitoring and reporting
team’s work.
7

PROJECT PLANNING
Two Steps in Planning Identification of tasks (or a list of activities) to create a Work
Breakdown Structure(WBS)
An activity or task is any work that requires the use of company resources including people, time, or money.
Examples are, conducting a set of interviews, designing a form or report, coding a program, and so on.
Estimation of time to complete the tasks
8
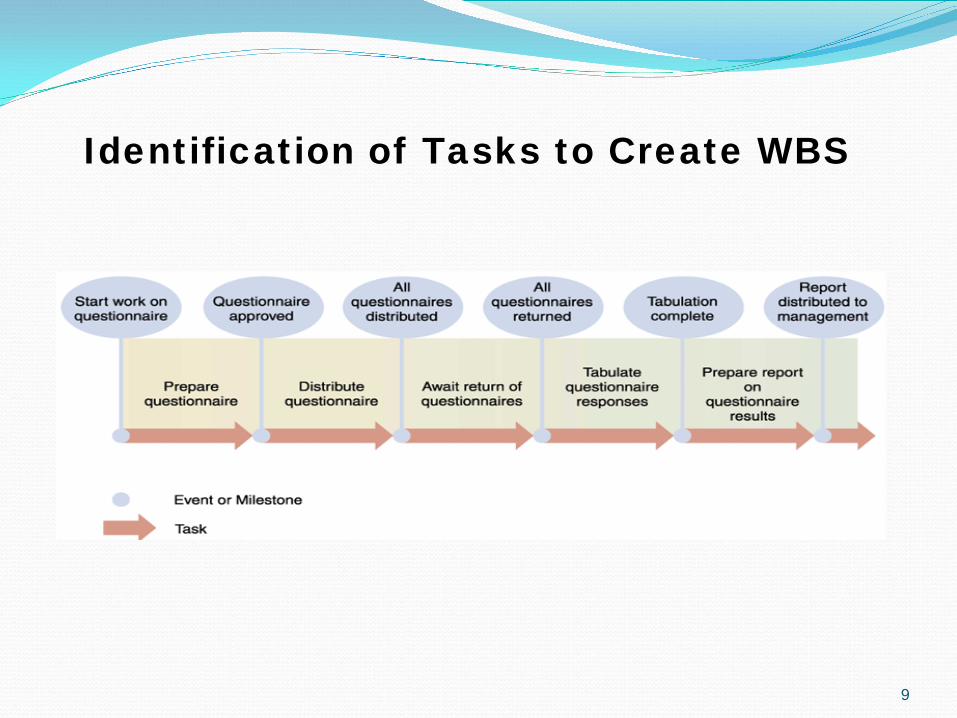
Identification of Tasks to Create WBS
9

Identification of Tasks
Two Ways to Identify tasks
Top-Down Approach
high-level tasks are defined first, and then these are broken down into smaller sub-tasks.
Use a standard list of tasks, or a methodology that are already
proven in the organization to build a project.
10
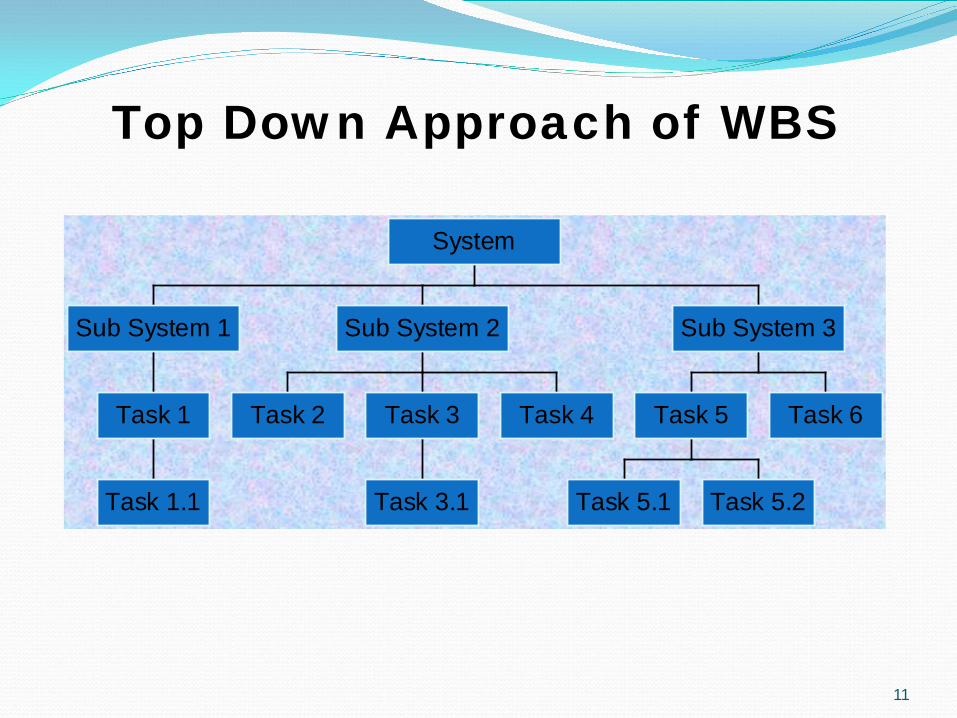
Top Down Approach of WBS
11
Task 1.1
Task 1
Sub System 1
Task 2
Task 3.1
Task 3 Task 4
Sub System 2
Task 5.1 Task 5.2
Task 5 Task 6
Sub System 3
System
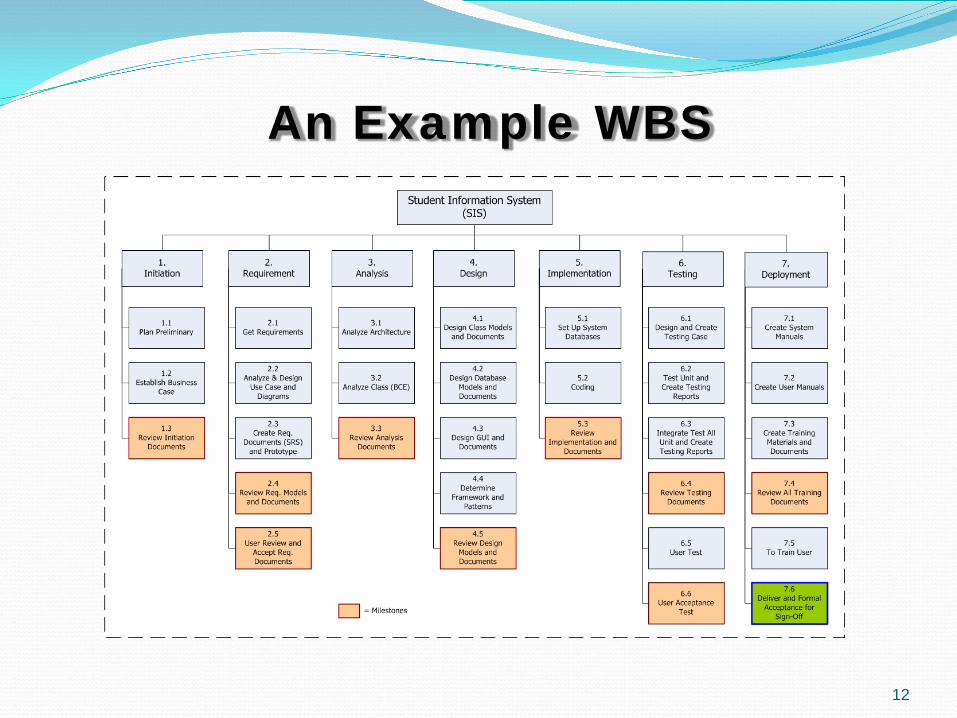
An Example WBS
12

Estimation of Time
Estimation of time is the most difficult part of the project planning.
Experience of the project manager is the most important tool to estimate times for various tasks.
In most cases, if one project is twice the size of another, the larger project requires more than twice as many resources to develop than the smaller one.
If it will take one person 20 days to perform a particular task, it might not be true that 10 people could complete the same task in 2 days.
13

Estimation of Time: Project Complexity
14

Estimation of Time
Three Methods of Time Estimation
Method-1: The time spent in the planning phase is used to
predict the time required for the entire project.
Method-2: Weighted Average Method-3: The second approach takes a three-step process,
and it is more reliable: Estimate system size Estimate efforts required Estimate time required
15
Estimation of Time
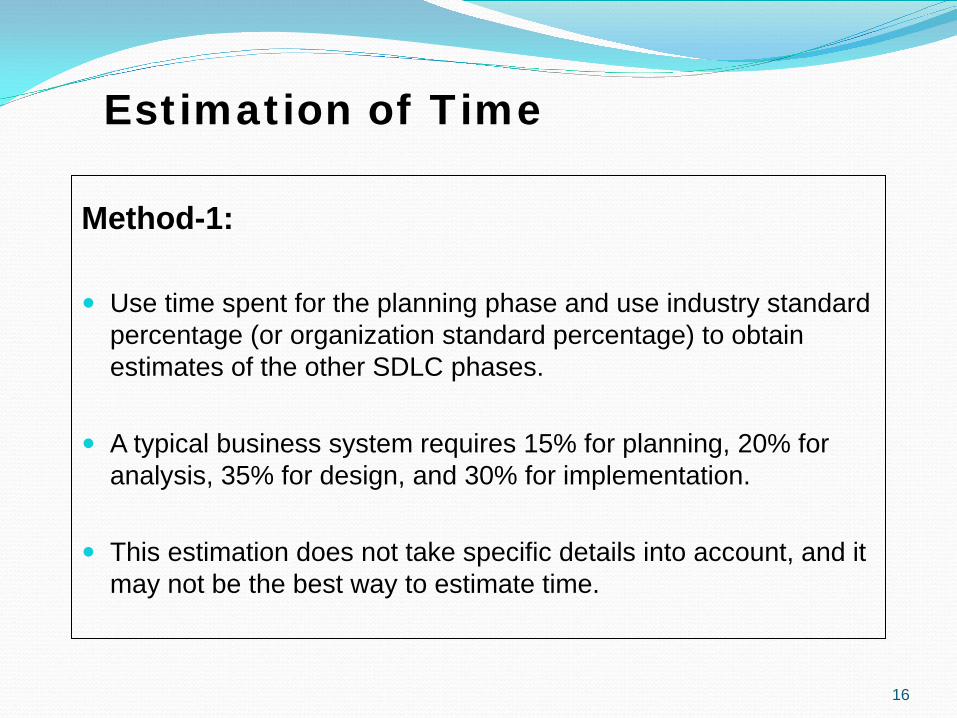
Method-1: Use time spent for the planning phase and use industry standard
percentage (or organization standard percentage) to obtain estimates of the other SDLC phases.
A typical business system requires 15% for planning, 20% for analysis, 35% for design, and 30% for implementation.
This estimation does not take specific details into account, and it may not be the best way to estimate time.
16
Estimation of Time
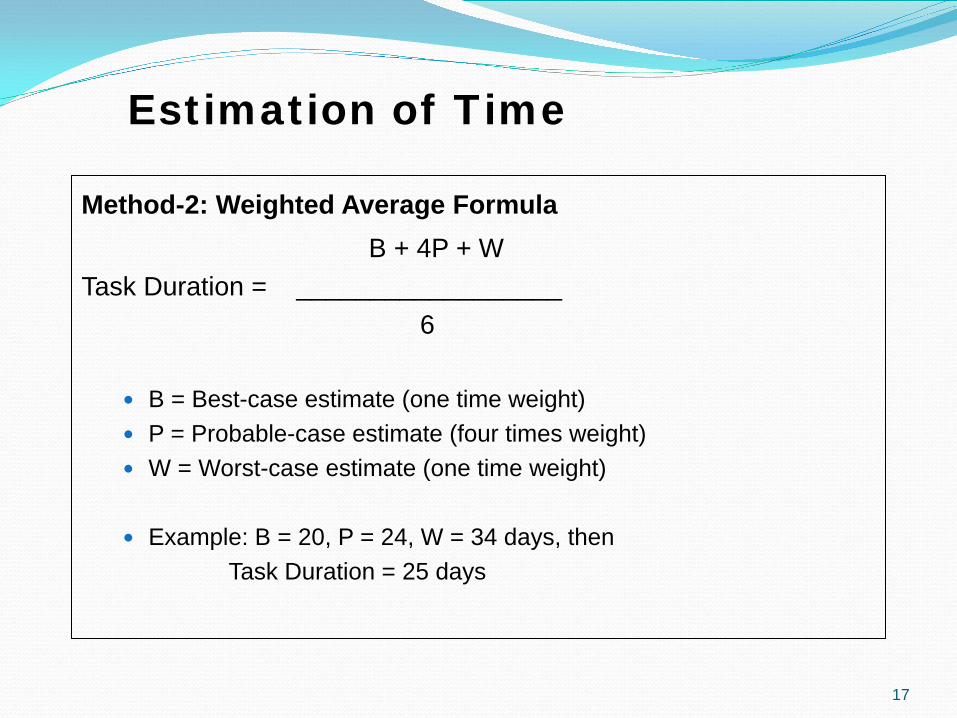
Method-2: Weighted Average Formula B + 4P + W Task Duration = __________________ 6
B = Best-case estimate (one time weight) P = Probable-case estimate (four times weight) W = Worst-case estimate (one time weight)
Example: B = 20, P = 24, W = 34 days, then Task Duration = 25 days
17

Estimation of Time
Method-3:
A Complex Three Steps of Time Estimation
Estimate the size of the project in terms of complexity of the
project and the type of programming language used
Estimate effort required in person-month
Estimate the schedule time in months
18

Estimation of Time: Method-3
Estimate Project Size
A method developed by Allen Albrecht of IBM in 1979
It applies a three-step process
Calculate Total Unadjusted Functional Points (TUFP)
Calculate Total Adjusted Functional Points (TAFP)
Convert TAFP into the Number of lines of codes
19

Estimation of Time: Method-3
Estimate Project Size Calculate Total Unadjusted Functional Points (TUFP):
Identify the system components (inputs,
outputs, queries,files, programs)
Identify the complexity factor of each
component (low, medium, high)
Multiply the number of each component
by the complexity factor
Add all numbers to calculate a total
unadjusted functional point (TUFP)
20

Estimation of Time: Method-3
Estimate Project Size Calculate Total Adjusted Functional Points (TAFP):
Identify the adjusted project complexity (PCA) of the project through
14 complexity factors, such as End-user efficiency Familiarity of technology to project team Complex processing High transaction rate On-line data entry Data communication
Calculate the total adjusted functional points (TAFP) by multiplying PCA and TUFP
21

Est
imat
ion
of T
ime:
Met
hod-
3
22
Estimation of Time: Method-3
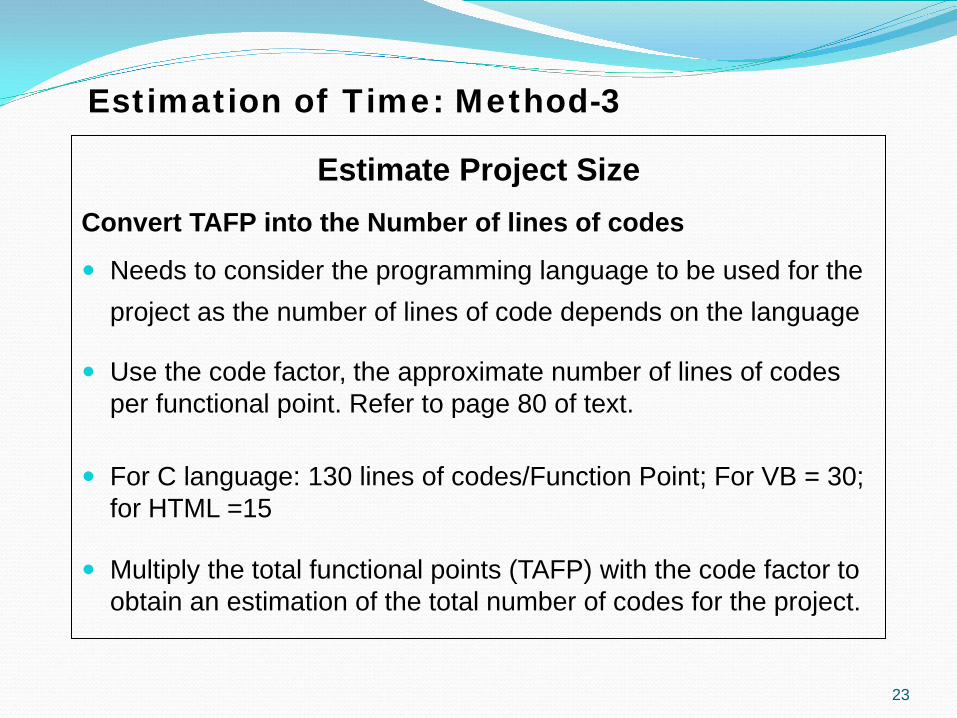
Estimate Project Size Convert TAFP into the Number of lines of codes
Needs to consider the programming language to be used for the project as the number of lines of code depends on the language
Use the code factor, the approximate number of lines of codes per functional point. Refer to page 80 of text.
For C language: 130 lines of codes/Function Point; For VB = 30; for HTML =15
Multiply the total functional points (TAFP) with the code factor to obtain an estimation of the total number of codes for the project.
23

Estimation of Time: Method-3
Estimate Effort COCOMO Model Can be Used to Determine Effort:
Effort depends on the
size of the project, and
the production rates of the project personnel (how much work one can do)
For small to moderate-size projects (i.e., 100,000 lines of code and 10
or fewer programmers), the effort can be estimated as:
Effort (in person-months) = 1.4 x thousands of lines of code
For example, a project with 10,000 lines of code will require 14 person-
months to complete.
24

Estimation of Time: Method-3
Estimate Schedule Time
One rule of thumb to determine schedule is: Schedule time (months) = 3.0 x (person-months)1/3
A project that has an effort of 40 person-months should be
scheduled to take a little more than 10 months.
25

Estimation of Time: Method-3
Estimation of Number of Staff
The average number of staff needed for the project, can be estimated as:
Number of staff = Effort/Schedule time
Thus, to complete a 40 person-month project in 10 months, a team should have an average of four full-time staff members.
26
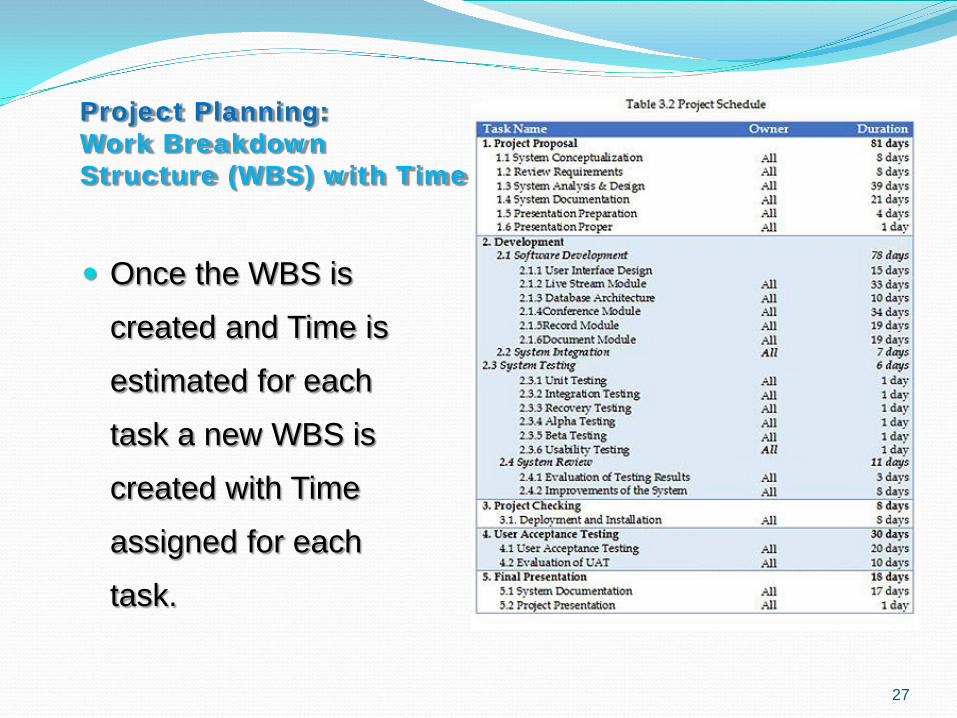
Project Planning: Work Breakdown Structure (WBS) with Time
Once the WBS is
created and Time is
estimated for each
task a new WBS is
created with Time
assigned for each
task.
27
Project Scheduling, Monitoring and Control
28
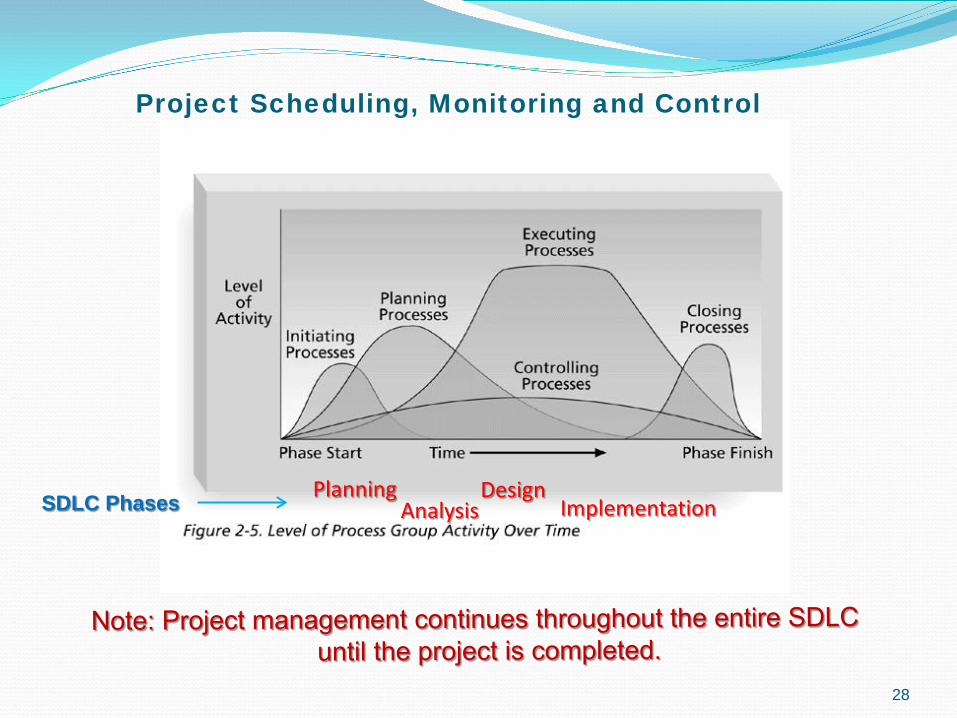
Planning Analysis
Design Implementation SDLC Phases

Project Scheduling
Scheduling tasks is important in predicting deadlines, calculating costs, making staffing decisions, and understanding the progress of the project.
In most cases, tasks are interrelated, i.e., one task must be completed before starting another one.
In some cases, more than one task can be performed in parallel.
There are two well-developed techniques for scheduling and tracking project tasks: PERT (Project Estimation and Review Technique) Gantt charts.
29
PERT Diagram
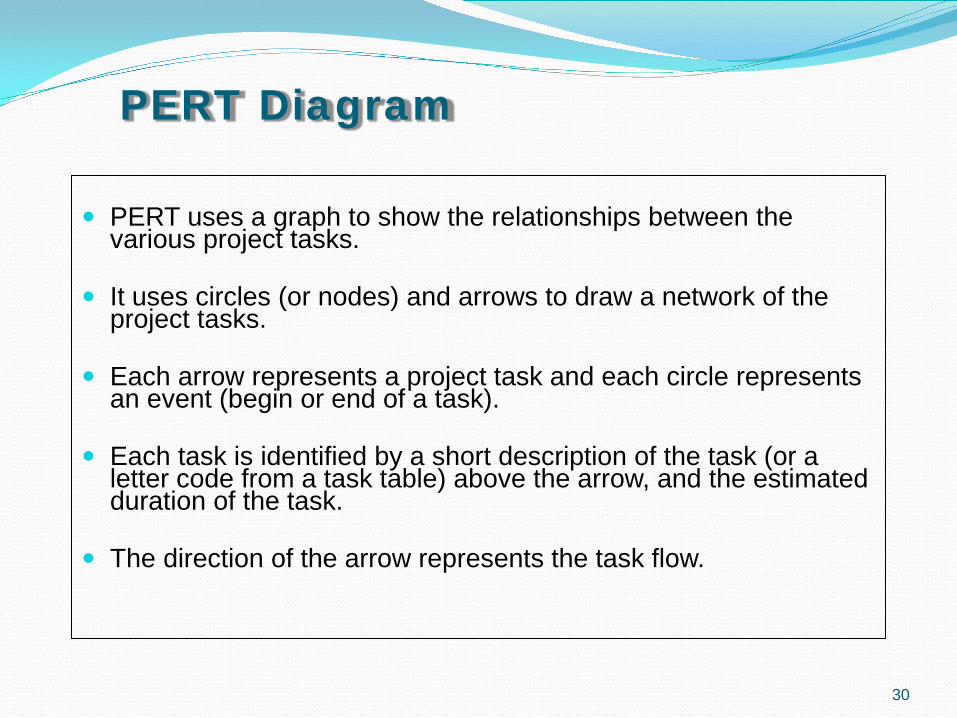
PERT uses a graph to show the relationships between the
various project tasks. It uses circles (or nodes) and arrows to draw a network of the
project tasks. Each arrow represents a project task and each circle represents
an event (begin or end of a task).
Each task is identified by a short description of the task (or a letter code from a task table) above the arrow, and the estimated duration of the task.
The direction of the arrow represents the task flow.
30

PERT Diagram
31

PERT Diagram
32
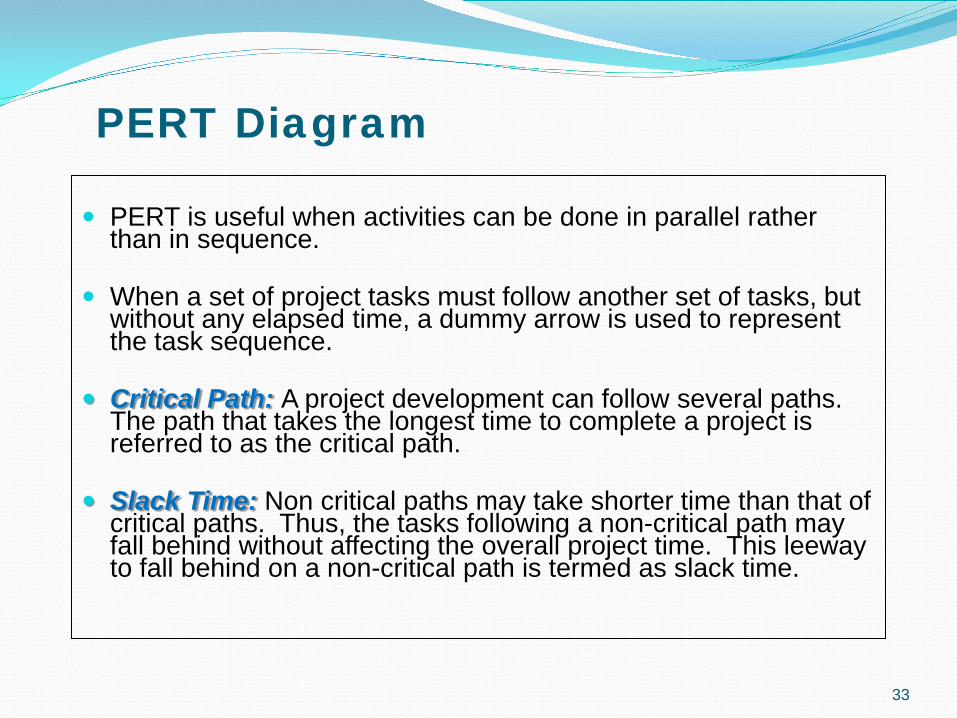
PERT Diagram PERT is useful when activities can be done in parallel rather
than in sequence.
When a set of project tasks must follow another set of tasks, but without any elapsed time, a dummy arrow is used to represent the task sequence.
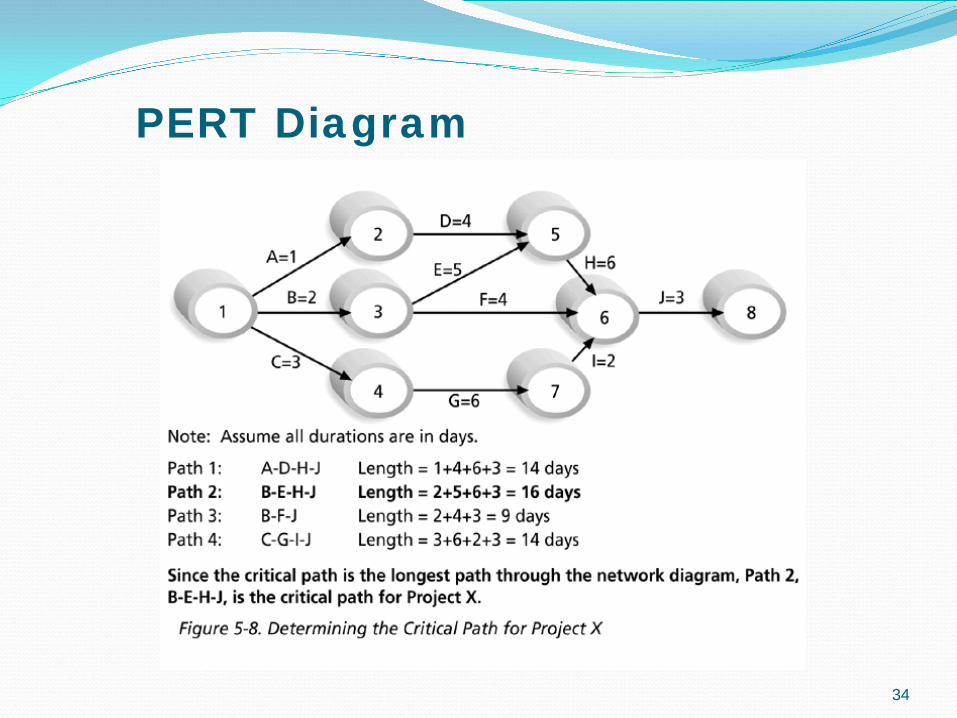
Critical Path: A project development can follow several paths. The path that takes the longest time to complete a project is referred to as the critical path.
Slack Time: Non critical paths may take shorter time than that of critical paths. Thus, the tasks following a non-critical path may fall behind without affecting the overall project time. This leeway to fall behind on a non-critical path is termed as slack time.
33
PERT Diagram
34
Gantt Chart
Gantt chart is a horizontal bar chart that illustrates a schedule.
The horizontal axis shows time, and the activities or tasks are displayed vertically, from top to bottom, in the order of their start dates.
The horizontal position of the bar also shows the start and end of a task and the length of the bar indicates its duration.
35

Gantt Chart
36
Use Microsoft Project or Open Workbench software to create an example Gantt chart and PERT/Network diagram.

Comparing Gantt Charts and PERT Diagrams
The PERT charts, unlike Gantt charts, show all individual activities and dependencies, but that a PERT chart, even for a small project, can be quite complicated.
The picture presented by a PERT chart is not as clear as a Gantt chart, which graphically displays the timing and duration of the activities.
37

PROJECT PLANNING: STAFFING
A project will contain a project manager, functional lead,
technical lead, one or more analysts and programmers
Once the staffing needs are determined, the project manager staffs the project
The project manager is responsible for: Matching people’s skills with the project needs Motivating them to meet the project’s objectives Minimizing conflicts between the staff members
38

PROJECT PLANNING: STAFFING Assigning more staff to a project may not necessarily shorten the
project time, as it becomes harder to coordinate work from many staff members.
The more a team grows, the more difficult it becomes to manage.
A good rule of thumb is to keep team sizes under 8 to 10 people.
If more people are needed, create sub-teams, so the project manager can communicate with sub-team leaders.
39

Project Monitoring and Control It is virtually impossible to develop an exact
assessment of the project’s schedule before the analysis and design phases are conducted.
The time estimated during this stage will need to be redefined as the project progresses.
In many respects, the project cost and project time follows a hurricane model.
40

Project Monitoring and Control
41

Project Scheduling and Control
42

Project Monitoring and Control Project management continues throughout the entire SDLC, until
the project is completed.
There are several activities in project monitoring and control: Refining estimates Tracking Tasks Keep All Documents Have a Standard Manage Project Scope Managing Risk Reporting Progress
43

Project Monitoring and Control
Refining Estimates
When a system is first requested, there is little knowledge. After the feasibility analysis, more information is gathered and the estimation of time, cost, and functionality becomes more accurate and precise.
The accuracy and precision increases as the system moves closer to completion.
According to experts, a well-done project plan has a 100% margin of error for project cost and a 25% margin of error for schedule time.
A project with an estimated cost of $100,000 and estimated time of 20 weeks will actually cost between $0 and $200,000 and it will take between 15 and 25 weeks.
44

Project Monitoring and Control
Methods of Adjustment of Estimates
If the project team finishes a project step ahead of schedule, the project manager shifts the deadline sooner by the same amount but do not adjust the promised completion date.
If the team is late in meeting a scheduled deadline, do not expect to make up for the lost time, but adjust the future deadlines to include an increase similar to that experienced.
For example, if the first phase was completed 10 % over schedule, increase the rest of your schedule by 10%.
45
Project Reporting An accurate reporting is essential throughout the
SDLC. Team members regularly report to the project manager, who in turn reports to management and users.
The project manager collects, verifies, organizes, and evaluates the information that he or she receives from the team.
Then the manager decides which information needs to be passed along, prepares a summary, and submits it to management and users.
The management ultimately submits the report to the sponsoring agency of the project.
46

Project Status Meetings
A meeting can give team members an opportunity to share information, discuss common problems, explain new techniques, and offer comments that can be extremely valuable to others.
47

Project Status Reports In addition to project reporting, the project manager
must handle and report on potential problems.
An overly cautious project manager may alerts management to every potential snag and every slight delay. This person might lose credibility over time in the organization.
At the other extreme is a project manager who does not alert management until a problem is serious.
Thus a project manager should play his or her role very carefully.
48

Project Management - Summary
Create the Work Plan Identify tasks Estimate time Estimate the Number of Staff Members
Staff the Project
Schedule the Project
Monitor and Control the Project
Refining estimates Tracking Tasks Manage Scope
Manage people
49