Embed Size (px)
Citation preview
Phase diagrams (cont.) and the Fe-C system

Solidification: Pro-eutectic vs
Eutectic
Ideal liquid, uniform distribution
Solid Pb(Sn) (α) nucleates
Solubility limit leads toSn
rich area just outside α
Sn
easily redistributes in L
Pro-eutectic solidification
Process continues untileutectic temperature is reached
Eutectic solidification

18
L + α200
T(°C)
Co, wt% Sn
20 400
300
100
L
α
60
L: Cowt%Sn
α + β
TE
α: 18.3wt%Sn
β
080 100
L + β
CE18.3 97.861.9
183°C
β: 97.8wt%Sn
•
Co
= CE•
Eutectic microstructure--alternating layers of α
and β
crystals.
Adapted from Fig. 9.12, Callister 6e. (Fig. 9.12 from Metals Handbook, Vol. 9, 9th ed., Metallography and Microstructures, American Society for Metals, Materials Park, OH, 1985.)
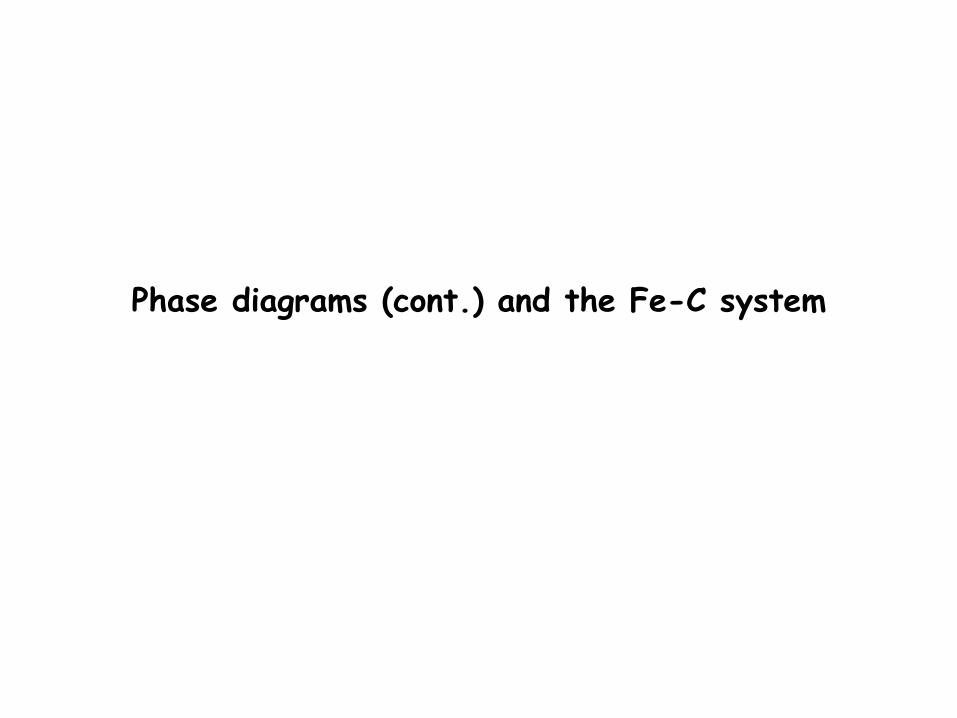
MICROSTRUCTURES IN EUTECTIC SYSTEMS
Phases at P1?
Microconstituents
at P1?
How much of each phase?
P1

20
T(°C)
(Pb-Sn System)
L + α200
Co, wt% Sn20 400
300
100
L
α
60
α + β
TE β
080 100
L + β
18.361.9
97.8
Cohypoeutectic
Cohypereutectic
eutectic
hypereutectic: (illustration only)
160μm
eutectic: Co=61.9wt%Sn
175μm
β
ββ
ββ
β
α
α
α
αα
α
hypoeutectic: Co=50wt%Sn
eutectic micro-constituent
Adapted from Fig. 9.7, Callister 6e.
(Fig. 9.7 adapted from Binary Phase Diagrams, 2nd ed., Vol. 3, T.B. Massalski (Editor-in-Chief), ASM International, Materials Park, OH, 1990.)
(Figs. 9.12 and 9.15 from Metals Handbook, 9th ed.,Vol. 9, Metallography and Microstructures, American Society for Metals, Materials Park, OH, 1985.)
HYPOEUTECTIC & HYPEREUTECTIC
L + α200
T(°C)
Co, wt% Sn
20 400
300
100
L
α
60
L: Cowt%Sn
α + β
TEβ
080 100
L + β
Co18.3 61.9
Lα
Lα
primary α
97.8
S
S
RR
eutectic αeutectic β
19
Example: Pb-Sn
system
•
18.3wt%Sn < Co
< 61.9wt%Sn
Adapted from Fig. 9.14, Callister 6e.
MICROSTRUCTURES IN EUTECTIC SYSTEMS
Phases? Composition?
How much of each?
Just Above TE
Microconstituents?How much of each?

L + α200
T(°C)
Co, wt% Sn
20 400
300
100
L
α
60
L: Cowt%Sn
α + β
TEβ
080 100
L + β
Co18.3 61.9
Lα
Lα
primary α
97.8
S
S
RR
eutectic αeutectic β
19
Example: Pb-Sn
system
•
18.3wt%Sn < Co
< 61.9wt%Sn
Adapted from Fig. 9.14, Callister 6e.
MICROSTRUCTURES IN EUTECTIC SYSTEMS
Phases? Composition?
How much of each?
Just Below TE
Microconstituents?How much of each?

Systems with intermediate compounds or solid solutions
Cu, Zn

Iron -
Carbon system: Consider only Fe to Fe3
C portion
AXES:Cementite: Fe3
C(Compound)
PURE IronFerrite (α): BCCAustenite(γ): FCCFerrite (δ): BCC
Solid solutionsα,δ,γ, interstitial CDifferent solubilities

Peritectic
and Eutectic Example: Iron -
Carbon system
Eutectiod: all solidsOne solid phase separates into two different solid phases upon coolingHere: γ → α + Fe3
C
Peritectic: Liquid + solid phase at given composition converts to one different
solid phase upon coolingHere: L + δ → γ
Phases?

Alloy Classifications in the Iron Carbon system
Hypo Eutectoid
Steel0.008 –
0.76
Hyper Eutectoid Steel0.76 –
2.14Cast Iron
2.14 –
6.7% C
Iron0 –
0.008
Numbers in %

21
(Adapted from Fig. 9.24, Callister 6e. (Fig. 9.24 from Metals Handbook, 9th ed., Vol. 9, Metallography and Microstructures, American Society for Metals, Materials Park, OH, 1985.)
Result: Pearlite = alternating layers of α and Fe3C phases.
120μm
• 2 important points
-Eutectic (A):
-Eutectoid (B): L ⇒ γ + Fe3C
γ ⇒ α +Fe3C
Fe
3C
(c
em
en
tite
)
1600
1400
1200
1000
800
600
4000 1 2 3 4 5 6 6.7
L
γ (austenite)
γ+L
γ+Fe3C
α+Fe3C
α+γ
L+Fe3C
δ
(Fe) Co, wt% C0.77 4.30
727°C = Teutectoid
1148°C
T(°C)
A
B
SR
R S
γ γγγ
Fe3C (cementite-hard)α (ferrite-soft)
αC
eu
tec
toid
IRON-CARBON (Fe-C) PHASE DIAGRAM
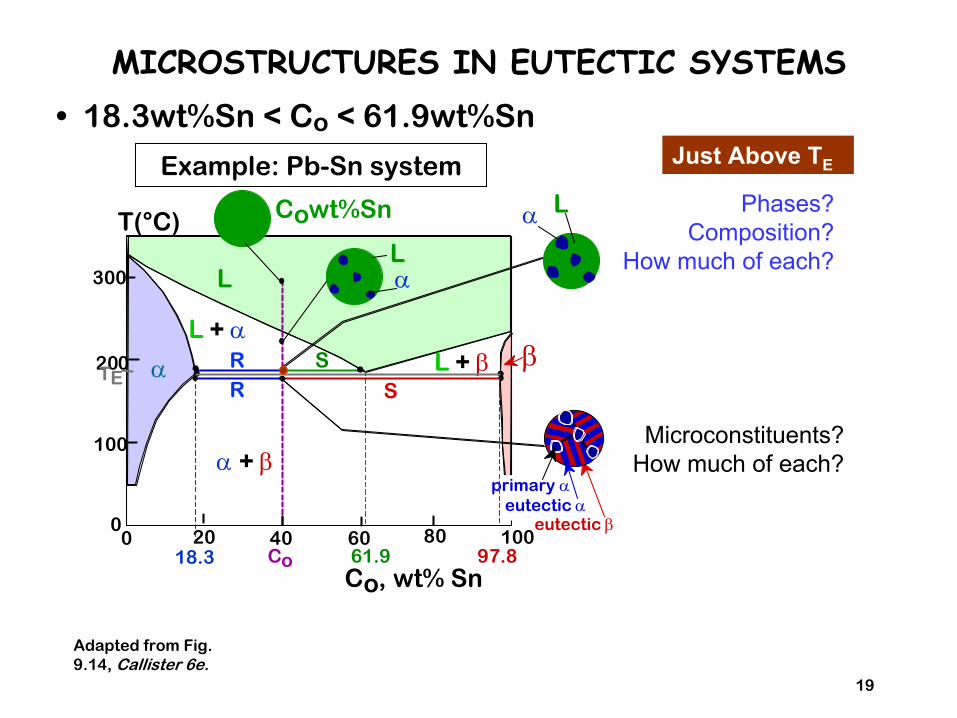
Eutectoid: 0.76% C Pearlite
formation
•
Solid transformation•
γ →
α
+ Fe3C
0.76%
0.02%
6.7%
Similar to Eutectic transformation-
but now, diffusion occurs within solid

Hypo eutectoid microstructure at Room T
Proeutectoid
Ferrite + Pearlite
•
γ → α + γ•
Ferrite phase increases as T decreases
•
At T(eutectoid)γ
+ α → Pearlite
+ α
–
Remaining austenite transforms to pearlite

22
Adapted from Figs. 9.21 and 9.26,Callister 6e. (Fig. 9.21 adapted from Binary Alloy Phase Diagrams, 2nd ed., Vol. 1, T.B. Massalski (Ed.-in-Chief), ASM International, Materials Park, OH, 1990.)
Adapted fromFig. 9.27,Callister6e. (Fig. 9.27 courtesy Republic Steel Corporation.)
HYPOEUTECTOID STEEL
(Fe-C System)
Co
Fe
3C
(c
em
en
tite
)
1600
1400
1200
1000
800
600
4000 1 2 3 4 5 6 6.7
L
γ (austenite)
γ+L
γ+Fe3C
α+Fe3C
L+Fe3C
δ
Co, wt% C0.7
7
727°C
1148°C
T(°C)
R S
γ γγγ
α
γγγ γ
γγ γ
γ r s
wα =s/(r+s)wγ =(1-wα)
wα =S/(R+S)wFe3C =(1-wα)
wpearlite = wγ
α
αα
αα
α pearlite
100μm Hypoeutectoid steel

(Fe-C System)
Co
Fe
3C
(c
em
en
tite
)
1600
1400
1200
1000
800
600
4000 1 2 3 4 5 6 6.7
L
γ (austenite)
γ+L
γ+Fe3C
α+Fe3C
L+Fe3C
δ
Co, wt% C0.7
71148°C
T(°C)
R S
γ γγγ
αs
wFe3C =r/(r+s)wγ =(1-wFe3C)
wα =S/(R+S)wFe3C =(1-wα)
wpearlite = wγpearlite
60μm Hypereutectoid steel
rγγ
γ γ
γγγ γ
Fe3C
23
Adapted from Figs. 9.21 and 9.29,Callister 6e. (Fig. 9.21 adapted from Binary Alloy Phase Diagrams, 2nd ed., Vol. 1, T.B. Massalski (Ed.-in-Chief), ASM International, Materials Park, OH, 1990.)
Adapted fromFig. 9.30,Callister6e. (Fig. 9.30copyright 1971 by United States Steel Corporation.)
HYPEREUTECTOID STEEL
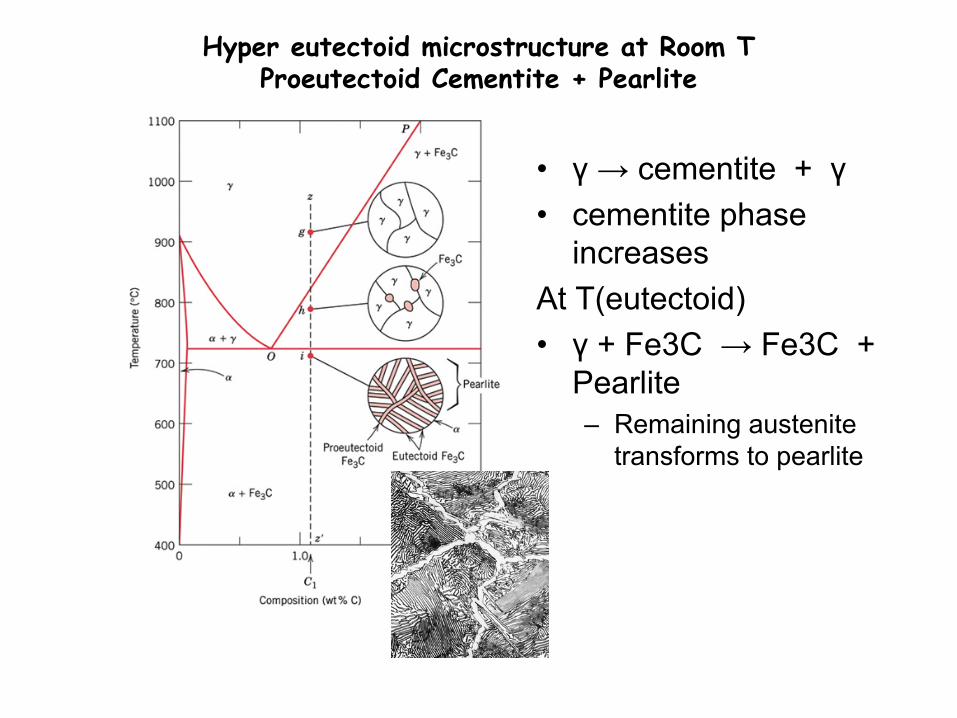
Hyper eutectoid microstructure at Room T
Proeutectoid
Cementite
+ Pearlite
•
γ → cementite
+ γ•
cementite
phase
increasesAt T(eutectoid)•
γ
+ Fe3C → Fe3C
+
Pearlite–
Remaining austenite transforms to pearlite

TE
ute
cto
id (
°C)
wt. % of alloying elements
Ti
Ni600
800
1000
1200
0 4 8 12
Mo SiW
Cr
Mn
wt. % of alloying elements
Ce
ute
cto
id (
wt%
C)
Ni
Ti
0 4 8 120
0.2
0.4
0.6
0.8
Cr
SiMnW
Mo
24
•
Change in Teutectoid
(727 oC): •
Change in Ceutectoid
(0.76% C):
Adapted from Fig. 9.31,Callister 6e. (Fig. 9.31 from Edgar C. Bain, Functions of the Alloying Elements in Steel, American Society for Metals, 1939, p. 127.)
Adapted from Fig. 9.32,Callister 6e. (Fig. 9.32 from Edgar C. Bain, Functions of the Alloying Elements in Steel, American Society for Metals, 1939, p. 127.)
ALLOYING STEEL WITH MORE ELEMENTS

12
•
Effect of solid solution strengthening on:
--Tensile strength (TS) --Ductility (%EL,%AR)
--Peak as a function of Co --Min. as a function of Co
MECHANICAL PROPERTIES:
Cu-Ni System
Elo
ng
ati
on
(%
EL
)Composition, wt%Ni
Cu Ni0 20 40 60 80 10020
30
40
50
60
%EL for pure Ni
%EL for pure Cu
Te
nsi
le S
tre
ng
th (
MP
a)
Composition, wt%NiCu Ni0 20 40 60 80 100
200
300
400
TS for pure Ni
TS for pure Cu