Embed Size (px)
Citation preview

IEA GHG Weyburn-Midale CO2 Monitoring and Storage Project
Phase I Project Information
for
Risk Assessment Case Study
October, 2006
IEA Weyburn CO2 Monitoring and Storage Project
2 of 19
Preface
At the conclusion of Phase 1 of the IEA GHG Weyburn CO2 Monitoring and Storage Project, a detailed review of the accomplishments attained and subsequently, identification of areas where additional technical work was required was completed. One of the outcomes from this review was the development of a Scope of Work for the Final Phase of the IEA GHG Weyburn-Midale. The component of the workscope related to risk assessment activities is provided below. A key component of the Weyburn Phase I workflow was the Risk Assessment (RA) for the storage project. The RA brought together much of the work performed in Phase I. Many of the studies, including RA, contribute to the Site Selection process, and the insights gained from the Site Selection (SS) process could heavily influence the developments of storage Best Practices Manual and regulations. A rigorous determination of the data necessary to achieve successful SS is a key outcome of the Final Phase. Weyburn is a natural place to do such an analysis, due to the exceptionally complete data set. The project drivers identified from the Phase I work to close gaps in knowledge:
• Inadequate risk assessment methods and risk mitigation measures for confirming the safety and reliability of geological storage of CO2.
• Strong need to rationalize the selection of cost and time-effective methodologies for risk assessment of the long term fate of stored CO2.
• Risk Assessment is critical for the development of future regulatory activity, but has not been completed under Phase One.
The suggested technical work program elements that will help close these knowledge gaps include:
• Complete the full field risk assessment from Phase 1. All relevant storage and leakage mechanisms should be modeled. Outcomes of significant Features, Events and Processes (FEP) to be completed and documented. (H*)
• Describe the ultimate fate of CO2 in the Weyburn system, the relative volumes in each storage/trapping mechanism, the time to become trapped, and the factors which affect these. This requires the coupling of reservoir simulation with geochemical modeling, especially in determining the degree of CO2 mineralization/solid storage. (H*)
• Describe the ultimate fate of CO2 in the Weyburn system, the relative volumes in each storage/trapping mechanism, the time to become trapped, and the factors which affect these. This requires the coupling of reservoir simulation with geochemical modeling, especially in determining the degree of CO2 mineralization/solid storage. (H*)
• Determine risk levels for various operations scenarios (e.g. EOR-only, maximize CO2 volumes stored, impure CO2 injection, etc.). Identify trade offs (higher water production) and benefits (more oil produced, CO2 stored) for the different scenarios to support economic analysis for operational decisions and formulation of regulations. (H)
• Collaborate with other CO2 JIP to compare RA techniques. Prepare summary documentation of strengths and weaknesses of each technique. (H)

IEA Weyburn CO2 Monitoring and Storage Project
3 of 19
• Further study natural analogues with respect to leakage and storage integrity. Determine from field data whether mineral trapping can be as significant as theory indicates. (M)
• Study ways to stimulate and accelerate CO2 mineral fixation (mineralization, mineral trapping) under Weyburn reservoir conditions.(M)
Goal of Weyburn Phase I Case History
• With an understanding of the research and technical work that has been completed or has been underway since the conclusion of Phase I of the IEA Weyburn CO2 Monitoring and Storage Project (since June 2004) and given the data and information related to the Phase I project, WHAT WOULD BE THE MOST SUITABLE METHODOLOGY OR APPROACH FOR ATTEMPTING TO COMPLETE A RISK ASSESSMENT OF AN ACTIVE CO2-EOR GEOLOGICAL STORAGE PROJECT?
IEA Weyburn CO2 Monitoring and Storage Project
4 of 19
Project Overview
This CO2 monitoring and storage project was essentially a field-demonstration made possible by EnCana’s CO2 enhanced oil recovery (EOR) project being carried out at its Weyburn Unit. Located in the southeast corner of the province of Saskatchewan in Western Canada, the Weyburn Unit is a 180 square kilometer (70 square miles) oil field discovered in 1954. Production is 25 to 34 degree API medium gravity sour crude from the Midale beds of the Mississippian Charles formation. The two main reservoir layers in the Midale beds are the Marly zone, a low permeability chalky dolomite overlaying the Vuggy zone, a highly fractured and permeable limestone. The Weyburn field is part of the large Williston sedimentary basin which straddles Canada and the US, Figure 1. Waterflooding was initiated in 1964 and significant field development including the use of horizontal wells was begun in 1991. In September 2000, EnCana initiated the first phase (Phase 1A) of a CO2 enhanced oil recovery scheme in 18 inverted 9-spot patterns, Figure 2. The flood is expected to be rolled out in phases into a total of 75 patterns over the next 15 years. The CO2 is 95% pure and initial injection rate is 5000 tonnes/day (equivalent to 95 mmcfd). A total of approximately 20 million tonnes of CO2 is expected to be injected into the reservoir over the project life. The CO2 is a purchased byproduct from the Dakota Gasification Company’s synthetic fuel plant in Beulah, North Dakota and is transported through a 320 km pipeline to Weyburn. An operations update for the Weyburn Unit EOR Project operated by EnCana is given in Table 1. This project summary report is presented in four main “themes” and are the following: Theme 1: Geological Characterization of the Geosphere and Biosphere Theme 2: Prediction, Monitoring and Verification of CO2 Movements Theme 3: CO2 Storage Capacity and Distribution Predictions and the Application of Economic Limits Theme 4: Long Term Risk Assessments of the Storage Site
TABLE 1: OPERATIONS UPDATE FOR THE WEYBURN UNIT EOR PROJECT OPERATED BY ENCANA – FEB. 29, 2004
• CO2 injection into Phase 1a started September 15, 2000 • 98 BCF CO2 injected as of Feb 29th, 2004 • Current CO2 purchase is 105MMscfd • 25 mmscfd of associated gas and CO2 being recycled • EOR Operations include Phase 1a(start Sept 2000), Phase 1b(start Oct 2002) and Phase 1c(start
June 2003) • Of the 210 producing wells in the EOR area:
- 71 producers experienced operational response (CO2 detected in casing gas)
- 45 producers experienced production response (incremental production) • Incremental production 9000 bbl/day • Current Unit production 22,400 bbl/day

IEA Weyburn CO2 Monitoring and Storage Project
5 of 19
Figure 1: Location of the Weyburn Unit
Figure 2: CO2 Flood Roll-Out Areas (Weyburn Unit)
CANADA
U.S.A.
ALBERTA MANITOBA
MONTANAN
WYOMING SOUTH DAKOTA
NORTH DAKOTA
EDMONTON
SASKATOON
PRINCEALBERT
WINNIPEGBRANDON
REGINA
HELENA BISMARCK
PIERRE
CALGARY
Williston Sedimentary Basin
HUDSON BAY
WEYBURN
SASK.
Field Size: 70 sq. miles OOIP: 1.4 billion bbls Oil Recovered: 370 million bbls CO2 IR: 130 million bbls
Weyburn Unit:
IEA Weyburn CO2 Monitoring and Storage Project
6 of 19
Geological Characterization of the Geosphere and Biosphere
The Weyburn Oil Pool is a giant oilfield containing about 1.4 billion barrels of oil in place in limestones and dolostones (Midale Beds) of Mississippian age. Carbonates of the Midale reservoir occur at about 1.5 km depth in the northeastern portion of the Williston Basin, a sedimentary basin broadly similar to the Illinois and Michigan basins of North America and numerous intractratonic basins that occur elsewhere around the world. Characterization of the Weyburn geological system for CO2 storage targeted the delineation of primary and secondary trapping mechanisms and the identification of any potential pathways of preferential CO2 migration. To place these components within a regional, or basinal, context, the geological framework was constructed for a region extending 200 x 200 km around the Weyburn Field that includes portions of Saskatchewan, North Dakota and Montana. Large-scale studies such as this more effectively reveal basin hydrogeological flow characteristics and the underlying tectonic framework that can greatly influence depositional patterns of sedimentary packages and fracture development. Increased detail was focused within an area extending 10 km beyond the limits of the CO2 flood that forms the basis for the system model used in risk assessment (Figure 2). Lithostratigraphic mapping identified over 140 individual surfaces from the Precambrian basement to ground surface. The lithostratigraphic units were used to define larger flow packages, or hydrostratigraphic units, that were mapped and characterized using extensive data analysis to provide fundamental information on fluid behavior within the basin as required by performance assessment. Much of the 2000 km of 2D seismic data processed to refine the characterization of subsurface features and basement tectonics was integrated with high-resolution aeromagnetic data to augment fracture and regional fault delineation. Detailed geological studies performed on primary seals (those in contact with the reservoir) and secondary seals (barriers to flow higher in the stratigraphic column) include core descriptions, petrography, isotope geochemistry and fluid inclusion studies. Shallow hydrogeological surveys defined the distribution and continuity of potable aquifers in near-surface sediments of the study region. Remotely sensed imagery analysis was used to determine whether structural elements observed in the deep subsurface are related to linear surface features identified through air photo and satellite imagery. Soil gas surveys, designed to transect some of the linear surface features, are performed regularly around the Weyburn Unit to monitor for changes in CO2 fluxes in soils that may be due to potential anthropogenic CO2 migration. Other specialized studies undertaken include obtaining cores from selected strata above the reservoir for petrophysical measurements, till sampling for soil gas characterization, shallow aquifer demarcation, and natural analog comparisons. Integration of these diverse data has provided a coherent and representative geological model that can be tailored for use in risk assessment. Primary seals enclosing the reservoir (including the overlying Midale Evaporite and a highly anhydritized altered zone and the underlying Frobisher Evaporite) are observed to be highly competent and exhibit only rare discontinuities; most of which formed shortly after deposition, are completely healed and exhibit no visual evidence of fluid conductance (Figure 3). In addition, as part of the primary sealing package, the Lower Watrous Formation forms a regionally extensive aquitard that effectively separates a deep hydrogeological system (including the Midale Beds) from a shallower hydrogeological system (Figure 4). Overlying the Watrous Formation is over 1 km of predominantly clastic strata that contain several thick and regionally extensive aquitards providing additional barriers to upward fluid migration. Aquifers present within the shallow hydrogeological regime may have high flow velocities (m/yr) and are important for scenario analysis of CO2 leakage. Within the Midale Beds however, low flow velocities (cm/yr) and favourable flow directions suggest formation water is unlikely to be an effective transport mechanism for dissolved CO2. Fracture zones and regional tectonic elements are present within the study region, yet none were found to exhibit evidence of fluid conductance or influence over hydrogeological components. Salt dissolution also has occurred within the risk assessment study region and may have induced fracturing of overlying rocks, although with no apparent compromise of the geologic container (Figure 5). Overall, one of the most important results from this work is the development of a tremendous geoscience dataset pertinent to understanding geological storage of CO2 in the Williston Basin and other sedimentary basins.
IEA Weyburn CO2 Monitoring and Storage Project
7 of 19
Figures
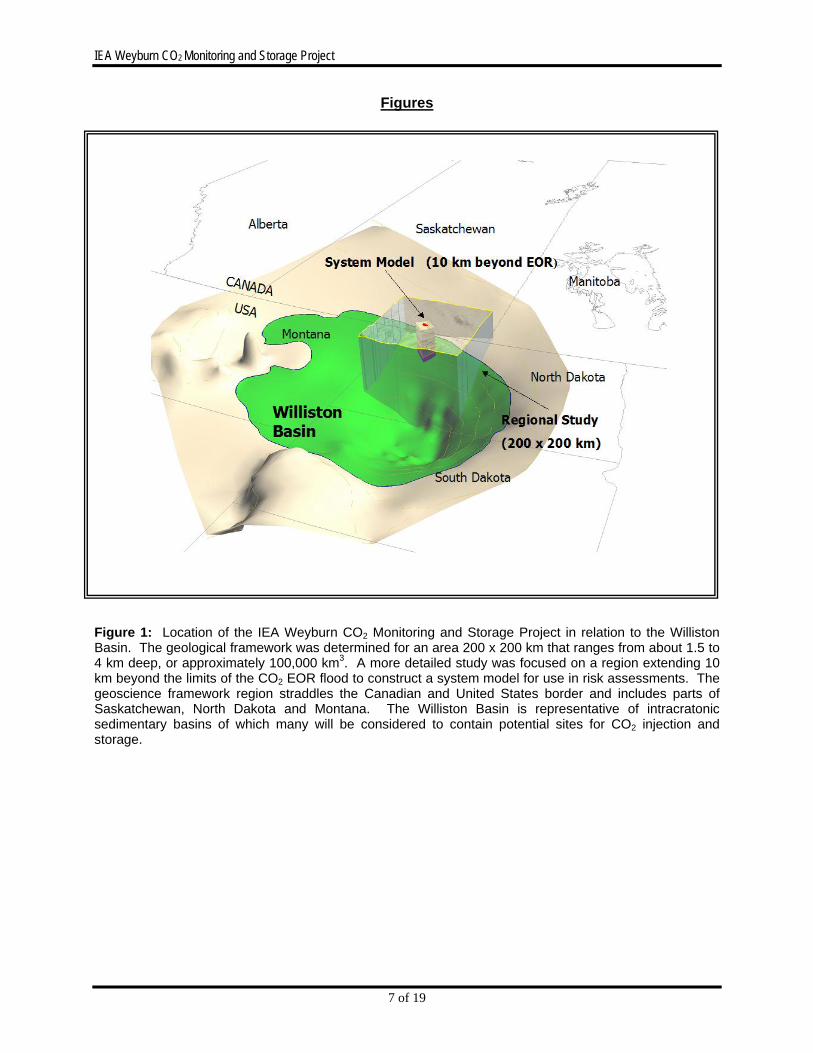
Figure 1: Location of the IEA Weyburn CO2 Monitoring and Storage Project in relation to the Williston Basin. The geological framework was determined for an area 200 x 200 km that ranges from about 1.5 to 4 km deep, or approximately 100,000 km3. A more detailed study was focused on a region extending 10 km beyond the limits of the CO2 EOR flood to construct a system model for use in risk assessments. The geoscience framework region straddles the Canadian and United States border and includes parts of Saskatchewan, North Dakota and Montana. The Williston Basin is representative of intracratonic sedimentary basins of which many will be considered to contain potential sites for CO2 injection and storage.
IEA Weyburn CO2 Monitoring and Storage Project
8 of 19
N
Biosphere
Bearpaw Aquitard
Belly River
Colorado Aquitard
Newcastle
Joli Fou Aquitard
Mannville
JurassicVanguard Aquitard
Watrous Aquitard
MississippianMidale Evaporite
Risk Assessment Area10km
EOR
Surface lineaments
Regional hydrogeological flow
Potable aquifers
wells
Horizon of CO2 injection(Midale Beds)
1.5km
Sub-Mesozoic Unconformity
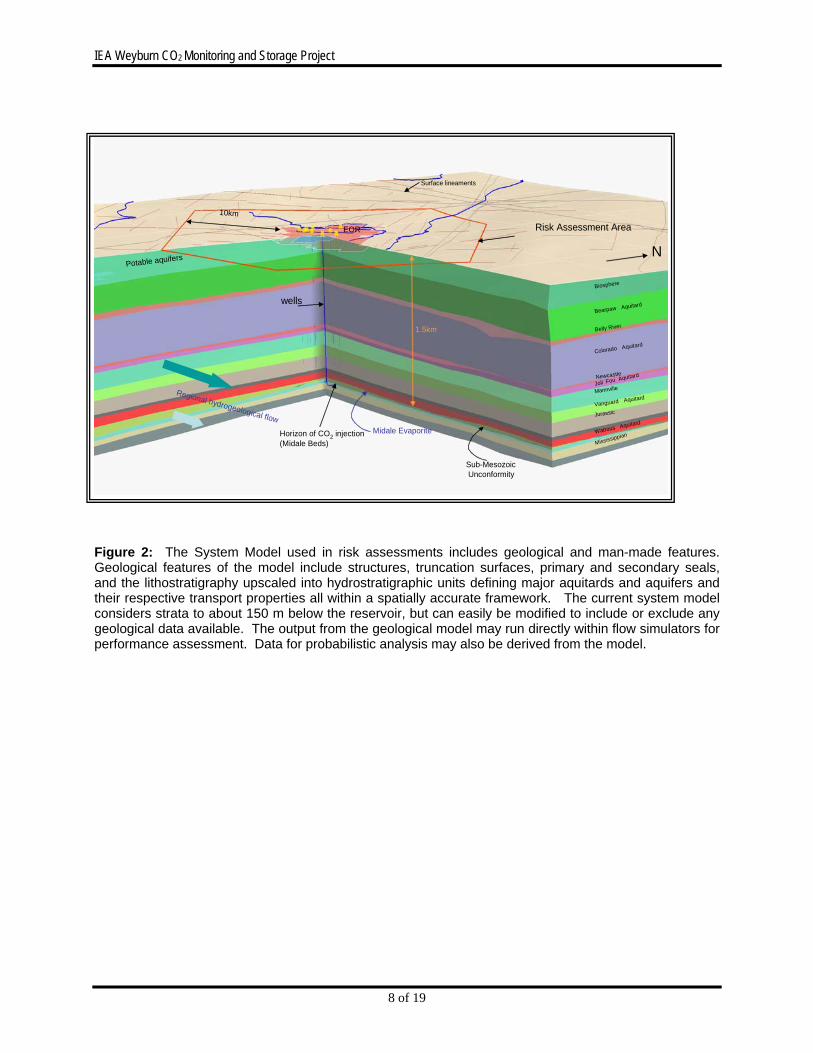
Figure 2: The System Model used in risk assessments includes geological and man-made features. Geological features of the model include structures, truncation surfaces, primary and secondary seals, and the lithostratigraphy upscaled into hydrostratigraphic units defining major aquitards and aquifers and their respective transport properties all within a spatially accurate framework. The current system model considers strata to about 150 m below the reservoir, but can easily be modified to include or exclude any geological data available. The output from the geological model may run directly within flow simulators for performance assessment. Data for probabilistic analysis may also be derived from the model.

IEA Weyburn CO2 Monitoring and Storage Project
9 of 19
Figure 3: Bounding conditions of the Mississippian Midale Beds of the Weyburn Unit are shown in plan view in the upper diagram. A north – south cross-section through this map is shown in the lower diagram which depicts the spatial relation of the primary sealing units, the Midale Evaporite, the altered zone, the Frobisher Evaporite and the Lower Watrous Formation, to the Midale Beds. The Midale Beds consists of an upper dolostone unit (Marly), which is where CO2 is currently being injected, and a lower limestone unit (Vuggy) from which most previous oil production was obtained.
IEA Weyburn CO2 Monitoring and Storage Project
10 of 19
Watrous
Mannville
MidaleWatrous
Mannville
Midale
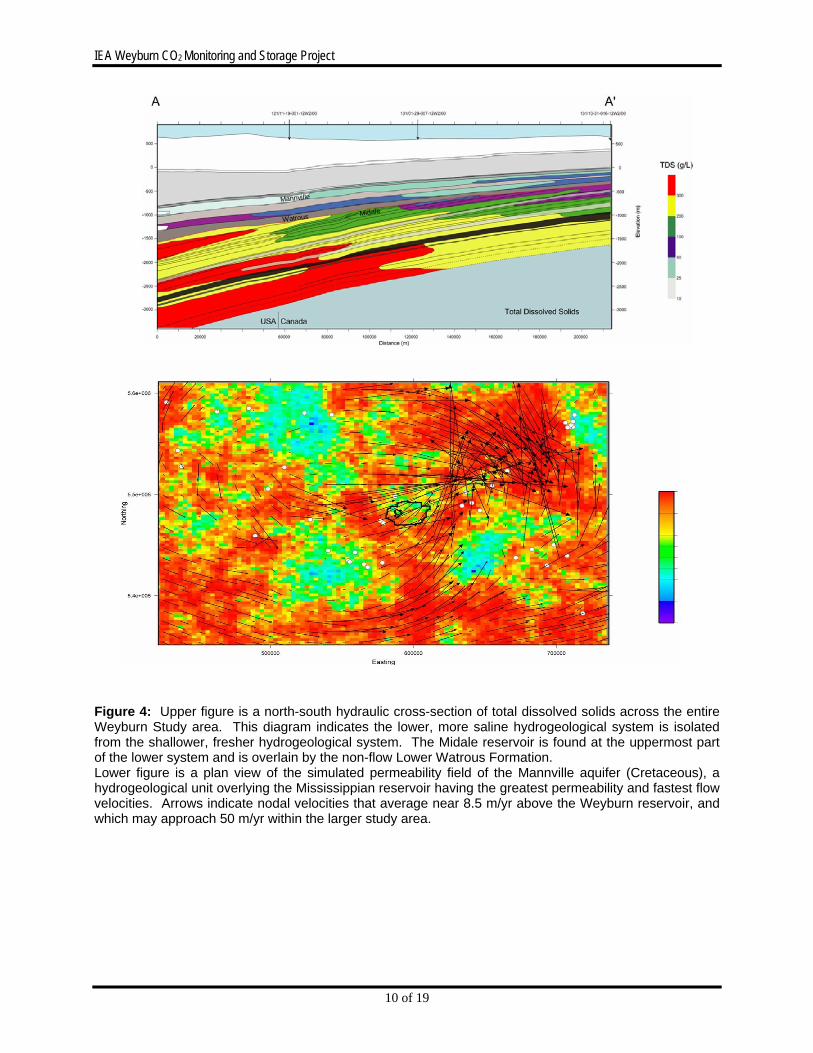
Figure 4: Upper figure is a north-south hydraulic cross-section of total dissolved solids across the entire Weyburn Study area. This diagram indicates the lower, more saline hydrogeological system is isolated from the shallower, fresher hydrogeological system. The Midale reservoir is found at the uppermost part of the lower system and is overlain by the non-flow Lower Watrous Formation. Lower figure is a plan view of the simulated permeability field of the Mannville aquifer (Cretaceous), a hydrogeological unit overlying the Mississippian reservoir having the greatest permeability and fastest flow velocities. Arrows indicate nodal velocities that average near 8.5 m/yr above the Weyburn reservoir, and which may approach 50 m/yr within the larger study area.

IEA Weyburn CO2 Monitoring and Storage Project
11 of 19
Figure 5: Thickness variations of the Devonian Prairie Evaporite Formation that occurs more than 1 km below the Mississippian Midale reservoir. Superimposed on the thickness variations, which are due mainly to subsurface salt dissolution, are numerous tectonic and surface features identified within this project. The dark heavy lines are major tectonic elements within the basin; the thinner red lines are fractures and faults interpreted to occur at various depths within the sedimentary column; and the thin blue lines are lineaments identified on ground surface through satellite imagery. The influence of the tectonic elements is apparent in depositional and erosional patterns of strata from basement to surface. The dynamics of salt dissolution within basins has greatly affected trapping potential and is an area requiring further work.

IEA Weyburn CO2 Monitoring and Storage Project
12 of 19
CO2 Storage Capacity and Distribution Predictions
(Note: The simulations described below should be viewed as the type of simulation required to support risk assessment studies. The simulations completed in Phase I, while attempting to closely model operational conditions, was not meant to replicate specific field development options.) Technical Approach GEM, a multi-phase, multi-component compositional reservoir simulation model was used to predict the CO2 storage capacity in the Weyburn Unit reservoir. The approach taken in modeling the size and complexity of 75 EOR patterns was to start with fine-grid single-pattern simulations and end with a coarse-grid 75-pattern simulation. The process involved three levels of upscaling: (1) from a detailed geological model of the Weyburn reservoir to a fine-grid reservoir simulation model; (2) from 3 fine-grid single-pattern models to coarse-grid models of the same patterns; and (3) from 3 coarse-grid single-pattern models to a 75-pattern model using the same grid resolution. Laboratory measurements of oil properties and CO2-oil phase equilibrium behaviour using oil samples collected periodically from different wells provided information to tune the equation-of-state (EOS) parameters in the PVT model used in the reservoir simulation. The reservoir simulation model was validated by both lab-scale and field-scale simulations. In the lab-scale simulation, CO2-coreflood experiments conducted with different oil samples were history-matched while in the field-scale simulation, field production histories in 3 different patterns with different CO2 injection strategies (i.e., “simultaneous but separate water and gas injection” (SSWG), “Vuggy water-alternating gas” (VWAG), “Marly, Vuggy water-alternating-gas” (MVWAG)) were history-matched. Then, the reservoir simulation model was used to predict the CO2 storage performance during the EOR period, first in the 3 single patterns and then in the entire 75 EOR patterns. EnCana’s operating strategies was followed as closely as possible. This was labeled the Base Case. Alternative CO2 storage cases after EOR were also investigated with a focus on promoting additional CO2 storage. Using the predicted CO2 distribution in the reservoir at the end of EOR, a geochemical model was used to provide a preliminary assessment of the amount of CO2 that will be stored in the reservoir through different trapping mechanisms (solubility, ionic and mineralogical trappings). The geochemical modeling also used formation and injection fluid compositions, detailed mineralogical assessment of each of the major flow units in the reservoir, and evaluation of mineral kinetic data. The performance of both CO2 storage and EOR depend on achieving maximum sweep efficiencies (conformance) and that can be improved through conformance control techniques. The Weyburn reservoir pay zone is a fractured-carbonate with large permeability contrasts, which allows the injected CO2 to finger and bypass a significant fraction of the recoverable oil. Laboratory evaluation of commercially available technologies for conformance control such as CO2-foam, gel and gel-foam processes were conducted to select the most suitable options for the Weyburn reservoir. Well production histories provided by EnCana have been analyzed to select candidate wells with high production GOR for future conformance control field trials. The analysis included reservoir simulation modeling using existing fine-grid single-pattern simulations to design the field trial and predict the field trial performance. With the prediction of CO2 storage capacities and EOR performance, an economic model was used to apply economic constraints to the CO2 storage cases. This Storage Economic Model has the capability to calculate CO2 capture, transportation and storage costs in addition to the conventional economic evaluation of an EOR process. The model can be run either for stand-alone CO2 storage options (e.g. depleted oil or gas reservoirs, saline aquifers, etc.) or storage in conjunction with CO2 EOR projects. The objective of the Storage Economics Model is to guide geological storage decisions where not only estimates of the maximum amount of CO2 that can be physically stored is required, but also how much of that CO2 is actually economically stored, under different gas credits assumptions.
IEA Weyburn CO2 Monitoring and Storage Project
13 of 19
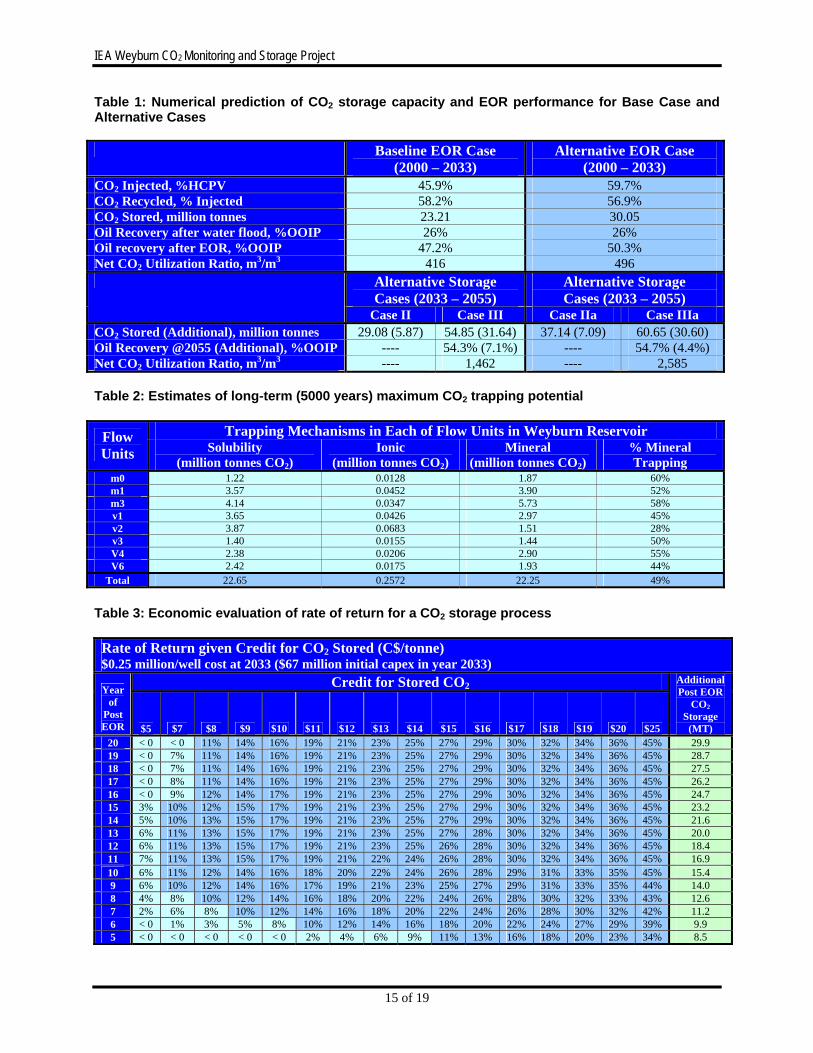
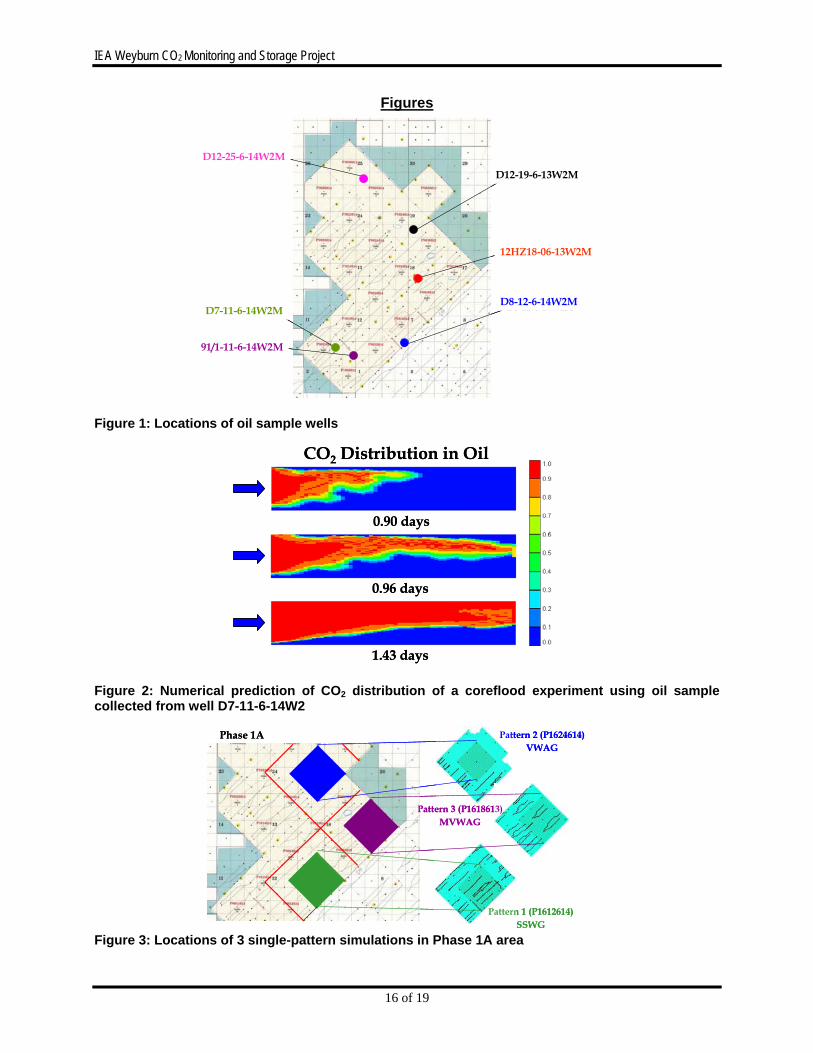
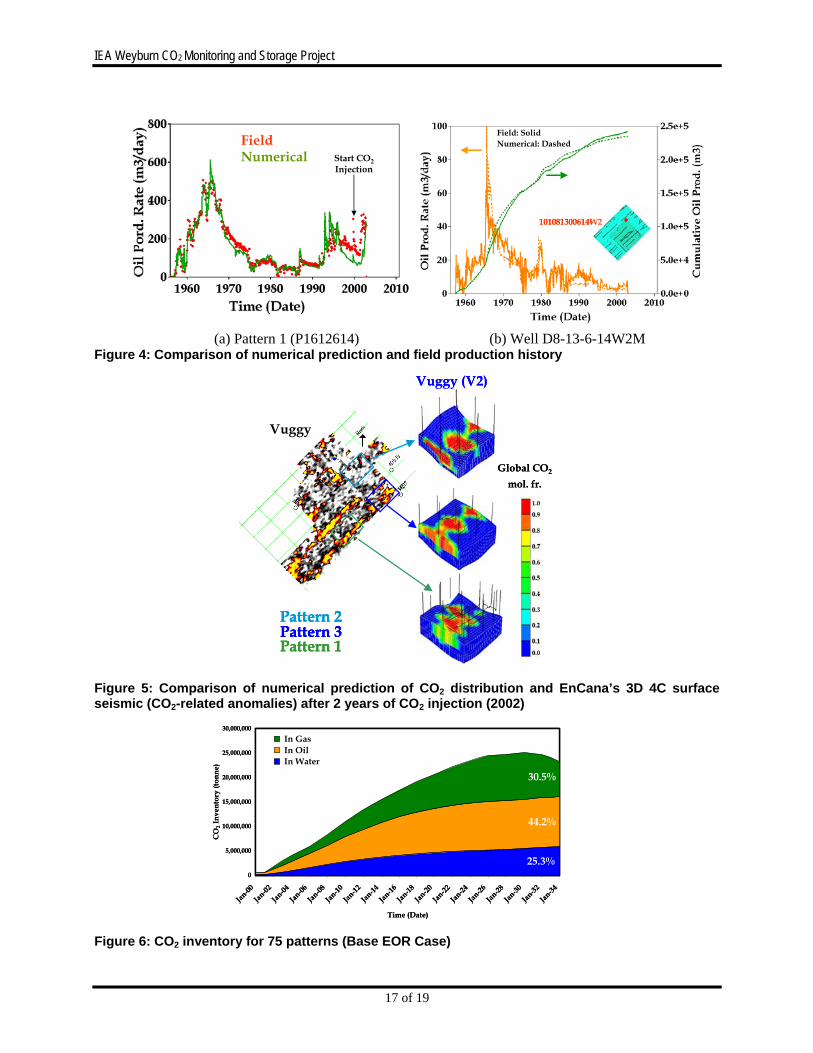
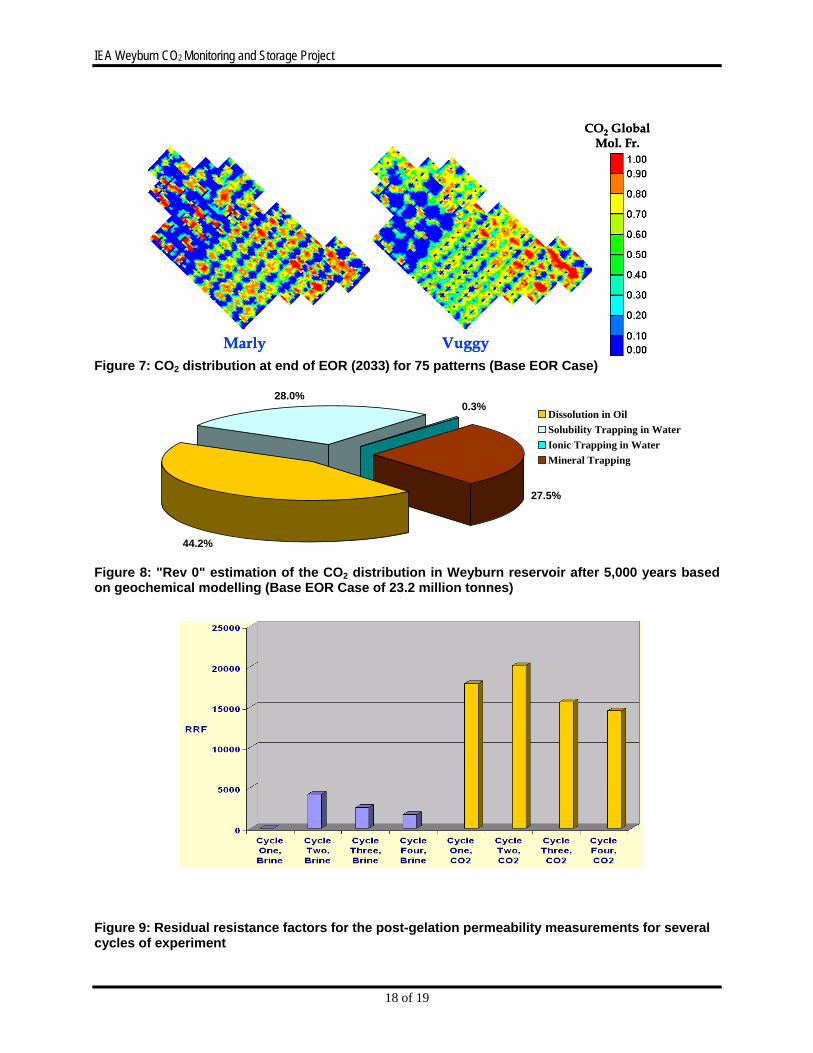
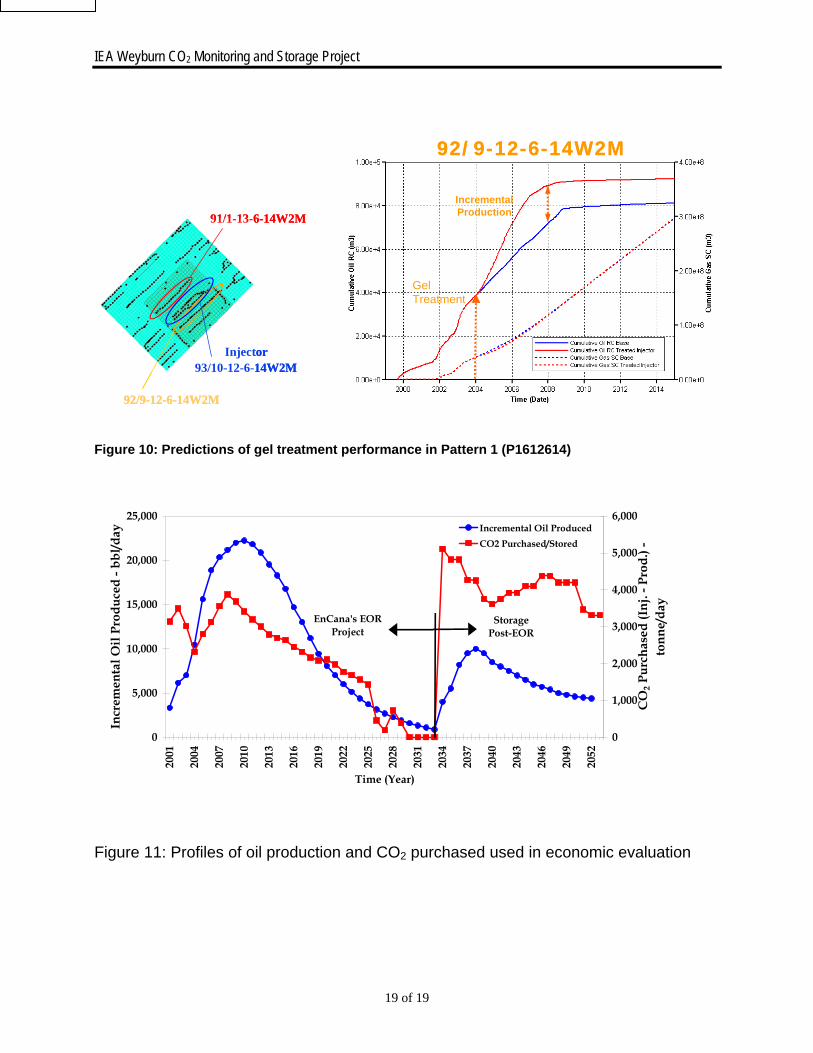
Results and Conclusions Figure 1 shows locations of the oil sample wells in the Phase 1A area. All oil samples have densities ranging from 858 to 903 kg/m3, which represent oil at the lightest end and near the field average, respectively. Based on the analysis of these oil samples, a 7-component PVT model (CO2; C1 & N2; C2, C3, & H2S; C4 to C6; C7 to C12; C12 to C30; and C30+) was developed and continuously fine-tuned. The measured oil properties such as viscosity, density, saturation pressure, gas-oil-ratio (GOR) and minimum miscibility pressure (MMP), agreed well with predictions from the PVT model. Viscous fingering was found to be a dominant mechanism in the core floods as shown in Figure 2. Further validation of the simulation model was carried out in 3 detailed fine-grid single-pattern simulations in the Phase 1A area as shown in Figure 3. Examples for successful history-match of the field production histories are shown in Figure 4 for a full pattern and an individual well, respectively. Figure 5 shows qualitative comparison between numerical prediction of CO2 distribution and seismic observation. Predictions were then made for the CO2 distribution and storage capacity at the end of EOR (2033) for these single patterns with different CO2 injection strategies of SSWG, VWAG and MVWAG. This final CO2 distribution at the end of EOR provided the initial conditions for the risk analysis model of the geosphere to assess the potential CO2 leakage and migration, including from near wellbore zones. Fine-grid single-pattern simulations were up-scaled to coarse-grid simulations of the same patterns. The three coarse-grid single-pattern simulations were used as building blocks to carry out simulations of the entire 75 patterns. Figures 6 and 7 show the CO2 inventory and CO2 distribution at the end of EOR (2033), respectively for the entire 75 patterns, following EnCana’s field operating guidelines as closely as possible. It is found that an estimated of 23.2 million tonnes (MT) of CO2 can be stored in the reservoir at the end of EOR, of which 7.08 MT (30.5%), 10.25 MT (44.2%) and 5.87 MT (25.3%) would be stored in the gaseous, oleic and aqueous phases, respectively. Performance of alternative EOR and CO2 storage cases are shown in Table 1. Alternative CO2 storage cases II and IIa consider continuous injection of CO2 after EOR with all the production wells shut-in until the reservoir reaches the maximum pressure of 29.5 MPa. Alternative CO2 storage cases III and IIIa consider continuous injection of CO2 after EOR with production wells shut-in when GOR exceeds 1,500 m3/m3. Detailed mineralogy of the Weyburn reservoir is provided from microscopic examination, X-Ray Diffraction (XRD) results, and LPNORM analysis of approximately 100 samples that establish the presence and abundances of minerals for each of EnCana’s reservoir flow unit. Results show that even in a carbonate reservoir such as at Weyburn, silicate minerals are present in sufficient quantity to react with CO2-charged fluid. Using estimates of the porosity and the volume of each of the flow units and the reactions determined through the geochemical modeling, the maximum potential amount of trapping in each flow unit can be estimated as shown in Table 2. Integrating these results over the entire reservoir yields a total of approximately 45.15 MT with 22.65 MT, 0.25 MT and 22.25 MT of CO2 potentially stored through solubility, ionic and mineralogical trapping mechanisms, respectively. The most critical assumptions in this calculation are that there is sufficient supercritical CO2 for reaction in each of the flow units and that complete/significant reaction of the silicate minerals will occur over 5,000 years. Subject to the assumptions inherent in this approach, the reservoir simulation estimates of CO2 distribution in the reservoir can be combined with the geochemical modeling long-term reactions to obtain a "Rev 0" estimate of the CO2 distribution in the Weyburn reservoir after 5,000 years. Based on the CO2 storage capacity of 23.2 MT for the Base Case, approximately 10.25 MT will be in the oleic phase, 6.50 MT and 0.07 MT through solubility and ionic trappings in the aqueous phase, respectively and 6.38 MT through mineral trapping as shown in Figure 8. There will not be a free supercritical CO2 gas phase present in the reservoir after 5000 years. Conformance control experiments indicated that gel systems developed for Weyburn are able to block the flow of both water and CO2 very effectively. Therefore, gel treatments can be considered a viable option for improving CO2 conformance in the Weyburn field. Figure 9 shows the residual resistance factor (RRF), a measure of the degree of reduction in original permeability to the injected water and CO2 after gel placement. In selecting well candidates, 20 high GOR wells were identified out of 600 wells. Reservoir simulation was used to design a gel placement field trial involving a horizontal injection well in Pattern 1 (P1612614). The simulation predicted the performance of two near-by horizontal producers. A total pore
IEA Weyburn CO2 Monitoring and Storage Project
14 of 19
volume (PV) of 80,000 m3 was assumed to be treated with 1,000 m3 gel, as gel placement is limited to fractures which are approximately 1% PV. Such a gel treatment would cost CA$200,000 to $500,000. Figure 10 shows predicted oil and gas production rates for one of the production wells before and after the gel treatments. The simulation indicated an incremental oil recovery of 20,000 m3 corresponding to a 10% increase in oil recovery without a gel treatment. Based on additional void space available from the incremental oil recovery, an additional 28,000 tonnes of CO2 can be stored. If this preliminary estimate is extended over the entire field (75 patterns) and assuming a 10% increase in total oil recovery and that only 20% of the EOR patterns undergo gel treatments, it is estimated that an additional 1.83 MT of CO2 could be stored. A demonstration case of the Storage Economics Model is presented here. The case is predicated on continued CO2 injection in the Weyburn Unit past the economic limit of the EOR operation. The economic drivers, in this case, are the incremental oil recovered by the additional CO2 injected as well as the granting of gas credits. Figure 11, depicts the oil production rate and CO2 injection rate profiles for both the EOR and the post-EOR phases. The EOR phase allows 23.2 MT of CO2 to be physically and economically stored. The post-EOR phase allows for up to an additional 31.6 MT of CO2 to be physically stored. However, the portion of the 31.6 MT that can be economically stored will depend on the amount of the CO2 credits received and the desired rate of return for the operation, Table 3.
IEA Weyburn CO2 Monitoring and Storage Project
15 of 19
Table 1: Numerical prediction of CO2 storage capacity and EOR performance for Base Case and Alternative Cases Baseline EOR Case
(2000 – 2033) Alternative EOR Case
(2000 – 2033) CO2 Injected, %HCPV 45.9% 59.7% CO2 Recycled, % Injected 58.2% 56.9% CO2 Stored, million tonnes 23.21 30.05 Oil Recovery after water flood, %OOIP 26% 26% Oil recovery after EOR, %OOIP 47.2% 50.3% Net CO2 Utilization Ratio, m3/m3 416 496
Alternative Storage Cases (2033 – 2055)
Alternative Storage Cases (2033 – 2055)
Case II Case III Case IIa Case IIIa CO2 Stored (Additional), million tonnes 29.08 (5.87) 54.85 (31.64) 37.14 (7.09) 60.65 (30.60) Oil Recovery @2055 (Additional), %OOIP ---- 54.3% (7.1%) ---- 54.7% (4.4%) Net CO2 Utilization Ratio, m3/m3 ---- 1,462 ---- 2,585 Table 2: Estimates of long-term (5000 years) maximum CO2 trapping potential
Trapping Mechanisms in Each of Flow Units in Weyburn Reservoir Flow Units Solubility
(million tonnes CO2) Ionic
(million tonnes CO2) Mineral
(million tonnes CO2) % Mineral Trapping
m0 1.22 0.0128 1.87 60% m1 3.57 0.0452 3.90 52% m3 4.14 0.0347 5.73 58% v1 3.65 0.0426 2.97 45% v2 3.87 0.0683 1.51 28% v3 1.40 0.0155 1.44 50% V4 2.38 0.0206 2.90 55% V6 2.42 0.0175 1.93 44%
Total 22.65 0.2572 22.25 49%
Table 3: Economic evaluation of rate of return for a CO2 storage process Rate of Return given Credit for CO2 Stored (C$/tonne) $0.25 million/well cost at 2033 ($67 million initial capex in year 2033)
Credit for Stored CO2 Year of
Post EOR $5 $7 $8 $9 $10 $11 $12 $13 $14 $15 $16 $17 $18 $19 $20 $25
Additional Post EOR
CO2 Storage
(MT) 20 < 0 < 0 11% 14% 16% 19% 21% 23% 25% 27% 29% 30% 32% 34% 36% 45% 29.9 19 < 0 7% 11% 14% 16% 19% 21% 23% 25% 27% 29% 30% 32% 34% 36% 45% 28.7 18 < 0 7% 11% 14% 16% 19% 21% 23% 25% 27% 29% 30% 32% 34% 36% 45% 27.5 17 < 0 8% 11% 14% 16% 19% 21% 23% 25% 27% 29% 30% 32% 34% 36% 45% 26.2 16 < 0 9% 12% 14% 17% 19% 21% 23% 25% 27% 29% 30% 32% 34% 36% 45% 24.7 15 3% 10% 12% 15% 17% 19% 21% 23% 25% 27% 29% 30% 32% 34% 36% 45% 23.2 14 5% 10% 13% 15% 17% 19% 21% 23% 25% 27% 29% 30% 32% 34% 36% 45% 21.6 13 6% 11% 13% 15% 17% 19% 21% 23% 25% 27% 28% 30% 32% 34% 36% 45% 20.0 12 6% 11% 13% 15% 17% 19% 21% 23% 25% 26% 28% 30% 32% 34% 36% 45% 18.4 11 7% 11% 13% 15% 17% 19% 21% 22% 24% 26% 28% 30% 32% 34% 36% 45% 16.9 10 6% 11% 12% 14% 16% 18% 20% 22% 24% 26% 28% 29% 31% 33% 35% 45% 15.4 9 6% 10% 12% 14% 16% 17% 19% 21% 23% 25% 27% 29% 31% 33% 35% 44% 14.0 8 4% 8% 10% 12% 14% 16% 18% 20% 22% 24% 26% 28% 30% 32% 33% 43% 12.6 7 2% 6% 8% 10% 12% 14% 16% 18% 20% 22% 24% 26% 28% 30% 32% 42% 11.2 6 < 0 1% 3% 5% 8% 10% 12% 14% 16% 18% 20% 22% 24% 27% 29% 39% 9.9 5 < 0 < 0 < 0 < 0 < 0 2% 4% 6% 9% 11% 13% 16% 18% 20% 23% 34% 8.5
IEA Weyburn CO2 Monitoring and Storage Project
16 of 19
Figures
Figure 1: Locations of oil sample wells
Figure 2: Numerical prediction of CO2 distribution of a coreflood experiment using oil sample collected from well D7-11-6-14W2
Figure 3: Locations of 3 single-pattern simulations in Phase 1A area
D12-25-6-14W2M
D12-19-6-13W2M
12HZ-18-6-13W2M
D8-12-6-14W2MD7-11-6-14W2M
91/1-11-6-14W2M
D12-25-6-14W2M
D12-19-6-13W2M
12HZ-18-6-13W2M
D8-12-6-14W2MD7-11-6-14W2M
91/1-11-6-14W2M
D12-25-6-14W2M
D12-19-6-13W2M
D8-12-6-14W2MD7-11-6-14W2M
12HZ18-06-13W2M
91/1-11-6-14W2M
0.90 days
0.96 days
1.43 days
CO2 Distribution in Oil
0.90 days
0.96 days
1.43 days
CO2 Distribution in Oil
Pattern 2 (P1624614)VWAG
Pattern 1 (P1612614)SSWG
Pattern 3 (P1618613)MVWAG
Phase 1A Pattern 2 (P1624614)VWAG
Pattern 1 (P1612614)SSWG
Pattern 3 (P1618613)MVWAG
Phase 1A
IEA Weyburn CO2 Monitoring and Storage Project
17 of 19
(a) Pattern 1 (P1612614) (b) Well D8-13-6-14W2M Figure 4: Comparison of numerical prediction and field production history
Figure 5: Comparison of numerical prediction of CO2 distribution and EnCana’s 3D 4C surface seismic (CO2-related anomalies) after 2 years of CO2 injection (2002)
Figure 6: CO2 inventory for 75 patterns (Base EOR Case)
Field Numerical Start CO2
Injection
Pattern 1Field Numerical Start CO2
Injection
Pattern 1Field Numerical Start CO2
Injection
Pattern 1Field Numerical Start CO2
Injection
Pattern 1 Field: SolidNumerical: Dashed
101081300614W2
Field: SolidNumerical: Dashed
101081300614W2101081300614W2
Pattern 2Pattern 3Pattern 1
Global CO2
mol. fr.
Vuggy
Vuggy (V2)
Pattern 2Pattern 3Pattern 1
Pattern 2Pattern 3Pattern 1
Global CO2
mol. fr.
Vuggy
Vuggy (V2)
0
5,000,000
10,000,000
15,000,000
20,000,000
25,000,000
30,000,000
Jan-00
Jan-02
Jan-04
Jan-06
Jan-08
Jan-10
Jan-12
Jan-14
Jan-16
Jan-18
Jan-20
Jan-22
Jan-24
Jan-26
Jan-28
Jan-30
Jan-32
Jan-34
Time (Date)
CO
2 Inv
ento
ry (t
onne
)
In Gas In Oil In Water
25.3%
44.2%
30.5%
0
5,000,000
10,000,000
15,000,000
20,000,000
25,000,000
30,000,000
Jan-00
Jan-02
Jan-04
Jan-06
Jan-08
Jan-10
Jan-12
Jan-14
Jan-16
Jan-18
Jan-20
Jan-22
Jan-24
Jan-26
Jan-28
Jan-30
Jan-32
Jan-34
Time (Date)
CO
2 Inv
ento
ry (t
onne
)
In Gas In Oil In Water
25.3%
44.2%
30.5%
IEA Weyburn CO2 Monitoring and Storage Project
18 of 19
Figure 7: CO2 distribution at end of EOR (2033) for 75 patterns (Base EOR Case)
Figure 8: "Rev 0" estimation of the CO2 distribution in Weyburn reservoir after 5,000 years based on geochemical modelling (Base EOR Case of 23.2 million tonnes)
Figure 9: Residual resistance factors for the post-gelation permeability measurements for several cycles of experiment
CO2 Global Mol. Fr.
Marly Vuggy
CO2 Global Mol. Fr.
Marly Vuggy
44.2%
28.0%0.3%
27.5%
Dissolution in OilSolubility Trapping in WaterIonic Trapping in WaterMineral Trapping
IEA Weyburn CO2 Monitoring and Storage Project
19 of 19
Figure 10: Predictions of gel treatment performance in Pattern 1 (P1612614)
Figure 11: Profiles of oil production and CO2 purchased used in economic evaluation
91/1-13-6-14W2M
92/9-12-6-14W2M
93/10-12-6-14W2MInjector
91/1-13-6-14W2M
92/9-12-6-14W2M
93/10-12-6-14W2MInjector
GelTreatment
IncrementalProduction
GelTreatment
IncrementalProduction
92/9-12-6-14W2M
GelTreatment
IncrementalProduction
GelTreatment
IncrementalProduction
92/9-12-6-14W2M
0
5,000
10,000
15,000
20,000
25,000
2001
2004
2007
2010
2013
2016
2019
2022
2025
2028
2031
2034
2037
2040
2043
2046
2049
2052
Time (Year)
Incr
emen
tal O
il Pr
oduc
ed -
bbl/d
ay
0
1,000
2,000
3,000
4,000
5,000
6,000
CO
2 Pur
chas
ed (I
nj. -
Pro
d.) -
to
nne/
day
Incremental Oil ProducedCO2 Purchased/Stored
EnCana's EOR Project
Storage Post-EOR
r)