Embed Size (px)
Citation preview
7996 Macromolecules 1996,28, 7996-8005
Phase Separation of Ternary Mixtures: Symmetric Polymer Blends
C. Huang,*9+ M. Olvera de la Cruz,t'S and B. W. Swift? Department of Materials Science and Engineering, Northwestern University, Evanston, Illinois 60208, and CEA Service de Chimie Moleculaire, CE-SACLAY, 91191 Gif sur Yvette Cedex, France
Received April 11, 1995; Revised Manuscript Received July 31, 1995@
ABSTRACT: The dynamics of phase separation of ternary mixtures into two and three phases are analyzed numerically by solving the nonlinear spinodal decomposition equations in two dimensions. We find interesting interface effects during the decomposition process. Between any two a + p phases rich in components I and J respectively, the third component K segregates in the interface between a and /3. We study the interface segregation effects in symmetric ternary polymer blends (Le., with equal Flory interaction parameters between each pair of monomers and equal degrees of polymerization). This segregation phenomenon influences strongly the growth of a third phase with lowest equilibrium volume fraction. In the absence of hydrodynamics, the kinetics of the minority phase is determined by the topology of the segregation pattern initiated by the decomposition of the most unstable phases. Coarsening of the minority phase occurs a t the junction of four or more majority phase domain boundaries. We examine the dynamical scaling and the growth laws for the late stages of separation into two and three phases. The growth law R(t) - t1I3 is always obeyed even when the structures are not self-similar. The self- similar regime is achieved very slowly in ternary systems.
I. Introduction For many years blending polymers with a high degree
of polymerization has been of commercial interest since it may lead to new materials with more favorable performance than the pure components. Most polymer mixtures are immiscible leading to the formation of multiple phases. Therefore it is important to study the phase behavior for polymer blends. While phase sepa- ration has been extensively studied in binary systems,l only a few studies exist in multicomponent system^.^,^ In this paper we describe phase separation in ternary polymer blends.
We study immiscible blends of long, highly flexible molecules, which obey Gaussian statistics in the molten states4 We construct the free energy of the blends using the simplest mean field model, the Flory-Huggins-de Gennes free energy, which de Gennes pointed out describes properly immiscible high degree of polymer- ization polymer blend^.^>^ The immiscibility between components I and J in polymer blends is described by the Flory interaction parameter, XIJ, which is generally positive and favors segregation. For example, above a critical value of XB = 21N a symmetric A-B bindary system of degree of polymerization N separates into two phase^.^,^ When a system is unstable against infini- tesimal fluctuations in composition, the separation process is termed spinodal decomposition.
The phase behavior of ternary polymer blends, how- ever, is more complicated. These systems can decom- pose into two or three phases. In this paper we study the kinetics of phase separation when the mixture decomposes into two and three phases. We find that between any two phases rich in components I and J, the third component K segregates in the interface, even when the equilibrium composition of the third compo- nent K is equal in both phases. This interface segrega- tion phenomenon influences the decomposition patterns into two and three phases in ternary systems.
' Northwestern University. * CEA Service de Chimie Moleculaire. @ Abstract published in Advance ACS Abstracts, November 1,
1995.
0024-9297/95/2228-7996$09.00/0
We also explore the dynamical scaling and the growth behaviors in ternary systems, which have been widely accepted in binary systems. In binary systems the decomposition pattern into two phases is generally bicontinuous. The resulting structure is self-simi1ar.l The structure function S(k,t), accessible by the scatter- ing radiation experiments, scales as (R(z)IdG(kR(z)) where R(z) is associated with the domain size, d is the space dimensionality, and G is a function independent of time. The bicontinuous structure coarsens asymp- totically in time according to the growth law R - z1I3. Recently this universality in the scaling and the growth behaviors was observed in ternary mixtures with sym- metric compositions, i.e., PI= l13, I = A, B, C, decompos- ing into three phase^.^ In these systems, however, the segregation of the third component along the interface was not observed. Here we find that even when there is segregation along the interface, the growth law is always obtained, the scaling regime, however, is reached in the very late stages of the decomposition process.
For simplicity, we study symmetric A-B-C ternary polymer blends, i.e., XAB = XBC = XAC = x and N A = N B = Nc = N. We numerically solve the nonlinear diffusion equations during spinodal decomposition, extending the method used to study binary systemsg to ternary blends. In section I1 we outline the mean field thermodynamics of ternary polymer blends, from which the phase dia- grams for symmetric ternary polymer blends are con- structed. In section I11 the dynamic model and the tech- niques for numerically solving the diffusion equations are described. The decomposition patterns are given and discussed in section N.a, and the dynamical scaling and the growth laws are investigated in section N.b. The conclusions of our studies are given in section V.
11. Thermodynamic Analysis The Flory-Huggins-de Gennes mean field free en-
ergy per site of an A-B-C ternary polymer blend is given by
0 1995 American Chemical Society

Macromolecules, Vol. 28, No. 24, 1995 Phase Separation of Ternary Mixtures 7997
The phase diagrams and the spinodal curves for symmetric ternary polymer blends, AB = XBC = XAC = x and N A = NB = Nc = N , calculated using eqs 11.3 and 11.5 are shown in ABC composition triangles for differ- ent xN values. The I-th corner in the triangle repre- sents a system of 100% of component I. For xN < 2, the ternary system is homogeneous at any composition (@A,@B,@c) in the triangle ABC. A typical ternary phase diagram for 2 5 xN < 2.57 is given in Figure l a where xN = 2.4. In the diagram the A-rich, B-rich, and C-rich phases are labeled as a, ,!?, and y , respectively, and the one-phase region around the center of the composition triangle is labeled as 6. As xN increases from 2.0 to 2.57 we find three lines of critical points given by WxN, VxN, 1-2/xN)1, [l -2/xN),l/xN, VxN , and WXN, 1 - 2/xN),l/xNl. We show the three critical points at xN = 2.4 in Figure la; they are determined by the inter- section of the spinodal lines with the coexistence curves in each a + ,!?, ,!? + y , and a + y region. The tie lines, which give the equilibrium compositions in the two- phase regions, are parallel to the I-J axis. For example, for any composition along the DE line the equilibrium compositions are given by D = (@i,@&@c), and E =
When xN > 2.57 three-phase regions appear in the phase diagrams. There are six three-phase regions shown inside small triangles in Figure l b where xN = 2.65. As expected by phase rules, each three-phase region is separated from the single phase regions by the two-phase regions on the right and left of each small triangle. These six new two-phase regions each have a critical point (as xN increases, they generate six lines of critical points emerging from the critical points at xN = 2.57). For example, for any initial composition inside the triangle HKL, with equilibrium compositions given by H = (@i,@i,@E), K = (&,q{,&, and L = (@:,@;,@:), the left and right of the triangle HKL are a + 6 and /3 + 6, respectively. When xN = 8/3, the critical lines of a + 6, ,!? + 6, and y + 6 join at (0.5, 0.25, 0.25), (0.25, 0.5, 0.251, and (0.25, 0.25, 0.51, respectively as shown in Figure IC. For xN > 8/3 these two-phase regions overlap and all the critical points disappear as shown in Figure Id for X N = 2.7. When xN is 2.7456, the three-phase regions shown in Figure Id touch at the center of the ABC triangle (see Figure le). For xN > 2.7456 they overlap leading to a single interior a, p, and y three-phase triangle with equilibrium composi- tions given by the points X, Y, and Z shown in Figure If where xN = 3.0.
We analyze systems which are symmetric in A and B, i.e., systems along a line perpendicular to the A-B axis such as points 1, 2, and 3 in Figure Id, and points 4 and 5 in Figure If. In ternary systems with @A = @B, it is convenient to expand the free energy Afi in two order parameters ql(r) and q2(r) given by
(II.7a)
yj2(r) = &A(r) + d q B ( r ) (II.7b)
with @ = @A + @B, f = @A/@, and 6 q d r ) = &) - @I. $ ~ 2 ( r ) = 0 if C is homogeneous. If we expand Afi in terms
(11.8)
where rll = [@/f(l - flNl - 2g2x and T22 = [l/@(l - @)N] + (Zf(1 - f , - 2 ) ~ . The signs of the coefficients rll and r22 determine the instability of the formation
(&,(7g,@c).
ql(r) = 1-f - 6qA(r) - =6qB(r) f v1 q
o f q l and q 2
Afi 0~ rlly$ + T 2 2 ~ i + (higher order terms)
where Af. is the regular solution model free energy per site. Afi is a functional of the local compositions of component I, pl(r), I = A, B, and C,
Q)A In q A + Q)B In Q)B + q C In 9 C + XABQ~AQ~B + k,T= N A NB NC XBCVBQ)C + X A C ~ A V ~ C (II.lb)
where NI is the degree of polymerization of component I, I = A, B, C. The blend is assumed to be incompress- ible: qA(r) + q&) + qc(r-1 = 1. The gradient energy term coefficients iT11 in blends are computed using the Random Phase Approximation:lo
211 = k,T(U2/36@1) (11.2)
where a is the monomer size and @I is the mean composition of I in the whole system.ll (For simplicity KII is assumed to be independent of the local composition pI(r), this approximation, however, does not affect the results obtained here.12)
The equilibrium state of the system is determined by equating the chemical potential of each component I, p;, in the possible coexisting phases m, m = a, ,!?, y , including the mass conservation laws, i.e.,
po,I - ,u.,~) I = A, B, C (II.3a)
(II.3b)
where vm is the volume fraction of phase m and @? is the mean composition of I in the m phase. The chemical potential is defined as the change of the total free energy AFo with respect to the number of component I, n ~ , without the gradient energy terms,
a - P - v
PI = vat$ + #d(+ v'@,f) I = A, B, C
am. F , I = an,
It has the form of (see Appendix A)
(II.4a)
JsI
(I t K # L, I, J, K' = A, B, C )
For ternary systems the spinodal curves (the limits of instability of the homogeneous phase) are determined by13
fM f4B = o IfBA f B B 1 (11.5)
with
f - (- a - -)(- a a - -)Afi a I, J = A , B (I1.6a) I J - aq1 a q C aFJ a q C
By eqs II.lb and II.6a

7998 Huang et al. Macromolecules, Vol. 28, No. 24, 1995
a C h
A B
d C
b
e C A
C C
B
C A f
Figure 1. The phase diagrams of symmetric ternary systems for (a) xN = 2.4, (b) xN = 2.65, (c) xN = 8/3, (d) xN = 2.7, (e) xN = 2.7456, and (f') xN = 3.0. The symbols (- - -) and (- - -) correspond to the spinodal curves and the tie lines, respectively.
of a + p and y , respectively. At point 1 in Figure Id the system has composition (0.25,0.25,0.5) and it is unstable t o the formation of y and 6 with S = (0.202,0.202,0.596) and T = (0.298,0.298,0.404), respec- tively (rll > 0; r 2 2 < 0). At point 2 the composition is (0.45,0.45,0.1) and the system is unstable to the forma- tion of a and p with compositions U = (0.7539,0.1461,0.1) and V = (0.1461,0.7539,0.1), respectively (I'll < 0; r22 > 0). At point 3 the system has composition (0.4,0.4,0.2) and is unstable to the formation of two majority a + p phases, and metastable to the formation of one minority 6 phase with equilibrium compositions N = (0.6107,0.2033,0.186), 0 = (0.2033,0.6107,0.186), and P = (0.3636,0.3636,0.2728), respetively (I'll < 0; T22 > 0). Finally systems at points 4 and 5 in Figure If of compositions (0.4,0.4,0.2) and (0.25,0.25,0.5), re- spectively, form a, p, and y phases with compositions X = (0,811,0.0945,0.0945), Y = (0.0945,0.811,0.0945), and Z = (0.0945,0.0945,0.811), respectively. System 4 is unstable to the formation of a + ,8 and meta stable to the formation of y (rll < 0; r22 > 0); while system 5 is metastable to the formation of a + ,B and unstable to the formation of y (rll > 0; r 2 2 < 0).
where M I is the Onsager coefficient of I. p: is deter- mined including the compositional gradient terms in Af (see Appendix B). We ignore the thermal fluctuations because they are negligible for quenches far away from the critical points and/or spinodal lines,14 where the driving force for phase separation is much larger than the thermal fluctuations.
In constructing the nonlinear diffusion equation for polymer blends, two theories have been used, one proposed by de Gennes,6 and the other by Kramer et al.15 We adopt the results of Kramer et al. who propose that there is a net vacancy flux during the diffusion process with the constraint of local thermal equilibrium of vacancies, which has been shown16 to agree better with experiments.17 The net flux of each component I, SI, is equal to
JI = JI + 9IJV (III.3a)
where JV is the vacancy flux,
111. Dynamic Model and Numerical Methods
by a continuity equation
We eliminate the variable qc(r,t) using the incompress- ibility condition and use the Gibbs-Duhem relationship locally, EI=A,B,c@'J d&
The kinetics of spinodal decomposition are described 0; eqs 111.1 become
apj,/at = -vJI I = A, B, -[q~(T',t)] a = M11V2(/49,1 - p:,, - 2K11V2Vj, - 2K1jV2qj) + at where the flux is proportional to the gradient of the M,jV2(p9,j - p?,c - 2Kjlv2V1 - 2KjjV2~j) chemical potential of I per site p; , I f J; I, J = A, B (111.4)
where p:.I = aAfi./aqI is given in eq A.5 J, = -MIVp; (111.2)

Macromolecules, Vol, 28, No. 24, 1995 Phase Separation of Ternary Mixtures 7999
KII = + K C C , I = A, B, and KAB = KBA = K C C , given in eq 11.2. In long polymer blends the mobility is given byls
(111.6)
where D, is the diffusion coefficient of monomers, and Ne is the effective number of monomers per entangle- ment length.
We solve eqs 111.4 in terms of dimensionless param-
reduced mIJ = MIJ/M and PIJ = KIJ/K, where M = (1/4N)- (DoNdkBT) and K = kBT (4a2/36). The eqs 111.4 in dimensionless forms are solved using the finite-differ- ence method for the spatial and the temporal deriva- t i v e ~ . ~ The values of Ax and AT are chosen to simulate continuous dynamics avoiding artificial numerical slow- ing down effects. (Since according to eqs 111.4 the local compositions p ~ ( r , t ) , I = A, B, and C, will evolve in time provided that there is a gradient in composition, the interfacial thickness should be larger than Ax.) The simulations are done in 2D. We have considered a square lattice with L2 grids, L = 64. The periodic boundary conditions have been used to avoid surface effects. Since the initial high temperature state is a homogeneous mixture, the initial compositions p~ and I ~ B for each grid are chosen to be uniformly random number distributed in the interval [ q A - v , q A + v ] and [ & B - v , q B + v I , respectively. We choose 7 = 0.01 here. We have run 10 times from t = 0 up to t = 2 x lo4 and 10 runs are averaged. Each run is started from a different random seed (i.e., a different initial composi- tion field over the same average fluctuation). For systems 2-5 in Figure 1, parts d and f, a time step AT = 0.01 and a grid size Ax = 1.2. Since for system 1 in Figure Id the equilibrium interfaces are broader, we choose a larger grid size, Ax = 1.6, and a time step A t = 0.02.
eters, x = ( k ~ T / 2 ~ N ) l / ~ r and t = M(k~T)~t/zKw, and
IV. Results and Discussion
Il7.a. Decomposition Patterns. The density maps of components A, B, and C for systems 1-5 are shown in Figures 2-6. In Figures 3-6, the local composition p1 from 0.0 to 1.0 is represented as from purely white to purely red, green, and blue for I = A, B, and C, respectively. In Figure 2 for system 1 the color from completely white to completely red represents the local composition p~ from minimum to maximum at that snapshot, and the same for p ~ , and qc, rather than using actual composition colors.
The density maps of A, B, and C as a function of time during spinodal decomposition for system 1 in Figure Id are shown in Figure 2, parts a, b, and c, respectively. As time increases, the A-rich and B-rich regions are always identical; the system separates into A-B-rich and C-rich phases with equal amount. In general the decomposition dynamics for a ternary system with = PB < @c in Figure Id are identical to the results for a symmetric binary system, Le., a ternary system with
@A = FB @C decomposes into a two-phase mixture in the same way as a symmetric binary system because A and B act like a single component of composition GA + @B.
On the other hand for system 2 in Figure Id where @A = @B > @c, the two-phase decomposition hnetics are more complicated. In Figures 3a and 3b we show that the spinodal decomposition occurs mainly along the direction to the A- and B-rich phases, and in Figure 3c we show the segregation of the minority component C in the interface between the A- and B-rich phases as a function of time. Even though the equilibrium composi- tion of C in both phases is predicted to be equal to the average composition of C, i.e., = = @c, we show here that the minority component C is not homogeneous. We find = @{ = @C - E and the composition of C at the center of the interface ip; > pc. In order to see if this is a finite size effect, we have run the simulation doubling the size of the system, i.e., with grids L2 = 128*128. We find that although E is smaller, qc; and the interfacial thickness 1 are almost the same as the values with L2 = 64*64. Therefore as L - -, E - 0 while pg and 1 tend to be size-independent constants. This shows the segregation of the minority component C in the interface should be observed.
For a flat interface one can show that a net decrease of the gradients at the interface provided by an excess of minority composition decreases the specific interfacial energy of the system u. In a flat interface between a and /3 of compositions and p:, u is given by the difference per unit area of interface between the actual free energy and that which it will have if the properties of the two phases were c o n t i n u o ~ s ~ ~
o = NVJ-:(Af? + .ifj’) dx (IV.1) I=A,B,C
where NV is the number of monomers per unit volume and
The composition of C is eliminated through the incom- pressibility constraint. An extremum of u is obtained solving simultaneously the resulting two Euler-Lagrange equations,20 which using the boundary conditions, A T and dp1Id.x tend to zero as x - f-, leads to
When the composition of the minority component C is a constant everywhere = qc, the composition profile pi(x) is an extremum of u. There are, however, many extrema of a; only the lowest minimum u will give the actual interface. In general, an infinitesimal excess in &x) can only be an extremum of u if it breaks the symmetry, ~ A ( x ) - @A = @B - ~ B ( x ) , i.e., for a nonselec- tive minority component, a profile pc(x) = 9 d - x ) with pdx) = q@) - &(x), I = A, B, must obey ~ A ( x ) * t o be able to minimize u. For example, in system 2 it is found numerically that ~ B ( x ) < 0 and 0 < /&&x)I < (A(z) when x < 0. With a linear expansion in &(x) of the

8ooo Huanget al. Macromolecules, Vol. 28, No. 24, 1995
. . ~ - . , . . Figure 2. The density maps as a function of time for (a) component A, (b) component B, and (e) component C of system 1 in Figure Id during the decomposition process. Rows 1 and 2 correspond to r = 800 and 7 = 20 000, respectively.
1 Figure 3. The density maps as a function of time for (a) component A, (b) component B, and (e) component C of system 2 in Figure Id during the decomposition pmeess. Rows 1 and 2 correspond to r = 400 and 7 = 10 000, respectively.
integrand in eq W.1 we find that &(x) t 0, I = A, or B, decreases u. Although the resulting profile is clearly not an extremum of u, it explains the interkce segrega- tion phenomenon observed.
The segregation of the minority component in the interface has a strong influence in the decomposition pattern of a ternary system unstable to the formation of two majority phases and metastable to the formation ofa minority phase. The dynamica of system 3 in Figure Id are shown in Figure 4, parta a, b, and c. The pattern is like that of system 2 with a thicker interface. The decomposition is driven by the instability of the system
to the formation of two majority a + p phases. Although there is segregation of the minority component C at the interface betwen a + p, it does not lead to the formation of the 6 minority phase. That is, it is not possible to distinguish a third phase from the interface in Figure 4, parts a, b, and c, because the interfacial thickness 1 is large and a growth of the 6 phase is not observed. Since the d phase is metastable, the formation of a nucleus of a critical size is required for the S phase to coarsen. The closer the initial compositions to &, the larger the critical nucleus. In the classical theory, this nucleus should be spherical (circular in 2D). Since

Macromolecules, Vol. 28, No. 24, 1995 Phase Separation of Ternary Mixtures 8001
Figure 4. The density maps as a hction of time for (a) component A, (b) component B, and (e) component C of system 3 in Figure Id during the demmposition process. Rows 1 and 2 mrrespond to r = 400 and 7 = 10 OOO, respectively.
the interface is rich in C, a spherical (or circular) nucleus forms only at the junction of the interfaces. For shallow quenches, however, the nucleus still cannot reach the critical size at these junctions. Therefore at this thermal energy we observe no coarsening of the third phase, and the segregation of C at the interface can be considered simply as increasing the interfacial thickness.
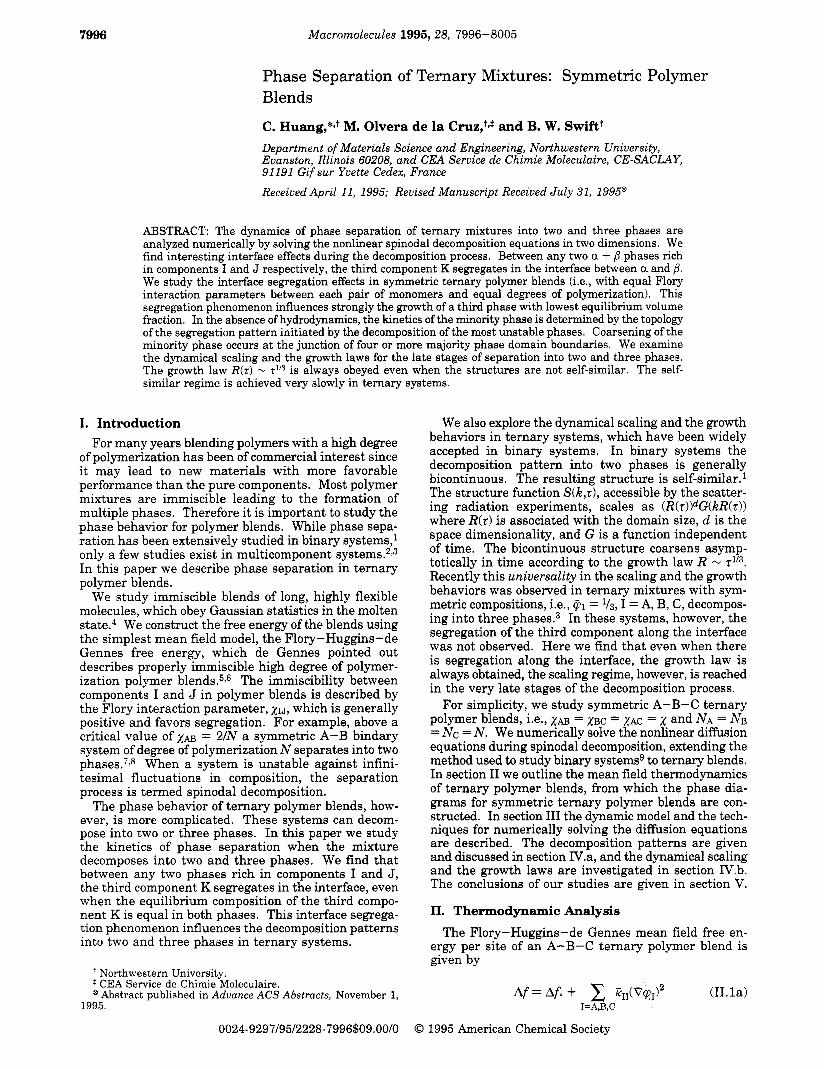
We study deeper quenches to determine ifthe minor- ity phase can coarsen. Since the interface is sharp for deep quenches and the critical size of the nucleus to grow is small, we expect that for low enough thermal energy, the minority phase should be distinguished from the interface in the region that separates the a and p majority phases and get coarsened. In Figure 5, parts a, b, and c, we show the density maps of A, B, and C for system 4 in Figure If as a function of time, respedively. As shown in Figure 5, parts a, b, and e, the decomposi- tion process occurs primarily along the direction to the A- and B-rich phases. As spinodal decomposition pro- ceeds, a and p phases get coarsened very quickly. One can observe that the coarsening of the third minority phase is only possible when a critical volume of the minority phase forms. The critical volume is achieved at the junction of four or five domains rich in the majority components. In this case, we observe in the later stages that between any two p + y phases rich in component I and J respectively the third component K segregates in the interface. For example in Figure 5a, A segregates in the interface between the B- and C-rich phases even though the C-rich phase has the lowest volume fraction. This segregation behavior of the third component in
the interface between any two phases rich in the other two components is also observed in the dynamics for systems with two minority components, PA = p~ < pc, metastable to the formation of a + j? and unstable to the formation of y, such as system 5 in Figure If. The dynamics of system 5 are shown in Figure 6, parts a, b, and c. One can observe that A and B act like one com-
ponent of composition p~ + p~ and the system separates into A-B- and C-rich phases for the initial decomposi- tion stages (z = 400). At larger times (2 = 1600) the @A + p~ rich regime decomposes into a + j? phases.
W.b. Scaling and Growth Behaviors. In ternary systems the structnre function of the various compo- nents SII(k,z), where the other two components are assumed to have identical atomic scattering factors, are computed to determine the growth law of the segregated domains during the decomposition,
SIl(k,z) = S&zY (N.4a) Ikl=k I l k '
with
where the sums are over all of the L2 grids, and is the $ave vector which belongs to the first Brillouin zone in the reciprocal space
k = (2dLn/L6z)2 (IV.5a) -
where -. e =(e,, e,) e,, ey = 0, i,2, ..., L - 1 (N.5b)
We compute the mean magnitude of the vector (k)u to determine the characteristic domain size Ulhr
@)I1 * W ) I I ( N . 6 4
with
(k)Il = z k S I l ( k , d / ~ S I I ( k , d (N.6b)
In Figure 7, parts a and b, we plot (R)cc vs zm and Scc(k,T)/@)ic vs k(R)cc for system 1 in Figure
8002 Huangetal. Macromolecules, Vol. 28, No. 24, 1995
. . .. . . . . . .
Figure 5. The density maps BS a function of time for (a) component A, ID, component B, and (e) component C of system 4 in Figure If during the d m m ~ i t i m pmeeas. Rows 1,2, and 3 correspond to z = 400, z = W, and z = 10 000, respectively.
Id, respectively. We find that Scc(k,r) scales as (R)&,G(k(R)m) and (Rh - ryg in the scaling regime. Clearly the same results as for component C are expected for the minority components A and B. It is not surprising that the dynamical scaling law and the growth law for each component hold in this ternary system deeomposing into two phases, because the dynamics are identical to the results for a symmetric binary system.
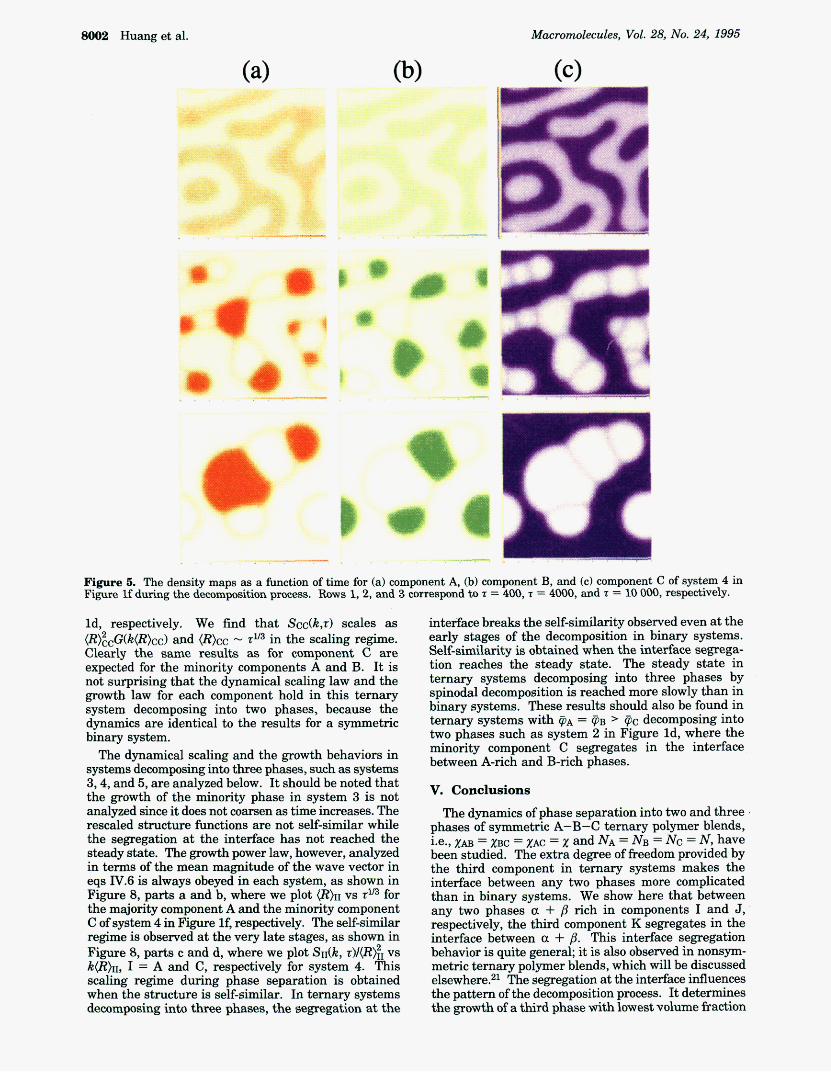
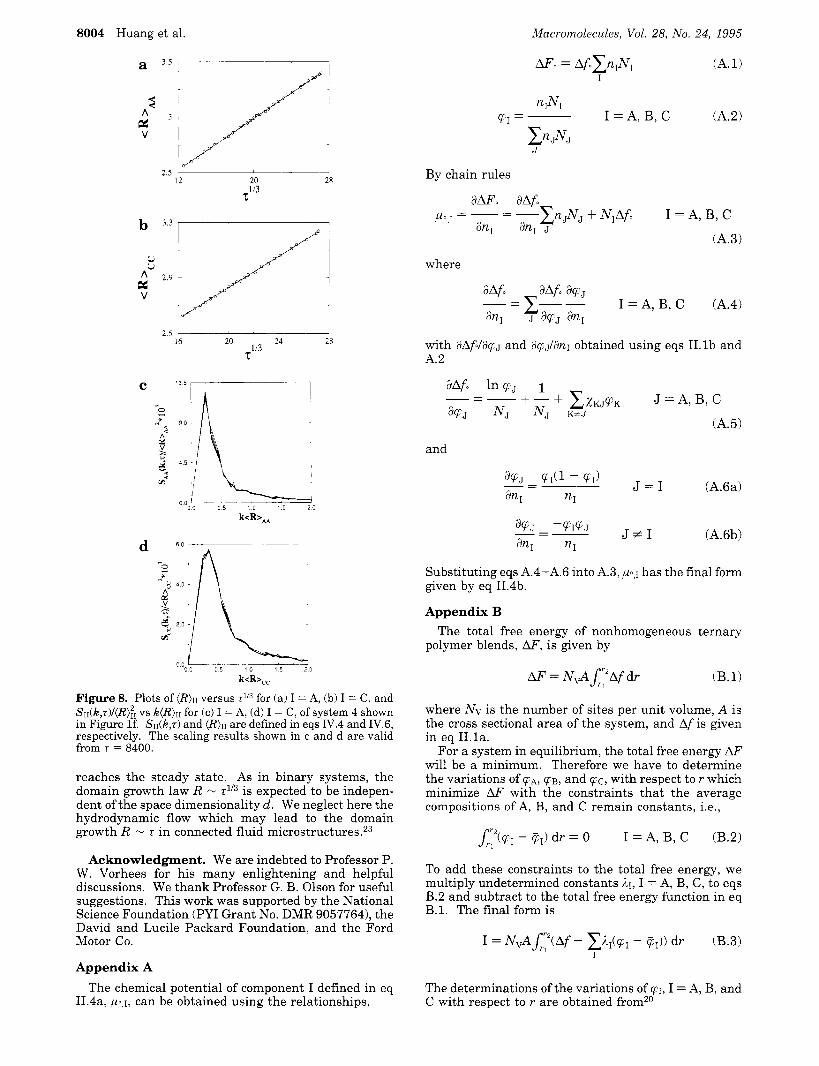
The dynamical scaling and the growth behaviors in systems decomposing into three phases, such as system 3,4, and 5, are analyzed below. It should be noted that the growth of the minority phase in system 3 is not analyzed since it does not warsen as time increases. The rescaled structure functions are not self-similar while the segregation at the interface has not reached the steady state. The growth power law, however, analyzed in terms of the mean magnitude of the wave vector in eqs lV.6 is always obeyed in each system, as shown in Figure 8, parta a and b, where we plot (R)n vs r* for the majority component A and the minority component C of system 4 in Figure lf, respectively. The self-similar regime is observed a t the very late stages, as shown in Figure 8, parts c and d, where we plot S d k , rX(R);; vs k(R)n, I = A and C, respectively for system 4. This scaling regime during phase separation is obtained when the structure is self-similar. In ternary system decomposing into three phases, the segregation at the
interface breaks the self-similarity obsemed even at the early stages of the decomposition in binary systems. Self-similarity is obtained when the interface segrega- tion reaches the steady state. The steady state in ternary systems decomposing into three phases by spincdal decompsition is reached more slowly than in binary systems. These results should also be found in ternary systems with FA = @ > @c decomposing into two phases such as system 2 in Figure Id, where the minority component C segregates in the interface between A-rich and B-rich phases.
V. Conclusions
The dynamics of phase separation into two and three phases of symmetric A-B-C ternary polymer blends, i.e., XB = ~c = XAC = x and NA = NB = Nc = N, have been studied. The extra degree of freedom provided by the third component in ternary systems makes the interface between any two phases more complicated than in binary system. We show here that between any two phases a + j3 rich in components I and J, respectively, the third component K segregates in the interface between a + j3. This interface segregation behavior is quite general; it is also observed in nonsym- metric ternary polymer blends, which will be discussed elsewhere.a1 The segregation at the intefice innuences the pattern of the decomposition process. It determines the gmwth of a third phase with lowest volume fraction

Macmnwlecules, Vol. 28, No. 24, 1995 Phase Separation of Temary M i x t w 8003
i
Figure 6. The dem.., 11~1 -4 a function of time for (a) wmponent A, (b) wmpent B, and (e) wmpnent C of sysEm 5 in Figure If during the demmposition process. Rows 1,2, and 3 correspond to r = 400, r = 1600, and z = 10 OOO, respectively.
-.
k < b m
Figure 7. plots of (a) (R)cc va r* and (b) Scc(k,rY(R)* vs k o c C of system 1 in Figure Id. Scc(k,r) and are de%& in eqa IV.4 and IV.6, respsctively. The scaling resulta shown in b arevalid from r = 4800.
and turns the warsening kinetics into a topological problem. In systems unstable to the formation of two majoriw phases and metastable to the formation of one
minority phase, the minority phase, formed a t the interface between two majority phases, does not coarsen when the interface is very broad, it can be considered simply as increasing the interfacial thickness between the two majority phases. When the thermal energy d e c r e e even further, since the interface is sharper in the later stages of the decomposition process, the minority phase cannot be considered any longer as thickening the interface but it appears as a new phase that separates these two majority phases. The coarsen- ing of a third phase rich in a minority component is not always observed. It can only coarsen at the junction of multiple majority phase domain boundaries in a biwn- tinuous patternaa for deeper quenches. In two dimen- sions the critical volume of the third phase required for its growth is achieved when four or more majority phase domain boundaries join. Therefore the incubation time for the minority phase growth is a function of the space dimensionality d. The segregation of a third component in the interface between two phases rich in the other components, however, is not expected to be a function of d in mixtures well described by mean field theories.
We find that ternary systems undergoing two-phase and three-phase separations always obey the growth law R - TW even when the decomposition patterns are not self-similar. Ternary systems, however, do reach a scaling regime at the very late stages, where the segregation of the third component in the interface
8004 Huang et al. Macromolecules, Vol. 28, No. 24, 1995
b 3.3
V
2.9 a: V
C
2 5 16 20 24 28
113 T
I35
00 0 0
Figure 8. Plots of (R)II versus 7ll3 for (a) I = A, (b) I = C, and SII(~,T)/(R);~ vs ~ ( R ) I I for (c) I = A, (d) I = C, of system 4 shown in Figure If. S I I ( ~ , ~ ) and (R)II are defined in eqs IV.4 and IV.6, respectively. The scaling results shown in c and d are valid from 7 = 8400.
reaches the steady state. As in binary systems, the domain growth law R - t1I3 is expected to be indepen- dent of the space dimensionality d. We neglect here the hydrodynamic flow which may lead to the domain growth R - T in connected fluid microstructure^.^^
Acknowledgment. We are indebted to Professor P. W. Vorhees for his many enlightening and helpful discussions. We thank Professor G. B. Olson for useful suggestions. This work was supported by the National Science Foundation (PYI Grant No. DMR 9057764), the David and Lucile Packard Foundation, and the Ford Motor Co.
Appendix A
II.4a, p , ~ , can be obtained using the relationships, The chemical potential of component I defined in eq
AFo = Afo&NI (A.1) I
n1N1 VI = ~ I = A , B , C (A.2)
By chain rules
where
with aAfdaqJ and aVJ/anI obtained using eqs ILlb and A. 2
and
Substituting eqs A.4-A.6 into A.3, p , ~ has the final form given by eq II.4b.
Appendix B
polymer blends, AF, is given by The total free energy of nonhomogeneous ternary
AF = N v A p A f rl d r (B.1)
where NV is the number of sites per unit volume, A is the cross sectional area of the system, and Af is given in eq II.la.
For a system in equilibrium, the total free energy A F will be a minimum. Therefore we have to determine the variations of PA, I ~ B , and pc, with respect to r which minimize AF with the constraints that the average compositions of A, B, and C remain constants, Le.,
p(qI - GI) dr = 0 I = A, B, C (B.2)
To add these constraints to the total free energy, we multiply undetermined constants AI, I = A, B, C, to eqs B.2 and subtract to the total free energy function in eq B.l. The final form is
71
The determinations of the variations of p1, I = A, B, and C with respect to r are obtained from20

Macromolecules, Vol. 28, No. 24, 1995 Phase Separation of Ternary Mixtures 8005
a1 8% avY;, - - V ( L ) = 0 I = A, B, C (B.4)
Therefore
aAf. ; 1 - - -2 - K ~ ~ V ~ Y ; ~ I = A, B, C (B.5) I - aY;,
where aAfilaq1 is given in eq A.5, and 211 is in eq 11.2. It is apparent that 21 in eq B.5 is the chemical
potential of component I per site, pus, in nonhomoge- neous systems.
References and Notes (1) Binder, K.; Stauffer, D. Phys. Rev. Lett. 1974,33, 1006. For
a review, see: Gunton, J. D.; San Miguel, M.; Sahni, P. S. In Phase Transitions and Critical Phenomena; Domb, C., Leb- owitz, J. L., Eds.; Academic: London, 1983; Vol. 8.
(2) Chen, L. Q. Scr. Metall. Mater. 1993, 29, 683. Chen, L. Q. Acta Metall. Mater. 1994, 42, 3503.
(3) Jeppesen, C.; Mouritsen, 0. G. Phys. Reu. 1993, B47, 14724. Laradji, M.; Mouritsen, 0. G.; Toxvaerd, S. Europhys. Lett. 1994,28, 157.
(4) Edwards, S. F. J . Phys. 1975, A 8 , 1670. (5) de Gennes, P. G. J . Phys. (Paris) Lett. 1977, 38, 441. de
Gennes. P. G. Scaline Conceots in Polvmer Phvsics: Cornel1 Univ. Press: Ithaca,-NY, 19?9.
(6) de Gennes, P. G. J . Chem. Phys. 1980, 72, 4756. (7) Scott, R. L. J . Chem. Phys. 1949, 17, 279. ( 8 ) Tompa, H. Trans. Faraday SOC. 1949, 45, 1142.
(9) Chakrabarti, A,; Toral, A.; Gunton, J. D.; Muthukumar, M. Phys. Rev. Lett. 1989, 63, 2072.
(10) de Gennes, P. G. J . Phys. (Paris) Lett. 1979, 40, 69. (11) We neglect the contribution to KII from the short range van
der Waals interactions because in polymers it is 1/N smaller than the contribution from the chain connectivity; see ref 19.
(12) For a comparison, we numerically solve the nonlinear diffu- sion equations of system 2 shown in Figure Id using the exact forms of KII.
(13) de Fontaine, D. Doctoral dissertation, Northwestern Univer- sity, Evanston, IL, 1967.
(14) Rogers, T. M.; Elder, K. R.; Desai, C. Phys. Reu. 1988, B37, 9638.
(15) Kramer, E. J.; Green, P.; Palstrom, C. J. Polymer 1984, 25, 473.
(16) Composto, R. J.; Kramer, E. J.; White, D. M. Nature 1987, 328, 234.
(17) In polymer blends of comparable molecular weights, the results of Kramer and de Gennes are similar (see discussions in the paper of J. Rhee and B. Crist (Macromolecules 1991, 24, 5663)).
(18) de Gennes, P. G. J . Chem. Phys. 1971, 55, 572. (19) Cahn, J . W.; Hilliard, J . E. J . Chem. Phys. 1958, 28, 258. (20) Hildebrand, F. B. Methods ofApplied Mathematics; Prentice-
Hall: New York, 1992. (21) Huang, C.; Olvera de la Cruz, M.; Voorhees, P. W. Manu-
script in preparation. (22) In the presence of hydrodynamic flow which we neglect here
the growth of the third minority phase can be much faster through flow of materials from thin to thick regions via Tomitika instabilities; see ref 23.
(23) McMaster, L. P. Adu. Chem. Ser. 1975, 142, 43. Siggia, E. D. Phys. Reu. 1979,20A, 595.
MA950497A