Embed Size (px)
Citation preview

1
Ph.D. Thesis
INCREASING THE BIOAVAILABILITY OF GEMFIBROZIL VIA COMPLEX FORMATION WITH CYCLODEXTRINS AND
STUDY OF THE COMPLEXES CHARACTERISTICS
Hassan Bin Hassan M. Abdo
Szeged, Hungary
2005

2
Ph.D. Thesis
University of Szeged Faculty of Pharmacy
Department of Pharmaceutical Technology ================================================================
Head: Prof. Dr. habil. Piroska Révész Ph.D., D.Sc.
INCREASING THE BIOAVAILABILITY OF GEMFIBROZIL VIA COMPLEX FORMATION WITH CYCLODEXTRINS AND
STUDY OF THE COMPLEXES CHARACTERISTICS
By Hassan Bin Hassan M. Abdo
Pharmacist
Supervisor: Dr. Zoltán Aigner Ph.D.
University of Szeged, Department of Pharmaceutical Technology
Szeged, Hungary 2005

3
Publications relating to the thesis Papers: I. H.B. Hassan, M. Kata, I. Erős, Z. Aigner: Preparation and investigation of inclusion
complexes containing gemfibrozil and DIMEB, J. Incl. Phenom. Macro. 50 (2004), 219-225. (IF: 0.825)
II. Z. Aigner, H.B. Hassan, O. Berkesi, M. Kata, I. Erős: Thermoanalytical, FTIR and X-ray
studies of gemfibrozil-cyclodextrin complexes, J. Them. Anal. Calorim. 81 (2005) 267-272. (IF: 1.478)
III. Hassan Bin Hassan, Aigner Z., Ifj. Kása P., Hódi K., Erős I: Gemfibrozil és dimetil-β-
ciklodextrin termékek és szilárd gyógyszerformák előállítása és vizsgálata, Acta Pharm. Hung. (in press).
Abstracts: I. H.B. Hassan, Z. Aigner, M. Kata, I. Erős: Improvement of physical properties of
gemfibrozil by cyclodextrin complexation, Proceedings of the 12th International Cyclodextrin Symposium, Montpellier, France, May 16-19, 2004, Kluwer Academic Publisher, Dordrecht, pp. 295-298 (2005).
II. H.B. Hassan, Z. Aigner, P. Kása Jr., M. Kata, K. Pintye-Hódi, I. Erős: Preparation and investigation of gemfibrozil+dimethyl-β-cyclodextrin products and solid dosage forms, Eur. J. Pharm. Sci., 25S1 (2005), P-44, S111-S113.
Posters: I. H.B. Hassan, Z. Aigner, M. Kata, I. Erős: Improvement of physical properties of
gemfibrozil by cyclodextrin complexation, 12th International Cyclodextrin Symposium, Montpellier, France, May 16-19, 2004.
II. H.B. Hassan, Z. Aigner, P. Kása Jr., K. Pintye-Hódi, I. Erős: Preparation and investigation of gemfibrozil+dimethyl-β-cyclodextrin products and solid dosage forms, 6th Central European Symposium on Pharmaceutical Technology and Biotechnology, Siófok, Hungary, May 25-27, 2005.

4
Contents 1. INTRODUCTION .......................................................................................................1 2. BIOAVAILABILITY ..................................................................................................1 2.1. Factors influencing bioavailability ........................................................................2 2.2. Pharmacokinetic properties of Gemfibrozil...........................................................4 3. THE PROCESS OF DISSOLUTION AND ITS INFLUENCING FACTORS INFLUENCING IT ..................................................................................................5
4. INCLUSION COMPLEXES ......................................................................................6 4.1. Cyclodextrins (CDs) ..............................................................................................6 4.2. Host-guest inclusion complexes and the requirements of complex formation ............................................................................................9 4.3. Pharmaceutical technology and biopharmaceutical importance of inclusion complex formation...........................................................................10 4.4. Increase of the solubility and bioavailability by CD complexation.....................11 5. AIMS ......................................................................................................................12 6. MATERIALS .............................................................................................................13 6.1. Active sudstance: gemfibrozil .............................................................................13 6.2. Excipients.............................................................................................................13 6.2.1. Cyclodextrins ...............................................................................................13 6.2.2. Other materials .............................................................................................13 7. METHODS.................................................................................................................14 7.1. Preparation of products........................................................................................14 7.2. Preliminary experiments ......................................................................................14 7.3. Methods of investigation methods of in vitro availability...................................15 7.3.1. Dissolution studies .......................................................................................15 7.3.2. Membrane diffusion experiments ................................................................15 7.4. Evaluation of CD-complex formation .................................................................16 7.4.1. Thermoanalytical methods (TG, DTG, DTA and DSC) ..............................16 7.4.2. Fourier transform infrared (FT-IR) spectroscopy ........................................17 7.4.3. X-ray powder diffraction investigations ......................................................17 7.4.4. NMR spectra ................................................................................................17 7.5. Biopharmaceutical investigations ........................................................................17 7.5.1. Phase solubility and dissolution determinations ..........................................17 7.5.2. Determination of n-octanol/water partition coefficient................................18 7.6. Powder technological characterization studies ....................................................18 7.6.1. Particle size analysis ....................................................................................18 7.6.2. Morphological study ....................................................................................18 7.6.3. Contact wetting angle determination ...........................................................19 7.7. Preparation of solid dosage forms .......................................................................19 8. REULTS AND DISCUSSION ..................................................................................20 8.1. In vitro availability investigation results .............................................................20 8.1.1. Dissolution studies .......................................................................................20 8.1.2. Membrane diffusion examinations...............................................................24

5
8.2. Evaluation of CD-complex formation .................................................................25 8.2.1. Thermoanalytical results ..............................................................................25 8.2.2. FT-IR spectra results ....................................................................................28 8.2.3. NMR spectra results.....................................................................................30 8.2.4. X-ray powder diffraction results ..................................................................32 8.3. Biopharmaceutical investigation results ..............................................................33 8.3.1. Phase solubility and dissolution determination............................................33 8.3.2. Determination of n-octanol/water partition coefficient................................34 8.4. Powder technological characterization studies ....................................................35 8.4.1. Particle size analysis ....................................................................................35 8.4.2. Morphological study ....................................................................................37 8.4.3. Contact wetting angle determination ...........................................................38 8.5. Investigation of solid dosage forms .....................................................................39 8.5.1. Tablet and capsule test results......................................................................39 8.5.2. Dissolution profiles of tablets and capsules .................................................39 8.5.3. Membrane diffusion of tablets and capsules................................................40 9. SUMMARY ................................................................................................................41 10. REFERENCES ........................................................................................................43

6
1. INTRODUCTION
Loftsson and Brewster [1] reviewed the use of cyclodextrins (CDs) for the solubilization,
stabilization and formulation of drugs through the formation of inclusion complexes, while
Uekama et al [2] summarized findings on the safety profile of CDs. Numerous other major
reviews have been published on the current and potential uses of CDs [3-11]. Many new, and
many more old, generic drugs need appropriate formulation, better than what was considered
satisfactory some years ago. The search for new drugs (with exponentially rising expenses)
continues, but the search for new formulations (which are less expensive) resulting in more
stable preparations with better bioavailability properties, allowing the design of new and more
effective drug delivery systems is increasing more rapidly. This provides the main impetus for
the research into CD-drug combinations. Investigations into bioavailability increase comprise
one of the dynamically developing fields of drug research. While studies on the
bioavailability of drugs from a given dosage form revered that in many situations various
dosage forms with the same content of the active substance did not give the same therapeutic
effect [12], control of the bioavailability of drugs is a major requirement in drug production,
especially for drugs of very low water solubility. This work is based on the investigation of
gemfibrozil (GEM), which has a lipid-regulating pharmaceutical effect, and its solubility
properties, with a view to improving the bioavailability of GEM, and therefore decreasing its
dose and side-effects [12-15].
The main line of my experiments is, the in vitro availability studies, and other
examinations suitable for the evaluation of complex formation. In several cases, I have
formulated complete solid dosage forms where the in vitro availability is better than that of
the official dosage forms.
2. BIOAVAILABILITY
The bioavailability of substance is an important characteristic feature; it is the percentage
ratio of the quantity of active drug incorporated and the quantity absorbed. Oser et al. first
recognized this principle for the time in 1945 [16]. According to Levy, the bioavailability is
the ratio between the quantity of investigated drug and the blood concentration, using a
standard dosage form [17]. Another formulation is due to Ritschel: the resorption efficiency
proportion between the tested and the standard dosage forms [18]. The U.S. Food and Drug
Administration defines it as the rate and extent to which the active drug ingredient or

7
therapeutic moiety is absorbed from a drug product and becomes available at the site of drug
action [19]. Since it is rare in practice that a drug concentration is determined at the site of
action (e.g. at a receptor site), bioavailability is more commonly defined as "the rate and
extent to which the active drug is absorbed from a dosage form and becomes available in the
systemic circulation". Bioavailability usually refers to the absorption of a drug from the
gastrointestinal tract (GIT) following oral administration of a dosage form. The dosage form
may be any type of product, including a solution, suspension, tablet, capsule, etc.
Bioavailability can also refer to other types of dosage forms, such as intramuscular injections,
ointments and other topical preparations, transdermal patches and implants, which also
require an absorption step prior to reaching the systemic circulation. The only route of drug
administration that should always result in a bioavailability of 100% is an intravenous
injection, in which the amount of drug reaching the systemic circulation is equal to the total
administered dose [20].
A distinction should be made between absolute and relative bioavailability BA(A) and BA(R)
[21]. The absolute bioavailability BA(A) may be calculated follows:
( ) DBABA A = Eq. 1
where D is the active substance content present in the administered drug product, BA is the
biologically available amount of the administered dose.
If a well-proved dosage form is used as the standard, then the relative bioavailability is
calculated as follows:
( )( )
( )ST
XR BA
BABA = Eq. 2
where BA(X) is the amount available in the examined dosage form, and BA(ST) is the amount
available in the standard dosage form [22].
2.1. Factors influencing bioavailability
Before the therapeutic effect of an orally administered drug can be exerted, the drug must
be absorbed. The systemic absorption of an orally administered drug in a solid dosage form is
comprised of three distinct steps [23]:
a. Disintegration of the drug product.
b. Dissolution of the drug in the fluids at the absorption site.
c. Transfer of the drug molecule across the membrane lining the GIT into the systemic
circulation.

8
The various factors that can influence the bioavailability of a drug can be broadly classified
as dosage form-related or patient-related. Some of these factors are listed in Tables 1 and 2 as
follows:
Table 1. Bioavailability factors related to the solid dosage form (tablets or coated tablets)
Physicochemical (technological) properties of the drug
Formulation and manufacturing variables
Solubility properties (quantity and rate) Active substance type Particle size and distribution in the dosage form Amount of disintegrant Crystalline structure Amount of lubricant Degree of hydration of crystal Special coatings Salt or ester form Nature of diluents Characteristics of the applied dosage form Compression force
Table 2. Bioavailability factors related to the patient
Physiologic factors Interactions with other substances Variations in absorption power along the GIT Food Variations in pH of GIT fluids Fluid volume Gastric emptying rate Other drugs Perfusion of GIT Presystemic and first-pass metabolism Age, sex, weight and disease states
The physical and chemical characteristics of a drug, as well as its formulation, are of prime
importance as concerns bioavailability, because they can affect not only the absorption
characteristics of the drug, but also its stability. Since a drug must be dissolved to be
absorbed, its rate of dissolution from a given product must influence its rate of absorption [24-
38].
In the case of the bioavailability, the blood concentration versus time profile is
investigated. The total area under the blood concentration versus time curve (AUC), the
maximum blood concentration and the time of occurrence of the maximum blood
concentration can be read from the curve. In vitro examinations are often used instead of the
expensive and much time-requiring animal and human tests. Although these examinations do
not substitute the examinations in the living organism, the results have to be compared with
the in vivo ones (e.g. it is sufficient to perform in vitro availability studies using a registered
industrial preparation, where only the excipients are changed, to prove that the change in the
composition does not cause significant differences in the dissolution and the in vitro diffusion
profile) [39]. Figure 1 shows the fate of an oral dosage form in the living organism.

9
Fig. 1. Fate of an oral dosage form in the living organism [33]
If the drug solubility is good (K1 > K2), the absorption rate is the determining factor [18,
40]. The rate of dissolution of a poorly-soluble active substance is substantially lower.
According to Ritschel [18] and Thoma [41], if the solubility is lower than 0.3%, the
dissolution rate is the determining factor of the resorption. In this case, the K1 has to be
increased, as otherwise the blood concentration of the drug dose not reach the minimal
effective concentration (MEC).
2.2. Pharmacokinetic properties of Gemfibrozil [42]
• GEM is absorbed from the GIT after oral administration, and should be taken 30 min
before a meal. Peak plasma levels occur in 1-2 h. After the administration of 600 mg twice
daily, a Cmax in the range 15-25 mg/mL is obtained.
• The volume of distribution at the steady state is 9-13 L. The plasma protein binding of
GEM and its main metabolite is at least 97%.
• The biotransformation of GEM involves oxidation of the ring methyl group to form
successively a hydroxymethyl and a carboxyl metabolite (the main metabolite). This
metabolite has low activity as compared with that of to the mother compound GEM, and an
elimination half-life of approximately 20 h.
The enzymes involved in the metabolism of GEM are not known. The interaction profile of
GEM is complex. In vivo studies indicate that GEM is a potent inhibitor of CYP2C8 (an
enzyme important for the metabolism of, for example, repaglinide, rosiglitazone and

10
paclitaxel). In vitro studies have shown that GEM is a strong inhibitor of CYP2C9 (an
enzyme involved in the metabolism of, for instance, warfarin and glimepiride), but also of
CYP2C19, CYP1A2 and UGTA3.
• GEM is eliminated mainly following its metabolism. Approximately 70% of the
administered human dose is excreted in the urine, mainly as conjugates of GEM and its
metabolites. Less than 6% of the dose is excreted unchanged in the urine. Six per cent of the
dose is found in the faeces. The total clearance of gemfibrozil is in the range 100 to 160
mL/min, and the elimination half-life is in the range 1.3-1.5 h. The pharmacokinetics is linear
within the therapeutic dose range.
3. THE PROCESS OF DISSOLUTION AND FACTORS
INFLUENCING IT
The dissolution starts at the surface of the material. A concentrated solution is formed from
the solid material in contact with the solvent, which is diluted with the pure solvent. The
material is soluble in as much as it is able to diffuse from the saturated surface to the bulk of
the solution. The following equation describes the dissolution phenomenon:
)( max tCCSKdtdc
−⋅⋅= Eq. 3
where dc/dt is the rate of dissolution of the drug, K is a constant which contains the diffusion
coefficient, the thickness of the diffusion layer and the volume of the solution, S is the surface
area of the solid material, and Cmax - Ct is the concentration gradient.
The equation takes into account those parameters, which are able to change the rate of
dissolution.
Stirring a solution increases the rate of dissolution, because the thickness of the surface
layer depends on the stirring speed. The faster the solvent or the solution is stirred, the faster
the dissolution is. The solubility of a solid in a liquid also depends on the temperature In
general, on increase of the temperature the rate of dissolution increases and sometimes the
dissolved quantity does so too. On cooling down, the supersaturated part of the solid material
turns into solid form. Increasing of the dissolved quantity of the molecules, which increases
the diffusion rate.
The diffusion coefficient is inversely proportional to the viscosity of the medium. The
viscosity decreases with increasing temperature, and therefore the rate of dissolution will be
increased. The rate of dissolution is indirectly proportional to the surface area. Increasing the

11
degree of disparity increases the surface area and the rate of dissolution, too. Mercerization is
a good method for preparing powders of high disparity [43, 44]. Spray-drying generally
produces small particles, and there is not enough time for the crystalline form to develop
during drying, so part of the solid material has an amorphous structure. On use of these spray-
dried active substance, the drug quantity in a dosage form can be decreased, with increase of
its effectivity. These methods change only the rate of dissolution; the dissolved quantity will
not be changed. The smallest crystal (micronizate) contains some billion molecules, so the
dissolution rate and quantity and the absorption rate of a molecularly dispersed material will
generally be increased in the presence of CDs, especially if the solubility of the drug is poor.
The solvent quality is also a parameter worthy of mention. Although many solvents dissolve
drugs, practically only water may be applied in practice as a solvent for oral dosage forms.
The use of other solvents is rather limited. The main possibility for increase of the
bioavailability is by increasing the solubility of the drug.
4. INCLUSION COMPLEXES
Inclusion complexes are entities comprising two or more molecules, the "host"
incorporating (totally or in part, only by physical forces, i.e. without covalent bonding) a
"guest" molecule [14, 45]. Disregarding a slight deformation, the size and shape of the
cavities in the host are generally not changed during complexation.
4.1. Cyclodextrins (CDs)
CDs are host molecules which form monomolecular inclusion compounds. They are cyclic
oligosaccharides of amylase composed of 6 (α-CD), 7 (β-CD) or 8 (γ-CD) glucopyranose
units. These units are linked by α-1,4-glycoside bonds (Fig. 2) and all the glucose molecules
are in the C1 conformation [4].
In the pharmaceutical industry, CDs have mainly been used as complexing agents to
increase the aqueous solubility of poorly water-soluble drugs, and increase their
bioavailability and stability. The ability of CDs to form complexes with a wide variety of
organic compounds helps to alter the apparent solubility of the molecule, to increase the
stability of the compound in the presence of light, heat and oxidizing conditions, and to
decrease the volatility of the compound.

12
Fig. 2. Chemical structure of β-CD [4]
A CD molecule can be envisaged as an empty cylindrical capsule of molecular size, with
14 secondary hydroxy groups located on the outside edge and 7 primary ones on the inside
edge of the cylinder (Fig. 3). The hydroxy groups can be modified chemically, thereby
forming a hydrophilic outer shell [1]. In spite of the fact that they are non-hygroscopic, they
form various stable hydrates. The innermost, apolar cavity is lined with hydrogen atoms and
glycoside oxygen bridges, which enable the CD molecule to accommodate a guest molecule
of low solubility and form an aqueous soluble inclusion complex [46, 47]. The β-CD
derivatives have attained practical importance in the pharmaceutical and food industries [4].
Dimethyl-β-CD (DIMEB) generally increases the solubility more than does β-CD.
Chemically modified β-CDs have been investigated because they are more soluble in water
and organic solvents and also form inclusion complexes in the same way as β-CD [48, 49].

13
Fig. 3. Functional structural scheme of CDs [4, 45]
14
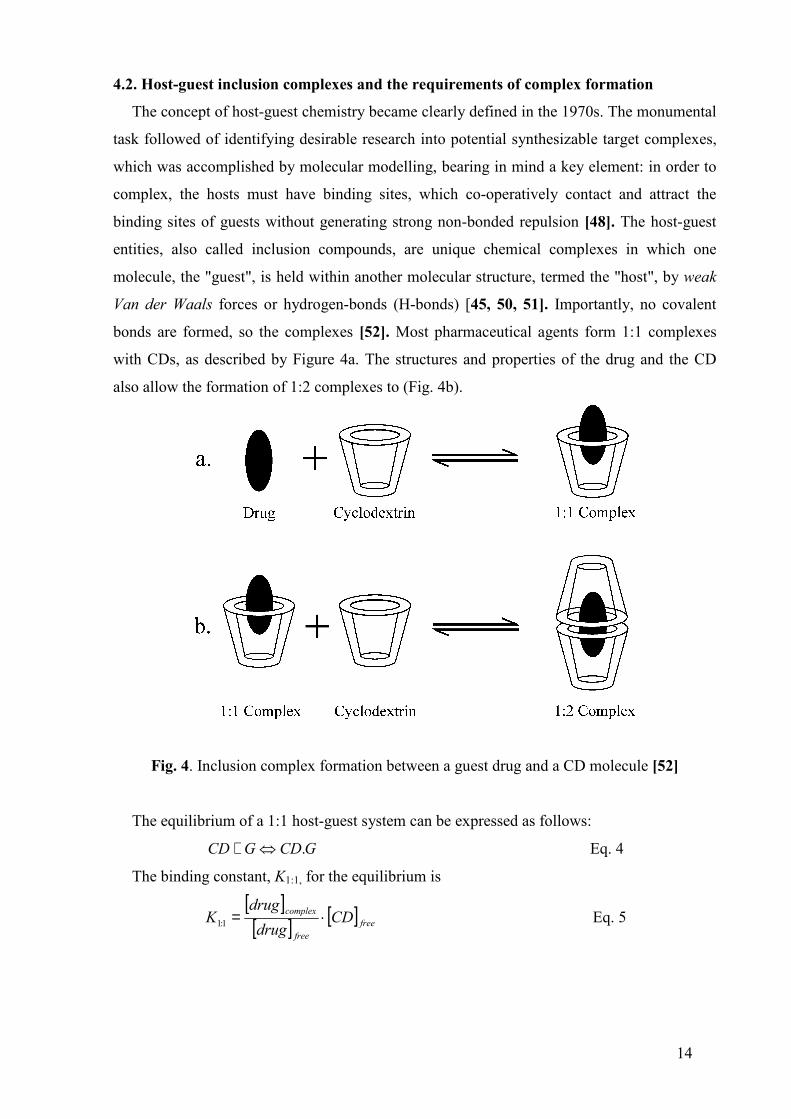
4.2. Host-guest inclusion complexes and the requirements of complex formation
The concept of host-guest chemistry became clearly defined in the 1970s. The monumental
task followed of identifying desirable research into potential synthesizable target complexes,
which was accomplished by molecular modelling, bearing in mind a key element: in order to
complex, the hosts must have binding sites, which co-operatively contact and attract the
binding sites of guests without generating strong non-bonded repulsion [48]. The host-guest
entities, also called inclusion compounds, are unique chemical complexes in which one
molecule, the "guest", is held within another molecular structure, termed the "host", by weak
Van der Waals forces or hydrogen-bonds (H-bonds) [45, 50, 51]. Importantly, no covalent
bonds are formed, so the complexes [52]. Most pharmaceutical agents form 1:1 complexes
with CDs, as described by Figure 4a. The structures and properties of the drug and the CD
also allow the formation of 1:2 complexes to (Fig. 4b).
Fig. 4. Inclusion complex formation between a guest drug and a CD molecule [52]
The equilibrium of a 1:1 host-guest system can be expressed as follows:
GCDGCD .⇔+ Eq. 4
The binding constant, K1:1, for the equilibrium is
[ ][ ] [ ] free
free
complex CDdrug
drugK ⋅=1:1 Eq. 5

15
Therefore, crystalline CD complexes are seldom of stoichiometric composition, whereas in
solution the molar ratio is usually 1:1. After a guest molecule has been accommodated in one
cavity of the CD, its other end is also amenable to complex formation, to form a 2:1 complex.
The conditions of CD complex formation are as follows [53]:
• The guest molecule must be at least partially non-polar.
• It must have are appropriate molecular weight (100-500).
• The guest molecule must have suitable structure and size for the complexation (the α-, β-,
and γ-CDs with different internal diameters are able to accommodate molecules of
different sizes).
• The single dose of the drug must be less than 30-50 mg, as otherwise the amount of the
complex will be too high to produce a single dose of a dosage form.
The solubility of poorly-soluble active substance may be increased in CD-complex form.
As the drug-CD comolex displays higher solubility, the applied drug quantity may be
decreased, which reduces unwanted side-effects.
4.3. Pharmaceutical technology and biopharmaceutical importance of inclusion complex
formation [54]
Ι. Increasing the physical and chemical stability [55-57]:
• Stabilization of volatile molecules [58-61].
• Hindering oxidation of the guest molecule.
• Light-protection insurance [62].
• Decrease of decomposition, disproportion and autocatalytic reactions [63, 64].
• Protecting the drug molecule against the effects of the acidic gastric juice.
II. Solid dosage forms
• Liquid materials can be transformed into solid forms which are suitable, for example,
for tableting [65].
• An unpleasant, irritative taste and sometimes a smell can be decreased significantly by
complexation.
• Mixing incompatible materials, where both or at least one of the two components are in
complex form.
• The hygroscopicity can be decreased.
III. Poorly-soluble materials
• The rate of dissolution and the dissolved quantity can be increased [66, 67].

16
• A higher blood level may be achieved after oral application (the dose may be
decreased) [68-72].
• The hydrophobicity can be decreased, resulting in higher percutaneous and rectal
resorption.
IV. Liquid dosage forms
• Stable solutions may be prepared without organic solvents.
• Side-effects, local irritation and haemolytic reactions may be decreased [73].
V. Semisolid dosage forms
• The drug release may be increased [74-78].
A further advantage is that the amount of drug applied may be decreased with the
solubility increase, while the pharmaceutical effect is the same or higher. The decreased drug
quantity is important not only from economical point of view (cost-saving), but also as
concerns decrease of the therapeutic risk [79].
4.4. Increase of the solubility and bioavailability by CD complexation
The bioavailability of an orally administered medicine depends on the dissolution rate, the
solubility and the absorption of the applied drug. The dissolution rate depends considerably
on the crystal structure and on the size of the particles. While the smallest crystal contains
millions of molecules, the CD inclusion complex contains a molecularly dispersed drug.
Additionally, the complex is more hydrophilic than a poorly-soluble drug; the moisturization
and the disintegration of the complexes are faster processes. As the binding energy in the
inclusion complex is smaller than that in the crystals of the pure drug, a higher concentration
may be achieved, especially of poorly water-soluble materials [80].
After the administration of a CD complex, the dissociation process starts. The solubility
and the dissociation equilibrium collectively determine the concentration of the free and CD
complex bound drug in aqueous solution. The dissociation of the complex depends on the
stability coefficient and the concentration of the complex. Initially, we get a supersaturated
solution, where the dissociation starts. When the free molecular concentration of the drug
exceeds the saturation concentration, the excess will be deposited. Figure 5. illustrates these
processes:

17
Fig. 5. Liberation of the drug from the CD inclusion complex [80]
5. AIMS My research aims were the following:
1. The preparation of GEM complexes with CDs (particularly DIMEB) in different ratios
and by different methods of preparation.
2. Biopharmaceutical studies of the new inclusion complexes:
i. Determination of the solubility and the rate of dissolution of the drug.
ii. Determination of the in vitro availability (membrane diffusion).
iii. Measurement of the partition coefficients and the surface tension.
3. Preformulation studies on the powder products with satisfactory biopharmaceutical
results.
i. Study of the UV, FT-IR and NMR spectra, XRD and thermal analysis.
ii. Powder technological investigations (particle size, particle size distribution and
flowability) and their influence on the solubility of the drug.
iii. Investigation of the complex surface (SEM).
iv. The stability of the products.
4. Comparison of the effects of the different preparation methods on the dissolution profile
and the membrane diffusion.
5. Selection of the best compositions for the following examinations and tests on the basis of
the dissolution and membrane diffusion results.
6. The formulation of solid dosage forms from the 1:2 kneaded product and their
investigation according to the 4th European Pharmacopoeia.

18
7. Determination of the liberation and absorption of the in vitro active substance from the
dosage forms containing the CD complex.
8. Comparison of the results of the different preparative methods for the choosing the best
products to be subjected for more intensive studies and can be used in the future of GEM
pharmaceutical preparations.
6. MATERIALS
6.1. Active substance: Gemfibrozil
2,2-Dimethyl-5-(2,5-xylyloxy)valeric acid (Fig. 6) [81, 82] (Plantex Chemicals, Israel, API
Division Teva Group).
CH2 CH2 CH2 C COOH
CH3
CH3
CH3
O
CH3
H
H
H12345
2'3'
4'
5' 6'
1'
Fig. 6. Chemical structure of GEM [81]
Description: The empirical formula is C15H22O3 and the molecular weight is 250.35.The
solubility in water and acid is 0.0019%, and in dilute base it is greater than 1%. The melting
point is 58–61 °C.
GEM is a white waxy crystalline solid powder, which is stable under ordinary conditions.
It is a lipid-regulating agent. It is available as tablets (LOPID®, INNOGEM®, MINILIP®) for
oral administration. Each tablet contains 300 or 600 mg GEM [83].
6.2. Excipients
6.2.1. Cyclodextrins
α-CD, β-CD, γ-CD, hydroxybutenyl-β-CD (HBU-β-CD), 2-hydroxypropyl-β-CD (HP-β-
CD), heptakis-2,6-di-O-methyl-β-CD (DIMEB), and randomly methylated-β-CD (RAMEB)
(Cyclolab R&D Laboratory Ltd., Hungary); Captisol® (Cydex, Inc., USA).
6.2.2. Other materials
Microcrystalline cellulose (Avicel PH 101) (FMC Corp., USA), lactose, magnesium
stearate and talc (Ph. Eur. 4th); sodium starch glycolate (VIVASTAR®) (J. Rettenmaier and

19
Söhne GmbH, Germany); silicified microcrystalline cellulose (Prosolv SMCCTM 50)
(England), n-octanol (Molar Chemicals Kft., Hungary), disodium-hydrogen-phosphate,
potassium-dihydrogen-phosphate, sodium chloride, glycine and hydrochloric acid (Reanal
Co., Hungary).
7. METHODS
7.1. Preparation of products
Products were prepared in four different molar ratios (GEM+CD molar ratio = 2:1, 1:1, 1:2
and 1:3). Physical mixtures (PMs): the pure drug and CD were mixed in a mortar and sieved
through a 100 µm sieve. Kneaded products (KPs): PMs of the drug and DIMEB were mixed
(Erweka LK5) with the same quantity of a solvent mixture of ethanol + water (1:1). They
were kneaded until the bulk of the solvent mixture had evaporated. After this they were dried
at room temperature and were then pulverized and sieved through a 100 µm sieve. Spray-
dried products (SDs): the PMs of GEM and DIMEB were dissolved in 50% ethanol.
The SDs were obtained by using a Büchi Mini Dryer B-191, with compressed air flow: 800
L/min at 75 °C inlet temperature, and nozzle diameter: 0.5 mm. The aspirator rate was 75–
80%, and the pump rate was 3–7% [84]. Products prepared by ultrasound treatment (USs):
GEM and DIMEB with different molar ratios of PMs were dissolved in 50% ethanol and
mixed to obtain clear solutions, then placed in the ultrasonic apparatus for 1 h, dried at room
temperature, pulverized and sieved through a 100 µm sieve.
Products were stored under normal conditions at room temperature in well-closed glass
containers.
7.2. Preliminary experiments
Preliminary experiments were carried out to ascertain which CD derivative most increases
the solubility of the GEM. Mixtures of 0.02 g GEM and 0.20 g of the different CDs were
diluted to 20.0 g with distilled water and then stirred for 10 min with a magnetic stirrer. The
suspension systems were filtered through filter papers and the UV spectra were recorded
(Unicam UV2/VIS spectrometer, Unicam Ltd., England). A system without CD was used as
control. DIMEB exerted the highest solubility-increasing effect on the active ingredient, and
accordingly this compound was used for futher examinations (Table 3).

20
The absorption maximum of the GEM was determined to be 276 nm. The calibration curve
was obtained in the concentration interval 0–150 µg/mL, where the equation was found to be
A = 0.00653·c for the calibration plots, prepared either with or without DIMEB.
Table 3. Influence of CD derivatives on the solubility of GEM
Components C (µg/mL) Increase (fold) GEM 29.10 1.00 GEM + α-CD 31.39 1.08 GEM + β-CD 49.62 1.71 GEM + γ-CD 253.44 8.71 GEM + HP-β-CD 212.71 7.31 GEM + HBU-β-CD 284.84 9.79 GEM + RAMEB 330.63 11.33 GEM + DIMEB 655.44 22.53 GEM + Captisol® 251.91 8.66
7.3. Methods of investigation of in vitro availability
7.3.1. Dissolution studies
A modified Paddle USP dissolution apparatus was used [82, 85] to examine 20 mg samples
of pure GEM or products containing 20–100 mg of GEM in 100 mL of simulated gastric
medium (SGM) or simulated intestinal medium (SIM). The basket was rotated at 100 rpm, the
sampling volume was 5.0 mL, the temperature was 37 ± 1 °C, and sampling was performed
after 5, 10, 15, 30, 60, 90 and 120 min. After filtration and dilution, the GEM contents of the
samples were determined spectrophotometrically. The components of the SGM and SIM are
detailed in Table 4.
7.3.2. Membrane diffusion experiments
Stricker’s Sartorius apparatus was used [86, 87]. Measurements were performed on 100.0
mL of SGM or SIM in simulated plasma (SPM) (Table 4). 20 mg samples of GEM or
products containing 20 mg of GEM were placed in the donor phase in all cases. The artificial
membrane was made of cellulose acetate (Schleicher & Schuell ME 29, Dassel, Germany:
pore size 3 µm, diffusion surface 40 cm2). The temperature was 37.5 ± 1.5 °C. 5.0 mL
samples were taken five times (after 30, 60, 90, 120 and 150 min) and their GEM contents
were determined spectrophotometrically after filtration. The lipid barrier (gastric barrier N, S1
and intestinal barrier N, S2) were prepared from the components of the packaged kits of
apparatus directly before running the experiment [88-93]. The amount of diffused GEM and
the diffusion constant Kd were calculated from the linear part of the diffusion curves:

21
[ ]10
012
12 min1 −⋅⋅−−= cm
FV
CTTCCK ll
l
lllld Eq. 6
where Cllx is the corrected drug concentration in phase II at time Tx (mg/mL); Vll0 is the
volume of aqueous phase II at time T0 (100 mL); F is the surface area of the membrane (cm2);
Tx is time (min); and C10 is the theoretical initial drug concentration in phase I (mg/mL).
Table 4. Compositions of artificial juices
Gastric juice Intestinal juice Plasma
pH (± 0.1) 1.1 7.0 7.5
1 N HCl (g) 94.0 – –
NaCl (g) 0.35 – –
Glycine (g) 0.50 – –
Na2HPO4·2H2O (g) – 14.4 20.5
KH2PO4 (g) – 7.1 2.8
Distilled water to 1000 mL
7.4. Evaluation of CD-complex formation
7.4.1. Thermoanalytical methods
Used in combination, thermogravimetry (TG, DTG, and DTA) and differential scanning
calorimetry (DSC) can elucidate the nature of the host-guest interactions in crystalline CD
inclusion compounds, and also the relation between the structure and thermal decomposition
[94]. The complex formation between the components of the products was examined by
means of thermoanalytical methods [95]. The DSC analysis was carried out with a Mettler
Toledo STARe thermal analysis system, Version 6.0, DSC821e (Switzerland), at a heating rate
of 5 °C/min, with argon as carrier gas (10 L/h). The sample size was in the range 2–5 mg of
pure GEM or product (in the case of DSC studies) or 50 mg of powder (in the case of
thermogravimetry), was examined in the temperature range 25–300 °C.
The percentage of uncomplexed guest was estimated semiquantitatively from the DSC curves
by using the following equation:
uncomplexed guest % = 410⋅⋅∆
∆
CHoH i Eq. 7
where ∆Hi = normalized integral data on the product; ∆Ho = normalized integral data on the
GEM; and C = percentage GEM in the product.

22
7.4.2. Fourier transform infrared FT-IR spectroscopy
The FT-IR spectra of the GEM and the solid products (in KBr disks) were recorded on an
AVATAR330 FT-IR spectrometer (Thermo Nicolet, USA), in the interval 450–4000 cm-1.
The pressure was 10 tons, and the diameter of the pressings was 13 mm; a Specac Hydraulic
Press was used (Specac Inc., USA).
7.4.3. X-ray Powder diffraction investigations*
XRD spectra were recorded with a DRONUM-1 diffractometer (Russia) system with
CuKα1 radiation (λ=1.54178 Å) over the interval 2–44°/2θ. The measurement conditions were
as follows: target, Cu; filter, Ni; voltage, 35 KV; current, 20 mA; time constant, 1S; angular
range 2° < 2θ < 44°.
The changes in the powder crystalline states of the samples were studied by comparing their
diffraction patterns. The X-ray spectra of the active agent, the CD derivative, the SD 1:2 and
the PM 1:2 products were recorded during the experiments [96].
7.4.4. NMR spectra**
The 1H spectra were recorded at room temperature on a BRUKER Avance DRX-500
Fourier-transform spectrometer (500 MHz 1H frequency). 21.3 mg DIMEB and 21.2 mg
GEM were dissolved in 0.6 mL perdeuterated dimethyl-sulfoxide (DMSO-d6). The chemical
shifts are given in ppm, relative to the methyl signal of sodium 2,2-dimethyl-2-silapentane-5-
sulfonate.
7.5. Biopharmaceutical investigations
7.5.1. Phase solubility and dissolution determinations
The formation of inclusion complexes between a hydrophobic drug and CDs is a topic of
current interest to pharmaceutical research as it may improve the solubility, stability and
bioavailability of the guest molecule [97], and the formation of a molecular dispersion of a
drug with a water-soluble carrier enhances the dissolution of the drug [98].
Solubility measurements were conducted in distilled water (pH= 6.2±0.1) according to
Higuchi and Connors [99]. Excess GEM was added to aqueous solutions containing various
concentrations of DIMEB (0–200 mM), which were then stirred at room temperature until
*Ákos Bertalan, Department of Mineralogy, Geochemistry and Petrology, University of Szeged ** Prof. György Dombi, Department of Pharmaceutical Analysis, University of Szeged

23
equilibrium was reached (approx. 48 h). After filtration, the concentration of GEM was
measured spectrophotometrically. The stability constant (KS) was determined from the phase
solubility diagram by using the equation of Higuchi and Connors, on the assumption that a
complex with a stoichiometric ratio of 1:1 was formed in the initial step.
7.5.2. Determination of the n-octanol/water partition coefficient
The n-octanol-water system is a model that is widely used to investigate diffusion across
biological membranes [100]. GEM or products containing GEM were dissolved in water-
saturated n-octanol (500.0 g of water + 1.0 g of n-octanol) and in n-octanol-saturated water
(500.0.g of n-octanol + 22.0 g of water). Further GEM or CD product was added to these
systems during continuous stirring for 48 h, at 25±2°C until the excess drug appeared in
suspended form. After filtration, the saturated solution was diluted with n-octanol-saturated
water or water-saturated n-octanol, and the GEM content coefficient was calculated according
to Nernst’s distribution law.
Kp, the partition coefficient, was determined spectrophotometrically [101, 102]:
pK =2
1
aa Eq. 8
where a1 = concentration of GEM in n-octanol, and a2 = concentration of GEM in water.
7.6. Powder technological characterization studies
7.6.1. Particle size analysis
Determination of the particle size of the spray-dried products (length, breadth, area,
perimeter and roundness) was carried out with a LEICA Q500MC Image Processing and
Analysis System (LEICA Cambridge Ltd., UK).
7.6.2 Morphological study
The morphology of the particles was examined with a scanning electron microscope
(SEM) (Hitachi S2400, Hitachi Scientific Ltd., Japan). A sputter coating apparatus (Bio-Rad
SC 502, VG Microtech, England) was applied to induce electric conductivity on the surface of
the samples. The air pressure was 1.3-13.0 mPa.
The use of SEM was reported by Kata et al., who investigated inclusion complexes of α-,
β- and γ-CD and nitroglycerine-β-CD [103].

24
7.6.3. Contact wetting angle determination
The wetting angle was determined with Dataphysics OCA 20 Contact Angle System
equipment (software version: V 2.1.7). 0.15 g samples were made from the drug, the CD and
the different products with a 13 mm diameter Specac Hydraulic Press (Specac Inc., USA).
The pressing force was 1 ton. 4.3 µL distilled water was added dropwise to the surface of the
sample, and the contact angle was registered every second (duration of the experiment: 30 s).
7.7. Preparation of solid dosage forms
The powder components (except the magnesium stearate) were measured and mixed for 8
min (50 rpm) in a Turbula mixer (WAB Turbula, Switzerland). Homogenization was repeated
after the addition of magnesium stearate (2 min). The moisture contents of the GEM-DIMEB
1:2 KPs and the homogeneous PM were determined in 3 parallel measurements (Mettler
Toledo HR 73 Halogen Moisture Analyzer, Mettler-Toledo GmbH, Switzerland).
Tabletting was carried out with a Korsch EK 0 eccentric tablet machine (E. Korsch
Maschinenfabrik, Germany).
Table 5. Composition of tablets and hard gelatin capsules
Components Tablet Capsule
mg % mg %
1:2 KP (GEM + DIMEB) 89.50 49.73 89.50 50.04
Avicel PH 101 54.00 30.00 –
Lactose 30.20 16.77 –
Talc 3.60 2.00 –
Vivastar 1.80 1.00 –
Magnesium stearate 0.90 0.50 –
Prosolv SMCCTM 50 – – 88.08 49.96
Average mass 180.00 100.00 177.58 100.00
The hard gelatin capsules were prepared with the ZUMA semiautomatic capsule-filling
machine (150 A/4 with 150/B-3, Zuma S.r.L., Italy). Prosolv SMCCTM 50 with good
flowability was used as filler. The calculated quantities of the components were measured and
homogenized with a Turbula mixer for 10 min. The capsules were white
hydroxypropylmethyl cellulose (HPMC) hard (size 2) (Syntapharma, GES für Pharmachemie
mbH). The dissolution and in vitro membrane diffusion results on the 1:2 product gave the
25
basis for the determination of the GEM content. Tablets and capsules containing 8.84 g GEM
were prepared. Literature data from previous studies, books, etc. were used when the auxiliary
materials were selected for tabletting and also in the choice of the tabletting methodology [84,
104-115]. The compositions of the tablets and capsules are presented in Table 5.
8. RESULTS AND DISCUSSION
8.1. In vitro availability investigation results
In the past few decades, the pharmaceutical modification of drug molecules by inclusion
complexation has been extensively developed to improve their dissolution rate [116, 117],
chemical stability [118-120], absorption and bioavailability [121, 122]. In this respect, CDs
have received an increasing attention in the pharmaceutical field [45, 123-125], and there is
no doubt that the determination of dissolution rates is an important tool in the development,
evaluation and control of solid dosage forms.
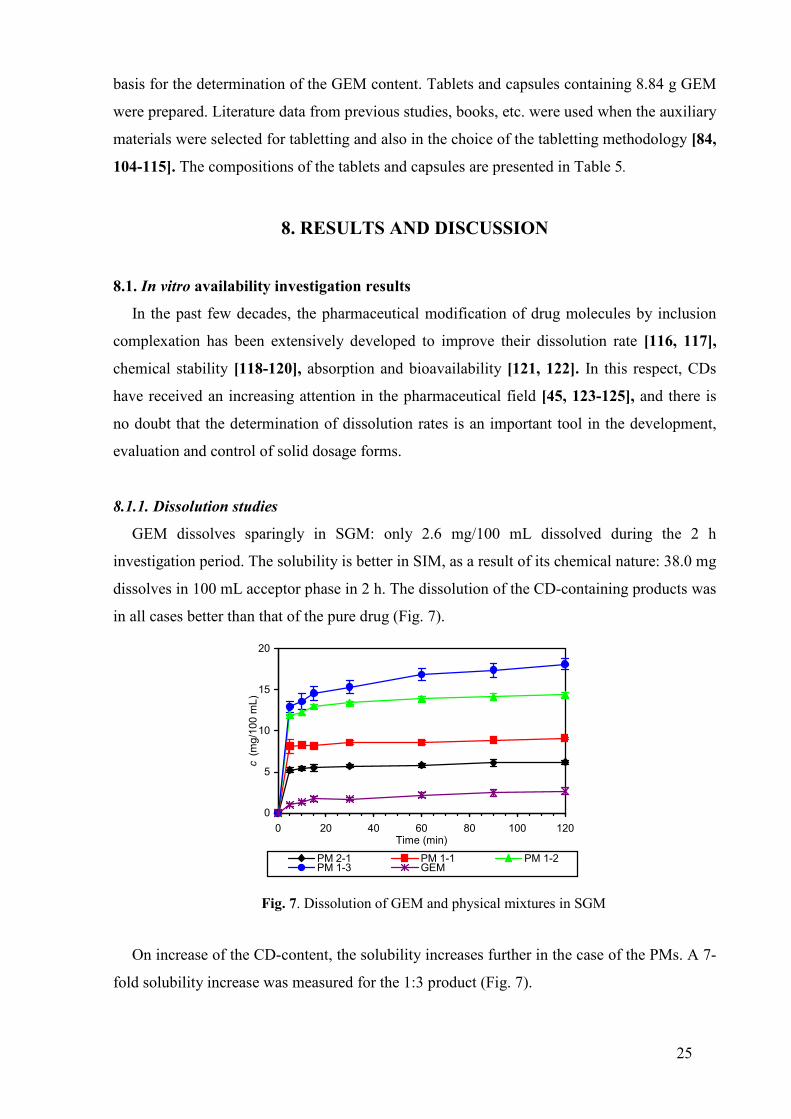
8.1.1. Dissolution studies
GEM dissolves sparingly in SGM: only 2.6 mg/100 mL dissolved during the 2 h
investigation period. The solubility is better in SIM, as a result of its chemical nature: 38.0 mg
dissolves in 100 mL acceptor phase in 2 h. The dissolution of the CD-containing products was
in all cases better than that of the pure drug (Fig. 7).
0
5
10
15
20
0 20 40 60 80 100 120Time (min)
c(m
g/10
0m
L)
PM 2-1 PM 1-1 PM 1-2PM 1-3 GEM
Fig. 7. Dissolution of GEM and physical mixtures in SGM
On increase of the CD-content, the solubility increases further in the case of the PMs. A 7-
fold solubility increase was measured for the 1:3 product (Fig. 7).

26
Similar phenomena were observed for the KPS, SDs and USs: the dissolved drug amount
increased with increasing CD-content. At higher CD ratios (1:2 and 1:3), the total drug
amount dissolved in the early stages of the investigation. It was also typical that the saturation
concentration was reached in 5–10 min for the KPs and SDs (Fig. 8), while the USs needed 30
min to reach the same state (Fig. 9). The effect of the presence of the CD was not so
expressed, when measurements were made in SIM. The solubility was increased in all cases
as compared with pure GEM, but the differences between the different products were not so
significant. A 3–6-fold solubility increase was measured, depending on the preparation
methodology. Table 6 lists the summarized dissolution results for GEM and all of the
products.
05
1015202530354045505560
0 20 40 60 80 100 120
Time (min)
c(m
g/50
mL)
SD 2-1 SD 1-1 SD 1-2SD 1-3 GEM
0
10
20
30
40
50
60
70
80
90
100
110
0 20 40 60 80 100 120
Time (min)
c(m
g/50
mL)
US 2-1 US 1-1 US 1-2US 1-3 GEM
Fig. 8. Dissolution of GEM and SDs in SGM Fig. 9. Dissolution of GEM and USs in SGM
Some of the products dissolved totally in the small volume of acceptor phase, in spite of
the increased GEM content of the product. Therefore, the saturation concentration was
determined for all of the products. Figure 10 depicts the results for the SDs as an example.
0102030405060708090
100110
0 20 40 60 80 100 120
Time (min)
c(m
g/50
mL)
SD 2-1 SD 1-1 SD 1-2SD 1-3 GEM
Fig. 10. Dissolution of GEM and SDs in SIM

27
Table 6. Summarized dissolution results for GEM and products (mg/100 mL). Simulated gastric medium
Product 10th min SD 120th min SD GEM 1.34 0.13 2.66 0.43 Physical mixture 2:1 5.42 0.21 6.20 0.24
1:1 8.26 0.26 9.12 0.11 1:2 12.24 0.34 14.39 0.30 1:3 13.57 0.93 18.11 0.67
Kneaded product 2:1 2.84 0.13 4.14 0.29 1:1 11.27 0.48 10.32 0.16 1:2 99.71 1.64 90.17 3.00 1:3 101.55 4.45 104.73 2.64
Spray-dried product 2:1 7.08 0.21 10.51 1.23 1:1 46.78 5.25 43.97 3.20 1:2 100.56 2.24 93.63 2.18 1:3 107.16 2.12 109.58 1.51
Ultrasound treatment 2:1 22.34 0.80 40.02 2.35 1:1 60.38 1.65 85.89 5.06 1:2 191.79 6.78 193.17 1.36 1:3 187.23 2.57 200.18 2.84
Simulated intestinal medium Product 10th min SD 120th min SD
GEM 14.13 3.94 38.01 1.68 Physical mixture 2:1 59.59 7.06 90.15 3.76
1:1 74.56 2.68 98.39 2.33 1:2 92.13 8.79 104.05 12.39 1:3 95.37 5.49 99.57 4.41
Kneaded product 2:1 51.27 9.24 141.08 4.71 1:1 169.73 9.53 175.86 12.81 1:2 202.19 22.53 201.70 8.66 1:3 192.77 4.84 198.23 2.82
Spray-dried product 2:1 55.59 6.99 108.40 22.68 1:1 160.19 3.91 186.55 10.36 1:2 187.68 13.12 192.81 10.67 1:3 190.60 1.88 195.22 3.44
Ultrasound treatment 2:1 65.28 5.29 130.46 6.66 1:1 137.87 7.55 193.22 3.00 1:2 187.14 3.40 193.14 2.40 1:3 183.22 4.81 192.65 4.00

28
GEM 2:1 1:1 1:2 1:3
PM
KPSD
US
0
500
1000
1500
2000
2500
c (mg/100 mL)
GEM and mole ratio
Products
Fig. 11. Saturated concentrations of products and GEM in SGM
GEM 2:1 1:1 1:2 1:3
PM
KPSD
US
0
500
1000
1500
2000
2500
3000
3500
4000
4500
5000
c (mg/100 mL)
GEM and mole ratio
Products
Fig. 12. Saturated concentrations of products and GEM in SIM
Figure 11 presents the results for SGM, while Fig. 12 illustrates the data measured in SIM.
Especially the 1:2 and 1:3 SDs and USs may be emphasized (a 520-fold solubility increase for
the 1:2 USs) in SGM. The preparations made by the SD method gave the best results in SIM
(a 716-fold solubility increase at a mole ratio of 1:2).

29
8.1.2. Membrane diffusion examinations
1.4 mg of the pure drug diffused through the membrane into SGM during 150 min under in
vitro conditions. We experienced increased diffusivity with increasing CD content.
0
1
2
3
4
5
6
0 30 60 90 120 150
Time (min)
c(m
g/10
0m
L)
GEM SD 2:1 SD 1:1
SD 1:2 SD 1:3
0123456789
10
0 30 60 90 120 150
Time (min)
c(m
g/10
0m
L)
GEM SD 2:1 SD 1:1
SD 1:2 SD 1:3
Fig. 13. In vitro membrane diffusion results Fig. 14. In vitro membrane diffusion results on SDs in SGM on SDs in SIM
A 3.2-fold increase was measured for the PMs, a 4-fold one for the KPs and SDs (Fig. 13),
and a 5.4-fold increase in diffusivity for the USs.
The products displayed differences in diffusivity as compared with the pure drug when
measurements were carried out in SIM. The diffused drug amount was not dependent on the
composition of the products or the preparation method used. 8.0 mg GEM was able to diffuse
during 150 min (Fig. 14). The last part of the diffusion curves exhibited a saturated character,
as a consequence of the increased diffused drug amount. This is the explanation of the
significant differences in the values of the diffusion rate constants. Therefore, the linear part
(between 30 and 90 min) of the curve was used to calculate the diffusion rate constants. The
diffusion of the included guest molecules is important as a primary consequence of the
interaction between a poorly soluble guest and CD in aqueous solution, which may be lower,
the same as or higher than that of the free guest in homogeneous solution (see Table 7).

30
Table 7. Diffusion constants (Kd) of GEM and products
from SGM and SIM Kd (10-3) [cm/min] SD Products
SGM SIM SGM SIM
GEM PM 2:1
1:1 1:2 1:3
0.640 1.526 1.529 3.228 3.616
6.225 6.742 7.301 6.351 7.112
0.069 0.043 0.853 0.172 0.163
0.189 0.532 1.187 0.184 1.414
KP 2:1 1:1 1:2 1:3
1.547 1.934 4.308 4.909
7.439 6.692 7.036 7.581
0.283 0.043 0.746 0.549
0.544 0.939 1.286 1.582
SD 2:1 1:1 1:2 1:3
1.043 2.631 3.966 4.914
7.648 7.614 6.772 7.234
0.202 0.086 0.420 0.223
0.441 3.935 0.982 0.977
US 2:1 1:1 1:2 1:3
2.077 3.775 1.934 5.438
12.536 7.474 7.144 7.215
0.197 0.219 0.034 0.557
1.834 0.506 1.419 1.543
8.2. Evaluation of CD-complex formation
8.2.1. Thermoanalytical results
Thermoanalytical methods can also be used to determine the host-guest ratio, or volatile
component content (in w/w %) in the investigated product, and in the verification of products
with a spherical appearance [4, 126].
A distinction can be made between surface adsorption and inclusion complex formation by
means of thermoanalytical methods. The presence of an inclusion complex is shown indirectly
by changes relative to the non-complexed free drug.
Complex formation can be easily followed by evaluation of the DSC curve of the products.
Figure 15 depicts the DSC curves of the pure GEM and DIMEB alone. A sharp endothermic
peak can be distinguished at 59.25 °C in the curve for GEM, which can be identified from the
literature data as its melting point. The melted drug evaporates on further increase of the
temperature, this process being enhanced by an open container and also by an argon gas flow.
The total drug amount is evaporated at 230 °C; after this, only the baseline is seen.

31
Fig. 15. DSC curves of GEM (1), and DIMEB (2) Fig. 16. Derivatograph-C curves of GEM
GEM has no moisture content, as concluded from its TG curve (Fig. 16). A continuous
mass loss was measured above 190 oC. There is no broad endothermic peak in the DSC curve
of DIMEB under 100 °C (which would indicate the moisture content of this complex-forming
agent; the moisture content of DIMEB was under 1%, as measured by TG). The small
exothermic and endothermic peaks between 170 and 190 °C are caused by CD impurities. The
low moisture content of DIMEB is advantageous as the endothermic peak caused by moisture
would disturb the study of the melting point of the drug (see Fig. 17).
Fig. 17. Derivatograph-C curves of DIMEB
The endothermic peak reflecting the melting point of the drug is well-manifested at all
molar ratios of the PMs (Fig. 18). The integrated area and the normalized integral are

32
proportional to the drug content of the individual product; on the basis of these data, we can
calculate a partial complex formation of 20-30% [127].
Fig. 18. DSC curves of GEM+DIMEB physical mixtures
As concerns the products made by the other preparation methods, only the 2:1 KPs and
USs displayed a partial complex formation of 80–90%. No melting endothermic peaks were
observed at other molar ratios of the KPs and USs, indicating complete complex formation.
Figures 19 and 20 show the DSC curve of the KPs and SDs as an example, because these
exhibit good dissolution and in vitro membrane diffusion ability. No melting process was
observed for the SDs, so a crystalline phase could not be assumed in all cases.
Fig. 19. DSC curves of GEM+DIMEB KPs Fig. 20. DSC curves of GEM+DIMEB SDs
8.2.2. FT-IR spectra results
Comparison of the vibrational spectra of GEM, DIMEB and the samples prepared by
different physical methods at various GEM to DIMEB ratios revealed well-defined

33
differences, although the preparation of the pellet was expected to promote complex
formation. The most significant changes were found in the ranges of the characteristic
frequencies of the carboxyl group (–COOH), indicating that the complex formation altered the
H-bonded cyclic dimer structure of the carboxylgroup. The most intense C=O stretching band
shifted from 1709 cm-1 to 1730 cm-1, suggesting a less strong or no H-bonding interaction.
The other two characteristic, combination bands (C–C–O–{H} stretching and C–O–H in-
plane bending modes) also shifted, to lower wavenumbers (from 1403 cm-1 to 1396 cm-1 and
from 1271 cm-1 to 1265 cm-1), confirming that the strength of the H-bonds decreased and
complexation occurred through the carboxyl group. Evaluation of the O–H stretching (around
3000 cm-1) and the O–H out-of-plane bending (around 940 cm-1) regions was prevented by the
strong absorption of DIMEB. On the other hand, DIMEB has a band with appropriate
intensity at 1375 cm-1, away from the bands of GEM, which allows normalization of the
sample spectra. All spectra were transformed by performing a spectral offset, which resulted
in zero intensity at 1900 cm-1, and division by the doubled intensity of the above-mentioned
reference band. The spectral intensities for the samples prepared by the same method
followed the expected sequence in the C=O stretching region, based on the GEM to DIMEB
ratio (Fig. 21).
Fig. 21. FT-IR spectra of KPs
The C=O stretching region is dominated by the strong peak at 1730 cm-1, but new bands
appear at higher GEM to DIMEB ratios. The intensities and the positions of the new bands

34
depended on the method of preparation, but they always appeared on the lower wavenumber
side of the band characteristic of complexe GEM (Fig. 22).
Fig. 22. FT-IR spectra of 2:1 products and GEM
The intensities of the new bands increased in the sequence SD, KP, US and PM. Three new
components were revealed by Fourier self-deconvolution [128-131] in these overlapping
bands, at 1709, 1699 and 1690 cm-1. The first and the last of these were found to be
characteristic of pure GEM. Samples prepared by the US, KP and PM methods featured all
three new bands with various relative intensities, while the spectrum of the SD sample
showed only the band at 1699 cm-1. Since spray drying usually resulted in an amorphous
product, and this band was the only additional one in the SDs, it can be assumed that it was
characteristic of GEM in an amorphous state (Fig. 23). The other possibility is to assign it to
the complexe form.
Since the pellet preparation somewhat altered the state of the samples, it was not expected
that the same quantitatively available intensities would be obtained as concerns the ratio of
complexed and crystalline GEM. A semiquantitative picture was derived from the spectra of
samples prepared at a ratio of 2:1, by fitting eight mixed Gaussian-Lorenzian functions
between 1850 and 1570 cm-1. The fitted bands included two bands assigned to the skeletal
modes of the aromatic ring in GEM. The sum of the area of these bands served as a reference
to calculate the ratio of the fitted bands. First of all, the intensity ratio of the bands at 1730
and 1699 cm-1 changed essentially, so they cannot be interconnected. The latter should

35
therefore be assigned to amorphous GEM. The relative intensity of the band attributed to the
complexed GEM was nearly the same for the samples prepared by the SD, KP and US
methods. The SD sample did not show the presence of crystalline GEM, but the highest ratio
of amorphous GEM. The contributions of the bands of the crystalline and the amorphous
GEM were low, and they were also nearly the same in intensity for the KP and US samples.
The relative intensities of the bands fitted to the spectrum of the PM showed the highest ratio
of the crystalline and the lowest ratio of the amorphous phase. Hence, all the results agreed
with those of the DSC measurements.
Fig. 23. Fourier self-deconvolution results
8.2.3. NMR spectra results
The spectra of the 1:2 GEM+DIMEB KP and pure GEM were recorded. The 1H NMR
spectra revealed the following changes (Table 8):

36
Table 8. 1H NMR spectral data on GEM and DIMEB.
GEM DIMEB Chemical shift,
multiplicity, integral Functional group Chemical shift, multiplicity Functional group
1.11 ppm, s, 6H 2-CH3 3.25 ppm, s OCH31.62 ppm, m, 4H 3-CH2 and 4-CH2 3.10-3.7 ppm m 2,3,4,5-CH and 6-CH22.08 ppm, s, 3H 2’-CH3 4.96 ppm m 1α-CH (glycosidic) 2.24 ppm, s, 3H 5’-CH33.89 ppm, t, 2H 5-CH26.61 ppm, d, 1H 4’-H 6.69 ppm, s, 1H 6’-H 6.96 ppm, d, 1H 3’-H
In the two-dimensional ROESY spectrum (see Fig. 24), there are cross-peaks of the spin
systems belonging to DIMEB [in the region of 3.1–3.7 ppm and 4.96 ppm], and GEM
[aliphatic (1.1–2.2 ppm and 3.9 ppm) and aromatic (6.6–6.9 ppm) regions], respectively. The
cross-peaks between the protons of the two separate molecules show the low distance between
them.
There are two pairs of cross-peaks (symmetrical to the diagonal) between the broad
multiplet of the sugar methane protons (3.7 ppm) and the signals at 2.24 ppm (5’-CH3 of the
aromatic ring of GEM) and 6.62 ppm (4’-CH of the aromatic ring of GEM).
These cross-peaks between the spins of the host and guest molecules furnished direct
evidence that the aromatic ring is close to the methane protons of DIMEB (averaged on the
NMR time-scale). Therefore, DIMEB forms a complex with GEM in DMSO-solution. During
the complex formation, the aromatic ring (most non- polar part) is incorporated into the cavity
of DIMEB molecule. The methyl protons far from the long side-chain and the aromatic proton
para to the side-chain are mostly incorporated into the DIMEB. In this way, the guest
molecule is bent during the incorporation (the hydrophilic side-chain is not perpendicular to
the DIMEB cone) (cf. Fig. 24).
Summary:
Two-dimensional ROESY NMR experiments were used to prove the presence of the
inclusion complex of GEM with DIMEB in DMSO solution. The two-dimensional 1HNMR
spectra of GEM and DIMEB are shown in Fig. 24.
The cross-peaks of the corresponding protons prove the interactions between GEM and
DIMEB.

37
8.2.4. X-ray powder diffraction results
X-ray powder diffraction can elucidate the nature of the host-guest interactions in
crystalline CD inclusion compounds. The differences in the powder crystalline states of the
samples were studied by comparing their diffraction patterns.
The X-ray spectra of GEM, DIMEB, the 1:2 SD and the 1:2 PM were recorded during the
experiments (Fig. 25). The spectrum of GEM is that of crystalline material, as expected. The
degree of crystallinity of DIMEB is negligible, and this was also found for the SD. The
amorphous structure of the SD is due to the high drying rate used during the preparation. It
was interesting that the 1:2 PM (PM 1:2 1 ver.) also displayed slight crystallinity, similarly to
the previously mentioned SD. On the basis of these results and also taking into consideration
the DSC and FT-IR measurements, we assume that an inclusion complex is formed in the
solid phase, this also held for the PM. To prove this, we prepared the 1:2 PM without any
milling and sieving step during the preparation. The components were pulverized separately
and then homogenized with care (PM 1:2 2 ver.). The peaks relating to the crystalline GEM
are to be found in the X-ray diffractogram, with lower intensities compared with those of the
GEM itself, in accordance with the GEM content of the product (9.88%).
The peak intensities of the latter solids depend on the amount of GEM in the products. The
amorphous state may determine the bioavailability of slightly water-soluble drugs by
enhancing their solubility absorption in the gastrointestinal tract. Among the methods used to
prepare amorphous drug solids were spray drying and physical mixing [132-134].
Fig. 25. X-ray powder diffraction diagram

38
Fig. 24. Two-dimensional ROESY spectra of GEM and DIMEB
8.3. Biopharmaceutical investigation results
8.3.1. Phase solubility and dissolution determination
Phase diagrams, i.e. solubility curves, can be divided into two major categories (Higuchi
and Connors, 1965). Type A solubility curves are obtained when the apparent solubility of the
substrate increases with increasing ligand concentration throughout the entire concentration
range. A linear relationship is designated as of AL type, while the AP and curves exhibit
positive and negative curvature, respectively. In this case, we obtained a freely soluble
complex form, where the solubility limit was determined only by the solubility of the CD. The
initial linear ascending part of a solubility diagram is generally ascribed to the formation of a
1:1 complex when the slope is less than 1. When the complex is more soluble than the free
guest, but its solubility limit can be reached within the CD concentration range, the guest

39
concentration first increases from the aqueous solubility of the guest until the point where the
solubility limit of the complex is reached [4].
0102030405060708090
100
0 50 100 150 200
c (DIMEB) mM
c(G
EM
)mM
Fig. 26. Phase solubility diagram of GEM with DIMEB in water at 25 °C
Figure 26 shows an AL-type phase solubility equilibrium diagram for the GEM+DIMEB
system in water at 25 °C The solubility of GEM increased linearly in the presence of this CD
derivative. The apparent stability constant (Kc) can be calculated from the slope and intercept
of the initial linear portion of the diagram as follows:
( )ααtan1
tan
0 −=
SKc Eq. 9
where S0 is the solubility of GEM in the absence of DIMEB Kc was calculated to be 2.755
± 0.047 M-1.
The increase in solubility followed the sequence to be seen in Table 3. The products
containing DIMEB exhibited the best solubility in all cases. The influence was directly
proportional to the CD concentration in the product, proving that the β-CD derivatives, just
like the parent β-CD, modified the solubility and bioavailability of the guest molecule [135,
136].
The stability constants of the complexes investigated after 1 week revealed that the effects
that can be achieved by means of CD inclusion complexation all depend on the stability and
solubility of the complex, but these are independent properties. A very stable complex may be
very soluble and therefore difficult to obtain in crystalline form.
8.3.2. Determination of n-octanol/water partition coefficient
GEM has a high partition coefficient, as it has poor water solubility and a high affinity for
n-octanol. All the partition coefficients of the products were lower than that of the pure drug.

40
The aqueous solubility increased with increasing CD content, in parallel with decreasing n-
octanol solubility. The relevant data are shown in Table 9.
Table 9. n-Octanol/water partition coefficients of
GEM and its DIMEB products
Product Cn-octanol (µg/mL)
Cwater (µg/mL)
Co/Cw
GEM PM 2:1 1:1 1:2 1:3
658.5 594.2 393.6 407.4 309.3
98.0 214.4 490.0 5528.3 18483.9
6.719 2.771 0.803 0.074 0.017
KP 2:1 1:1 1:2 1:3
332.3 366.0 261.9 243.5
811.7 2557.4 3292.4 4287.9
0.409 0.143 0.080 0.057
SD 2:1 1:1 1:2 1:3
915.8 162.3 618.7 686.1
1439.5 796.3 3797.9 3016.8
0.636 0.204 0.163 0.322
US 2:1 1:1 1:2 1:3
1009.2 105.7 185.3 140.9
137.8 842.3 3797.9 7442.6
7.322 0.125 0.049 0.019
8.4. Powder technological characterization studies
The solubility and rate of dissolution of a drug primarily depend on its crystal structure and
particle size. If the drug is poorly soluble in water, i.e. Kd < Ka (where Kd = dissociation rate
constant and Ka = absorption rate constant), dissolution is the rate-determining step and Kd
has to be increased by micronizing the particles [4, 18, 40].
8.4.1. Particle size analysis
The characteristics (length, width, surface area, perimeter and roundness) of at least 350
particles were determined for the KPs at all 4 molar ratios (Table 10).

41
Table 10. Particle size analysis of SDs Product Length
(µm) Breadth (µm)
Area (µm2)
Perimeter (µm)
Roundness
Average 3.067 2.873 9.471 10.190 1.092 Std. ±1.736 ±1.675 ±16.720 ±5.744 ±0.052 Maximum 14.000 13.000 148.000 46.000 1.413
2:1
Minimum 1.185 0.889 1.053 4.148 1.016 Average 2.851 2.661 8.073 9.477 1.088 Std. ±1.580 ±1.508 ±15.740 ±5.250 ±0.047 Maximum 16.000 15.000 192.000 54.000 1.221
1:1
Minimum 1.185 0.889 1.053 4.148 1.016 Average 3.481 3.273 10.399 11.584 1.090 Std. ±1.249 ±1.206 ±8.528 ±4.118 ±0.050 Maximum 10.000 9.000 76.000 33.000 1.434
1:2
Minimum 1.185 0.889 1.053 4.148 1.016 Average 2.040 1.838 3.397 6.733 1.112 Std. ±0.599 ±0.678 ±2.181 ±2.025 ±0.058 Maximum 4.148 3.852 12.993 13.630 1.221
1:3
Minimum 1.185 0.889 1.053 4.148 1.048
Roundness is a shape factor that provides information about the circularity via the following
formula:
064.14
2
⋅⋅=
areaperimeterroundnessπ
Eq. 10
The particles were mainly spherical; their size varied in only a narrow range; the average
size was 2-4 µm; the number of bigger particles was extremely low. As a result of the regular
shapes, the roundness was found to be close to 1. The particle size distribution measured from
the length is illustrated in Fig. 27.
Fig. 27. Particle size distribution of SDs by length

42
8.4.2. Morphological study
Surface investigations are of importance in the respect of morphological examinations. The
manufacturing of a solid dosage form needs improvements in the characteristics, especially in
the case of direct tabletting [137, 138].
GEM (Fig. 28, left) consists of crystals with mainly a columnar form and a broad size
distribution. The edges of the columnar crystals are rounded. The surface of these crystals is
generally smooth, but in some places small particles can be seen on it. Therefore, such small
crystals occur among the larger crystals. The picture of DIMEB (Fig. 28, right.) demonstrates
a product with heterodisperse particles.
The products consist of irregular-shaped, differently-sized particles. The spray-drying
technique resulted in a 1:1 product with a spherical form. The original shape disappeared. The
particle size varied, but its surface was smooth. Change of the ratio to 1:2 resulted in
individual spherical-shaped particles. However, it can be seen that the particles collapsed
during the procedure. The surface here was very uneven; it became wrinkled. Further change
of the ratio to 1:3 resulted in a similar product. The SEM pictures of the SDs are to be seen in
Fig. 29 a,b,c.
Fig. 28. SEM photographs of GEM (left) and DIMEB (right)
a. b.

43
c.
Fig. 29. SEM photographs of GEM+DIMEB SDs: 1:1 (a), 1:2 (b) and 1:3 (c)
8.4.3. Contact wetting angle determination
The wetting angle continuously decreased slightly on dropping at a decreasing rate. The
standard deviation between the parallel measurements was considerable high in the first 3 s,
while it became standard at a minimum value after 5 s. Table 11 therefore, contains the data
measured after 5 s.
Table 11. Wetting angles of GEM and its products
(at 5 s.) 2:1 1:1 1:2 1:3
° Std. ° Std. ° Std. ° Std. PM 27.6 ± 2.2 41.5 ± 2.2 42.5 ± 3.7 39.9 ± 4.8KP 16.5 ± 3.3 24.3 ± 4.5 38.9 ± 1.2 29.6 ± 0.9US 44.8 ± 7.6 25.0 ± 1.6 35.6 ± 1.7 32.0 ± 1.3GEM 64.8 ± 0.2
Significantly lower wetting angles were measured for the DIMEB-containing products as
compared with the pure drug. These results were affected by changes of the composition, and
also by the preparation methods. The wetting angle data on the SDs are not included in Table
11, as it was not possible to prepare appropriate samples for these measurements.
To summarize our results, we can state that the presence of DIMEB improved the wetting
characteristics of GEM in all the preparation methods, due to the better solubility of the
products obtained.
8.5. Investigation of solid dosage forms
8.5.1. Tablet and capsule test results
The moisture content of the 1:2 KP was 1.94 ± 0.308%, while that of the PM prepared for
tabletting was 2.42 ± 0.19%. The results of the tablet and capsule tests are shown in Table 12.

44
The average mass and the uniformity of mass met the requirements of the 4th European
Pharmacopoeia [139]. The breaking hardness was acceptable, and the friability was
negligible. The disintegration times of the tablets and capsules were short in both the SGM
and the SIM.
Table 12. Physical parameters of tablets and capsules
(result and standard deviation) Examinations Tablet Capsule
Average mass (mg) 177.24 227.22 Uniformity of mass (mg) ± 4.3 ± 4.5Height (mm) 3.172 Std. 0.019 – Diameter (mm) 9.074 Std. 0.024 – Friability (%) 0.258 Std. 0.035 – Breaking hardness (N) 49.0 Std. 6.782 – Disintegration time (s) in SGM 220.72 78.58 165.66 37.68 Disintegration time (s) in SIM 199.17 53.02 143.33 61.02
8.5.2. Dissolution profiles of tablets and capsules
The rate of dissolution of the incorporated GEM from the tablets and capsules was
measured in SGM and SIM. High dissolution rates were observed for the tablets in both SGM
and SIM. Saturation was reached after 30 min in SGM.
Around 80% of the incorporated drug dissolved in SGM, while the total amount was
released when the medium was SIM (Fig. 30). The rate of dissolution from the capsules was
lower, due to the prior swelling and dissolution of the capsule itself. Saturation was reached at
30 min in SGM and at 60 min in SIM. 85–98% of the incorporated GEM amount was
released, depending on the composition of the acceptor phase (Fig 31).
0
20
40
60
80
100
120
0 15 30 45 60 75 90 105 120
Time (min)
Dis
solv
eddr
ug(%
)
simulated gastric mediumsimulated intestinal medium
0
20
40
60
80
100
120
0 15 30 45 60 75 90 105 120
Time (min)
Dis
solv
eddr
ug(%
)
simulated gastric mediumsimulated intestinal medium
Fig. 30. Profile of GEM dissolution from tablets Fig. 31. Profile of GEM dissolution from
capsules

45
To summarize the dissolution data, we found that the GEM was released relatively quickly,
and the profile of its dissolution from the solid dosage forms depended only slightly on the pH
of the acceptor medium.
8.5.3. Membrane diffusion of tablets and capsules
The in vitro membrane diffusion ability of solid dosage forms from SGM and SIM was
measured (Fig. 32, 33).
Fig. 32. Membrane diffusion of GEM from tablets Fig. 33. Membrane diffusion of GEM from capsules
Less drug diffused through the artificial membrane in the case of SGM (tablets: 23% after
150 min; capsules: more than 17%). 38–41% GEM content was measured in the acceptor
phase in the case of SIM. A higher standard deviation was experienced for the capsule dosage
form.
9. SUMMARY
The aim of this work was to assess the ability of dimethyl-β-cyclodextrin (DIMEB) to form
inclusion compounds with gemfibrozil (GEM). This will permit establishment of the best
vehicle for GEM preformulation in order to enhance its solubility and bioavailability, with the
possibility that the molecule size and the structure will allow GEM to form inclusion
complexes with DIMEB, and promising a decrease in the therapeutic dose.
The research work can be summarized as follows:
1. The solubility-increasing effects of the available CD derivatives were determined under
uniform conditions. It was established, that the solubility of the GEM were always higher

46
with CDs (especially GEM and DIMEB). The solubility increases varied considerably
(from 2.5 mg/100 mL to 65.5 mg/100 mL).
2. Different preparative ratios (2:1, 1:1, 1:2 and 1:3) and 4 methods (PMs, KPs, SDs and
USs) were used in the inclusion complex formation, in comparison with simple powder
mixing, using DIMEB.
3. 16 different products were examined as regards their dissolution, with the rotating basket
dissolution tester. All of them exhibited better dissolution data than those for GEM alone.
A more than 500-fold solubility increase was observed during the saturation
concentration measurements.
4. It was established, that the quantities of GEM dissolved depended on the concentration of
the CD derivatives and on the preparation methods. At higher CD ratios (1:2 and 1:3), the
total amount of GEM dissolved in the early stages of the investigation. It was also typical
that the saturation concentration was reached in 5–10 min for the KPs and SDs, while the
USs needed 30 min to reach the same state.
5. The intensity of the dissolution depended primarily on the preparation method. The KPs
and USs had prolonged dissolution profiles as compared with the PMs, because of the
crystalline content, while the SDs containing amorphous material displayed rapid
dissolution.
6. The amount of GEM diffused through a membrane into simulated plasma medium during
150 min under in vitro conditions was not dependent on the composition of the products
or on the preparation method used. The highest quantity of GEM diffused and the
diffusion constant were found to be 3–4 times higher than in the case of pure GEM. There
were significant differences in the values of the diffusion rate constant. Therefore, the
linear part (between 30 and 90 min) of the curves was used to calculate the diffusion rate
constants (Kd). At ratios of 1:2 and 1:3, higher amounts of GEM diffused from the
DIMEB complexes as compared with the original GEM.
7. On the basis of the dissolution and membrane diffusion results, the GEM content and the
degree of solubility increase, the 1:2 KPs were selected and were incorporated in solid
dosage forms (tablets and capsules).
8. The evaluation of the rheological behaviour of GEM+DIMEB powders was of great
importance, and particularly that needed for tablet or capsule production, and it was also
necessary to determine the preliminary compression behaviour of the complex affording
the best results for GEM+DIMEB as preformulated product in new tablet or capsule
preparations of GEM.

47
* The study of the powder characterization via particle size analysis revealed that the
particles were mainly spherical; their size varied in only a narrow range; the average
size was 2–4 µm; the number of larger particles was extremely low.
* SEM investigations the morphological properties of pure GEM, DIMEB and SDs
showed that the drug substance consists of crystals with mainly a columnar form and
a broad size distribution. The edges of the columnar crystals are rounded. The
surface of these crystals is generally smooth, but in some places small particles can
be seen on it. Therefore, such small crystals occur among the larger crystals.
* The picture of DIMEB demonstrates a product with heterodisperse particles. The
product consists of irregularly-shaped, differently-sized particles.
* The spray-drying method is a good one for preparing products with better rheological
properties. These products have small-dimensional particles, which is important in
the formulation of solid dosage forms. The particle size varies, but the surface is
smooth.
* Significantly lower wetting angles were measured for the CD-containing products as
compared with the pure drug. These results were affected by changes of the
composition, and also the preparation methods.
9. The DSC examinations demonstrated phase transitions in more or less all of the
complexes produced by the different preparative methods, showing exo/endo peaks
related to crystalline/amorphous transitions with different amounts of adsorbed water.
10. The X-ray powder diffraction data can explain the nature of the host-guest interactions in
crystalline CD inclusion compounds. The changes in the powder crystallinity of the
samples were studied by comparing their diffraction patterns. The peaks relating to the
crystalline GEM are to be found in the X-ray diffractograms of the poducts, with lower
intensities as compared with those of GEM itself, in accordance with the GEM content of
the product.
11. The findings from the FT-IR spectra confirmed the existence of intermolecular bonding
between GEM and the hosts, with significant shifts of the absorption band lines. The
different ratios used in the complex formation greatly influenced the solubility of GEM.
12. True inclusion complex formation was confirmed by 1HNMR investigations. It was
established that there were chemical bonds between the aromatic ring part (the most non-
polar part) incorporated in the cavity of the CD molecule. The methyl protons from the
long side-chain and the aromatic proton para to the side-chain are mostly incorporated
into the CDs.

48
To summarize the results, it may be conclude that the inclusion complexes formed
between GEM and CD derivatives as hosts are of promise as better future pharmaceuticals.
Through their use, there is a possibility to improve the bioavailability of poorly water-soluble
drugs, which is important as regards their industrial price, and promising as concerns decrease
of the therapeutic dose of the given drug.

49
10. REFERENCES
1. Loftsson T., Brewster M.E.: J. Pharm. Sci. 85, 1017 (1996).
2. Uekama K., Kondo T., Nakamura K., Irie T., Arakawa K., Shibuya M., Tanaka J. : J. Pharm.Sci. 84, 15 (1995).
3. Duchéne D., Wouessidjewe D. : Chim. Oggi 11, 17 (1993).
4. Frömming K.-H., J Szejtli.: Cyclodextrins in Pharmacy. Kluwer Academic Publ., Dordrecht, 1994.
5. New Trends in Cyclodextrins and Derivatives. Duchéne D. (Ed.), Edition de Santé, Paris, 1991.
6. J.Szejtli : In Cyclodextrin Technology. Davies J.E.D., (Ed.), Kluwer Academic Publ., Dordrecht, 1988.
7. Cyclodextrins and their Industrial Uses. Duchéne D. (Ed.), Edition de Santé, Paris, 1987.
8. Loftsson T., Brewster M.E., Derendorf H., Bodor N.: Pz. Wiss., 4, 5 (1991).
9. Loftsson T.: Drug Stab. 1, 22 (1993).
10. L. Szente: Satsbility Testing in the EC, Japan and the USA / Scientific and Regulatory Requirements, Grimm W., Krummen K.,(Eds), Wissenschaftliche Verlagsgesellschaft mbH, Stuttgart, 1993.
11. Van Doorne H.: J. Pharm. Biopharm. 39, 133 (1993).
12. Banakar, U.V.: Pharmaceutical Dissolution Testing, 1st Ed., Marcel Dekker Inc., New York, 1992.
13. Gyógyszer Kompendium 2002 (Pharma Compendium 2002). Medi-Media információs Kft., Budapest, 2002 pp. 713, 906.
14. Szejtli J.: Cyclodextrins and their Inclusion Complexes. Akadémiai Kiadó, Budapest, 1982.
15. Kata M., Schauer M., Selmeczi B.: Acta pharm. Hung. 61, 23 (1991).
16. Oser B. L., Melnik D., Hochberg M.: Ind. Eng. Chem. Anal. Chem. Ed. 17, 405 (1945).
17. Levy G.: "Prescription Pharmacy", Sprowls J.B.(Ed.), Lippincott Co., Philadelphia, 1963, pp.31-94.
18. A.Ritschel W.: Angewandte Biopharmazie, Wissenschaftl. Verlagsges. mbH., Stuttgart, 1973.
19. Approved Drug Products with Ttherapeutic Equivalence Evaluations, 6th Ed., U.S. Department of Health and Human Services, U.S. Food and Drug Administeration, Center for Drugs and Biologics, Rockville, Md., 1985, pp. 1-2.
20. Encyclopedia of Pharmaceutical Technology, Vol. 1., Swarbrick J., Boylan J.C.(Eds), Marcel Dekker Inc., New York and Basel, 1988, pp. 477-494.
21. B.Ameer, M. Divoll, D.R.Abernethy, D.J.Greenblatt, L. Shargel: J.Pharm. Sci. 72, 955(1983).
22. Rácz I.: Drug Formulation, Akadémiai Kiadó, Budapest, 1989, p. 293.

50
23 Basic Pharmacokinetics, Bioavailability, Bioequivalence and Drug Selection, R.Chereson, U. Banakar (Eds), Creighton University, California, 1996.
24. Blake, M.I.: Drug Topics, 132, 84 (1988).
25. Lofholm, P.W., US Pharmacist, 16, 44 (1991).
26. Jochsberger, T., Pharmacy Times, 47,27. Koch-Weser, J.: Medical Intelligence, 291, 233 (1974).
28. Welling P.G.: Drug Bioavailability and its Clinical Significance, in Progress in Drug Metabolism, Vol. 4, Bridges, J.W., Chasseaud, L.F.(Eds), John Wiley & Sons Ltd., New York, p.131-136, 1980.
29. Edwards, D.J.: A.J.Ph. Ed., 54, 178 (1990).
30. Gibaldi, M.: Biopharmaceutics and Clinical Pharmacokinetics, 4th Ed., Lea & Febiger, Philadelphia, p. 24-79, 1991.
31. Banakar, U.V.: J. Pharm. Technol., 6, 122 (1990).
32. Welling, P.G.: Clin. Pharmacokinetics, 9, 404 (1984)
33. Shargel, L., Yu, A.B.C.: Applied Biopharmacokinetics, Appleton & Lange, Norwalk, Connecticut, p. 111-167, 1993.
34. Cadwallader, D.E.: Biopharmaceutics and Drug Interaction, 3th Ed., Raven Press, New York, p. 39-86, 1983.
35. Welling, P.G.: J. Pharmacokin. Bioph., 5, 291 (1977).
36. Notari, R.E.: Biopharmaceutics and Clinical Pharmacokinetics, Marcel Dekker, New York, p. 160-171, 1987.
37. Abdou, H.M.: Dissolution, Bioavailability and Bioequivalence, Mack Publishing Company, Easton, Pennsylvania, p. 53-105, 1989.
38. Toothaker, R.D., Welling, P.G.: Ann. Rev. Pharmacol. Toxicol., 20, 173 (1980).
39. Aiache J.M, Beyssac E.: STP Pharma Sciences 6, 678 (1990).
40. H. Sucker, P. Fusch, P. Speiser: Pharmazeutische Technologie, Georg Thieme Verlag, Stuttgart, 1978.
41. Thoma K.: Österr.Apotheker-Ztg. 32, 157 (1978).
42. Pfizer Pharmaceutical Company, Electronic Medicines Compendium: Lopid 600 mg 43. Tablets, SPC from the eMC, January (2005).
43. Pillich L.: Gyógyszerek és gyógyszergyártás, Műszaki Kiadó, Budapest, 1957.
44. Kósa L.: Gyógyszerészet 8, 389 (1964).
45. Kreaz R.M.A.: Ph.D. Thesis, University of Szeged, Department of Pharmaceutical Technology, 1998.
46. Saenger W.: In: Atwood J.L., Davis J. E.D., MacNicol D.D. (Eds): Inclusion Compounds, Vol. 2, Academic Press, London, 1984.
47. Wenz G.: Angew. Chem. Int. Ed. Engl. 33, 803 (1994).
48. Loftsson T., Frioriksdottir B.J.: Acta Pharm. Nord., 3, 215 (1991).
49. Haller B.W., Brauns U.: Int. J. Pharm., 26, 77 (1985).
50. Lehn J. M.: J. Incl. Phenom. 6, 351 (1988).

51
51. Frijlink H. W.: Biopharm. Aspects of CDs, PhD Thesis, University of Groningen, 1990.
52. Dalla Bella M., Szejtli J.: CDs, Drugs of the Future. 8, 391 (1984).
53. Kata M., Wayer M.: Gyógyszerészet 28, 407 (1984).
54. Szejtli J.: Med. Res. Rev. 14, 353 (1994).
55. Cormack B. Mc., Gregoriadis G.: Int. J. Pharm. 112, 249 (1994).
56. Samy E.M.,. Safwat S.M: STB Pharma Sciences. 4, 458 (1995).
57. Ammar H.O., El-Nahhas S.A.: Pharmazie 50, 49 (1995).
58. S.Ohno: Japan Kokai 75, 160, 416 (1975).
59. Szejtli J., Szejtli M., Sebestyén Gy., Stadler I.: Hung. Patent Appl. CI. 1770 (1977).
60. H. Matsuda, K. Ito, M. Tanaka, A. Taki, H. Sumiyoshi: STP Pharma Sciences 3, 211(1991).
61. L. Szente, I. Apostol, J. Szejtli: Pharmazie 39, 697 (1984).
62. J. Mielcarek: Pharmazie 51, 477 (1996).
63. Loftsson T., Jónsdóttir B., Baldvinsdóttir J., Fridriksdóttir H.: STP Pharma Sciences 4,354 (1994).
64. Matsubara K.,. Abe K, Irie T., Uekama K.: J.Pharm. Sci. 84, 1295 (1995).
65. I. Apostol: Gyógyszerészdoktori értekezés Budapest, 1981.
66. El-Nahhas S.A.: Pharmazie 51, 960 (1996).
67. Conte U., Giunchedi P, Maggi L., Manna A. La.: STP Pharma Sciences 3, 242 (1993).
68. Ammar H.O, S.A. El-Nahhas H.O, Ghorab M.M.: Pharmazie 51, 568 (1996).
69. Jayachandra Babu R., Pandit J.K.: STP Pharm Sciences 5, 196 (1995).
70. Järvinen T., Schwarting N., Stella V. J.: J Pharm.Sci. 84, 295 (1995).
71. Panini R., Vandelli M.A., Forni F., Praddlli J. M, Salvioli G.: Pharmacol. Res. 31, 205(1995).
72. Puglisi G., Ventura C.A., Spadaro A., Campana G., Spampinato S.: J. Pharm.Pharmacol. 47, 120 (1995).
73. Sharma U.S.,. Balasubramanian S.V, Straubinger R.M: J. Pharm. Sci. 84, 1223 (1995).
74. Krasowska H., Krówczyński L.: Pharmazie 51, 353 (1996).
75. Kawahara K.,. UEDA H, Tomono K., Nagai T.: STP Pharma Sciences 2, 506 (1992).
76. Samy E.M, Safwat S.M.: STP Pharma Sciences 4, 458 (1994).
77. Uekama K., Kondo T., Nakamura, Irie T., Arakawa K., Shibuya M., Tanaka J.: J. Pharm. Sci. 84, 15 (1995).
78. Kondo T., Irie T., Uekama K.: Biol. Pharm. Bull. 19, 280 (1996).
79. Rajewski R.A., Stella V.J.: J. Pharm. Sci. 85, 1142 (1996).
80. Szejtli J.: Controlled Drug Bioavailability, Vol.3, Ed. By Smolen W.F., Ball L.A, (Eds), WileyNew-York, 1985, p. 365.
81. The Merck Index, 11th Ed., Merck & Co., Inc. Rathway, Nj. (1989), p. 686.
82. USP, 23rd Ed., US Pharm. Conv. Inc., Rockville, MD, 1994.
52
83. Innogem® and Minilip® - In: Gyógyszer Kompendium 2004 (Pharma Compendium 2004), J. Borvendég (Ed.), MediMedia, Budapest, 2004, pp. 757, 977.
84. Z. Aigner, M. Kata: STP Pharm Sci. 9, 279 (1999).
85. Pharmacopoeia Hung. VII Ed., Medicina, Budapest, 1986.
86. Stricker H.: Pharm. Ind. 33, 157(1971); 35, 13 (1973).
87. Booklet of Sartorius Resorption Model, SM 16750, Göttingen, p. 15 (1976).
88. Stricker H: Dtsch. Apoth.-Ztg. 110, 513 (1970).
89. Stricker H.: Arzneim.-Forsch. 20, 391 (1970)
90. Stricker H.: Drug Made in Germany 14, 121 (1971)
91. Stricker H.: Physikalische Pharmazie. Wissenschaftliche Verlagsges. mbH, Stuttgart, (1987).
92. Tokumura T. et al.: J. Pharm. Sci. 74, 496 (1985), 75, 391 (1986).
93. Karth M. G. et al.: J. Pharm. Sci. 74, 612 (1985).
94. Loftsson T., Baldvinsdottir J., Fridriksdottir H., A.M. Sigurdardottir: 53rd FIP Congress, Tokyo, p. 7.(1995).
95. Giordano F., Novák Cs., Moyano J.R.: Thermochim. Acta 380, 123 (2001).
96. Capelleti R., Colombi E., Antonioli G., Lottici P., Manzini I., Gnappi G., Montenero A., Parent P.: J. Non-cryst. Solids 177, 170 (1994).
97. Hirayama F., Usami M., Kimura K., Uekama K.: Proceedings of 8th Int. Symp. on CDs.Kluwer Acad. Publ., Dordrecht, 1996.
98. Chio W. L., Reigelman S: J. Pharm. Sci. 59, 937 (1970).
99. Higuchi T., Connors K.A.: Adv. Anal. Chem. Instr. 4, 117 (1965).
100. Arct J., Starzyk E.: SÖFW-Journal 129, 2 (2003).
101. Well J. I.: Pharmaceutical Preformulation. Ellis Horwood Limited, Chichester, 1988.
102. Fujita T., Iwasa J., Hanch C.: J. Am. Chem. Soc. 86, 5175 (1965).
103. Hódi K., Kata M.: Starch/Stárke, 37, 205 (1985).
104. Kata M., Aigner Z., Révész P., Selmeczi B.: J. Incl. Phenom., 7, 289 (1989).
105. Mahley R.W., Bersot T.P.: Drug therapy for hypercholesterolemia and dyslipidemia. – In: GOODMAN & GILMAN’S – The pharmacological basis of therapeutics, 10th Edition, J.G. Hardman, L.E. Limbied Eds., McGraw-Hill Medical Publishing Division, New York, 2001, pp. 971-1002.
106. Wu J.S., Ho H.O., Sheu M.T.: Eur. J. Pharm.Biopharm., 51, 63 (2001).
107. Mattsson S., Nyström C.: Eur. J. Pharm. Sci., 10, 53 (2000).
108. Roselli C., Perly B., Duchene D., Wouessidjewe D.: STP Pharm Sci., 9, 267 (1999).
109. Jug M., Becirevic-Lacan M.: Eur. J. Pharm. Sci., 21, 251 (2004).
110. Pose-Vilarnovo B., Rodriguez-Terneiro C., Santos J.F.R., Vázquez-Doval, J., Concheiro A., Alvarez-Lorenzo C., Torres-Labandeira J.J.: J. Control. Release, 94, 351 (2004).
111. Luukkonen, P., Schafer, T., Hellén L., Juppo A. M., Yliruusi.: Int. J. Pharm., 188, 181(1999).

53
112. Luukkonen P., Schafer, T., Podczek F., Newton M., Hellén L., Yliruusi J.: Eur., J. Pharm. Sci., 13, 143 (2001).
113. Luukkonen T., Newton J.M., Podczek F., Yliruusi J.: Int. J. Pharm., 216, 147 (2001).
114. Armstrong N.A.: Tabletting.-In: Pharmaceutics: The science of dosage form design, Aulton M.E. Ed., Churchill Livingstone, Edinburgh, 1988, pp. 647-669.
115. Banker G.S., Peck G.E., Baley G.: Tablet components and additives.-In: Pharmaceutical Dosage Forms: Tablets, Vol. 1, Lieberman H.A., Lachman L. Eds., Marcel Dekker Inc., New York, 1980, pp. 147-173.
116. Lach J. L., Cohen J.: J. Pharm. Sci. 52, 137 (1963).
117. Kata M., Antal L.: Pharmazie 39, 856 (1984).
118. Schlenk H., Sand D.M., Tillotston J. A.: J. Am. Chem. Sec. 77, 3587 (1955).
119. Chin T.F., Chung P.H., Lach J.L.: J. Pharm. Sci. 57, 44 (1968).
120. Vikmon M., Stadler-Szöke A., Hortobägyi G, Kolbe L, Szejtli J.: Acta. Pharm. Technol.32, 29 (1986).
121. Frömming K.-H., Wegeman I.: Arzneim-Frosch. 23, 424 (1973).
122. Tokumura T., Tsustimra Y., Tatsuistri K., Kayano M., Macitide Y., Nagai T.: Chem. Pharm. Bull. 33, 2962 (1985).
123. Cramer F.: Einschlussverbindungen. Springer Verlag, Berlin, 1954.
124. Cramer F., Hettler H.: Naturwissenschaften 54, 625 (1967).
125. Bender M. L., Kornigama M.: Cyclodextrin Chemistry. Berlin, Heidelberg, N.Y., 1978.
126. Novák Cs.: Investigation of CD Inclusion Complexes With Thermoanalytical Methods, Gyógyszereszet 40, 43 (1996).
127. Aigner Z., Benz I., Kata M.: J. Incl. Phenom. 20, 241 (1995).
128. Kauppinen J.K., Moffatt D.J., Cameron D.G., Mantsch H.H., Appl. Optics., 20, 1866(1981).
129. Griffith P.R., Pariente G.: Trac-Trend Anal. Chem., 5, 209 (1986).
130. Kauppinen J.K., Moffatt D.J., Mantsch H.H.,.Cameron D.G.: Anal. Chem., 53, 1454(1981).
131. Kauppinen J.K., Moffatt D.J, Mantsch H.H., Cameron D.G.: Appl. Spectr., 35, 271(1981).
132. Otsuka M., Kareniwa N.: Chem. Pharm. Bul. 31, 230 (1983).
133. Sato T., Olada A., Sekignchi K., Tsuda Y.: Ibid. 29, 2675 (1981).
134. Doherty C., York P.: J. Pharm. Sci. 76, 731 (1987).
135. Hirayama F., Wang Z., Uekama K.: Pharm. Res. 11, 1766 (1995).
136. Moyano R.J., Cines J.M., Arias J.M., Rabaco A. M.: Pharm. Acta Helv. 69, 81 (1994).
137. Pintye-Hódi K., Tóth I., Kata M.: Pharm. Acta Helv. 56, 320 (1981).
138. Small J.A., Heinrich K.F.J., Fiori C.E., Myklebust R.L., Newbury D.E., Dilmore M.F.: SEM (1978/1); SEM Inc., AMF O ’Hare Illinois 60666, p. 445-454.
139. European Pharmacopoeia, 4th Edition, Council of Europe, Strasbourg, 2002, pp. 561-564.

54
ACKNOWLEDGEMENTS
I am greatly thankful to Prof. István Erős and to Prof. Piroska Révész (the former and
the present Director of the Department of Pharmaceutical Technology, University of Szeged),
and to Dr. Zoltán Aigner (my supervisor), Prof. M. Kata, Prof. K. Pintye-Hódi, and Dr.
Ilidikó Csóka for their help and valuable advice.
I would also like to express my thanks to all my colleagues and to everyone at this
Department who has helped my work, for their excellent activities and assistance.
I am deeply grateful to Prof. György Dombi (Department of Pharmaceutical Analysis,
University of Szeged) and to Dr. Ottó Berkesi (Department of Physical Chemistry,
University of Szeged) for their help with the to measurements and analyses of my samples.
I express gratitude and great appreciation to my Family and to Aden University (Faculty
of Pharmacy, Yemen) for granting me their great trust.


![NANOSUSPENSION: BIOAVAILABILITY ENHANCING NOVEL … · or previous GI surgery (e.g. bariatric surgery) can also affect drug bioavailability [23]. Improvement of bioavailability: The](https://img.pdfslide.net/doc/110x75/5eb46ef2a9b685351d4067b1/nanosuspension-bioavailability-enhancing-novel-or-previous-gi-surgery-eg-bariatric.jpg)