Embed Size (px)
Citation preview

PHILIPPINE POWER SITUATION AND
OUTLOOK 2014-2020

6000
7000
8000
9000
10000
11000
12000
13000
14000
Jan
20
14
Feb
20
14
Mar
20
14
Ap
r 2
01
4M
ay 2
01
4Ju
n 2
01
4Ju
l 20
14
Au
g 2
01
4Se
p 2
01
4O
ct 2
01
4N
ov
20
14
De
c 2
01
4Ja
n 2
01
5Fe
b 2
01
5M
ar 2
01
5A
pr
20
15
May
20
15
Jun
20
15
Jul 2
01
5A
ug
20
15
Sep
20
15
Oct
20
15
No
v 2
01
5D
ec
20
15
Jan
20
16
Feb
20
16
Mar
20
16
Ap
r 2
01
6M
ay 2
01
6Ju
n 2
01
6Ju
l 20
16
Au
g 2
01
6Se
p 2
01
6O
ct 2
01
6N
ov
20
16
De
c 2
01
6Ja
n 2
01
7Fe
b 2
01
7M
ar 2
01
7A
pr
20
17
May
20
17
Jun
20
17
Jul 2
01
7A
ug
20
17
Sep
20
17
Oct
20
17
No
v 2
01
7D
ec
20
17
Jan
20
18
Feb
20
18
Mar
20
18
Ap
r 2
01
8M
ay 2
01
8Ju
n 2
01
8Ju
l 20
18
Au
g 2
01
8Se
p 2
01
8O
ct 2
01
8N
ov
20
18
De
c 2
01
8Ja
n 2
01
9Fe
b 2
01
9M
ar 2
01
9A
pr
20
19
May
20
19
Jun
20
19
Jul 2
01
9A
ug
20
19
Sep
20
19
Oct
20
19
No
v 2
01
9D
ec
20
19
Jan
20
20
Feb
20
20
Mar
20
20
Ap
r 2
02
0M
ay 2
02
0Ju
n 2
02
0Ju
l 20
20
Au
g 2
02
0Se
p 2
02
0O
ct 2
02
0N
ov
20
20
De
c 2
02
0
Available Capacity Committed Peak Demand Regulating Reserve Contingency Reserve Dispatchable Reserve
2015Feb: 87 MW Burgos WindMar : 2x150 MW SLPGC Coal
81 MW CaparispisanApr: 12 MW SJCI Biomass U2May: 18 MW IBEC BiomassAugl : 10.8 MW Green Biomass
13.2 MW Sabangan HEPSep: 67.5 MW Pililia WindOct: 100 MW Avion NatgasNov: 135 MW Puting Bato U2
LUZON SUPPLY-DEMAND OUTLOOK 2014-2020
Notesa. Required Reserve Margin (RM) i.e. 4% regulating reserve and contingency and dispatchable reserve requirement b. 4.2 % peak demand growth rate resulted from observed 0.6 elasticity ratio of demand for electric power with national economic growth applied to 7
percent GDP growth rate (GR) target for 2014-2015.c. 4.8 % peak demand growth rate resulted from observed 0.6 elasticity ratio of demand for electric power with national economic growth applied to 8
percent GDP growth rate (GR) target for 2016-2020.d. Assumed average forced outage of the total available capacity
2017Feb: 150 MW Limay Coal 2
10.8 MW Hypergreen BioDec: 500 MW SBPL Coal
2018Jun: 420 MW Pagbilao Coal
2014Oct: 18 MW Northwind P3Nov:12 MW SJCI Biomass U1Dec: 135 MW Puting Bato U1
7.5 MW Bataan Cogen
Actual
2016Feb:18 MW CJ Biomass
3.5 MW Bicol Biomass10.8 MW Cagayan Bio
Mar : 82 MW Anda Power450 MW Sn Gabriel
Sep: 150 MW Limay Coal 1
Month Jan Feb Mar Apr May Jun Jul Aug Sep Oct Nov Dec
(%) 5.3 6.2 6.3 4.9 7.7 7.0 6.3 4.7 5.5 8.2 5.89 5.6
MW 677 794 801 621 983 888 800 601 708 1041 738 716

COMMITTED POWER PROJECTSLuzon Grid Committed Power Projects, 2,792.10 MW
* Excluding off grid projects
Type Name of the ProjectProject
Proponent
Mother/ JV
CompanyLocation
Rated Capacity
(MW)
Target Testing &
Commissioning
Target
Commercial
Operation
WINDPhase 3: NorthWind Power
Development
Corporation
NorthWind Power
Development
Corporation
Bangui, Ilocos
Norte18 Jul-14 Oct-14
Bangui Bay Wind Power Project
BIOMASS24 MW SJCiPower Rice Husk-Fired Biomass
power Plant Project
San Jose City I
Power Corporation
San Jose City I
Power
Corporation
Brgy. Tulat, San
Jose, Nueva Ecija
P1 – 12 MW P1 – Jun 2014 P1 – Nov 2014
P2 – 12 MW P2 – Dec 2014 P2 – Apr 2015
COAL135 MW Puting Bato Coal Fired Power Plant
Phase I
South Luzon
Thermal Energy
Corp. (SLTEC)
Trans Asia Oil and
Energy
Development
Corporation
(TAOil)
Brgy. Puting Bato
West, Calaca,
Batangas
135 May-14 Oct-14
BIOMASS12.5 MW Bataan 2020 Rice hull-fired Cogen
PlantBataan 2020 Inc. Bataan 2020 Inc. Bataan 7.5 Oct-14 Dec-14
WINDPhase 1: EDC Burgos Wind
Power Corporation
Energy
Development
Corporation (EDC)
Nagsurot-Saoit,
Burgos, Ilocos
Norte
87 Aug-14 Feb-15Burgos Wind Power Project
COAL2 X 150 MW SLPGC Coal-Fired Power Plant
Phase I
2 x 150 MW
Southwest Luzon
Power Generation
Corporation
DMCI Power
Corporation
Brgy. San Rafael,
Calaca, Batangas300
U1 & U2 - Oct
2014
U1 – Mar 2015
U2 – Mar 2015
WIND Caparispisan Wind Energy Project
Northern Luzon
UPC Asia
Corporation
UPC Asia
Corporation
Brgy.
Caparispisan,
Pagudpud, Ilocos
Norte
81 Sep-14 Mar-15
BIOMASS 20 MW IBEC Biomass Power Plant
Isabela Biomass
Energy
Corporation
(IBEC)
Isabela Biomass
Energy
Corporation
(IBEC)
Isabela 18 Mar-15 May-15
As of 31 May 2014

COMMITTED POWER PROJECTSLuzon Grid Committed Power Projects, 2,792.10 MW
As of 31 May 2014
Type Name of the ProjectProject
Proponent
Mother/ JV
CompanyLocation
Rated
Capacity
(MW)
Target Testing &
Commissioning
Target
Commercial
Operation
BIOMASS 12 MW Biomass Power Plant Project
Green Innovations
for Tomorrow
Corporation
Green Innovations
for Tomorrow
Corporation
Nueva Ecija 10.8 Jun-15 Aug-15
HYDRO Sabangan HEPPHedcor Sabangan,
Inc.
Aboitiz Power
CorporationMt. Province 13.2 Jun-15 Aug-15
WINDPhase 1: Alternergy Wind
One CorporationAlternergy
Brgy. Halayhayin,
Pililla, Rizal67.5 Jul-15 Sep-15
Pililla Wind Power Project
NATGAS 100 MW San Gabriel Avion Project
Prime Meridian
PowerGen
Corporation
First Gen Power
Corporation
Barangay Bolbok,
Batangas100 Jan-2015 Oct-15
COAL135 MW Puting Bato Coal Fired Power Plant
Phase II
South Luzon
Thermal Energy
Corp. (SLTEC)
Phase 2
Trans Asia Oil and
Energy
Development
Corporation
(TAOil)
Brgy. Puting Bato
West, Calaca,
Batangas
135 Jun-14 Nov-15
BIOMASS20 MW Waste-to-Energy Project using
Thermal Gasifier Conversion
CJ Global Green
Energy Philippine
Corp.
CJ Global Green
Energy Philippine
Corp.
Camarines Sur 18 Dec-15 Feb-16
BIOMASS 3.5 MW Bicol Biomass Energy Corporation
Bicol Biomass
Energy
Corporation
Bicol Biomass
Energy
Corporation
Camarines Sur 3.15 Dec-15 Feb-16
BIOMASS12 MW Multi-Feedstock Biomass Power Plant
Project
Cagayan Biomass
Energy
Corporation
Cagayan Biomass
Energy
Corporation
Cagayan 10.8 Dec-15 Feb-16
NATGAS 450 MW San Gabriel PlantFirst Gas Power
Corp.
First Gen Power
Corporation
San Gabriel,
Batangas450 Dec-15 Mar-16
* Excluding off grid projects

COMMITTED POWER PROJECTSLuzon Grid Committed Power Projects, 2,792.10 MW
As of 31 May 2014
Type Name of the Project Project ProponentMother/ JV
CompanyLocation
Rated Capacity
(MW)
Target Testing &
Commissioning
Target Commercial
Operation
COAL
Anda Power Corporation's 82 MW
Ciculating Fluidized Bed Coal
Fired Power Plant
Anda Power
Corporation
Anda Power
Corporation
Brgy. Bundagul,
Mabalacat,
Pampanga
82 Sep-15 Mar-16
COAL Limay Power Plant Project Phase ISMC Consolidated
Power Corporation
SMC Consolidated
Power Corporation
Brgy. Lamao, Limay,
Bataan300
U1 - Mar 2016 U2
- Aug 2016
U1 - Sep 2016 U2 -
Feb 2017
BIOMASS 12 MW Biomass Power Project Hypergreen Hypergreen Bulacan 10.8 Dec-16 Feb-17
COALSan Buenaventura Power Ltd. Co.
(SBPL) Project
San Buenaventura
Power Ltd. Co.
(SBPL)
QPPL/EGCO Mauban, Quezon 500 Jul-17 Dec-17
COAL1 x 420 MW Pagbilao Coal-Fired
Thermal Power Plant
Pagbilao Energy
Corporation
TeaM Energy /
Aboitiz Power
Pagbilao Power
Station, Nrgy.
Ibabang Polo,
Pagbilao, Quezon
420 Jan-18 Jun-18
TOTAL 2,792.10
* Excluding off grid projects

INDICATIVE POWER PROJECTSLuzon Grid Indicative Power Projects, 9,520.80 MW
As of 31 May 2014
Name of the Project Project Proponent Mother/ JV Company LocationRated Capacity
(MW)Target Commissioning
2 X 20 MW FDC
Camarines CFB Coal
Power Plant
FDC Utilities, Inc. FDC Utilities, Inc. Camarines Sur 40 Mar-16
2 X 300 MW Coal-Fired
Power Plant
Redondo Peninsula
Energy, Inc.
MERALCO MGEN Power
Corporation/ Aboitiz Power
Corporation/ Taiwan
Cogeneration Corporation
Sitio Naglatore, Cawag, Subic
Bay Freeport Zone600
Unit I - October 2016
Unit II - December 2016
2 X 150 MW SLPGC
Coal-Fired Power Plant
Phase II
Southwest Luzon
Power Generation
Corporation
(Project Company)
DMCI Power CorporationBrgy. San Rafael, Calaca,
Batangas300
Unit I - 2016 Unit II
- 2016
2 X 300 MW Masinloc
Expansion
AES Masinloc
Power Partners
Co., Inc.
AES Philippines Power Partners
Co., LTD.Zambales 600
Unit 3 (300 MW) -
October 2017
Unit 4 (300 MW) -
October 2017
300 MW Limay Power
Plant Project Phase II SMC Consolidated
Power Corporation
SMC Consolidated Power
CorporationBrgy. Lamao, Limay, Bataan 300
Unit 1 - 150 MW - Jan.
2017
(2x150MW)Unit 2 - 150 MW - July
2017
2 X 600 MW Mariveles
Expansion Project
GNPower
Mariveles Coal
Plant Ltd. Co.
GNPower Ltd. Co. Mariveles, Bataan 1,200.00 2018
300 MW Limay Power
Plant Project Phase IIISMC Consolidated
Power Corporation
SMC Consolidated Power
CorporationBrgy. Lamao, Limay, Bataan 600 2019/2020
(2x300MW)
TOTAL COAL 3,640.00

INDICATIVE POWER PROJECTSLuzon Grid Indicative Power Projects, 9,520.80 MW
As of 31 May 2014
Name of the Project Project Proponent Mother/ JV Company LocationRated Capacity
(MW)Target Commissioning
Aero Derivative Combined
Cycle Power Plant
Calamba Aero
Power Corporation
MERALCO MGEN Power
CorporationCalamba, Laguna 150 TBA
TOTAL OIL-BASED 150
Pagbilao 600 MW
Combined Cycle Gas
Fired Power Plant
Energy World
Corporation (EWC)
Energy World Corporation
(EWC)
Isla Grande, Pagbilao, Quezon
Province600.00
U1 (200 MW)- Dec 2014
U2 (200 MW)- Dec 2015
U3 (200 MW)- Dec 2016
2 x 1,200 MW Combined
Cycle Gas Turbine Power
Plant Project
Atlantic, Gulf and
Pacific Company of
Manila, Inc
AG&PLimay, Bataan
(PNOC-AFC Industrial Estate)2,400.00
Unit 1 - March 2017
Unit II - March 2018
415 MW San Isidro
Combined Cycle Gas
Turbine Plant Project
Trans Asia Oil and
Energy
Development
Corporation (TAOil)
Trans Asia Oil and Energy
Development Corporation
(TAOil)
Pilipinas Shell Petroleum Co.'s
Tabangao Refinery, Brgy. San
Isidro and Tabangao-
Ambulong, Batangas City
415 Sep-17
LNG-Fired Combined
Cycle Power Plant *
Onshore Regasification
and Storage Terminal
Meralco PowerGen
Corporation and
Chubu Electric
Power
MERALCO MGEN Power
CorporationAtimonan, Quezon 1,750.00 2018-2019
TOTAL NATGAS 5,165.00
Tanawon Geothermal
Project
Energy
Development
Corporation (EDC)
Energy Development
Corporation (EDC)Guinlajon, Sorsogon 40 Dec-18
Rangas Geothermal
Project
Energy
Development
Corporation (EDC)
Energy Development
Corporation (EDC)Bacon District, Sorsogon 40 Jun-19
Kayabon Geothermal
Project
Energy
Development
Corporation (EDC)
Energy Development
Corporation (EDC)Manito, Albay 40 Dec-19
TOTAL GEOTHERMAL 120

INDICATIVE POWER PROJECTSLuzon Grid Indicative Power Projects, 9,520.80 MW
As of 31 May 2014
Name of the Project Project Proponent Mother/ JV Company LocationRated Capacity
(MW)Target Commissioning
Ibulao Hydroelectric
Power ProjectHydrocore, Inc. Hydrocore, Inc. Lagawe, Ifugao 4.5 May-15
Dupinga Hydroelectric
Power Project
Constellation
Energy CorporationExelon Corporation Gabaldon, Nueva Ecija 3 Oct-15
Main Aklan
Sunwest Water &
Electric Co., Inc.
(SUWECO)
Sunwest Water & Electric Co.,
Inc. (SUWECO)Libacao, Albay 15 Jul-16
Tinoc 2Philnew Hydro
Power Corporation
Philnew Hydro Power
CorporationTinoc, Ifugao 11 Dec-16
Tinoc 3Philnew Hydro
Power Corporation
Philnew Hydro Power
CorporationTinoc, Ifugao 8 Jun-17
PinacanauanSunwest Water &
Electric Co., Inc.
Sunwest Water & Electric Co.,
Inc. (SUWECO)Peñablanca, Cagayan 6 Jul-17
Tinoc 1Quadriver Energy
Corp.Quadriver Energy Corp. Tinoc, Ifugao 4.1 Apr-18
Tinoc 4Philnew Hydro
Power Corporation
Philnew Hydro Power
CorporationTinoc, Ifugao 5 Apr-18
Kapangan HEP
Cordillera Hydro
Electric Power
Corporation
(COHECO)
Kapangan & Kibungan,
Benguet60 TBA
2.6 MW Maapon River
Mini-Hydro Power Project
(MHP)
Renesons Energy
CorporationBrgy. Piis, Lucban, Quezon 2.6 TBA
TOTAL HYDRO 119.2
Currimao Solar
Photovoltaic Power
Project
Mirae Asia Energy
CorporationMirae Asia Energy Corporation Currimao, Ilocos Norte 20 Aug-14
CEZ Solar Rooftop Power
Project
Majestics Energy
Corporation
Cavite Economic Zones I and
II, Rosario and Gen. Trias,
Cavite
40 Jul-14
Macabud Solar
Photovoltaic Power
Project
ATN Philippines
Solar Energy
Group, Inc.
ATN Philippines Solar Energy
Group, Inc.
Brgy. Macabud, Rodriguez,
Rizal30 Feb-16
TOTAL SOLAR 90

INDICATIVE POWER PROJECTSLuzon Grid Indicative Power Projects, 9,520.80 MW
As of 31 May 2014
Name of the Project Project Proponent Mother/ JV Company LocationRated Capacity
(MW)Target Commissioning
Phase 2:EDC Burgos Wind
Power Corporation
Energy Development
Corporation (EDC)
Nagsurot-Saoit, Burgos, Ilocos
Norte63 Sep-14
Burgos Wind Power
Project
Balaoi Wind Power
Project
Northern Luzon
UPC Asia
Corporation
UPC Asia CorporationBrgy. Balaoi, Pagudpud, Ilocos
Norte45 Aug-15
Phase 2: Alternergy
Sembrano Wind
Corporation
AlternergyMt. Sembrano, Mabitac,
Laguna72 Apr-17
Mabitac Wind Power
Project
Phase 1:Energy Logics
Philippines, Inc.Delgado Group of Companies Pasuquin, Ilocos Norte 48 Jan-17Pasuquin East Wind
Power Project
TOTAL WIND 228
10 MW Serin
CorporationRice Husk-
Fired Power Plant
Serin Corporation Tarlac 8.6 TBA
TOTAL BIOMASS 8.6
TOTAL 9,520.80
6000
6500
7000
7500
8000
8500
9000
9500
10000
10500
11000
W-1
Jan
W-2
Jan
W-3
Jan
W-4
Jan
W-5
Fe
b
W-6
Fe
b
W-7
Fe
b
W-8
Fe
b
W-9
Mar
W-1
0 M
ar
W-1
1 M
ar
W-1
2 M
ar
W-1
3 M
ar
W-1
4 A
pr
W-1
5 A
pr
W-1
6 A
pr
W-1
7 A
pr
W-1
8 M
ay
W-1
9 M
ay
W-2
0 M
ay
W-2
1 M
ay
W-2
2 J
un
W-2
3 J
un
W-2
4 J
un
W-2
5 J
un
W-2
6 J
un
W-2
7 J
ul
W-2
8 J
ul
W-2
9 J
ul
W-3
0 J
ul
W-3
1 A
ug
W-3
2 A
ug
W-3
3 A
ug
W-3
4 A
ug
W-3
5 S
ep
W-3
6 S
ep
W-3
7 S
ep
W-3
8 S
ep
W-3
9 S
ep
W-4
0 O
ct
W-4
1 O
ct
W-4
2 O
ct
W-4
3 O
ct
W-4
4 N
ov
W-4
5 N
ov
W-4
6 N
ov
W-4
7 N
ov
W-4
8 D
ec
W-4
9 D
ec
W-5
0 D
ec
W-5
1 D
ec
W-5
2 D
ec
Available Capacity Committed Capacity System Peak Regulating Reserve Contingency Reserve Dispatchable Reserve
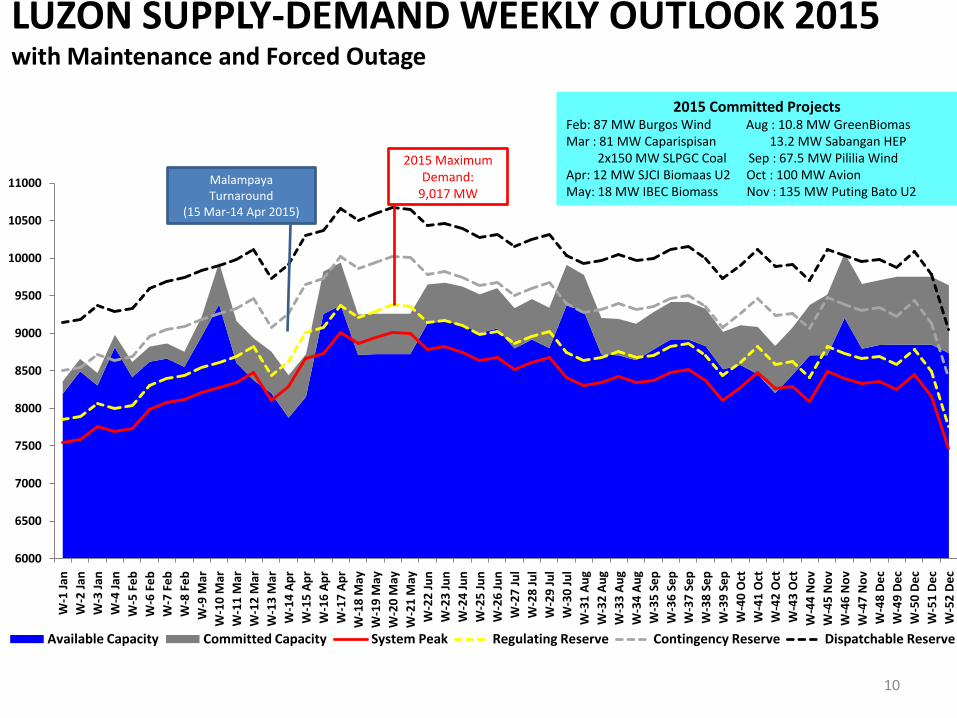
MalampayaTurnaround
(15 Mar-14 Apr 2015)
2015 Maximum Demand:
9,017 MW
LUZON SUPPLY-DEMAND WEEKLY OUTLOOK 2015with Maintenance and Forced Outage
10
2015 Committed ProjectsFeb: 87 MW Burgos Wind Aug : 10.8 MW GreenBiomasMar : 81 MW Caparispisan 13.2 MW Sabangan HEP
2x150 MW SLPGC Coal Sep : 67.5 MW Pililia Wind Apr: 12 MW SJCI Biomaas U2 Oct : 100 MW AvionMay: 18 MW IBEC Biomass Nov : 135 MW Puting Bato U2

11
2,000
3,000
4,000
5,000
6,000
7,000
8,000
9,000
10,000
11,000
W1
W5
W1
0
W1
5
W2
0
W2
5
W3
0
W3
5
Total Available Capacity System Demand Regulating Reserve Contingency Reserve Dispatchable Reserve
LUZON POWER SUPPLY-DEMAND SITUATION1 JANUARY to 31 August 2014 (Daily)
Holy Week
January February
Actual Peak Demand =8,717 MW (21 May)
17 Jun 2014:Malampaya Gas Restriction
Red AlertManual Load Dropped: 105 MW
25 Jun 2014:Outages of Sual 1 (647
MW), Calaca 1 (300 MW), Masinloc 2 (315
MW), derated capability of GN power 1&2
12 -13 Jul 2014PIGging, Ilijan Pipeline
Limited Capacity of Ilijan Gas plant
Typhoon “Glenda”16 Jul 2014
March April May June July August

500
1000
1500
2000
2500
3000
3500
Jan
20
14
Feb
20
14
Mar
20
14
Ap
r 2
01
4M
ay 2
01
4Ju
n 2
01
4Ju
l 20
14
Au
g 2
01
4Se
p 2
01
4O
ct 2
01
4N
ov
20
14
De
c 2
01
4Ja
n 2
01
5Fe
b 2
01
5M
ar 2
01
5A
pr
20
15
May
20
15
Jun
20
15
Jul 2
01
5A
ug
20
15
Sep
20
15
Oct
20
15
No
v 2
01
5D
ec
20
15
Jan
20
16
Feb
20
16
Mar
20
16
Ap
r 2
01
6M
ay 2
01
6Ju
n 2
01
6Ju
l 20
16
Au
g 2
01
6Se
p 2
01
6O
ct 2
01
6N
ov
20
16
De
c 2
01
6Ja
n 2
01
7Fe
b 2
01
7M
ar 2
01
7A
pr
20
17
May
20
17
Jun
20
17
Jul 2
01
7A
ug
20
17
Sep
20
17
Oct
20
17
No
v 2
01
7D
ec
20
17
Jan
20
18
Feb
20
18
Mar
20
18
Ap
r 2
01
8M
ay 2
01
8Ju
n 2
01
8Ju
l 20
18
Au
g 2
01
8Se
p 2
01
8O
ct 2
01
8N
ov
20
18
De
c 2
01
8Ja
n 2
01
9Fe
b 2
01
9M
ar 2
01
9A
pr
20
19
May
20
19
Jun
20
19
Jul 2
01
9A
ug
20
19
Sep
20
19
Oct
20
19
No
v 2
01
9D
ec
20
19
Jan
20
20
Feb
20
20
Mar
20
20
Ap
r 2
02
0M
ay 2
02
0Ju
n 2
02
0Ju
l 20
20
Au
g 2
02
0Se
p 2
02
0O
ct 2
02
0N
ov
20
20
De
c 2
02
0
Committed Available Capacity Peak Demand Regulating Reserve Contingency Reserve Dispatchable Reserve
Notesa. Reserve Margin (RM) i.e. 4% regulating reserve and largest online unit for contingency and dispatchable reserve requirement (100 MW
to increase by 135 MW in 2016)b. 7 % peak demand growth rate resulted from observed 1 elasticity ratio of demand for electric power with national economic growth
applied to 7 percent GDP growth rate (GR) target for 2014-2015.c. 8 % peak demand growth rate resulted from observed 1 elasticity ratio of demand for electric power with national economic growth
applied to 8 percent GDP growth rate (GR) target for 2016-2020.d. Assumed 4.35 percent average forced outage of the total available capacity
2014Oct: 8 MW Villasiga HEPNov: 31 MW URC Biomass
82 MW TPC Expansion
2015Feb: 50 MW Nabas Wind
3 MW HPC BiomassApr: 54 MW Sn Lorenzo Wind
2016Jun: 135 MW Concepcion Coal 1Nov: 135 MW Concepcion Coal 2
Actual
VISAYAS SUPPLY-DEMAND OUTLOOK 2014-2020

COMMITTED POWER PROJECTS
Visayas Grid Committed Power Projects, 529.6 MW
Type. Name of the Project Project ProponentMother/ JV
CompanyLocation
Rated
Capacity
(MW)
Target Testing &
Commissioning
Target
Commercial
Operation
HYDRO Villasiga HEP
Sunwest Water &
Electric Co., Inc.
(SUWECO)
Sunwest Water &
Electric Co., Inc.
(SUWECO)
Brgy.
Igsoro, Bugasong,
Antique
8 May-14 Oct-14
BIOMASS
46 MW Universal Robina
Corporation Bagasse
Cogeneration Facility
Universal Robina
Corporation
JG Summit
Holdings Inc.
Negros
Occidental31 Sep-14 Nov-14
COAL
TPC Coal-Fired Power Plant
Expansion Project (1 x 82 MW
Coal-Fired Power Plant
Toledo Power
Company
Global Business
Power CorporationToledo City, Cebu 82 Sep-14 Nov-14
WIND Nabas Wind Power ProjectPetrogreen Energy
Corporation
Petrogreen Energy
Corporation
Brgy. Pawa,
Nabas, Aklan50 Dec-14 Feb-15
BIOMASS20 MW SCBiopower Bagasse-
Fired Power Generation Project
San Carlos
Biopower Inc.
Bronzeoak
Philippines
Negros
Occidental18 Dec-14 Feb-15
BIOMASS8.0 MW HPCo Bagasse
Cogeneration Plant
Hawaiian
Philippines
Company
Hawaiian
Philippines
Company
Negros
Occidental3 Dec-14 Feb-15
WIND
54 MW San Lorenzo Wind
Power Project
Trans-Asia
Renewable Energy
Corporation
Trans Asia Oil and
Energy
Development
Corporation (TAOil)
San Lorenzo,
Guimaras Island54 Feb-15 Apr-15
(8 MW & 46 MW)
* off grid** assumed project cost figure based on DOE database
As of 31 May 2014

COMMITTED POWER PROJECTSVisayas Grid Committed Power Projects, 529.6 MW
Type Name of the ProjectProject
Proponent
Mother/ JV
CompanyLocation
Rated
Capacity
(MW)
Target Testing &
Commissioning
Target
Commercial
Operation
BIOMASS
Consolacion Landfill Methane
Recovery and Electricity
Generation
Asian Energy
System
Corporation
Asian Energy
System CorporationCebu 3.6 Jun-15 Aug-15
COAL
2 X 135 MW Concepcion Coal-
fired Power PlantPalm Thermal
Consolidated
Holdings Corp.
AC Energy
Holdings, Inc./
Palm Thermal
Consolidated
Holdings
Corporation/ Jin
Navitas Resource,
Inc.
Brgy. Nipa,
Concepcion, Iloilo270
U1 - Sep 2015
U2 – May 2016
U1 - Jun 2016
U2 - Nov 2016Phase 1-135MW (1st
Unit)
Phase 2-135MW (2nd
Unit)
BIOMASS26 MW VMCI Bagasse-Fired
Cogeneration Plant
Victorias Milling
Company Inc.
Victorias Milling
Company Inc.
Negros
Occidental2 TBA TBA
HYDRO Cantakoy HEPQuadriver Energy
Corp.
Quadriver Energy
Corp.Danao, Bohol 8 TBA TBA
TOTAL 529.6
* off grid** assumed project cost figure based on DOE database
As of 31 May 2014

INDICATIVE POWER PROJECTSVisayas Grid Indicative Power Projects, 776.2 MW
Name of the Project Project Proponent Mother/ JV Company LocationRated Capacity
(MW)Target Commissioning
PEDC Expansion ProjectPanay Energy
Development CorporationGlobal Business Power
Corporation
Brgy. Ingore, La
Paz, Iloilo150 Dec-2015Former report (1x150 MW
Circulating Fluidized Bed (CFB)
Coal-Fired Power Plant)
(Global Business Power
Corporation)
1 X 20 MW FDC Danao CFB Coal
Power PlantFDC Utilities, Inc. FDC Utilities, Inc. Danao City, Cebu 20 Dec-2016
300 MW Therma Visayas Energy
ProjectTherma Visayas Inc.
Aboitiz Power
Corporation
Brgy. Bato,
Toledo City, Cebu300 Mar-2017
TOTAL COAL 470
49 MW Biliran Geothermal Plant
Project
Biliran Geothermal
Incorporated
Orka Energy Philippines
(Iceland)Biliran, Biliran 49 Dec-2015
Dauin Geothermal ProjectEnergy Development
Corporation (EDC)
Energy Development
Corporation (EDC)
Dauin, Negros
Oriental40 Dec-2018
Southern Leyte Geothermal Plant
Geothermal Project (formerly
known as Mt. Cabalian
Geothermal)
Energy Development
Corporation
Energy Development
Corporation (EDC)
Cabalian,
Southern LeyteTBA TBA
TOTAL GEOTHERMAL 89
Leyte Solar Photovoltaic Power
Project
Phil. Solar Farm-Leyte,
Inc.
Phil. Solar Farm-Leyte,
Inc.Ormoc City, Leyte 30 Jan-2015
TOTAL SOLAR 30
Pulupandan Wind Power ProjectFirst Maxpower
International Corporation
First Maxpower
International Corporation
Pulupandan,
Negros
Occidental
50 Nov-2015
TOTAL WIND 50
As of 31 May 2014

INDICATIVE POWER PROJECTSVisayas Grid Indicative Power Projects, 776.2 MW
Name of the Project Project Proponent Mother/ JV Company LocationRated Capacity
(MW)Target Commissioning
Igbulo (Bais) Hydroelectric Power
Project
Century Peak Energy
Corporation
Century Peak Metals
Holdings CorpIgbaras, Iloilo 5.1 Jan-2015
Hilabangan (Upper Cascade)Century Peak Energy
Corporation
Century Peak Metals
Holdings Corp
Kabankalan,
Negros Occidental4.8 Aug-2015
Hilabangan (Lower Cascade)Century Peak Energy
Corporation
Century Peak Metals
Holdings Corp
Kabankalan,
Negros Occidental3 Aug-2015
Maninila (Lower Cascade)Century Peak Energy
Corporation
Century Peak Metals
Holdings Corp
San Remigio,
Antique4.5 Oct-2016
Maninila (Upper Cascade)Century Peak Energy
Corporation
Century Peak Metals
Holdings Corp
San Remigio,
Antique3.1 Oct-2016
Sibalom (Upper Cascade)Century Peak Energy
Corporation
Century Peak Metals
Holdings Corp
San Remigio,
Antique4.2 Oct-2016
Sibalom (Middle Cascade)Century Peak Energy
Corporation
Century Peak Metals
Holdings Corp
San Remigio,
Antique4 Oct-2016
Sibalom (Lower Cascade)Century Peak Energy
Corporation
Century Peak Metals
Holdings Corp
San Remigio,
Antique3.3 Oct-2016
Timbaban Hydroelectric Power
Project
Oriental Energy and
Power Generation
Corporation
Oriental Peninsula
Resources Group Inc
(ORE)
Madalag, Aklan 18 Aug-2017
Loboc Hydro Power ProjectSta Clara Power
CorporationSta Clara Int’l Corporation Loboc, Bohol 1.2 TBA
TOTAL HYDRO 51.2
46 MW Biomass-Fired
Cogeneration Power Plant
Universal Robina
CorporationJG Summit Holdings Inc.
Kabankalan,
Negros Occidental46 Jul-2014
TOTAL BIOMASS 46
40 MW Battery Storage ProjectAES Philippines Power
Partners Co., LTD.
AES Philippines Power
Partners Co., LTD.
Kabankalan,
Negros Occidental40 Mar-2015
TOTAL BATTERY 40
TOTAL 776.2
As of 31 May 2014

1400
1500
1600
1700
1800
1900
2000
2100
2200
Jan 2015 Feb 2015 Mar 2015 Apr 2015 May 2015 Jun 2015 Jul 2015 Aug 2015 Sep 2015 Oct 2015 Nov 2015 Dec 2015
Committed Available Capacity Peak Demand Regulating Reserve Contingency Reserve Dispatchable Reserve
2015 Maximum Demand:
1,847 MW
VISAYAS SUPPLY-DEMAND MONTHLY OUTLOOK 2015with Maintenance and Forced Outage
17
2015Feb: 50 MW Nabas Wind
3 MW HPC BiomassApr: 54 MW Sn Lorenzo Wind

18
600
800
1,000
1,200
1,400
1,600
1,800
2,000
W1
W5
W1
0
W1
5
W2
0
W2
5
W3
0
W3
5
Total Available Capacity System Demand Regulating Reserve Contingency Reserve Dispatchable Reserve
VISAYAS POWER SUPPLY-DEMAND SITUATION1 JANUARY to 31 August 2014 (Daily)
January February March April May June July August
Source: NGCP Daily Operations Report
Earthquake in LeyteAffected Power Plants:Mahiao Geo (120 MW)
Actual Peak Demand =1,617 MW (27 May)
PEDC 1 Forced Outage: 18-24 May 2014PEDC 2 Forced Outage: 24-29 May 2014CEDC 1 Forced Outage: 16-23 May 2014
CEDC U3 Forced Outage: 28 May-3 Jun 2014
CEDC 1 Planned Outage: 5 Jun-5 Jul 2014KSPC 1 Coal Planned Outage: 5-24 Jul 2014
Holy Week

400
900
1400
1900
2400
2900
3400
3900
Jan
20
14
Feb
20
14
Mar
20
14
Ap
r 2
01
4M
ay 2
01
4Ju
n 2
01
4Ju
l 20
14
Au
g 2
01
4Se
p 2
01
4O
ct 2
01
4N
ov
20
14
De
c 2
01
4Ja
n 2
01
5Fe
b 2
01
5M
ar 2
01
5A
pr
20
15
May
20
15
Jun
20
15
Jul 2
01
5A
ug
20
15
Sep
20
15
Oct
20
15
No
v 2
01
5D
ec
20
15
Jan
20
16
Feb
20
16
Mar
20
16
Ap
r 2
01
6M
ay 2
01
6Ju
n 2
01
6Ju
l 20
16
Au
g 2
01
6Se
p 2
01
6O
ct 2
01
6N
ov
20
16
De
c 2
01
6Ja
n 2
01
7Fe
b 2
01
7M
ar 2
01
7A
pr
20
17
May
20
17
Jun
20
17
Jul 2
01
7A
ug
20
17
Sep
20
17
Oct
20
17
No
v 2
01
7D
ec
20
17
Jan
20
18
Feb
20
18
Mar
20
18
Ap
r 2
01
8M
ay 2
01
8Ju
n 2
01
8Ju
l 20
18
Au
g 2
01
8Se
p 2
01
8O
ct 2
01
8N
ov
20
18
De
c 2
01
8Ja
n 2
01
9Fe
b 2
01
9M
ar 2
01
9A
pr
20
19
May
20
19
Jun
20
19
Jul 2
01
9A
ug
20
19
Sep
20
19
Oct
20
19
No
v 2
01
9D
ec
20
19
Jan
20
20
Feb
20
20
Mar
20
20
Ap
r 2
02
0M
ay 2
02
0Ju
n 2
02
0Ju
l 20
20
Au
g 2
02
0Se
p 2
02
0O
ct 2
02
0N
ov
20
20
De
c 2
02
0
Committed Available Capacity Peak Demand Regulating Reserve Contingency Reserve Dispatchable Reserve
MINDANAO SUPPLY-DEMAND OUTLOOK 2014-2020
Notesa. Required Reserve Margin (RM) i.e. 4% regulating reserve and contingency and dispatchable reserve requirement b. 5.6 % peak demand growth rate resulted from observed 0.8 elasticity ratio of demand for electric power with national economic growth
applied to 7 percent GDP growth rate (GR) target for 2014-2015.c. 12.8 % peak demand growth rate resulted from observed 1.6 elasticity ratio of demand for electric power with national economic growth
applied to 8 percent GDP growth rate (GR) target for 2016d. 8 % peak demand growth rate resulted from observed 1 elasticity ratio of demand for electric power with national economic growth
applied to 8 percent GDP growth rate (GR) target for 2017-2020e. Assumed 3.3 percent average forced outage of the total dependable capacity
2015Mar: 150 MW Therma South 1
150 MW Therma South 2Sep: 30 MW Puyo HEP
100 MW Sarangani Coal 1Dec: 150 MW SMC Davao P1 -1
2014Oct: 26.1 MW Peak Power
2016Feb: 40 MW BiomassMay: 25 MW Lake Mainit HEPJun: 135 MW FDC Coal U1Sep: 135 MW FDC Coal U2
150 MW SMC Davao P1-2Nov: 100 MW Sarangani Coal U2Dec: 135 MW FDC Coal U3
2017Jan: 1.6 MW Phil BioMar: 9 MW Limbatangon HEP
540 MW PSAGCORP
Actual

COMMITTED POWER PROJECTSMindanao Grid Committed Power Projects, 1,876.7 MW
Type Name of the Project Project Proponent Mother/ JV Company LocationRated Capacity
(MW)
Target Testing &
Commissioning
Target
Commercial
Operation
OIL3x6.97 PSI MW Bunker-
Fired Power Plant
Peak Power
Soccsargen, Inc. (PSI)
Peak Power Energy
Inc. (subsidiary of A
Brown)
National
Highway, Brgy.Apopong,
General Santos City
20.9 Aug-14 Sep-14
OIL1x5.2 MW PSFI Bunker-
Fired Power Plant
Peak Power San
Francisco (PSFI)
Peak Power Energy
Inc. (subsidiary of A
Brown)
ASELCO Compound,
Brgy. San Isidro,San
Francisco, Agusan del
Sur
5.2 Aug-14 Sep-14
COAL
2 X 150 MW Coal-Fired
Therma South Energy
Project
Therma South Inc.Aboitiz Power
Corporation
Brgy. Binugao, Toril,
Davao City and Brgy.
Inawayan, Sta. Cruz,
Davao Del Sur
300U1 – Nov 2014
U2 – Nov 2014
U1 & U2 - Mar
2015
COAL
2 X 100 MW Southern
Mindanao Coal Fired
Power Station
Sarangani Energy
Corporation
Alsons Power
Corporation
Brgy, Kamanga,
Maasim, Sarangani200 Feb-15
Unit 1 Sep-15
Unit 2 Nov-16
HYDROPuyo Hydroelectric Power
Project
First Gen Mindanao
Hydropower Corp.
First Gen Power
Corporation
Jabonga, Agusan del
Norte30 Jul-15 Sep-15
COALSMC Davao Power Plant
Project Phase I
San Miguel
Consolidated Power
Corporation
San Miguel
Consolidated Power
Corporation
Brgy. Culaman, Malita,
Davao del Sur300
U1 - Oct 2015
U2 - Jul 2016
U1 - Dec 2015
U2 - Sep 2016

COMMITTED POWER PROJECTSMindanao Grid Committed Power Projects, 1,876.7 MW
Type Name of the Project Project Proponent Mother/ JV Company LocationRated
Capacity (MW)
Target Testing &
Commissioning
Target
Commercial
Operation
BIOMASS
10 MW Kalilangan Bio-
Energy Corporation Multi
Feedstock Power
Generating Facility
Kalilangan Bio-Energy
Corporation
Kalilangan Bio-Energy
Corporation
FIBECO, Anahawan,
maramag, Bukidnon10 Dec-15 Feb-16
BIOMASS
10 MW Don Carlos Bio-
Energy Corporation Multi
Feedstock Power
Generating Facility
Don Carlos Bio-Energy
Corporation
Don Carlos Bio-Energy
Corporation
FIBECO, Anahawan,
maramag, Bukidnon10 Dec-15 Feb-16
BIOMASS
10 MW Malaybalay Bio-
Energy Corporation Multi
Feedstock Power
Generating Facility
Malaybalay Bioenergy
Corporation
Malaybalay Bioenergy
Corporation
FIBECO, Anahawan,
maramag, Bukidnon10 Dec-15 Feb-16
BIOMASS15 MW LPC Biomass
Power Plant Project
Lamsan Power
Corporation
Lamsan Power
CorporationMaguindanao 10 Dec-15 Feb-16
HYDRO Lake MainitAgusan Power
CorporationTranzen Group Inc.
Jabonga, Agusan del
Norte25 Mar-16 May-16
COAL
3 X 135 MW FDC-
Misamis Circulating
Fluidized Bed (CFB)
Coal-Fired Power Plant
Project
FDC Utilities, Inc. FDC Utilities, Inc.
Phividec Industrial
Estate, Villanueva,
Misamis Oriental
405
U1 – Dec 2015
U2 – Mar 2016
U3 – Jun 2016
U1 – Jun 2016
U2 – Sep 2016
U3 – Dec 2016
HYDRO
Limbatangon
Hydroelectric Power
Project
Turbines Resource &
Development Corp.
Turbines Resources
and Development
Corp. (TRDC)
Cagayan de Oro City,
Misamis Oriental9 Jan-17 Mar-17
COALPsagCorp Coal-Fired
Power Plant
GN Power
KausawaganGN Power Ltd. Co.
Kauswagan, Lanao del
Norte540 Dec-16 Mar-17
BIOMASS3 MW Biomass
Cogeneration Facility
Philippine Trade
Center, Inc.
Philippine Trade
Center, Inc.Maguindanao 1.6 TBA TBA
TOTAL 1,876.70

INDICATIVE POWER PROJECTSMindanao Grid Indicative Power Projects, 1,726.6 MW
Name of the Project Project Proponent Mother/ JV Company LocationRated Capacity
(MW)Target Commissioning
Davao del Norte 20 MW
Circulating Fluidized Bed
Biomass-Coal Fired
Thermal Power Plant
FDC Utilities, Inc. FDC Utilities, Inc.Maco, Davao del
Norte20 Mar-15
300 MW SMC Davao Power
Plant Project Phase I
San Miguel Consolidated Power
Corporation
San Miguel Consolidated
Power Corporation
Brgy. Culaman,
Malita, Davao del
Sur
300150 MW - Oct. 2015
150 MW - March 2016
ZAM 100 MW Circulating
Fluidized Bed (CFB) Coal-
Fired Power Station
San Ramon Power Inc. Mapalad Power Corporation
Sitio San Ramon,
Bgry. Talisayan,
Zamboanga City
100 Dec-15
Sibuguey Power Plant
Project
Philippine National Oil Company
(PNOC-EC)
Philippine National Oil
Company (PNOC)
Sibugay,
Zamboanga100 Sep-16
2x55 MW Balingasag
Thermal Power Plant
(Circulating Fluidized Bed
Combustion (CFBC) Coal-
Fired Power Plant Plant)
Minergy Coal Corporation Minergy
Brgy. Mandangoa,
Balingasag,
Misamis Oriental
110 Jan-17
600 MW SMC Davao Power
Plant Project Phase III
San Miguel Consolidated Power
Corporation
San Miguel Consolidated
Power Corporation
Brgy. Culaman,
Malita, Davao del
Sur
600300 MW - Dec 2019
300 MW - Dec 2020
300 MW SMC Davao Power
Plant Project Phase II
San Miguel Consolidated Power
Corporation
San Miguel Consolidated
Power Corporation
Brgy. Culaman,
Malita, Davao del
Sur
300 Dec-20
TOTAL COAL 1,530.00
Mindanao 3 GeothermalEnergy Development
Corporation
Energy Development
Corporation
Kidapawan, North
Cotabato50 Dec-17
TOTAL GEO 50

INDICATIVE POWER PROJECTSMindanao Grid Indicative Power Projects, 1,726.6 MW
Name of the Project Project Proponent Mother/ JV Company LocationRated Capacity
(MW)Target Commissioning
Tagoloan HydropowerFirst Gen Mindanao
Hydropower Corp.
First Gen Power
Corporation
Impasugong &
Sumilao,
Bukidnon
39 Oct-15
Bubunawan Hydroelectric
Power Project
First Gen Mindanao
Hydropower Corp.
First Gen Power
Corporation
Baungon and
Libona, Bukidnon23 Oct-15
Tumalaong Hydroelectric
Power Project
First Gen Mindanao
Hydropower Corp.
First Gen Power
Corporation
Baungon,
Bukidnon9 Oct-15
Cabadbaran Hydroelectric
Power Project
First Gen Mindanao
Hydropower Corp.
First Gen Power
Corporation
Cabadbaran,
Agusan del Norte9.75 Dec-15
Pasonanca Philcarbon, Inc. Philcarbon, Inc. Zamboanga City 0.1 Mar-17
Culaman Hydroelectric
Power Project
Oriental Energy and Power
Generation Corporation
Oriental Energy and Power
Generation Corporation
Manolo Fortich,
Bukidnon10 Jun-18
TOTAL HYDRO 90.8
Digos Solar Photovoltaic
Power Project
Enfinity Philippines Renewable
Resources, Inc.Enfinity
Digos City, Davao
del Sur10 Oct-14
Darong Solar Photovoltaic
Power ProjectPhilNew Energy Inc. PhilNew Energy Inc.
Sta. Cruz, Davao
del Sur35
September 2015 (Subject
to FIT)
TOTAL SOLAR 45
12 MW Biomass Power
Plant Project
Misamis Oriental Bio-Energy
Corporations
Misamis Oriental Bio-
Energy CorporationsMisamis Oriental 10.8 2015
TOTAL BIOMASS 10.8
TOTAL 1,726.60

900
1100
1300
1500
1700
1900
2100
2300
Jan 2015 Feb 2015 Mar 2015 Apr 2015 May 2015 Jun 2015 Jul 2015 Aug 2015 Sep 2015 Oct 2015 Nov 2015 Dec 2015
Committed Available Capacity Peak Demand Regulating Reserve Contingency Reserve Dispatchable Reserve
2015 Maximum Demand:
1,583 MW
MINDANAO SUPPLY-DEMAND MONTHLY OUTLOOK 2015with Maintenance and Forced Outage
24
2015Mar: 150 MW Therma South 1
150 MW Therma South 2Sep: 30 MW Puyo HEP
100 MW Sarangani Coal 1Dec: 150 MW SMC Davao P1 -1

25
600
800
1,000
1,200
1,400
1,600
1,800
W1
W5
W1
0
W1
5
W2
0
W2
5
W2
8
W3
3
Available capacity Peak Demand Regulating Reserve Contingency Reserve Dispatchable Reserve
MINDANAO POWER SUPPLY-DEMAND SITUATION1 JANUARY to 31 August 2014 (Daily)
January February March April May June July August
Source: NGCP Daily Operations Report
2014 Actual Peak Demand =1,420 MW (28 May)
Holy Week
27 Feb 2014Mindanao Blackout
Affected Power Plant200 MW Mindanao Coal-fired (MCF)
Restoration of 200 MW MCFUnit 2 : 8 May 2014Unit 1 : 1 June 2014

PHILIPPINE POWER SITUATION AND
OUTLOOK 2014-2020
End of Presentation

2015 Luzon Outlook for Summer Period
March to June 2015 extended to July 9 10 11 12 13 14 15 16 17 18 19 20 21 22 23 24 25 26 27 28 29 30
28- M6 07-13 14-20 21-27 28-A3 04-10 11-17 18-24 25-M1 02-08 09-15 16-22 23-29 30-J5 06-12 13-19 20-26 27-J3 04-10 11-17 18-24 25-31
Installed Capacity 12,769 12,769 12,769 12,769 12,769 12,769 12,769 12,769 12,769 12,769 12,769 12,769 12,769 12,769 12,769 12,769 12,769 12,769 12,769 12,769 12,769 12,769
Dependable Capacity 11,389 11,389 11,389 11,389 11,389 11,389 11,389 11,389 11,389 11,389 11,389 11,389 11,389 11,389 11,389 11,389 11,389 11,389 11,389 11,389 11,389 11,389
Existing Available Capacity (less PO) 9,079 8,922 8,844 8,934 8,855 8,476 8,751 9,666 9,676 9,732 9,772 10,102 10,012 9,715 9,625 9,625 9,453 9,418 9,238 9,304 9,324 9,224
+ Committed Capacity 245 245 245 295 445 442 442 442 453 397 397 397 415 391 391 391 541 563 563 563 563 563
Available Capacity (less PO plus Committed) 9,324 9,167 9,089 9,229 9,299 8,918 9,193 10,108 10,129 10,129 10,169 10,499 10,427 10,106 10,016 10,016 9,994 9,981 9,801 9,867 9,887 9,787
- Estimated Forced Outage 631 631 631 631 631 712 712 712 712 642 642 642 642 858 858 858 858 856 856 856 856 856
Available Capacity (less PO+FO) 8,693 8,536 8,458 8,598 8,668 8,206 8,481 9,396 9,417 9,488 9,528 9,858 9,786 9,248 9,158 9,158 9,136 9,125 8,945 9,011 9,031 8,931
- System Peak Demand 8,210 8,280 8,350 8,480 8,110 8,290 8,660 8,730 9,013 8,860 8,940 9,017 9,000 8,790 8,820 8,750 8,640 8,680 8,520 8,610 8,680 8,410
GROSS RESERVE 483 256 108 118 558 (84) (179) 666 404 628 588 841 786 458 338 408 496 445 425 401 351 521
Req'd Regulating Reserve (RR) 328 331 334 339 324 332 346 349 361 354 358 361 360 352 353 350 346 347 341 344 347 336
Req'd Contingency Reserve (CR) 647 647 647 647 647 647 647 647 647 647 647 647 647 647 647 647 647 647 647 647 647 647
Req'd Dispatchable Reserve (DR) 647 647 647 647 647 647 647 647 647 647 647 647 647 647 647 647 647 647 647 647 647 647
NET RESERVE (Gross - RR) 154 (75) (226) (221) 234 (416) (526) 317 43 273 230 480 426 107 (14) 58 151 97 84 56 3 184
NET RESERVE' (Gross - RR - 647) (493) (722) (873) (868) (413) (1,063) (1,173) (330) (604) (374) (417) (167) (221) (540) (661) (589) (496) (550) (563) (591) (644) (463)
JULY 2015MARCH 2015 APRIL 2015 MAY 2015 JUNE 2015
Note:• Possible Manual Load Dropping on Red Alert Status• Regulating Reserve, Refers to a Generating Unit that assists in Frequency Control by providing automatic Primary and/or Secondary Frequency response, equivalent to 4% of Peak
Demand• Contingency Reserve, Generating Capacity that is intended to take care of the loss of the largest Synchronized Generating Unit or the power import from a single Grid
interconnection, whichever is larger. Contingency Reserve in Luzon is 647 MW
LUZON SUPPLY-DEMAND OUTLOOKRevised Outlook (based on the data as of 27 October 2014)• With Maintenance and Forced Outage
27
New Development: Petron capacity was originally reflected in available capacity at 60MW but Refinery Master Plant will be in full blast by next year thus the capacity that will be exported to the grid will be reduced to 10 MW.

Power Plant Capacity (MW) When Committed (2014)
Avion 100 July
MEI (Limay) 36 August
Bauang Rehab 20 August
JG Summit (Batangas) 60 August
Botocan (Laguna) 20 August
Millenium Energy Inc. (MEI), Navotas 100 September
MERALCO ILP 118 October
TOTAL 454
Additional Capacity (as of 17 October 2014)
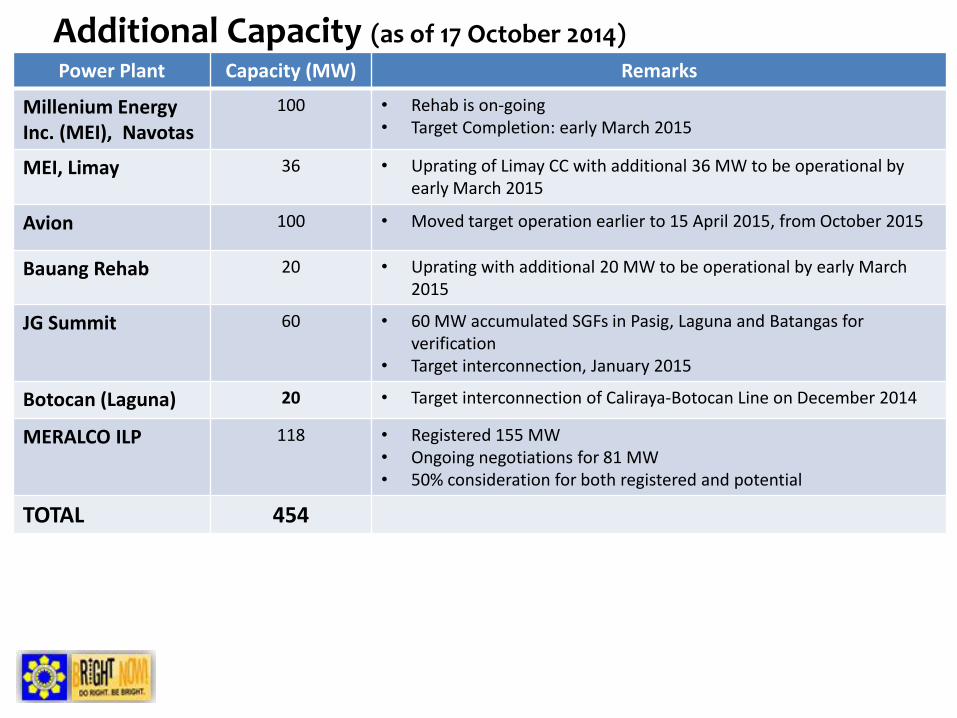
Power Plant Capacity (MW) Remarks
Millenium EnergyInc. (MEI), Navotas
100 • Rehab is on-going • Target Completion: early March 2015
MEI, Limay 36 • Uprating of Limay CC with additional 36 MW to be operational by early March 2015
Avion 100 • Moved target operation earlier to 15 April 2015, from October 2015
Bauang Rehab 20 • Uprating with additional 20 MW to be operational by early March 2015
JG Summit 60 • 60 MW accumulated SGFs in Pasig, Laguna and Batangas for verification
• Target interconnection, January 2015
Botocan (Laguna) 20 • Target interconnection of Caliraya-Botocan Line on December 2014
MERALCO ILP 118 • Registered 155 MW• Ongoing negotiations for 81 MW • 50% consideration for both registered and potential
TOTAL 454
Additional Capacity (as of 17 October 2014)

2015 Luzon Outlook for Summer Period
March to June 2015 extended to July 9 10 11 12 13 14 15 16 17 18 19 20 21 22 23 24 25 26 27 28 29 30
28- M6 07-13 14-20 21-27 28-A3 04-10 11-17 18-24 25-M1 02-08 09-15 16-22 23-29 30-J5 06-12 13-19 20-26 27-J3 04-10 11-17 18-24 25-31
Installed Capacity 12,769 12,769 12,769 12,769 12,769 12,769 12,769 12,769 12,769 12,769 12,769 12,769 12,769 12,769 12,769 12,769 12,769 12,769 12,769 12,769 12,769 12,769
Dependable Capacity 11,389 11,389 11,389 11,389 11,389 11,389 11,389 11,389 11,389 11,389 11,389 11,389 11,389 11,389 11,389 11,389 11,389 11,389 11,389 11,389 11,389 11,389
Existing Available Capacity (less PO) 9,079 8,922 8,844 8,934 8,855 8,476 8,751 9,666 9,676 9,732 9,772 10,102 10,012 9,715 9,625 9,625 9,453 9,418 9,238 9,304 9,324 9,224
+ Committed Capacity 245 245 245 295 445 442 442 442 453 397 397 397 415 391 391 391 541 563 563 563 563 563
Available Capacity (less PO plus Committed) 9,324 9,167 9,089 9,229 9,299 8,918 9,193 10,108 10,129 10,129 10,169 10,499 10,427 10,106 10,016 10,016 9,994 9,981 9,801 9,867 9,887 9,787
- Estimated Forced Outage 631 631 631 631 631 712 712 712 712 642 642 642 642 858 858 858 858 856 856 856 856 856
Available Capacity (less PO+FO) 8,693 8,536 8,458 8,598 8,668 8,206 8,481 9,396 9,417 9,488 9,528 9,858 9,786 9,248 9,158 9,158 9,136 9,125 8,945 9,011 9,031 8,931
- System Peak Demand 8,210 8,280 8,350 8,480 8,110 8,290 8,660 8,730 9,013 8,860 8,940 9,017 9,000 8,790 8,820 8,750 8,640 8,680 8,520 8,610 8,680 8,410
GROSS RESERVE 483 256 108 118 558 (84) (179) 666 404 628 588 841 786 458 338 408 496 445 425 401 351 521
Req'd Regulating Reserve (RR) 328 331 334 339 324 332 346 349 361 354 358 361 360 352 353 350 346 347 341 344 347 336
Req'd Contingency Reserve (CR) 647 647 647 647 647 647 647 647 647 647 647 647 647 647 647 647 647 647 647 647 647 647
Req'd Dispatchable Reserve (DR) 647 647 647 647 647 647 647 647 647 647 647 647 647 647 647 647 647 647 647 647 647 647
NET RESERVE (Gross - RR) 154 (75) (226) (221) 234 (416) (526) 317 43 273 230 480 426 107 (14) 58 151 97 84 56 3 184
NET RESERVE' (Gross - RR - 647) (493) (722) (873) (868) (413) (1,063) (1,173) (330) (604) (374) (417) (167) (221) (540) (661) (589) (496) (550) (563) (591) (644) (463)
Additional Capacity 354 354 354 354 354 354 454 454 454 454 454 454 454 454 454 454 454 454 454 454 454 454
NET RESERVE'' (Net Res' + Addl Capacity) (139) (368) (519) (514) (59) (709) (719) 124 (150) 80 37 287 233 (86) (207) (135) (42) (96) (109) (137) (190) (9)
JULY 2015MARCH 2015 APRIL 2015 MAY 2015 JUNE 2015
Note:• Possible Manual Load Dropping on Red Alert Status• Regulating Reserve, Refers to a Generating Unit that assists in Frequency Control by providing automatic Primary and/or Secondary Frequency response, equivalent to 4% of Peak
Demand• Contingency Reserve, Generating Capacity that is intended to take care of the loss of the largest Synchronized Generating Unit or the power import from a single Grid
interconnection, whichever is larger. Contingency Reserve in Luzon is 647 MW
LUZON SUPPLY-DEMAND OUTLOOKRevised Outlook (based on the data as of 27 October 2014)• With Maintenance and Forced Outage• With Additional Capacity
30
New Development: Petron capacity was originally reflected in available capacity at 60MW but Refinery Master Plant will be in full blast by next year thus the capacity that will be exported to the grid will be reduced to 10 MW.

Power Plant Concerns
Malaya Unit 1 • For overhaul• If overhauling completed by Summer 2015, Unit 1 cannot run simultaneously with Unit 2 due to
fuel delivery and storage constraints
Malaya Unit 2 • Limited at 230 MW
SLPGC • On-schedule commissioning at the earliest April 1, 2014
Millenium Energy Inc. (MEI), Navotas
• Rehab is on-going• Photo finish at 01 March 2015• Full availability of capacity requires any of the following: 1) MERALCO relaxing N-1 in the
distribution line where MEI will be connected; or 2) need to have separate lines which is beingdiscussed with NGCP. There are other permitting issues in the leasing of land for the substationand route of the transmission lines that will traverse the LGU and Philippine FishportDevelopment Authority properties.
• If not addressed, capacity will be limited to 54 MW during times that the existing line will also beused by TMO.
MEI (Limay) • Photo finish at 01 March 2015
Avion • Photo finish at 15 April 2015
Bauang Rehab • Photo finish at 01 March 2015
MERALCO ILP • Operates only on Red Alert
Concerns