Embed Size (px)
Citation preview
PHILLIP TREASURY FUND
Annual Report Year ended 31 March 2018
Contents
Page
Directory 1
Manager's Investment Report 2
Report to Unitholders 3
Report of the Trustee 8
Statements by the Manager 9
Independent auditors' report 10
Statement of Total Return FS1
Statement of Financial Position FS2
Statement of Movements in Unitholders' Funds FS3
Statement of Portfolio FS4
Notes to the Financial Statements FS9
Important Information FS18
1
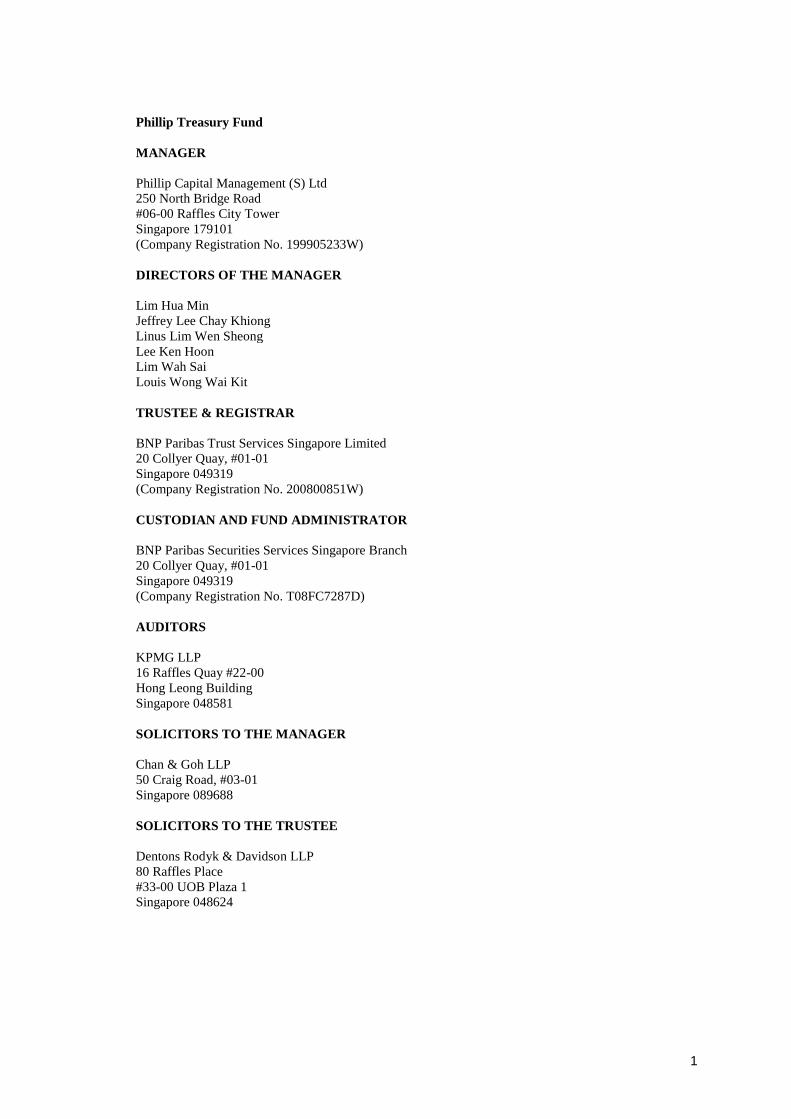
Phillip Treasury Fund
MANAGER
Phillip Capital Management (S) Ltd
250 North Bridge Road
#06-00 Raffles City Tower
Singapore 179101
(Company Registration No. 199905233W)
DIRECTORS OF THE MANAGER
Lim Hua Min
Jeffrey Lee Chay Khiong
Linus Lim Wen Sheong
Lee Ken Hoon
Lim Wah Sai
Louis Wong Wai Kit
TRUSTEE & REGISTRAR
BNP Paribas Trust Services Singapore Limited
20 Collyer Quay, #01-01
Singapore 049319
(Company Registration No. 200800851W)
CUSTODIAN AND FUND ADMINISTRATOR
BNP Paribas Securities Services Singapore Branch
20 Collyer Quay, #01-01
Singapore 049319
(Company Registration No. T08FC7287D)
AUDITORS
KPMG LLP
16 Raffles Quay #22-00
Hong Leong Building
Singapore 048581
SOLICITORS TO THE MANAGER
Chan & Goh LLP
50 Craig Road, #03-01
Singapore 089688
SOLICITORS TO THE TRUSTEE
Dentons Rodyk & Davidson LLP
80 Raffles Place
#33-00 UOB Plaza 1
Singapore 048624
Phillip Treasury Fund
2
MANAGER'S INVESTMENT REPORT
The US Dollar Money Market Fund returned 1.11% (bid-to-bid basis) over the one year ended 31 March
2018, 44 basis points (“bps”) higher than the corresponding period last year. The Fund underperformed
the average 1-week US$ Libor benchmark rate of 1.25% over the same period.
As at 31 March 2018 the portfolio’s Weighted Average Maturity (“WAM”) stood at 55 days. Cash,
bonds and deposits maturing within one month accounted for approximately 13% of the portfolio value.
The portfolio remains well-diversified across countries, sectors and issuers, with debt issues in financial
services constituting the largest portfolio allocation (non-deposit investments) at 25%.
10-year US treasury yields ended at 2.74% on 29 March 2018, representing a 35 bps increase from the
2.39% a year ago, as the US Federal Reserve implemented three quarter-point increases to bring the
overnight funds rate to a target range of 1% to 1.75%. The 25bps increment in March 2018 represents
the sixth rate hike since the Federal Open Market Committee first started raising Federal Fund rates in
December 2015. Strengthening economic conditions, solid hiring data and firmer inflation have
reinforced the case for the Federal Reserve to tighten monetary policy further although the Federal
Reserve maintained that the hiking trajectory will be gradual.
The United States Department of Commerce reported in late May that GDP grew at an annual rate of
2.2% during the first quarter of 2018, slightly lower than previously reported (2.3%). The revision was
due to downward revisions to inventory investment and consumer spending. However, the growth
outlook remains favourable against the backdrop of a tightening labour market and fiscal stimulus in
the form of the US$1.5 trillion income tax cut package that came into effect as of January 2018. The
effects of lower corporate and individual tax rates and higher government spending will be bring annual
GDP growth closer to the Trump administration’s 3% target. Optimism surrounding GDP growth
momentum was supported by April’s economic data which saw solid consumer spending, business
capital investments and industrial production.
Although the meeting minutes for the Federal Open Market Committee in May acknowledged the
strong economic conditions, the central bank also recognised the possibility of rising global trade and
geopolitical tension. The Federal Reserve indicated tolerance for inflation rates to temporarily exceed
its 2% target, believing that it will aid in anchoring longer-run inflation expectations. Market
participants mostly expect a gradual pace of Fed rate hikes – two additional increases in 2018, while
not ruling out the possibility of a fourth for the calendar year. Macro risks to consider for the second
half of 2018 include monetary policy normalisation in the US and Europe, US trade protectionism and
rising global energy prices.
Our strategy remains to buy and hold high-quality securities to maturity and manage interest rate risk
with a portfolio of target WAM at 90 days. Our liquidity strategy is to have overnight and weekly
liquidity of 10% and 20% respectively, for the portfolio. We will continue with prudent management
of concentration and liquidity risks with a wide diversification of issuers and banks for the portfolio.
Phillip Treasury Fund Report to Unitholders Year ended 31 March 2018
3
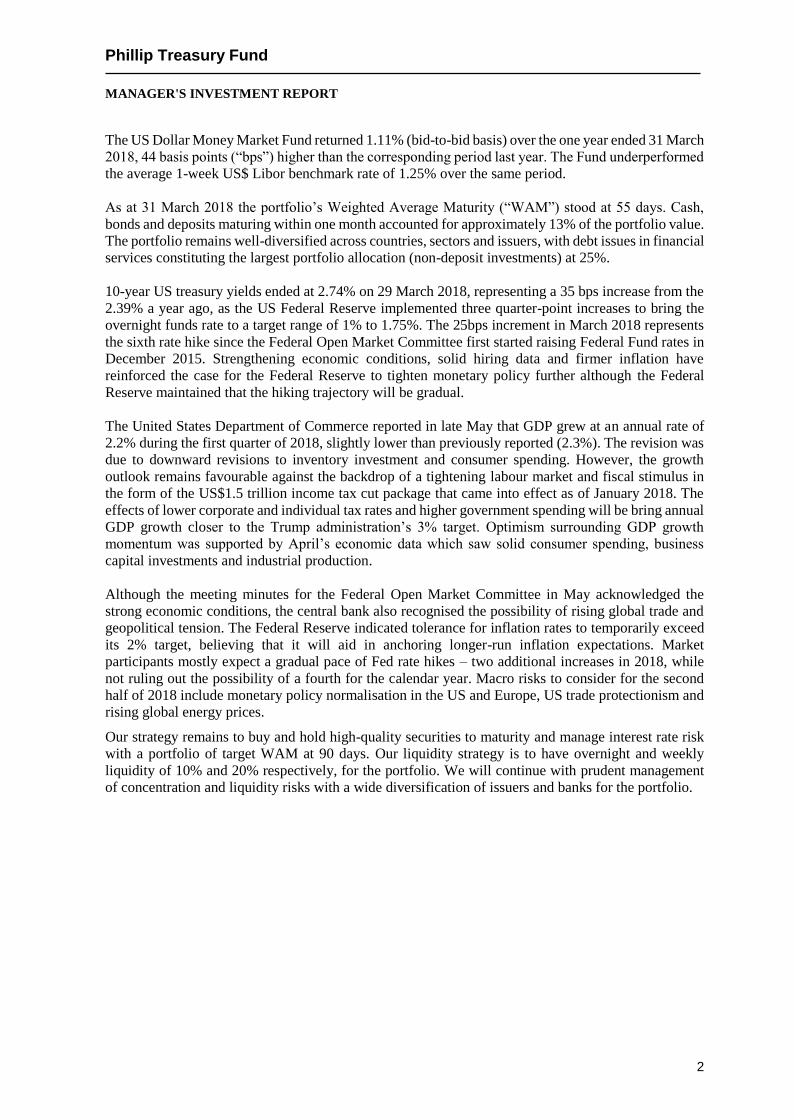
The following contains additional information relating to the US Dollar Money market Fund (the "Sub Fund"):
1. Distribution of investments
Please refer to the Statement of Portfolio on pages FS4 to FS8.
2. Schedule of investments by asset class
Asset class
Fair value at
31 March 2018
US$
Percentage of
total net assets
attributable to
unitholders at
31 March 2018
%
Fixed Income Securities 125,279,790 59.09
Term Deposits 72,225,650 34.06
Cash and cash equivalents 22,974,532 10.84
Other net liabilities (8,459,291) (3.99)
212,020,681 100.00
Types of money market instruments and debt securities
Asset class
Fair value at
31 March 2018
US$
Percentage of
total net assets
attributable to
unitholders at
31 March 2018
%
Floating rate notes 14,452,137 6.82
Fixed rate notes 110,077,963 51.92
Accrued interest on debt securities 749,690 0.35
125,279,790 59.09
3. Credit rating
i) Debt securities
Credit Ratings
Fair value at
31 March 2018
US$
Percentage of
total net assets
attributable to
unitholders at
31 March 2018
%
AA 9,996,947 4.71
A 61,233,988 28.89
Aaa* 398,724 0.19
Aa* 8,623,717 4.06
A3* 9,419,171 4.44
NR 34,857,553 16.45
Accrued interest on debt securities 749,690 0.35
Total 125,279,790 59.09
Phillip Treasury Fund Report to Unitholders Year ended 31 March 2018
4
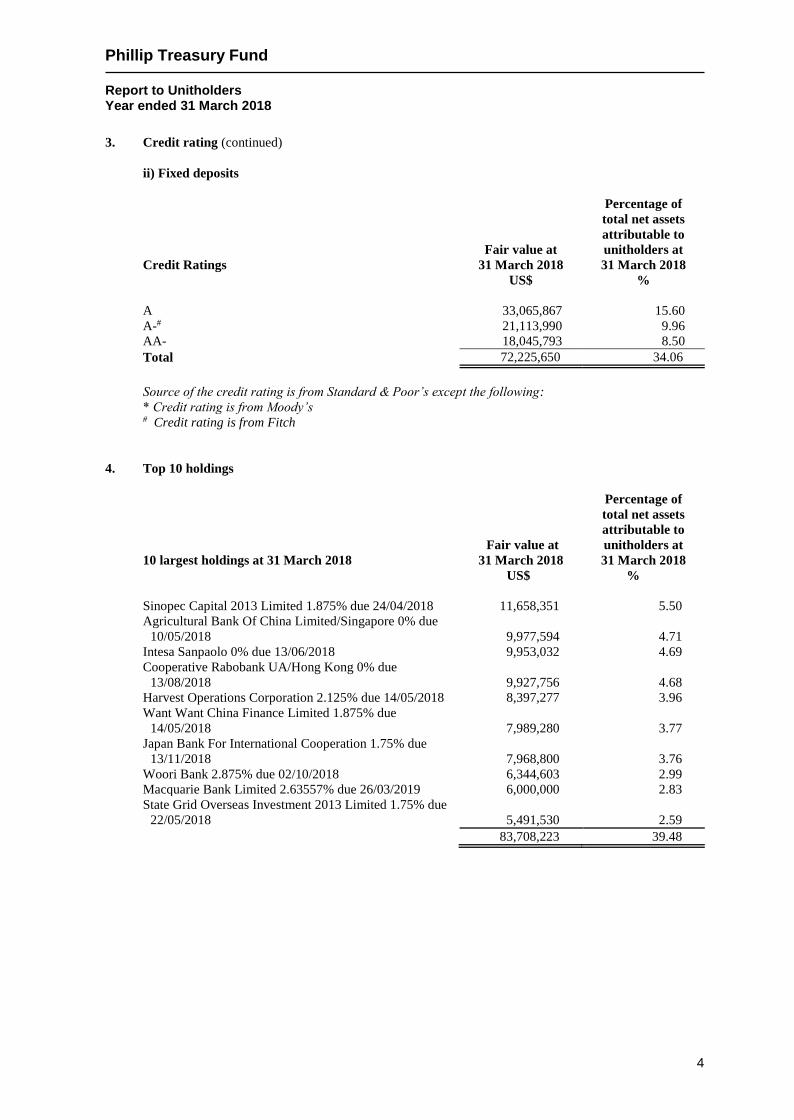
3. Credit rating (continued)
ii) Fixed deposits
Credit Ratings
Fair value at
31 March 2018
US$
Percentage of
total net assets
attributable to
unitholders at
31 March 2018
%
A 33,065,867 15.60
A-# 21,113,990 9.96
AA- 18,045,793 8.50
Total 72,225,650 34.06
Source of the credit rating is from Standard & Poor’s except the following:
* Credit rating is from Moody’s # Credit rating is from Fitch
4. Top 10 holdings
10 largest holdings at 31 March 2018
Fair value at
31 March 2018
US$
Percentage of
total net assets
attributable to
unitholders at
31 March 2018
%
Sinopec Capital 2013 Limited 1.875% due 24/04/2018 11,658,351 5.50
Agricultural Bank Of China Limited/Singapore 0% due
10/05/2018 9,977,594 4.71
Intesa Sanpaolo 0% due 13/06/2018 9,953,032 4.69
Cooperative Rabobank UA/Hong Kong 0% due
13/08/2018 9,927,756 4.68
Harvest Operations Corporation 2.125% due 14/05/2018 8,397,277 3.96
Want Want China Finance Limited 1.875% due
14/05/2018 7,989,280 3.77
Japan Bank For International Cooperation 1.75% due
13/11/2018 7,968,800 3.76
Woori Bank 2.875% due 02/10/2018 6,344,603 2.99
Macquarie Bank Limited 2.63557% due 26/03/2019 6,000,000 2.83
State Grid Overseas Investment 2013 Limited 1.75% due
22/05/2018 5,491,530 2.59
83,708,223 39.48
Phillip Treasury Fund Report to Unitholders Year ended 31 March 2018
5
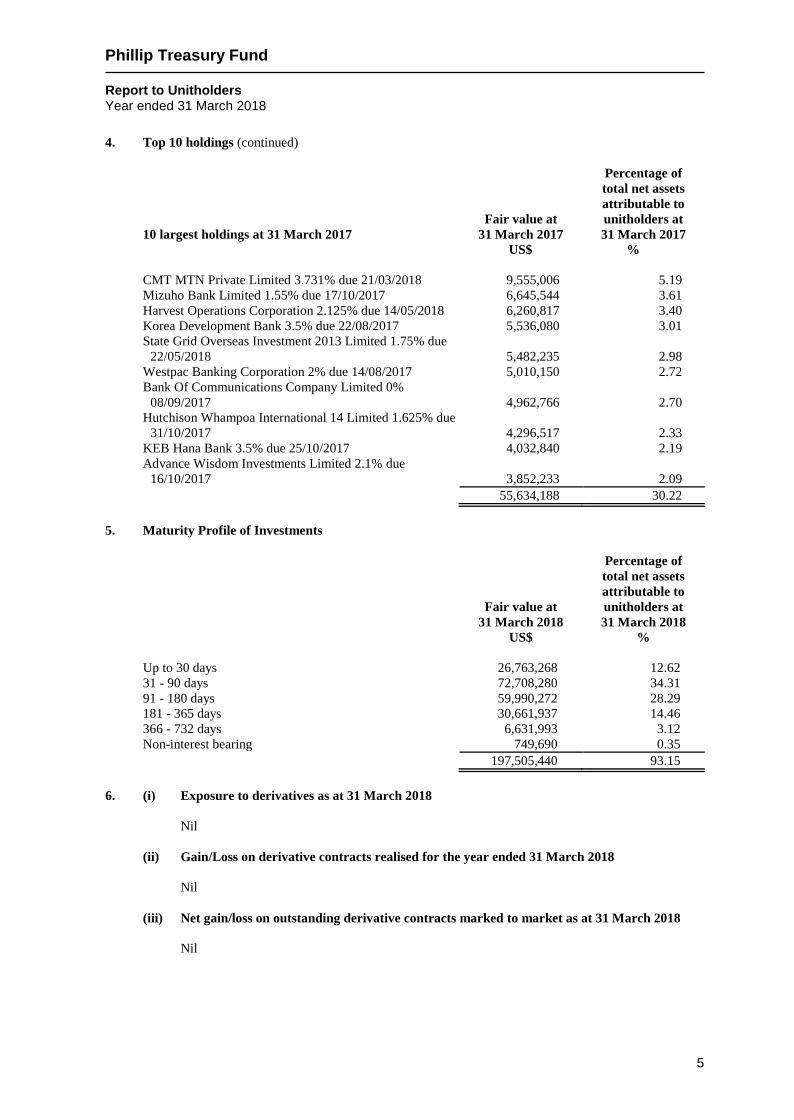
4. Top 10 holdings (continued)
10 largest holdings at 31 March 2017
Fair value at
31 March 2017
US$
Percentage of
total net assets
attributable to
unitholders at
31 March 2017
%
CMT MTN Private Limited 3.731% due 21/03/2018 9,555,006 5.19
Mizuho Bank Limited 1.55% due 17/10/2017 6,645,544 3.61
Harvest Operations Corporation 2.125% due 14/05/2018 6,260,817 3.40
Korea Development Bank 3.5% due 22/08/2017 5,536,080 3.01
State Grid Overseas Investment 2013 Limited 1.75% due
22/05/2018 5,482,235 2.98
Westpac Banking Corporation 2% due 14/08/2017 5,010,150 2.72
Bank Of Communications Company Limited 0%
08/09/2017 4,962,766 2.70
Hutchison Whampoa International 14 Limited 1.625% due
31/10/2017 4,296,517 2.33
KEB Hana Bank 3.5% due 25/10/2017 4,032,840 2.19
Advance Wisdom Investments Limited 2.1% due
16/10/2017 3,852,233 2.09
55,634,188 30.22
5. Maturity Profile of Investments
Fair value at
31 March 2018
US$
Percentage of
total net assets
attributable to
unitholders at
31 March 2018
%
Up to 30 days 26,763,268 12.62
31 - 90 days 72,708,280 34.31
91 - 180 days 59,990,272 28.29
181 - 365 days 30,661,937 14.46
366 - 732 days 6,631,993 3.12
Non-interest bearing 749,690 0.35
197,505,440 93.15
6. (i) Exposure to derivatives as at 31 March 2018
Nil
(ii) Gain/Loss on derivative contracts realised for the year ended 31 March 2018
Nil
(iii) Net gain/loss on outstanding derivative contracts marked to market as at 31 March 2018
Nil
Phillip Treasury Fund Report to Unitholders Year ended 31 March 2018
6
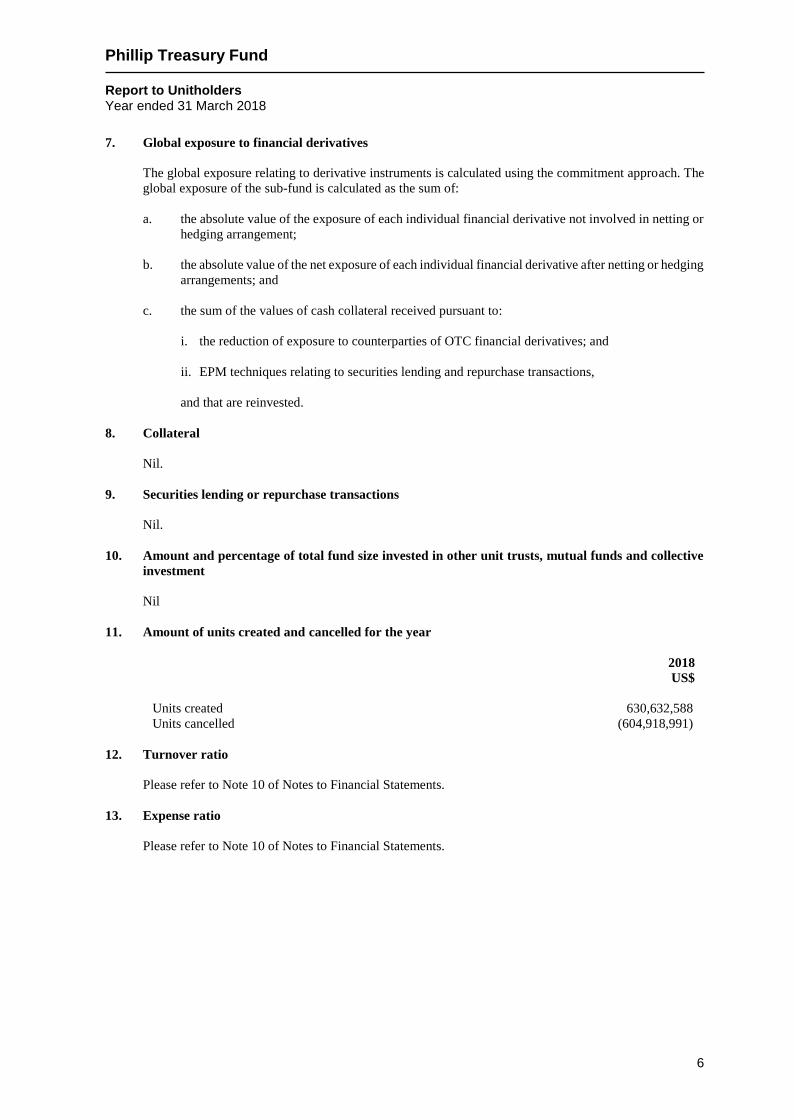
7. Global exposure to financial derivatives
The global exposure relating to derivative instruments is calculated using the commitment approach. The
global exposure of the sub-fund is calculated as the sum of:
a. the absolute value of the exposure of each individual financial derivative not involved in netting or
hedging arrangement;
b. the absolute value of the net exposure of each individual financial derivative after netting or hedging
arrangements; and
c. the sum of the values of cash collateral received pursuant to:
i. the reduction of exposure to counterparties of OTC financial derivatives; and
ii. EPM techniques relating to securities lending and repurchase transactions,
and that are reinvested.
8. Collateral
Nil.
9. Securities lending or repurchase transactions
Nil.
10. Amount and percentage of total fund size invested in other unit trusts, mutual funds and collective
investment
Nil
11. Amount of units created and cancelled for the year
2018
US$
Units created 630,632,588
Units cancelled (604,918,991)
12. Turnover ratio
Please refer to Note 10 of Notes to Financial Statements.
13. Expense ratio
Please refer to Note 10 of Notes to Financial Statements.
Phillip Treasury Fund Report to Unitholders Year ended 31 March 2018
7
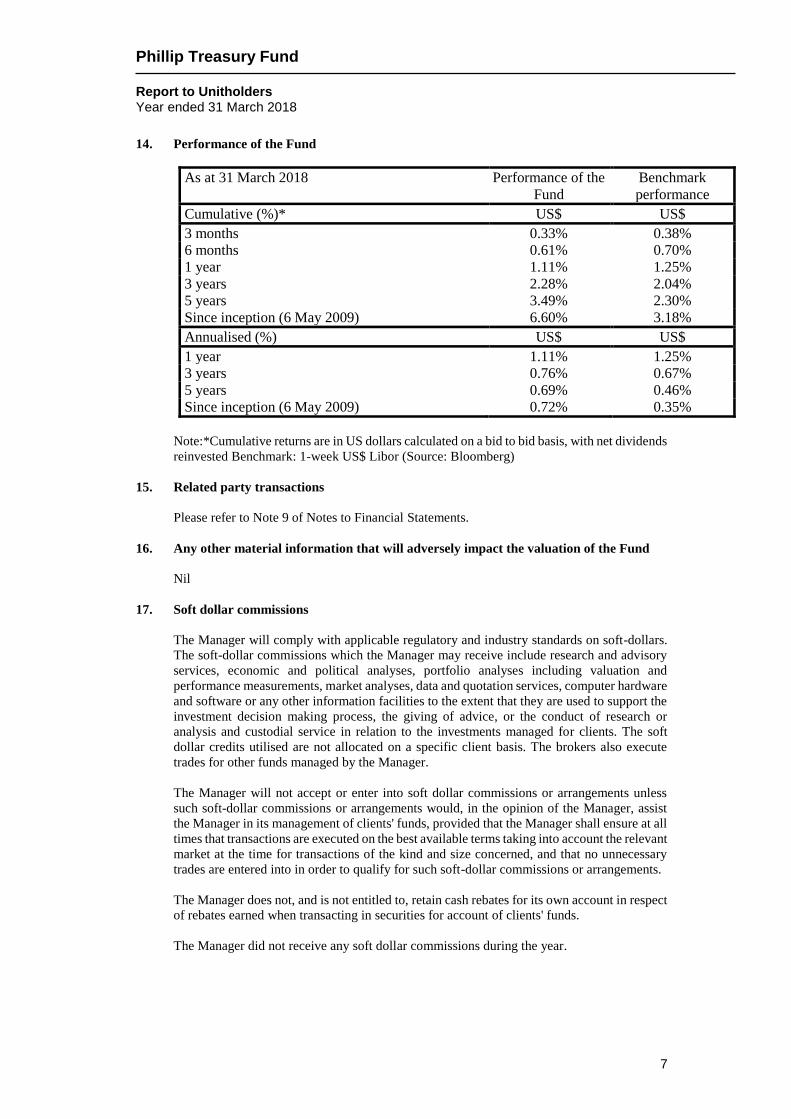
14. Performance of the Fund
As at 31 March 2018 Performance of the
Fund
Benchmark
performance
Cumulative (%)* US$ US$
3 months 0.33% 0.38%
6 months 0.61% 0.70%
1 year 1.11% 1.25%
3 years 2.28% 2.04%
5 years 3.49% 2.30%
Since inception (6 May 2009) 6.60% 3.18%
Annualised (%) US$ US$
1 year 1.11% 1.25%
3 years 0.76% 0.67%
5 years 0.69% 0.46%
Since inception (6 May 2009) 0.72% 0.35%
Note:*Cumulative returns are in US dollars calculated on a bid to bid basis, with net dividends
reinvested Benchmark: 1-week US$ Libor (Source: Bloomberg)
15. Related party transactions
Please refer to Note 9 of Notes to Financial Statements.
16. Any other material information that will adversely impact the valuation of the Fund
Nil
17. Soft dollar commissions
The Manager will comply with applicable regulatory and industry standards on soft-dollars.
The soft-dollar commissions which the Manager may receive include research and advisory
services, economic and political analyses, portfolio analyses including valuation and
performance measurements, market analyses, data and quotation services, computer hardware
and software or any other information facilities to the extent that they are used to support the
investment decision making process, the giving of advice, or the conduct of research or
analysis and custodial service in relation to the investments managed for clients. The soft
dollar credits utilised are not allocated on a specific client basis. The brokers also execute
trades for other funds managed by the Manager.
The Manager will not accept or enter into soft dollar commissions or arrangements unless
such soft-dollar commissions or arrangements would, in the opinion of the Manager, assist
the Manager in its management of clients' funds, provided that the Manager shall ensure at all
times that transactions are executed on the best available terms taking into account the relevant
market at the time for transactions of the kind and size concerned, and that no unnecessary
trades are entered into in order to qualify for such soft-dollar commissions or arrangements.
The Manager does not, and is not entitled to, retain cash rebates for its own account in respect
of rebates earned when transacting in securities for account of clients' funds.
The Manager did not receive any soft dollar commissions during the year.
Phillip Treasury Fund
Report of the Trustee
Year ended 31 March 2018
8
Report of the Trustee
The Trustee is under a duty to take into custody and hold the assets of Phillip Treasury Fund in
trust for the unitholders. In accordance with the Securities and Futures Act (Chapter 289), its
subsidiary legislation and the Code on Collective Investment Schemes, the Trustee shall monitor
the activities of the Manager for compliance with the limitations imposed on the investment and
borrowing powers as set out in the Trust Deed in each annual accounting period and report thereon
to unitholders in an annual report.
To the best knowledge of the Trustee, the Manager has, in all material respects, managed Phillip
Treasury Fund during the period covered by these financial statements, set out on pages FS1 to
FS17, in accordance with the limitations imposed on the investment and borrowing powers set
out in the Trust Deed.
For and on behalf of the Trustee
BNP Paribas Trust Services Singapore Limited
──────────────────────────────
Authorised signatory
26 June 2018
Phillip Treasury Fund
Statement by the Manager
Year ended 31 March 2018
9
Statement by the Manager
In the opinion of the directors of Phillip Capital Management (S) Ltd, the accompanying financial
statements set out on pages FS1 to FS17, comprising the Statement of Total Return, Statement of
Financial Position, Statement of Movements of Unitholders’ Funds, Statement of Portfolio and
Notes to the Financial Statements are drawn up so as to present fairly, in all material respects, the
financial position of Phillip Treasury Fund as at 31 March 2018, and the total return and
movements in unitholders’ funds for the year then ended in accordance with the recommendations
of Statement of Recommended Accounting Practice 7 “Reporting Framework for Unit Trusts”
issued by the Institute of Singapore Chartered Accountants. At the date of this statement, there
are reasonable grounds to believe that Phillip Treasury Fund will be able to meet its financial
obligations as and when they materialise.
For and on behalf of directors of the Manager
Phillip Capital Management (S) Ltd
────────────────────────────
Jeffrey Lee Chay Khiong
Director
26 June 2018
KPMG LLP
16 Raffles Quay #22-00
Hong Leong Building
Singapore 048581
Telephone +65 6213 3388
Fax +65 6225 0984
Internet www.kpmg.com.sg
10
KPMG LLP (Registration No. T08LL1267L), an accounting limited liability partnership registered in Singapore under the Limited Liability Partnership Act (Chapter 163A) and a member firm of the KPMG network of independent member firms affiliated with KPMG International Cooperative (“KPMG International”), a Swiss entity.
Independent auditors' report
Unitholders
Phillip Treasury Fund
(Constituted under a Trust Deed registered in the Republic of Singapore)
Report on the audit of the financial statements
Opinion
We have audited the financial statements of Phillip Treasury Fund (the “Fund”), which comprise
the Statement of Financial Position and Statement of Portfolios as at 31 March 2018, the
Statement of Total Return and Statement of Movement of Unitholders’ Funds for the year then
ended, and notes to the financial statements, including a summary of significant accounting
policies, as set out on pages FS1 to FS17.
In our opinion, the accompanying financial statements are properly drawn up in accordance with
the recommendation of Statement of Recommended Accounting Practice 7 “Reporting
Framework for Unit Trusts” issued by the Institute of Singapore Chartered Accountants so as to
present fairly, in all material respects, the financial position and portfolio holdings of the Fund as
at 31 March 2018 and the financial performance and movements in unitholders’ funds for the year
ended on that date.
Basis for opinion
We conducted our audit in accordance with Singapore Standards on Auditing (“SSAs”). Our
responsibilities under those standards are further described in the ‘Auditors’ responsibilities for
the audit of the financial statements’ section of our report. We are independent of the Fund in
accordance with the Accounting and Corporate Regulatory Authority Code of Professional
Conduct and Ethics for Public Accountants and Accounting Entities (“ACRA Code”) together
with the ethical requirements that are relevant to our audit of the financial statements in Singapore,
and we have fulfilled our other ethical responsibilities in accordance with these requirements and
the ACRA Code. We believe that the audit evidence we have obtained is sufficient and
appropriate to provide a basis for our opinion.
Other information
Phillip Capital Management (S) Ltd, the Manager of the Fund (the “Manager”) is responsible for
the other information contained in the annual report. Other information is defined as all
information in the annual report other than the financial statements and our auditors’ report
thereon.
We have obtained all other information prior to the date of this auditors’ report.
Phillip Treasury Fund
Independent auditors’ report
Year ended 31 March 2018
11
Our opinion on the financial statements does not cover the other information and we do not
express any form of assurance conclusion thereon.
In connection with our audit of the financial statements, our responsibility is to read the other
information and, in doing so, consider whether the other information is materially inconsistent
with the financial statements or our knowledge obtained in the audit or otherwise appears to be
materially misstated. If, based on the work we have performed, we conclude that there is a
material misstatement of this other information, we are required to report that fact. We have
nothing to report in this regard.
Responsibilities of the Manager for the financial statements
The Manager is responsible for the preparation and fair representation of these financial
statements in accordance with the recommendations of the Statement of Recommended
Accounting Practice 7 “Reporting Framework for Unit Trusts” issued by the Institute of Singapore
Chartered Accountants, and for such internal controls as the Manager determines is necessary to
enable the preparation of financial statements that are free from material misstatement, whether
due to fraud or error.
In preparing the financial statements, the Manager is responsible for assessing the Fund’s ability
to continue as a going concern, disclosing, as applicable, matters related to going concern and
using the going concern basis of accounting unless the Manager either intends to terminate the
Fund or to cease the Fund’s operations, or has no realistic alternative but to do so.
The Manager’s responsibilities include overseeing the Fund’s financial reporting process.
Auditors’ responsibilities for the audit of the financial statements
Our objectives are to obtain reasonable assurance about whether the financial statements as a
whole are free from material misstatement, whether due to fraud or error, and to issue an auditors’
report that includes our opinion. Reasonable assurance is a high level of assurance, but is not a
guarantee that an audit conducted in accordance with SSAs will always detect a material
misstatement when it exists. Misstatements can arise from fraud or error and are considered
material if, individually or in the aggregate, they could reasonably be expected to influence the
economic decisions of users taken on the basis of these financial statements.
As part of an audit in accordance with SSAs, we exercise professional judgement and maintain
professional scepticism throughout the audit. We also:
Identify and assess the risks of material misstatement of the financial statements, whether due to fraud or error, design and perform audit procedures responsive to those risks, and
obtain audit evidence that is sufficient and appropriate to provide a basis for our opinion.
The risk of not detecting a material misstatement resulting from fraud is higher than for one
resulting from error, as fraud may involve collusion, forgery, intentional omissions,
misrepresentations, or the override of internal controls.
Phillip Treasury Fund
Independent auditors’ report
Year ended 31 March 2018
12
Obtain an understanding of internal controls relevant to the audit in order to design audit
procedures that are appropriate in the circumstances, but not for the purpose of expressing
an opinion on the effectiveness of the Fund’s internal controls.
Evaluate the appropriateness of accounting policies used and the reasonableness of
accounting estimates and related disclosures made by the Manager.
Conclude on the appropriateness of the Manager’s use of the going concern basis of
accounting and, based on the audit evidence obtained, whether a material uncertainty exists
related to events or conditions that may cast significant doubt on the Fund’s ability to
continue as a going concern. If we conclude that a material uncertainty exists, we are
required to draw attention in our auditors’ report to the related disclosures in the financial
statements or, if such disclosures are inadequate, to modify our opinion. Our conclusions are
based on the audit evidence obtained up to the date of our auditors’ report. However, future
events or conditions may cause the Fund to cease to continue as a going concern.
Evaluate the overall presentation, structure and content of the financial statements, including
the disclosures, and whether the financial statements represent the underlying transactions
and events in a manner that achieves fair presentation.
We communicate with the Manager regarding, among other matters, the planned scope and timing
of the audit and significant audit findings, including any significant deficiencies in internal
controls that we identify during our audit.
KPMG LLP
Public Accountants and
Chartered Accountants
Singapore
26 June 2018
Phillip Treasury Fund
Financial statements
Year ended 31 March 2018
The accompanying notes form an integral part of these financial statements. FS1
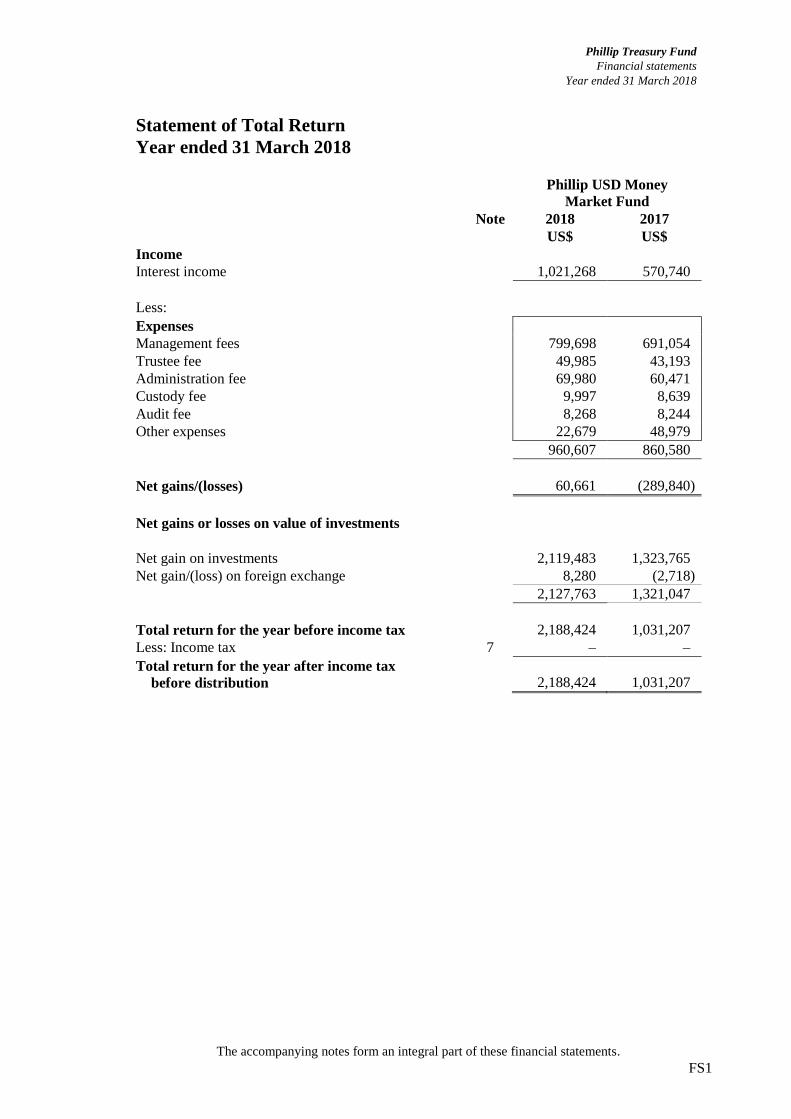
Statement of Total Return
Year ended 31 March 2018
Phillip USD Money
Market Fund
Note 2018 2017
US$ US$
Income
Interest income 1,021,268 570,740
Less:
Expenses
Management fees 799,698 691,054
Trustee fee 49,985 43,193
Administration fee 69,980 60,471
Custody fee 9,997 8,639
Audit fee 8,268 8,244
Other expenses 22,679 48,979
960,607 860,580
Net gains/(losses) 60,661 (289,840)
Net gains or losses on value of investments
Net gain on investments 2,119,483 1,323,765
Net gain/(loss) on foreign exchange 8,280 (2,718)
2,127,763 1,321,047
Total return for the year before income tax 2,188,424 1,031,207
Less: Income tax 7 – –
Total return for the year after income tax
before distribution 2,188,424 1,031,207
Phillip Treasury Fund
Financial statements
Year ended 31 March 2018
The accompanying notes form an integral part of these financial statements. FS2
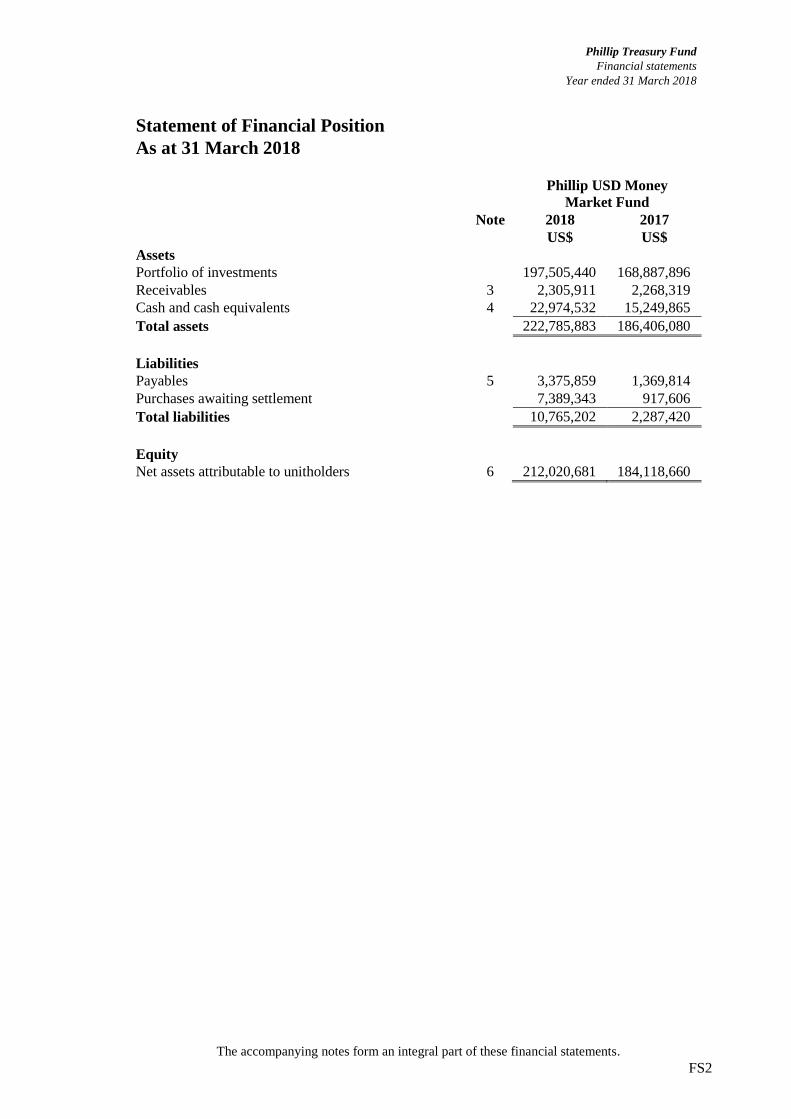
Statement of Financial Position
As at 31 March 2018
Phillip USD Money
Market Fund
Note 2018 2017
US$ US$
Assets
Portfolio of investments 197,505,440 168,887,896
Receivables 3 2,305,911 2,268,319
Cash and cash equivalents 4 22,974,532 15,249,865
Total assets 222,785,883 186,406,080
Liabilities
Payables 5 3,375,859 1,369,814
Purchases awaiting settlement 7,389,343 917,606
Total liabilities 10,765,202 2,287,420
Equity
Net assets attributable to unitholders 6 212,020,681 184,118,660
Phillip Treasury Fund
Financial statements
Year ended 31 March 2018
The accompanying notes form an integral part of these financial statements. FS3
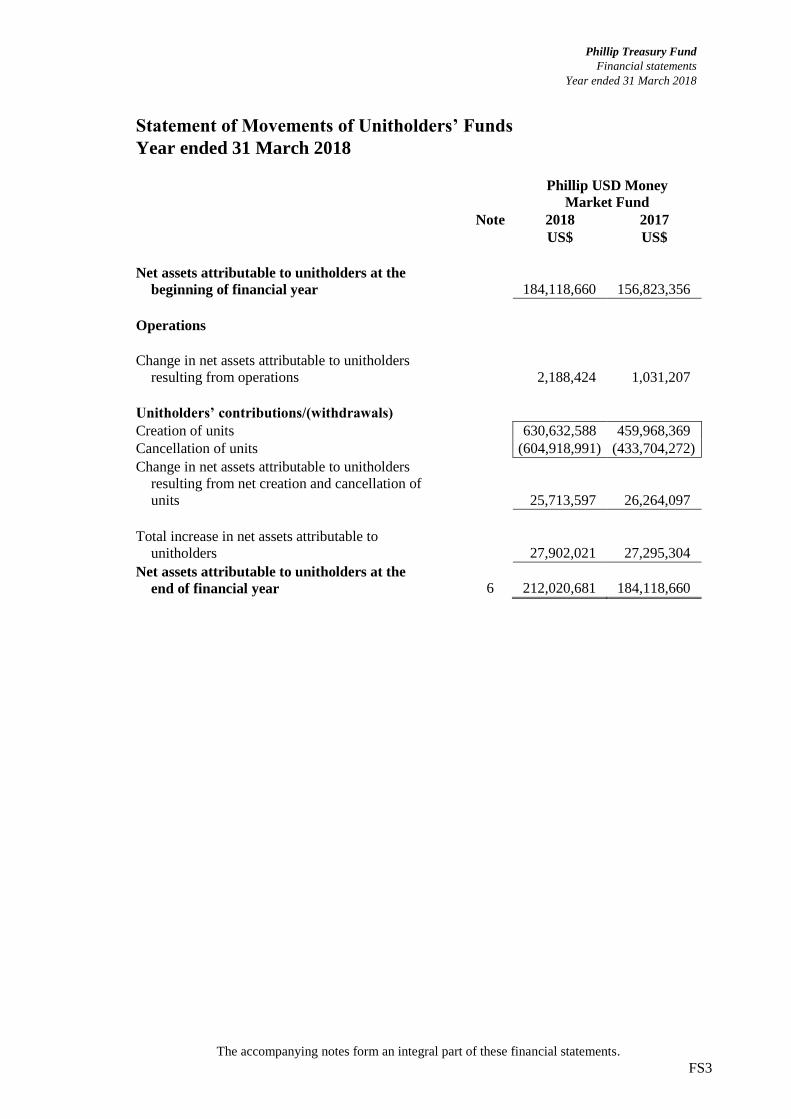
Statement of Movements of Unitholders’ Funds
Year ended 31 March 2018
Phillip USD Money
Market Fund
Note 2018 2017
US$ US$
Net assets attributable to unitholders at the
beginning of financial year 184,118,660 156,823,356
Operations
Change in net assets attributable to unitholders
resulting from operations 2,188,424 1,031,207
Unitholders’ contributions/(withdrawals)
Creation of units 630,632,588 459,968,369
Cancellation of units (604,918,991) (433,704,272)
Change in net assets attributable to unitholders
resulting from net creation and cancellation of
units 25,713,597 26,264,097
Total increase in net assets attributable to
unitholders 27,902,021 27,295,304
Net assets attributable to unitholders at the
end of financial year 6 212,020,681 184,118,660
Phillip Treasury Fund
Financial statements
Year ended 31 March 2018
The accompanying notes form an integral part of these financial statements. FS4
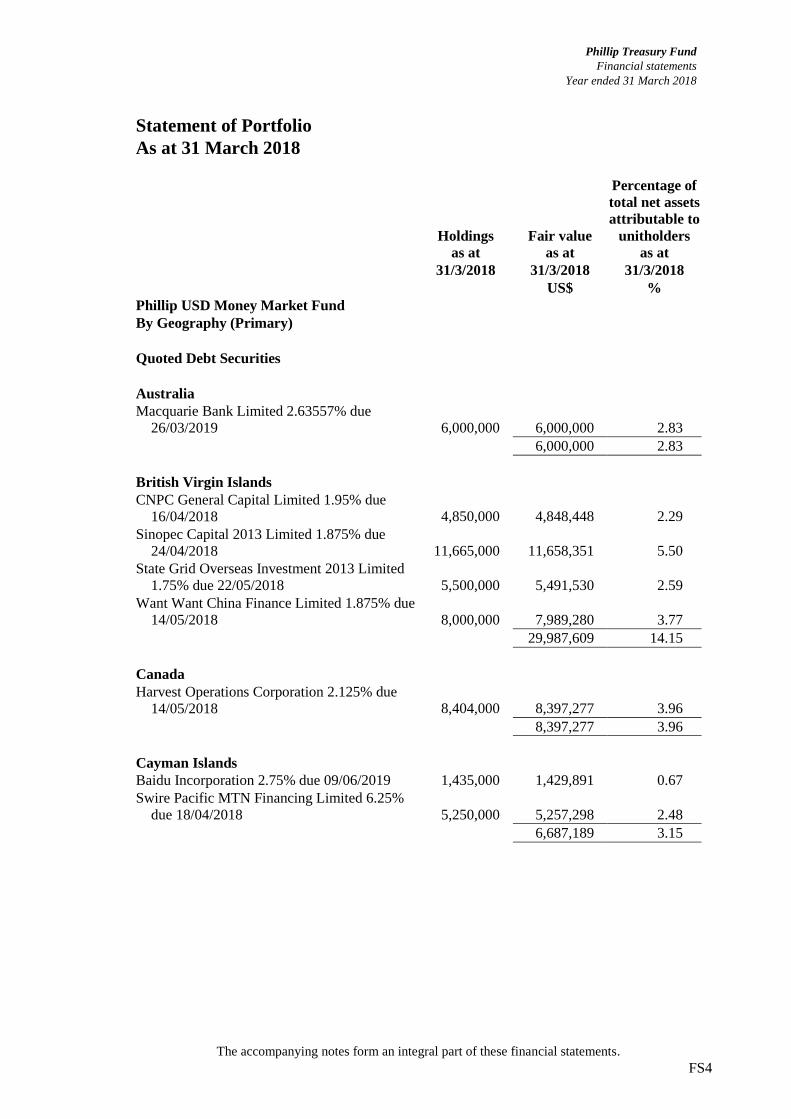
Statement of Portfolio
As at 31 March 2018
Holdings
as at
Fair value
as at
Percentage of
total net assets
attributable to
unitholders
as at
31/3/2018 31/3/2018 31/3/2018
US$ %
Phillip USD Money Market Fund
By Geography (Primary)
Quoted Debt Securities
Australia
Macquarie Bank Limited 2.63557% due
26/03/2019 6,000,000 6,000,000 2.83
6,000,000 2.83
British Virgin Islands
CNPC General Capital Limited 1.95% due
16/04/2018 4,850,000 4,848,448 2.29
Sinopec Capital 2013 Limited 1.875% due
24/04/2018 11,665,000 11,658,351 5.50
State Grid Overseas Investment 2013 Limited
1.75% due 22/05/2018 5,500,000 5,491,530 2.59
Want Want China Finance Limited 1.875% due
14/05/2018 8,000,000 7,989,280 3.77
29,987,609 14.15
Canada
Harvest Operations Corporation 2.125% due
14/05/2018 8,404,000 8,397,277 3.96
8,397,277 3.96
Cayman Islands
Baidu Incorporation 2.75% due 09/06/2019 1,435,000 1,429,891 0.67
Swire Pacific MTN Financing Limited 6.25%
due 18/04/2018 5,250,000 5,257,298 2.48
6,687,189 3.15
Phillip Treasury Fund
Financial statements
Year ended 31 March 2018
The accompanying notes form an integral part of these financial statements. FS5
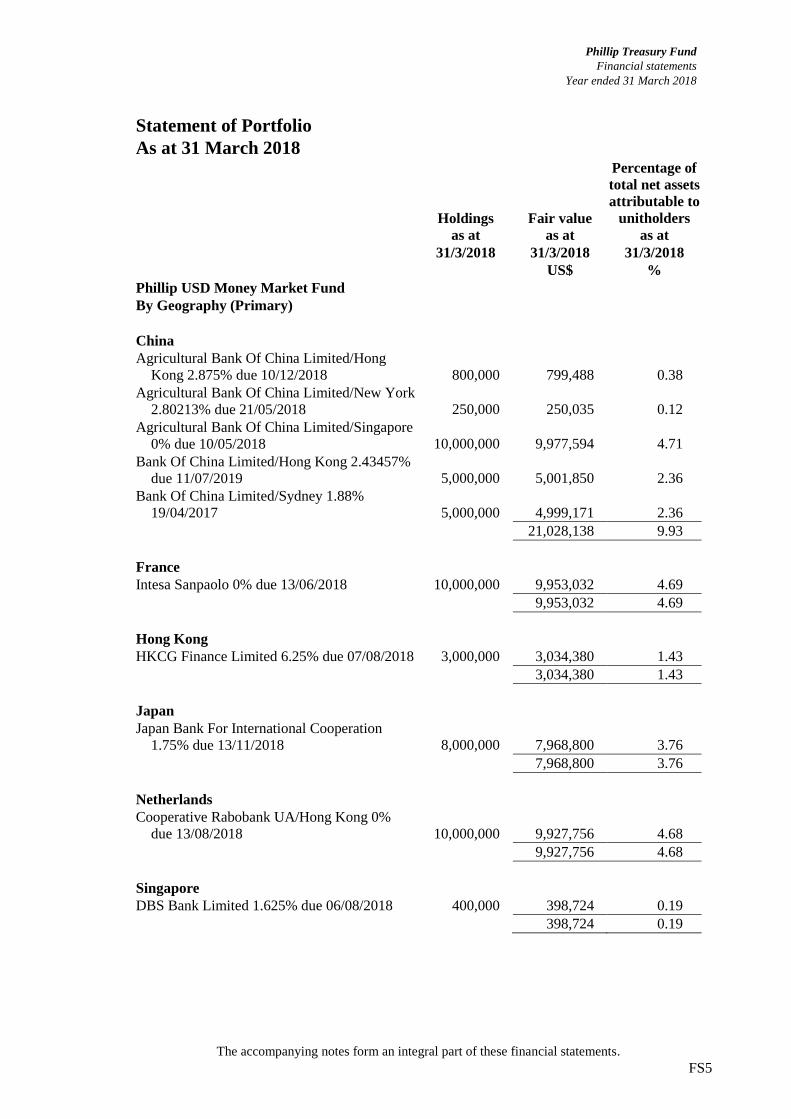
Statement of Portfolio
As at 31 March 2018
Holdings
as at
Fair value
as at
Percentage of
total net assets
attributable to
unitholders
as at
31/3/2018 31/3/2018 31/3/2018
US$ %
Phillip USD Money Market Fund
By Geography (Primary)
China
Agricultural Bank Of China Limited/Hong
Kong 2.875% due 10/12/2018 800,000 799,488 0.38
Agricultural Bank Of China Limited/New York
2.80213% due 21/05/2018 250,000 250,035 0.12
Agricultural Bank Of China Limited/Singapore
0% due 10/05/2018 10,000,000 9,977,594 4.71
Bank Of China Limited/Hong Kong 2.43457%
due 11/07/2019 5,000,000 5,001,850 2.36
Bank Of China Limited/Sydney 1.88%
19/04/2017 5,000,000 4,999,171 2.36
21,028,138 9.93
France
Intesa Sanpaolo 0% due 13/06/2018 10,000,000 9,953,032 4.69
9,953,032 4.69
Hong Kong
HKCG Finance Limited 6.25% due 07/08/2018 3,000,000 3,034,380 1.43
3,034,380 1.43
Japan
Japan Bank For International Cooperation
1.75% due 13/11/2018 8,000,000 7,968,800 3.76
7,968,800 3.76
Netherlands
Cooperative Rabobank UA/Hong Kong 0%
due 13/08/2018 10,000,000 9,927,756 4.68
9,927,756 4.68
Singapore
DBS Bank Limited 1.625% due 06/08/2018 400,000 398,724 0.19
398,724 0.19
Phillip Treasury Fund
Financial statements
Year ended 31 March 2018
The accompanying notes form an integral part of these financial statements. FS6
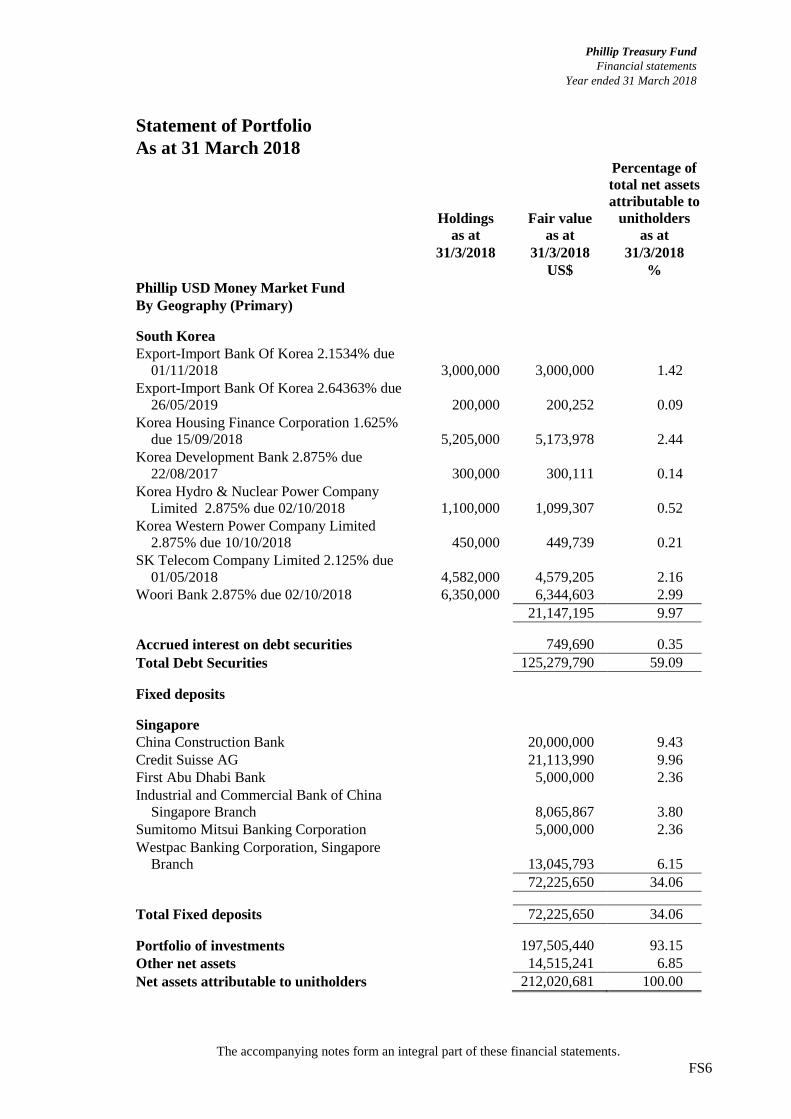
Statement of Portfolio
As at 31 March 2018
Holdings
as at
Fair value
as at
Percentage of
total net assets
attributable to
unitholders
as at
31/3/2018 31/3/2018 31/3/2018
US$ %
Phillip USD Money Market Fund
By Geography (Primary)
South Korea
Export-Import Bank Of Korea 2.1534% due
01/11/2018 3,000,000 3,000,000 1.42
Export-Import Bank Of Korea 2.64363% due
26/05/2019 200,000 200,252 0.09
Korea Housing Finance Corporation 1.625%
due 15/09/2018 5,205,000 5,173,978 2.44
Korea Development Bank 2.875% due
22/08/2017 300,000 300,111 0.14
Korea Hydro & Nuclear Power Company
Limited 2.875% due 02/10/2018 1,100,000 1,099,307 0.52
Korea Western Power Company Limited
2.875% due 10/10/2018 450,000 449,739 0.21
SK Telecom Company Limited 2.125% due
01/05/2018 4,582,000 4,579,205 2.16
Woori Bank 2.875% due 02/10/2018 6,350,000 6,344,603 2.99
21,147,195 9.97
Accrued interest on debt securities 749,690 0.35
Total Debt Securities 125,279,790 59.09
Fixed deposits
Singapore
China Construction Bank 20,000,000 9.43
Credit Suisse AG 21,113,990 9.96
First Abu Dhabi Bank 5,000,000 2.36
Industrial and Commercial Bank of China
Singapore Branch 8,065,867 3.80
Sumitomo Mitsui Banking Corporation 5,000,000 2.36
Westpac Banking Corporation, Singapore
Branch 13,045,793 6.15
72,225,650 34.06
Total Fixed deposits 72,225,650 34.06
Portfolio of investments 197,505,440 93.15
Other net assets 14,515,241 6.85
Net assets attributable to unitholders 212,020,681 100.00
Phillip Treasury Fund
Financial statements
Year ended 31 March 2018
The accompanying notes form an integral part of these financial statements. FS7
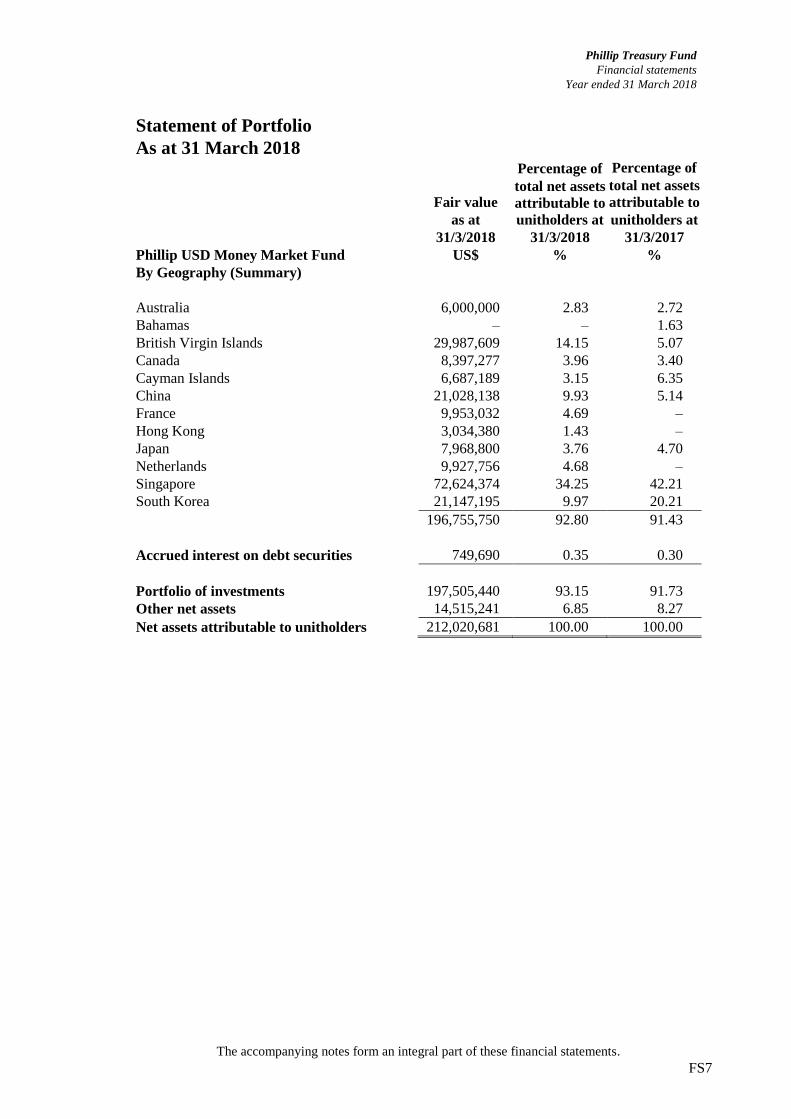
Statement of Portfolio
As at 31 March 2018
Fair value
as at
Percentage of
total net assets
attributable to
unitholders at
Percentage of
total net assets
attributable to
unitholders at
31/3/2018 31/3/2018 31/3/2017
Phillip USD Money Market Fund US$ % %
By Geography (Summary)
Australia 6,000,000 2.83 2.72
Bahamas – – 1.63
British Virgin Islands 29,987,609 14.15 5.07
Canada 8,397,277 3.96 3.40
Cayman Islands 6,687,189 3.15 6.35
China 21,028,138 9.93 5.14
France 9,953,032 4.69 –
Hong Kong 3,034,380 1.43 –
Japan 7,968,800 3.76 4.70
Netherlands 9,927,756 4.68 –
Singapore 72,624,374 34.25 42.21
South Korea 21,147,195 9.97 20.21
196,755,750 92.80 91.43
Accrued interest on debt securities 749,690 0.35 0.30
Portfolio of investments 197,505,440 93.15 91.73
Other net assets 14,515,241 6.85 8.27
Net assets attributable to unitholders 212,020,681 100.00 100.00
Phillip Treasury Fund
Financial statements
Year ended 31 March 2018
The accompanying notes form an integral part of these financial statements. FS8
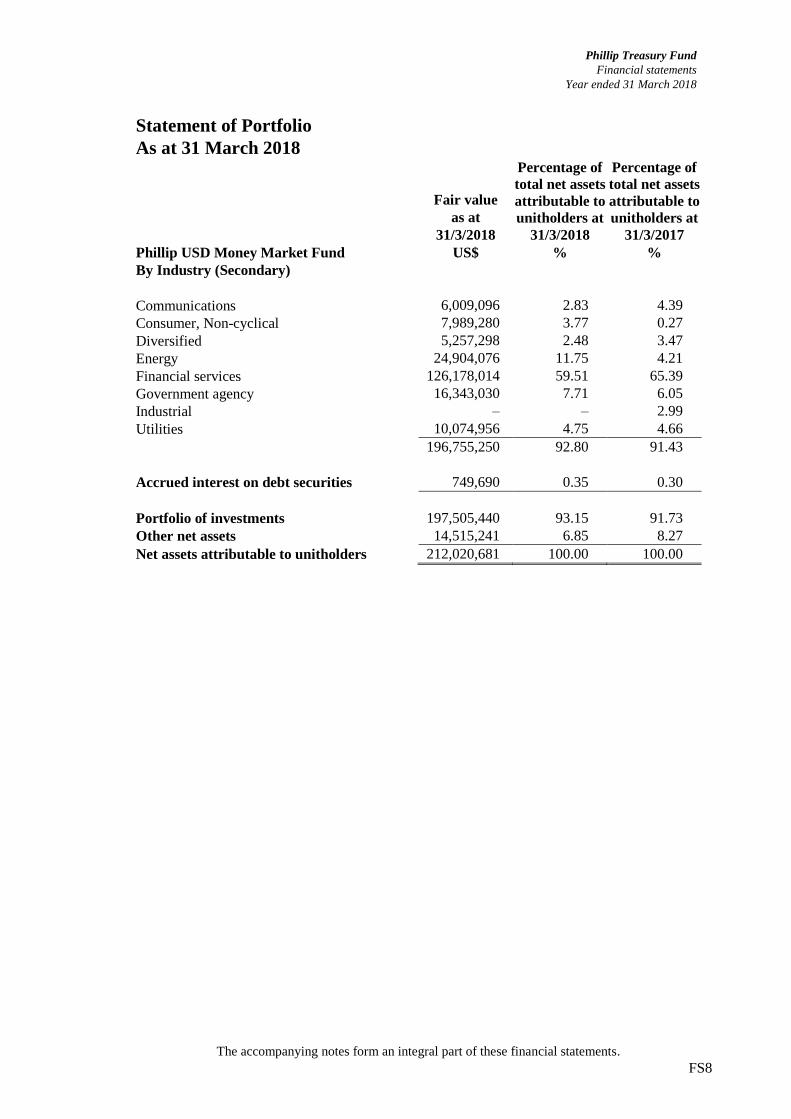
Statement of Portfolio
As at 31 March 2018
Fair value
as at
Percentage of
total net assets
attributable to
unitholders at
Percentage of
total net assets
attributable to
unitholders at
31/3/2018 31/3/2018 31/3/2017
Phillip USD Money Market Fund US$ % %
By Industry (Secondary)
Communications 6,009,096 2.83 4.39
Consumer, Non-cyclical 7,989,280 3.77 0.27
Diversified 5,257,298 2.48 3.47
Energy 24,904,076 11.75 4.21
Financial services 126,178,014 59.51 65.39
Government agency 16,343,030 7.71 6.05
Industrial – – 2.99
Utilities 10,074,956 4.75 4.66
196,755,250 92.80 91.43
Accrued interest on debt securities 749,690 0.35 0.30
Portfolio of investments 197,505,440 93.15 91.73
Other net assets 14,515,241 6.85 8.27
Net assets attributable to unitholders 212,020,681 100.00 100.00
Phillip Treasury Fund
Financial statements
Year ended 31 March 2018
FS9
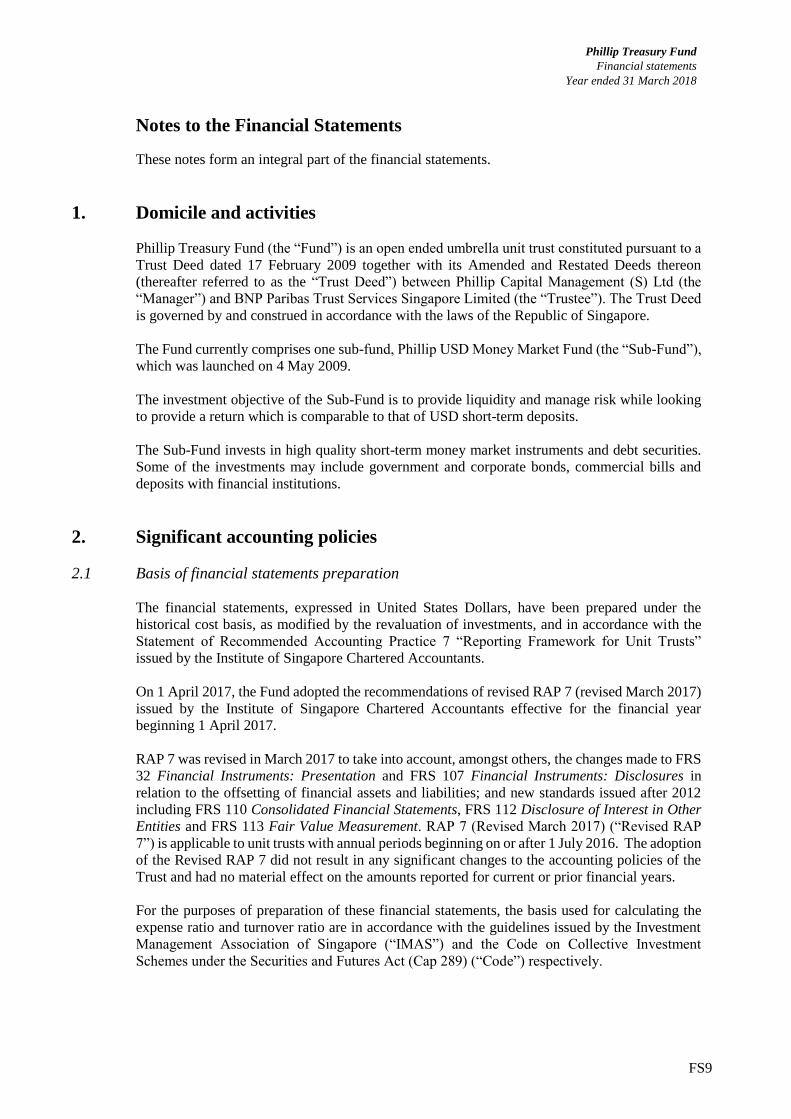
Notes to the Financial Statements
These notes form an integral part of the financial statements.
1. Domicile and activities
Phillip Treasury Fund (the “Fund”) is an open ended umbrella unit trust constituted pursuant to a
Trust Deed dated 17 February 2009 together with its Amended and Restated Deeds thereon
(thereafter referred to as the “Trust Deed”) between Phillip Capital Management (S) Ltd (the
“Manager”) and BNP Paribas Trust Services Singapore Limited (the “Trustee”). The Trust Deed
is governed by and construed in accordance with the laws of the Republic of Singapore.
The Fund currently comprises one sub-fund, Phillip USD Money Market Fund (the “Sub-Fund”),
which was launched on 4 May 2009.
The investment objective of the Sub-Fund is to provide liquidity and manage risk while looking
to provide a return which is comparable to that of USD short-term deposits.
The Sub-Fund invests in high quality short-term money market instruments and debt securities.
Some of the investments may include government and corporate bonds, commercial bills and
deposits with financial institutions.
2. Significant accounting policies
2.1 Basis of financial statements preparation
The financial statements, expressed in United States Dollars, have been prepared under the
historical cost basis, as modified by the revaluation of investments, and in accordance with the
Statement of Recommended Accounting Practice 7 “Reporting Framework for Unit Trusts”
issued by the Institute of Singapore Chartered Accountants.
On 1 April 2017, the Fund adopted the recommendations of revised RAP 7 (revised March 2017)
issued by the Institute of Singapore Chartered Accountants effective for the financial year
beginning 1 April 2017.
RAP 7 was revised in March 2017 to take into account, amongst others, the changes made to FRS
32 Financial Instruments: Presentation and FRS 107 Financial Instruments: Disclosures in
relation to the offsetting of financial assets and liabilities; and new standards issued after 2012
including FRS 110 Consolidated Financial Statements, FRS 112 Disclosure of Interest in Other
Entities and FRS 113 Fair Value Measurement. RAP 7 (Revised March 2017) (“Revised RAP
7”) is applicable to unit trusts with annual periods beginning on or after 1 July 2016. The adoption
of the Revised RAP 7 did not result in any significant changes to the accounting policies of the
Trust and had no material effect on the amounts reported for current or prior financial years.
For the purposes of preparation of these financial statements, the basis used for calculating the
expense ratio and turnover ratio are in accordance with the guidelines issued by the Investment
Management Association of Singapore (“IMAS”) and the Code on Collective Investment
Schemes under the Securities and Futures Act (Cap 289) (“Code”) respectively.
Phillip Treasury Fund
Financial statements
Year ended 31 March 2018
FS10
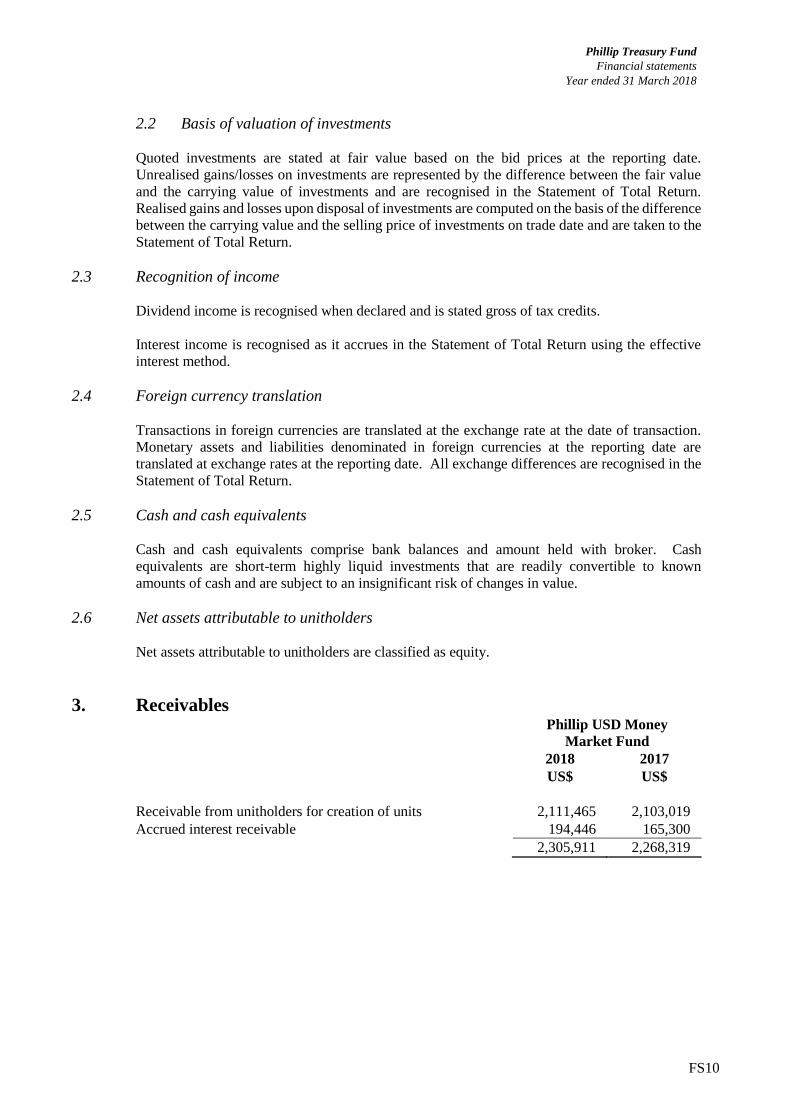
2.2 Basis of valuation of investments
Quoted investments are stated at fair value based on the bid prices at the reporting date.
Unrealised gains/losses on investments are represented by the difference between the fair value
and the carrying value of investments and are recognised in the Statement of Total Return.
Realised gains and losses upon disposal of investments are computed on the basis of the difference
between the carrying value and the selling price of investments on trade date and are taken to the
Statement of Total Return.
2.3 Recognition of income
Dividend income is recognised when declared and is stated gross of tax credits.
Interest income is recognised as it accrues in the Statement of Total Return using the effective
interest method.
2.4 Foreign currency translation
Transactions in foreign currencies are translated at the exchange rate at the date of transaction.
Monetary assets and liabilities denominated in foreign currencies at the reporting date are
translated at exchange rates at the reporting date. All exchange differences are recognised in the
Statement of Total Return.
2.5 Cash and cash equivalents
Cash and cash equivalents comprise bank balances and amount held with broker. Cash
equivalents are short-term highly liquid investments that are readily convertible to known
amounts of cash and are subject to an insignificant risk of changes in value.
2.6 Net assets attributable to unitholders
Net assets attributable to unitholders are classified as equity.
3. Receivables Phillip USD Money
Market Fund
2018 2017
US$ US$
Receivable from unitholders for creation of units 2,111,465 2,103,019
Accrued interest receivable 194,446 165,300
2,305,911 2,268,319
Phillip Treasury Fund
Financial statements
Year ended 31 March 2018
FS11
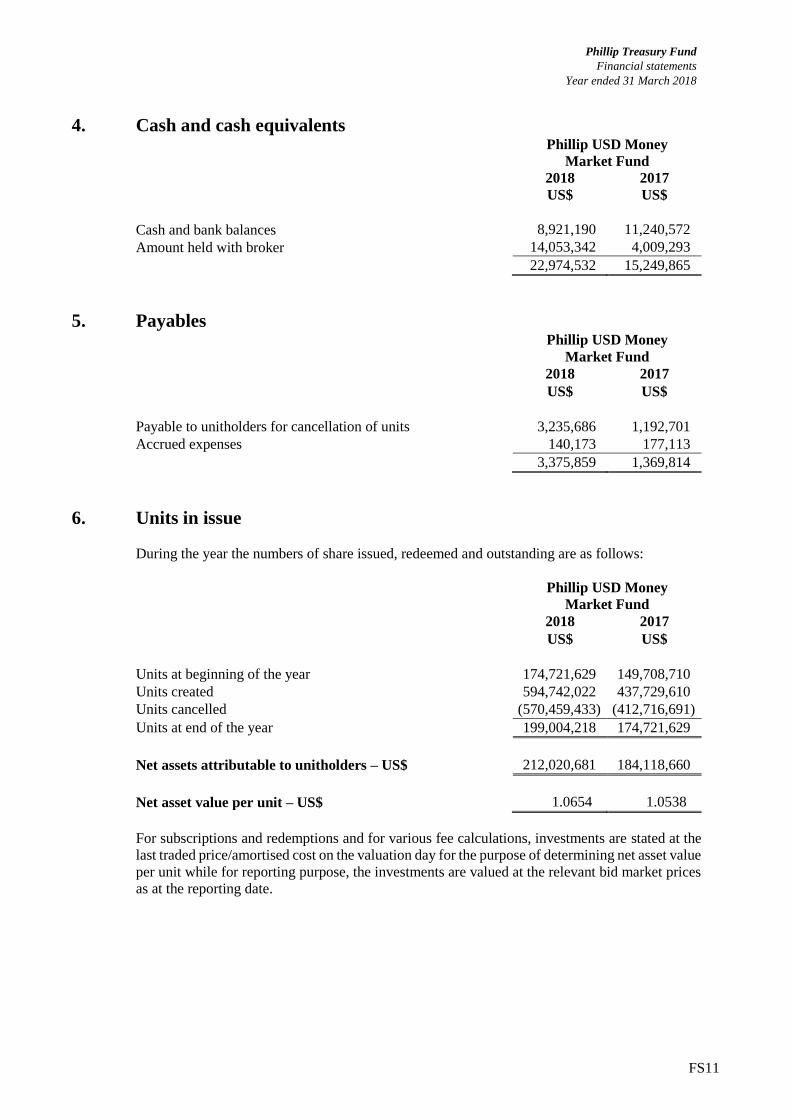
4. Cash and cash equivalents
Phillip USD Money
Market Fund
2018 2017
US$ US$
Cash and bank balances 8,921,190 11,240,572
Amount held with broker 14,053,342 4,009,293
22,974,532 15,249,865
5. Payables
Phillip USD Money
Market Fund
2018 2017
US$ US$
Payable to unitholders for cancellation of units 3,235,686 1,192,701
Accrued expenses 140,173 177,113
3,375,859 1,369,814
6. Units in issue
During the year the numbers of share issued, redeemed and outstanding are as follows:
Phillip USD Money
Market Fund
2018 2017
US$ US$
Units at beginning of the year 174,721,629 149,708,710
Units created 594,742,022 437,729,610
Units cancelled (570,459,433) (412,716,691)
Units at end of the year 199,004,218 174,721,629
Net assets attributable to unitholders – US$ 212,020,681 184,118,660
Net asset value per unit – US$ 1.0654 1.0538
For subscriptions and redemptions and for various fee calculations, investments are stated at the
last traded price/amortised cost on the valuation day for the purpose of determining net asset value
per unit while for reporting purpose, the investments are valued at the relevant bid market prices
as at the reporting date.
Phillip Treasury Fund
Financial statements
Year ended 31 March 2018
FS12
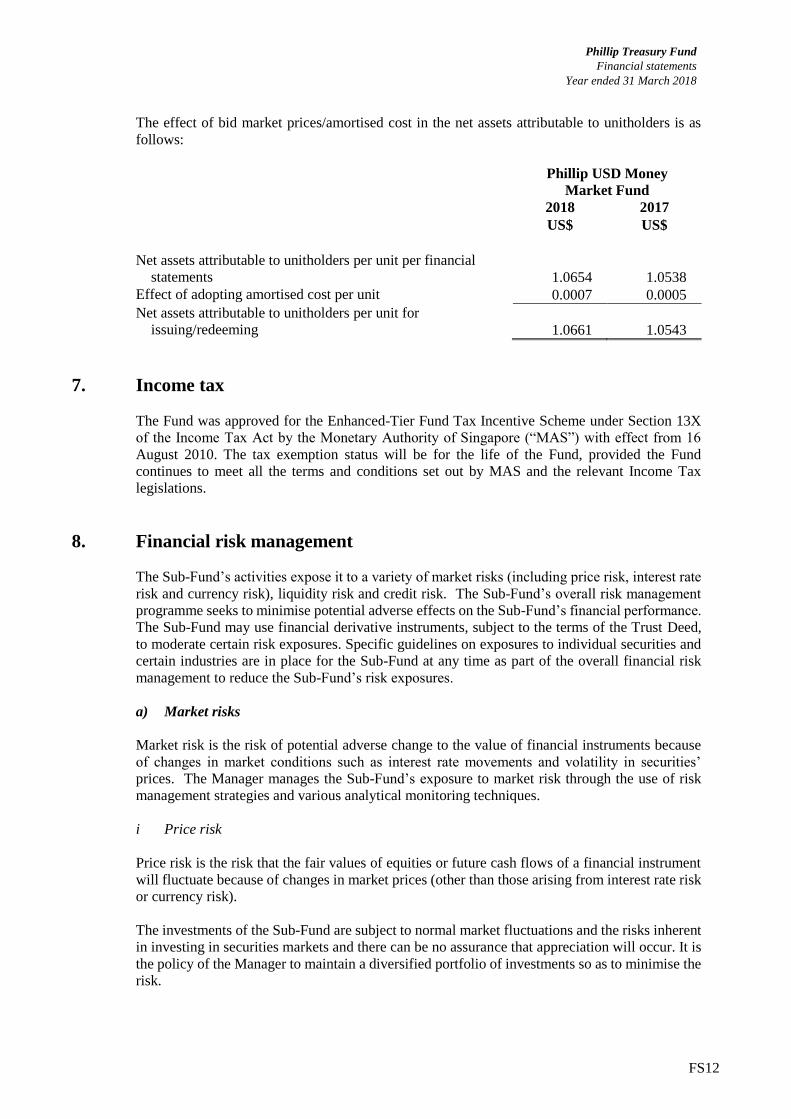
The effect of bid market prices/amortised cost in the net assets attributable to unitholders is as
follows:
Phillip USD Money
Market Fund
2018 2017
US$ US$
Net assets attributable to unitholders per unit per financial
statements 1.0654 1.0538
Effect of adopting amortised cost per unit 0.0007 0.0005
Net assets attributable to unitholders per unit for
issuing/redeeming 1.0661 1.0543
7. Income tax
The Fund was approved for the Enhanced-Tier Fund Tax Incentive Scheme under Section 13X
of the Income Tax Act by the Monetary Authority of Singapore (“MAS”) with effect from 16
August 2010. The tax exemption status will be for the life of the Fund, provided the Fund
continues to meet all the terms and conditions set out by MAS and the relevant Income Tax
legislations.
8. Financial risk management
The Sub-Fund’s activities expose it to a variety of market risks (including price risk, interest rate
risk and currency risk), liquidity risk and credit risk. The Sub-Fund’s overall risk management
programme seeks to minimise potential adverse effects on the Sub-Fund’s financial performance.
The Sub-Fund may use financial derivative instruments, subject to the terms of the Trust Deed,
to moderate certain risk exposures. Specific guidelines on exposures to individual securities and
certain industries are in place for the Sub-Fund at any time as part of the overall financial risk
management to reduce the Sub-Fund’s risk exposures.
a) Market risks
Market risk is the risk of potential adverse change to the value of financial instruments because
of changes in market conditions such as interest rate movements and volatility in securities’
prices. The Manager manages the Sub-Fund’s exposure to market risk through the use of risk
management strategies and various analytical monitoring techniques.
i Price risk
Price risk is the risk that the fair values of equities or future cash flows of a financial instrument
will fluctuate because of changes in market prices (other than those arising from interest rate risk
or currency risk).
The investments of the Sub-Fund are subject to normal market fluctuations and the risks inherent
in investing in securities markets and there can be no assurance that appreciation will occur. It is
the policy of the Manager to maintain a diversified portfolio of investments so as to minimise the
risk.
Phillip Treasury Fund
Financial statements
Year ended 31 March 2018
FS13
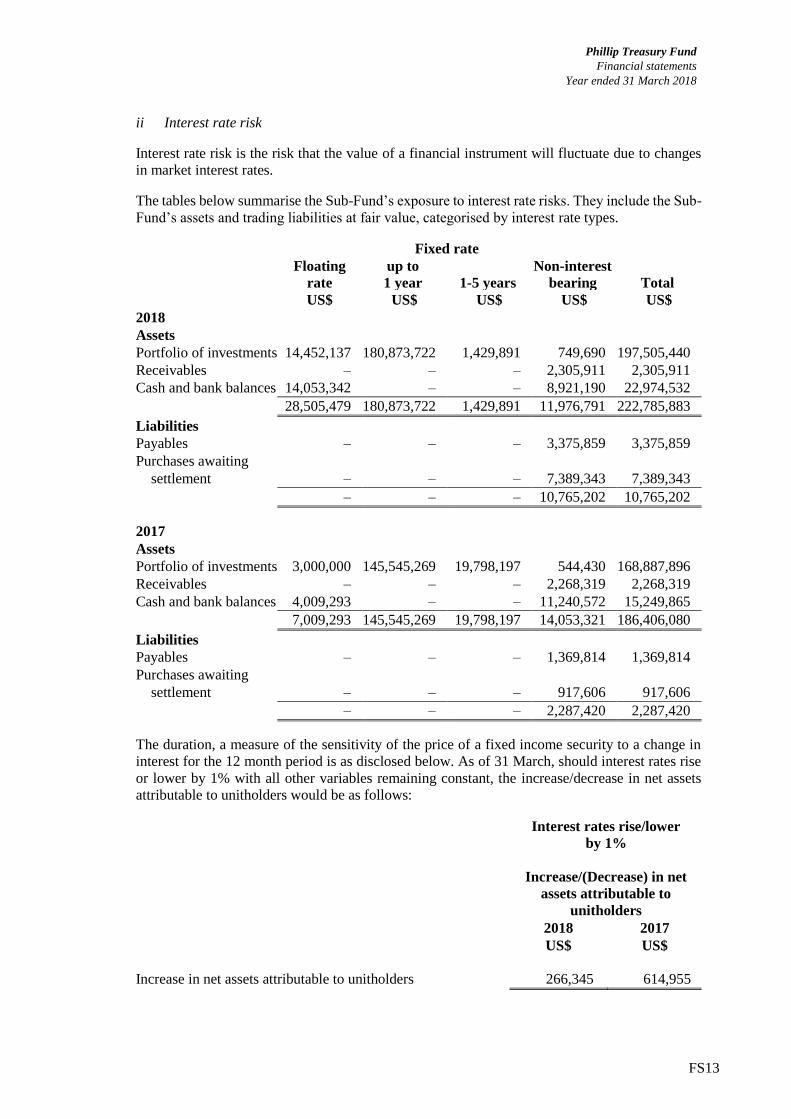
ii Interest rate risk
Interest rate risk is the risk that the value of a financial instrument will fluctuate due to changes
in market interest rates.
The tables below summarise the Sub-Fund’s exposure to interest rate risks. They include the Sub-
Fund’s assets and trading liabilities at fair value, categorised by interest rate types.
Fixed rate
Floating
rate
up to
1 year 1-5 years
Non-interest
bearing Total
US$ US$ US$ US$ US$
2018
Assets
Portfolio of investments 14,452,137 180,873,722 1,429,891 749,690 197,505,440
Receivables – – – 2,305,911 2,305,911
Cash and bank balances 14,053,342 – – 8,921,190 22,974,532
28,505,479 180,873,722 1,429,891 11,976,791 222,785,883
Liabilities
Payables – – – 3,375,859 3,375,859
Purchases awaiting
settlement – – – 7,389,343 7,389,343
– – – 10,765,202 10,765,202
2017
Assets
Portfolio of investments 3,000,000 145,545,269 19,798,197 544,430 168,887,896
Receivables – – – 2,268,319 2,268,319
Cash and bank balances 4,009,293 – – 11,240,572 15,249,865
7,009,293 145,545,269 19,798,197 14,053,321 186,406,080
Liabilities
Payables – – – 1,369,814 1,369,814
Purchases awaiting
settlement – – – 917,606 917,606
– – – 2,287,420 2,287,420
The duration, a measure of the sensitivity of the price of a fixed income security to a change in
interest for the 12 month period is as disclosed below. As of 31 March, should interest rates rise
or lower by 1% with all other variables remaining constant, the increase/decrease in net assets
attributable to unitholders would be as follows:
Interest rates rise/lower
by 1%
Increase/(Decrease) in net
assets attributable to
unitholders
2018 2017
US$ US$
Increase in net assets attributable to unitholders 266,345 614,955
Phillip Treasury Fund
Financial statements
Year ended 31 March 2018
FS14
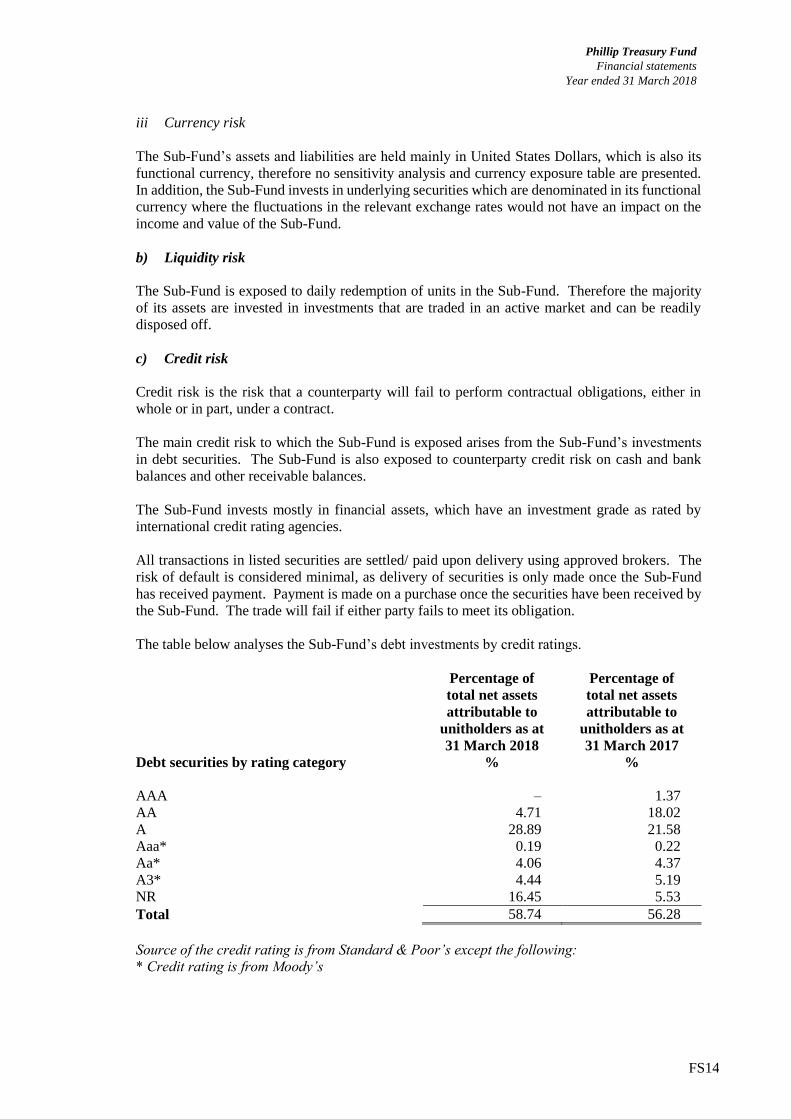
iii Currency risk
The Sub-Fund’s assets and liabilities are held mainly in United States Dollars, which is also its
functional currency, therefore no sensitivity analysis and currency exposure table are presented.
In addition, the Sub-Fund invests in underlying securities which are denominated in its functional
currency where the fluctuations in the relevant exchange rates would not have an impact on the
income and value of the Sub-Fund.
b) Liquidity risk
The Sub-Fund is exposed to daily redemption of units in the Sub-Fund. Therefore the majority
of its assets are invested in investments that are traded in an active market and can be readily
disposed off.
c) Credit risk
Credit risk is the risk that a counterparty will fail to perform contractual obligations, either in
whole or in part, under a contract.
The main credit risk to which the Sub-Fund is exposed arises from the Sub-Fund’s investments
in debt securities. The Sub-Fund is also exposed to counterparty credit risk on cash and bank
balances and other receivable balances.
The Sub-Fund invests mostly in financial assets, which have an investment grade as rated by
international credit rating agencies.
All transactions in listed securities are settled/ paid upon delivery using approved brokers. The
risk of default is considered minimal, as delivery of securities is only made once the Sub-Fund
has received payment. Payment is made on a purchase once the securities have been received by
the Sub-Fund. The trade will fail if either party fails to meet its obligation.
The table below analyses the Sub-Fund’s debt investments by credit ratings.
Debt securities by rating category
Percentage of
total net assets
attributable to
unitholders as at
31 March 2018
%
Percentage of
total net assets
attributable to
unitholders as at
31 March 2017
%
AAA – 1.37
AA 4.71 18.02
A 28.89 21.58
Aaa* 0.19 0.22
Aa* 4.06 4.37
A3* 4.44 5.19
NR 16.45 5.53
Total 58.74 56.28
Source of the credit rating is from Standard & Poor’s except the following:
* Credit rating is from Moody’s
Phillip Treasury Fund
Financial statements
Year ended 31 March 2018
FS15
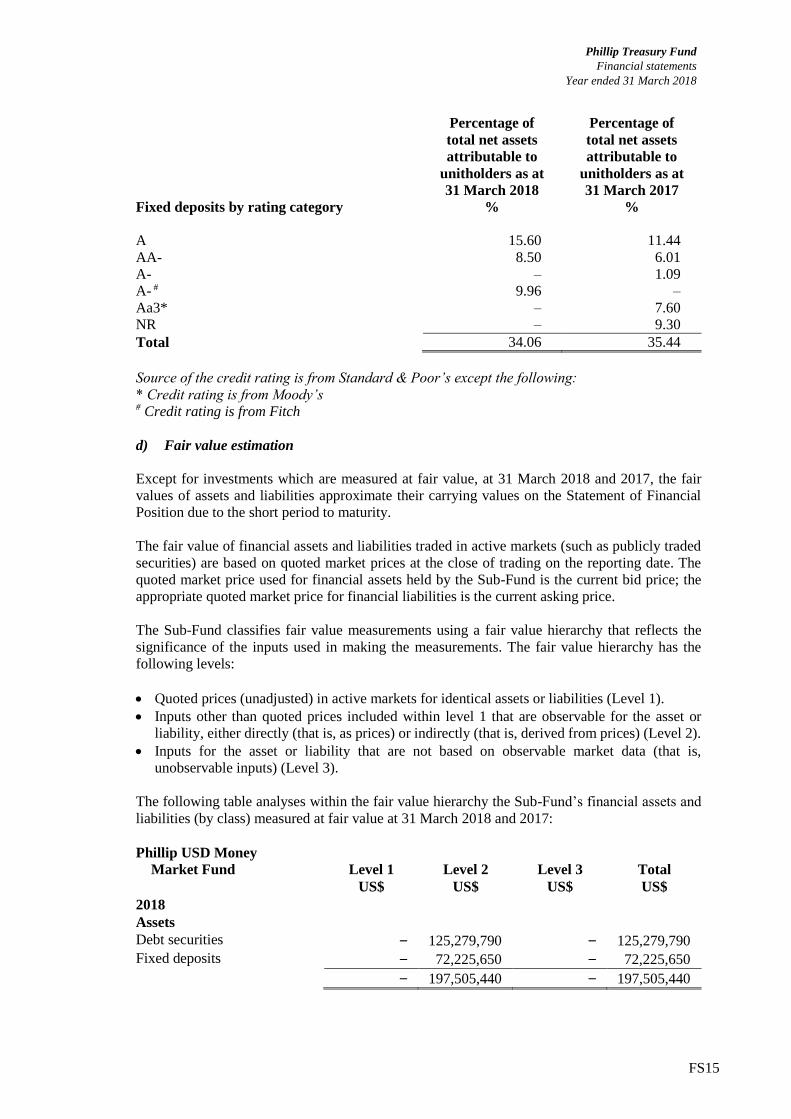
Fixed deposits by rating category
Percentage of
total net assets
attributable to
unitholders as at
31 March 2018
%
Percentage of
total net assets
attributable to
unitholders as at
31 March 2017
%
A 15.60 11.44
AA- 8.50 6.01
A- – 1.09
A- # 9.96 –
Aa3* – 7.60
NR – 9.30
Total 34.06 35.44
Source of the credit rating is from Standard & Poor’s except the following:
* Credit rating is from Moody’s # Credit rating is from Fitch
d) Fair value estimation
Except for investments which are measured at fair value, at 31 March 2018 and 2017, the fair
values of assets and liabilities approximate their carrying values on the Statement of Financial
Position due to the short period to maturity.
The fair value of financial assets and liabilities traded in active markets (such as publicly traded
securities) are based on quoted market prices at the close of trading on the reporting date. The
quoted market price used for financial assets held by the Sub-Fund is the current bid price; the
appropriate quoted market price for financial liabilities is the current asking price.
The Sub-Fund classifies fair value measurements using a fair value hierarchy that reflects the
significance of the inputs used in making the measurements. The fair value hierarchy has the
following levels:
Quoted prices (unadjusted) in active markets for identical assets or liabilities (Level 1).
Inputs other than quoted prices included within level 1 that are observable for the asset or
liability, either directly (that is, as prices) or indirectly (that is, derived from prices) (Level 2).
Inputs for the asset or liability that are not based on observable market data (that is,
unobservable inputs) (Level 3).
The following table analyses within the fair value hierarchy the Sub-Fund’s financial assets and
liabilities (by class) measured at fair value at 31 March 2018 and 2017:
Phillip USD Money
Market Fund Level 1 Level 2 Level 3 Total
US$ US$ US$ US$
2018
Assets
Debt securities – 125,279,790 – 125,279,790
Fixed deposits – 72,225,650 – 72,225,650
– 197,505,440 – 197,505,440
Phillip Treasury Fund
Financial statements
Year ended 31 March 2018
FS16
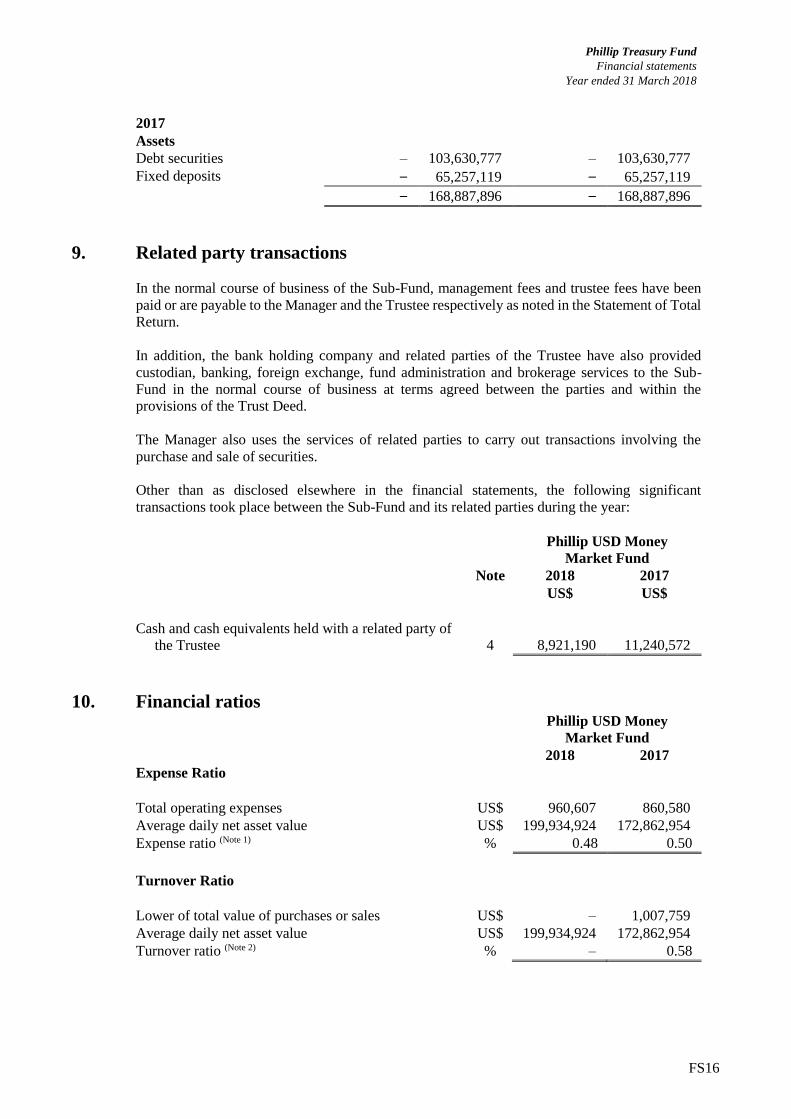
2017
Assets
Debt securities – 103,630,777 – 103,630,777
Fixed deposits – 65,257,119 – 65,257,119
– 168,887,896 – 168,887,896
9. Related party transactions
In the normal course of business of the Sub-Fund, management fees and trustee fees have been
paid or are payable to the Manager and the Trustee respectively as noted in the Statement of Total
Return.
In addition, the bank holding company and related parties of the Trustee have also provided
custodian, banking, foreign exchange, fund administration and brokerage services to the Sub-
Fund in the normal course of business at terms agreed between the parties and within the
provisions of the Trust Deed.
The Manager also uses the services of related parties to carry out transactions involving the
purchase and sale of securities.
Other than as disclosed elsewhere in the financial statements, the following significant
transactions took place between the Sub-Fund and its related parties during the year:
Phillip USD Money
Market Fund
Note 2018 2017
US$ US$
Cash and cash equivalents held with a related party of
the Trustee 4 8,921,190 11,240,572
10. Financial ratios Phillip USD Money
Market Fund
2018 2017
Expense Ratio
Total operating expenses US$ 960,607 860,580
Average daily net asset value US$ 199,934,924 172,862,954
Expense ratio (Note 1) % 0.48 0.50
Turnover Ratio
Lower of total value of purchases or sales US$ – 1,007,759
Average daily net asset value US$ 199,934,924 172,862,954
Turnover ratio (Note 2) % – 0.58
Phillip Treasury Fund
Financial statements
Year ended 31 March 2018
FS17
Note 1: The expense ratio has been computed based on the guidelines laid down by the IMAS.
The calculation of the expense ratio is based on total operating expenses divided by the
average net asset value for the year. The total operating expenses do not include (where
applicable) brokerage and other transaction costs, performance fees, interest expenses,
distributions paid out to unitholders, foreign exchange gains/losses, front or back end
loads arising from the purchase or sale of other funds and tax deducted at source or
arising out of income received. The Sub-Fund does not pay performance fee. The
average net asset value is based on the daily balances.
Note 2: The turnover ratio is calculated in accordance with the formula stated in the Code. The
calculation of the turnover ratio is based on the total value of purchases (or sales) of the
underlying investments divided by the weighted average daily net asset value. Total
value of purchases (or sales) does not include brokerage and other transaction costs. The
total value of bonds matured during the year is not included in the computation of
portfolio turnover ratio.
Phillip Treasury Fund
FS18
IMPORTANT INFORMATION Phillip USD Money Market Fund (the “Sub-Fund”) is a sub-fund of Phillip Treasury Fund (the “Fund”), an open-ended umbrella unit trust authorised under the Securities and Futures Act, Chapter 289, by the Monetary Authority of Singapore. This document is published by Phillip Capital Management (S) Ltd, the manager of the Fund (the “Manager”), for information only and it does not constitute a prospectus nor form part of any offer or invitation to subscribe for or to purchase, or solicitation of any offer to subscribe for or to purchase, any units in the Fund. All applications for units in the Fund must be made on the application forms accompanying the latest prospectus of the Fund (the “Prospectus”). The information and opinions contained in this document have been obtained from public sources which the Manager believes to be reliable and accurate. However, no representation or warranty, express or implied, is made as to the fairness, accuracy, completeness or correctness of the information and it should not be relied upon as such. Opinions included herein constitute the judgement of the Manager at the time specified and may be subject to change without notice, they are not to be relied upon as authoritative or taken in substitution for the exercise of judgment by any recipient and are not intended to provide the sole basis of evaluation of any investment. Neither the Manager nor the Fund, nor any of their respective associates, directors, officers or employees, accepts any liability whatsoever for any loss arising directly or indirectly from any use of this document or any information contained herein. Given the economic and market risks, there can be no assurance that the Fund will achieve its investment objectives. Investments in the Fund are not deposits or other obligations of, or guaranteed, or insured by the Manager or the distributors or their affiliates and are subject to investment risks, including the possible loss of the full principal amount invested. Returns may be affected by, among other things, the investment strategies or objectives of the Fund and material market and economic conditions. The value of the units and the income from them can fall as well as rise. Past performance is not necessarily indicative of the future performance of the Fund. This document should not be taken as a recommendation to buy or sell since it does not take into account the specific investment objectives, financial situation and the particular needs of any particular recipient of this document. Investors should seek advice from a financial advisor before purchasing units in the Fund. In any case, investors should read the Prospectus and consider the risks as well as suitability of the Fund before deciding whether to subscribe for units in the Fund. Copies of the Prospectus are available and may be obtained from the Manager.