Embed Size (px)
Citation preview
7/25/2019 Phillipsol12 - Lianas
http://slidepdf.com/reader/full/phillipsol12-lianas 1/10
! ! ∀#∃% &∋%! ! &( &%! )! ∗! +,−%
∀(! ./01 ( 223 3 24(2! 5 .01 6/076/0 899+ 6/7:50
;
7/25/2019 Phillipsol12 - Lianas
http://slidepdf.com/reader/full/phillipsol12-lianas 2/10
1250
Ecology, 86(5), 2005, pp. 1250–1258 2005 by the Ecological Society of America
LARGE LIANAS AS HYPERDYNAMIC ELEMENTS OF THE TROPICAL
FOREST CANOPY
OLIVER L. PHILLIPS,1,5 RODOLFO VASQUEZ MART INEZ,2 ABEL MONTEAGUDO MENDOZA,2,3
TIMOTHY R. BAKER,1,4 AND PERCY NUNEZ VARGAS3
1 Earth and Biosphere Institute, School of Geography, University of Leeds, UK 2Proyecto Flora de l Peru, Jardin Botanico de Missour i, Oxapampa, Pasco, Pe ru
3 Herbario Vargas, Universidad Nacional San Antonio Abad del Cusco, Peru 4 Max Planck Institute of Biogeochemistry, Jena, Germany
Abstract. Lianas (woody vines) are an important component of lowland tropical forests.We report large liana and tree inventory and dynamics data from Amazonia over periodsof up to 24 years, making this the longest geographically extensive study of liana ecologyto date. We use these results to address basic questions about the ecology of large lianasin mature forests and their interactions with trees. In one intensively studied site we findthat large lianas (10 cm diameter) represent 5% of liana stems, but 80% of biomass of well-lit upper canopy lianas. Across sites, large lianas and large trees are both most suc-cessful in terms of structural importance in richer soil forests, but large liana success may
be controlled more by the availability of large tree supports rather than directly by soilconditions. Long-term annual turnover rates of large lianas are 5–8%, three times those of trees. Lianas are implicated in large tree mortality: liana-infested large trees are three timesmore likely to die than liana-free large trees, and large lianas are involved in the death of at least 30% of tree basal area. Thus large lianas are a much more dynamic component of Amazon forests than are canopy trees, and they play a much more significant functionalrole than their structural contribution suggests.
Key words: Amazonia; dynamics; liana; mortality; Peru; productivity; recruitment; soil structure;treefall; tropical forest; turnover.
INTRODUCTION
Lianas, or woody vines, are a significant component
of most tropical forests (Schnitzer and Bongers 2002).
They comprise from 15% to 25% of woody plant stemsand species in forest sample plots around the tropics
(Gentry 1991), and contribute up to 40% of forest leaf
area and leaf producti vity (Hegart y and Caballe 1991) .
Moreover, climbers are structural parasites on other
plants (Darwin 1867, Stevens 1987) and as such may
slow tree growth (Clark and Clark 1990), increase risk
of death for host trees (e.g., Putz 1984a, b), and are a
major pest in managed and plantation tropical forests
(e.g., Appanah and Putz 1984). Lianas have been shown
to delay and alter gap-phase regeneration processes
through competitive interactions with juvenile trees
(Schnitzer et al. 2000). Recent research also suggests
that the abundance of lianas is changing. Long-term
monitoring of populations in Amazonia (Phillips et al.2002) and leaf fall in Central America (Wright et al.
2004) indicates that lianas are becoming more domi-
nant and productive even in mature forests, possibly
because higher CO2 levels provide a competitive ad-
Manuscript received 16 September 2004; revised 28 Septem-ber 2004; accepted 30 September 2004. Corresponding Editor: N.Cappuccino.
5 E-mail: [email protected]
vantage to liana as opposed to tree species (Granados
and Korner 2002).
In spite of their significance, lianas are persistently
understudied, and even a basic understanding of pop-
ulation processes and macroecological patterns remainselusive. For example, several factors have been pro-
posed to promote large liana abundance in forests, in-
cluding soil fertility and seasonality (Gentry 1991),
availability of suitable trellises (Hegarty and Caballe
1991), and prior human disturbance ( Ballee a nd Camp-
bell 1990); but few quantitative data are available to
evaluate these claims. Those data that are available are
rarely standardized, rendering large-scale comparative
analysis of structure and composition, let alone dy-
namics, difficult (cf., Burnham 2004). Liana growth
rates and turnover rates are rarely reported even though
equivalent parameters for trees are now published from
100 sites in Amazonia alone (Phillips et al. 2004). The
largest lianas that reach, and potentially dominate, thecanopy of mature forests are especially understudied
because of the difficulties in following a sufficiently
large sample for a long enough time. One result is that
lianas are ignored in models of forest processes and so
the potential feedback of changing liana dominance and
dynamics on stand-level biodiversity and carbon bal-
ance remain unexplored. Standardized structural and
life history data are needed from a range of sites if the
role of large lianas is to be better understood.
7/25/2019 Phillipsol12 - Lianas
http://slidepdf.com/reader/full/phillipsol12-lianas 3/10
May 2005 1251HYPERDYNAMIC LIANAS
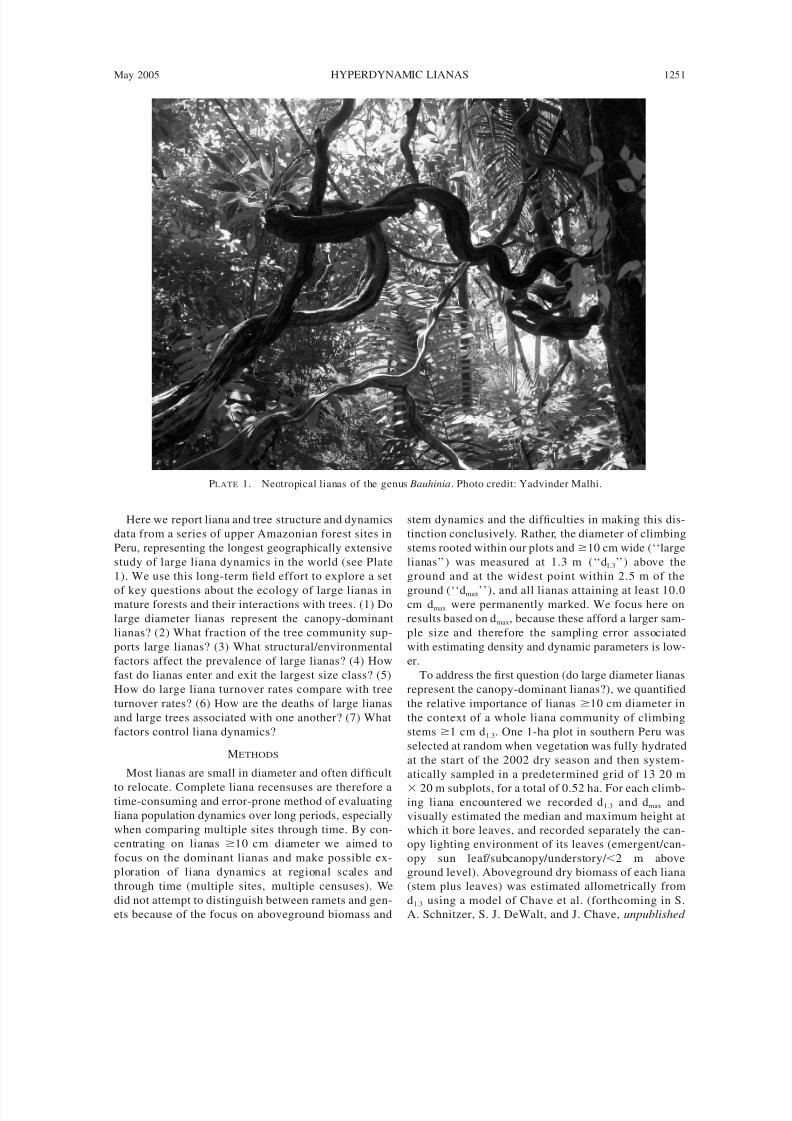
PLATE 1. Neotropical lianas of the genus Bauhinia. Photo credit: Yadvinder Malhi.
Here we report liana and tree structure and dynamics
data from a series of upper Amazonian forest sites in
Peru, representing the longest geographically extensive
study of large liana dynamics in the world (see Plate
1). We use this long-term field effort to explore a set
of key questions about the ecology of large lianas inmature forests and their interactions with trees. (1) Do
large diameter lianas represent the canopy-dominant
lianas? (2) What fraction of the tree community sup-
ports large lianas? (3) What structural/environmental
factors affect the prevalence of large lianas? (4) How
fast do lianas enter and exit the largest size class? (5)
How do large liana turnover rates compare with tree
turnover rates? (6) How are the deaths of large lianas
and large trees associated with one another? (7) What
factors control liana dynamics?
METHODS
Most lianas are small in diameter and often difficult
to relocate. Complete liana recensuses are therefore atime-consuming and error-prone method of evaluating
liana population dynamics over long periods, especially
when comparing multiple sites through time. By con-
centrating on lianas 10 cm diameter we aimed to
focus on the dominant lianas and make possible ex-
ploration of liana dynamics at regional scales and
through time (multiple sites, multiple censuses). We
did not attempt to distinguish between ramets and gen-
ets because of the focus on aboveground biomass and
stem dynamics and the difficulties in making this dis-
tinction conclusively. Rather, the diameter of climbing
stems rooted within our plots and 10 cm wide (‘‘large
lianas’’) was measured at 1.3 m (‘‘d1.3’’) above the
ground and at the widest point within 2.5 m of the
ground (‘‘dmax’’), and all lianas attaining at least 10.0cm dmax were permanently marked. We focus here on
results based on dmax, because these afford a larger sam-
ple size and therefore the sampling error associated
with estimating density and dynamic parameters is low-
er.
To address the first question (do large diameter lianas
represent the canopy-dominant lianas?), we quantified
the relative importance of lianas 10 cm diameter in
the context of a whole liana community of climbing
stems 1 cm d1.3. One 1-ha plot in southern Peru was
selected at random when vegetation was fully hydrated
at the start of the 2002 dry season and then system-
atically sampled in a predetermined grid of 13 20 m
20 m subplots, for a total of 0.52 ha. For each climb-ing liana encountered we recorded d 1.3 and dmax and
visually estimated the median and maximum height at
which it bore leaves, and recorded separately the can-
opy lighting environment of its leaves (emergent/can-
opy sun leaf/subcanopy/understory/ 2 m above
ground level). Aboveground dry biomass of each liana
(stem plus leaves) was estimated allometrically from
d1.3 using a model of Chave et al. (forthcoming in S.
A. Schnitzer, S. J. DeWalt, and J. Chave, unpublished
7/25/2019 Phillipsol12 - Lianas
http://slidepdf.com/reader/full/phillipsol12-lianas 4/10
1252 OLIVER L. PHILLIPS ET AL. Ecology, Vol. 86, No. 5
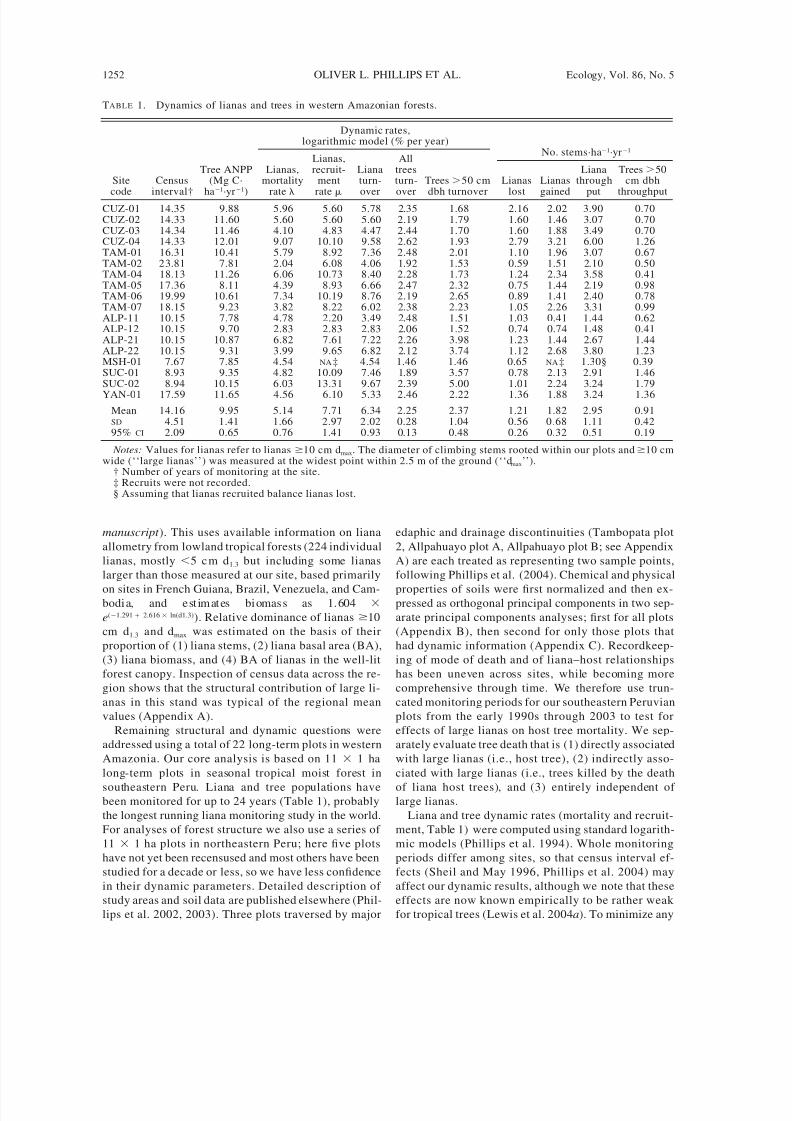
TABLE 1. Dynamics of lianas and trees in western Amazonian forests.
Site
code
Census
interval†
Tree ANPP(Mg C·
ha
1
·yr
1
)
Dynamic rates,logarithmic model (% per year)
Lianas,mortality
rate
Lianas,recruit-
ment
rate
Lianaturn-
over
Alltreesturn-
over
Trees 50 cm
dbh turnover
No. stems·ha1·yr1
Lianas
lost
Lianas
gained
Lianathrough
put
Trees 50cm dbh
throughputCUZ-01 14.35 9.88 5.96 5.60 5.78 2.35 1.68 2.16 2.02 3.90 0.70CUZ-02 14.33 11.60 5.60 5.60 5.60 2.19 1.79 1.60 1.46 3.07 0.70CUZ-03 14.34 11.46 4.10 4.83 4.47 2.44 1.70 1.60 1.88 3.49 0.70CUZ-04 14.33 12.01 9.07 10.10 9.58 2.62 1.93 2.79 3.21 6.00 1.26TAM-01 16.31 10.41 5.79 8.92 7.36 2.48 2.01 1.10 1.96 3.07 0.67TAM-02 23.81 7.81 2.04 6.08 4.06 1.92 1.53 0.59 1.51 2.10 0.50TAM-04 18.13 11.26 6.06 10.73 8.40 2.28 1.73 1.24 2.34 3.58 0.41TAM-05 17.36 8.11 4.39 8.93 6.66 2.47 2.32 0.75 1.44 2.19 0.98TAM-06 19.99 10.61 7.34 10.19 8.76 2.19 2.65 0.89 1.41 2.40 0.78TAM-07 18.15 9.23 3.82 8.22 6.02 2.38 2.23 1.05 2.26 3.31 0.99ALP-11 10.15 7.78 4.78 2.20 3.49 2.48 1.51 1.03 0.41 1.44 0.62ALP-12 10.15 9.70 2.83 2.83 2.83 2.06 1.52 0.74 0.74 1.48 0.41ALP-21 10.15 10.87 6.82 7.61 7.22 2.26 3.98 1.23 1.44 2.67 1.44ALP-22 10.15 9.31 3.99 9.65 6.82 2.12 3.74 1.12 2.68 3.80 1.23MSH-01 7.67 7.85 4.54 NA ‡ 4.54 1.46 1.46 0.65 NA ‡ 1.30§ 0.39SUC-01 8.93 9.35 4.82 10.09 7.46 1.89 3.57 0.78 2.13 2.91 1.46SUC-02 8.94 10.15 6.03 13.31 9.67 2.39 5.00 1.01 2.24 3.24 1.79
YAN-01 17.59 11.65 4.56 6.10 5.33 2.46 2.22 1.36 1.88 3.24 1.36
Mean 14.16 9.95 5.14 7.71 6.34 2.25 2.37 1.21 1.82 2.95 0.91SD 4.51 1.41 1.66 2.97 2.02 0.28 1.04 0.56 0.68 1.11 0.4295% CI 2.09 0.65 0.76 1.41 0.93 0.13 0.48 0.26 0.32 0.51 0.19
Notes: Values for lianas refer to lianas 10 cm dmax. The diameter of climbing stems rooted within our plots and 10 cmwide (‘‘large lianas’’) was measured at the widest point within 2.5 m of the ground (‘‘d max’’).
† Number of years of monitoring at the site.‡ Recruits were not recorded.§ Assuming that lianas recruited balance lianas lost.
manuscript ). This uses available information on liana
allometry from lowland tropical forests (224 individual
lianas, mostly 5 c m d1.3 but including some lianas
larger than those measured at our site, based primarily
on sites in French Guiana, Brazil, Venezuela, and Cam-bodi a, and e st im at es bi omas s as 1. 604
e(1.291 2.616 ln(d1.3)). Relative dominance of lianas 10
cm d1.3 and dmax was estimated on the basis of their
proportion of (1) liana stems, (2) liana basal area (BA),
(3) liana biomass, and (4) BA of lianas in the well-lit
forest canopy. Inspection of census data across the re-
gion shows that the structural contribution of large li-
anas in this stand was typical of the regional mean
values (Appendix A).
Remaining structural and dynamic questions were
addressed using a total of 22 long-term plots in western
Amazonia. Our core analysis is based on 11 1 ha
long-term plots in seasonal tropical moist forest in
southeastern Peru. Liana and tree populations havebeen monitored for up to 24 years (Table 1), probably
the longest running liana monitoring study in the world.
For analyses of forest structure we also use a series of
11 1 ha plots in northeastern Peru; here five plots
have not yet been recensused and most others have been
studied for a decade or less, so we have less confidence
in their dynamic parameters. Detailed description of
study areas and soil data are published elsewhere (Phil-
lips et al. 2002, 2003). Three plots traversed by major
edaphic and drainage discontinuities (Tambopata plot
2, Allpahuayo plot A, Allpahuayo plot B; see Appendix
A) are each treated as representing two sample points,
following Phillips et al. (2004). Chemical and physical
properties of soils were first normalized and then ex-pressed as orthogonal principal components in two sep-
arate principal components analyses; first for all plots
(Appendix B), then second for only those plots that
had dynamic information (Appendix C). Recordkeep-
ing of mode of death and of liana–host relationships
has been uneven across sites, while becoming more
comprehensive through time. We therefore use trun-
cated monitoring periods for our southeastern Peruvian
plots from the early 1990s through 2003 to test for
effects of large lianas on host tree mortality. We sep-
arately evaluate tree death that is (1) directly associated
with large lianas (i.e., host tree), (2) indirectly asso-
ciated with large lianas (i.e., trees killed by the death
of liana host trees), and (3) entirely independent of large lianas.
Liana and tree dynamic rates (mortality and recruit-
ment, Table 1) were computed using standard logarith-
mic models (Phillips et al. 1994). Whole monitoring
periods differ among sites, so that census interval ef-
fects (Sheil and May 1996, Phillips et al. 2004) may
affect our dynamic results, although we note that these
effects are now known empirically to be rather weak
for tropical trees (Lewis et al. 2004a). To minimize any
7/25/2019 Phillipsol12 - Lianas
http://slidepdf.com/reader/full/phillipsol12-lianas 5/10
May 2005 1253HYPERDYNAMIC LIANAS
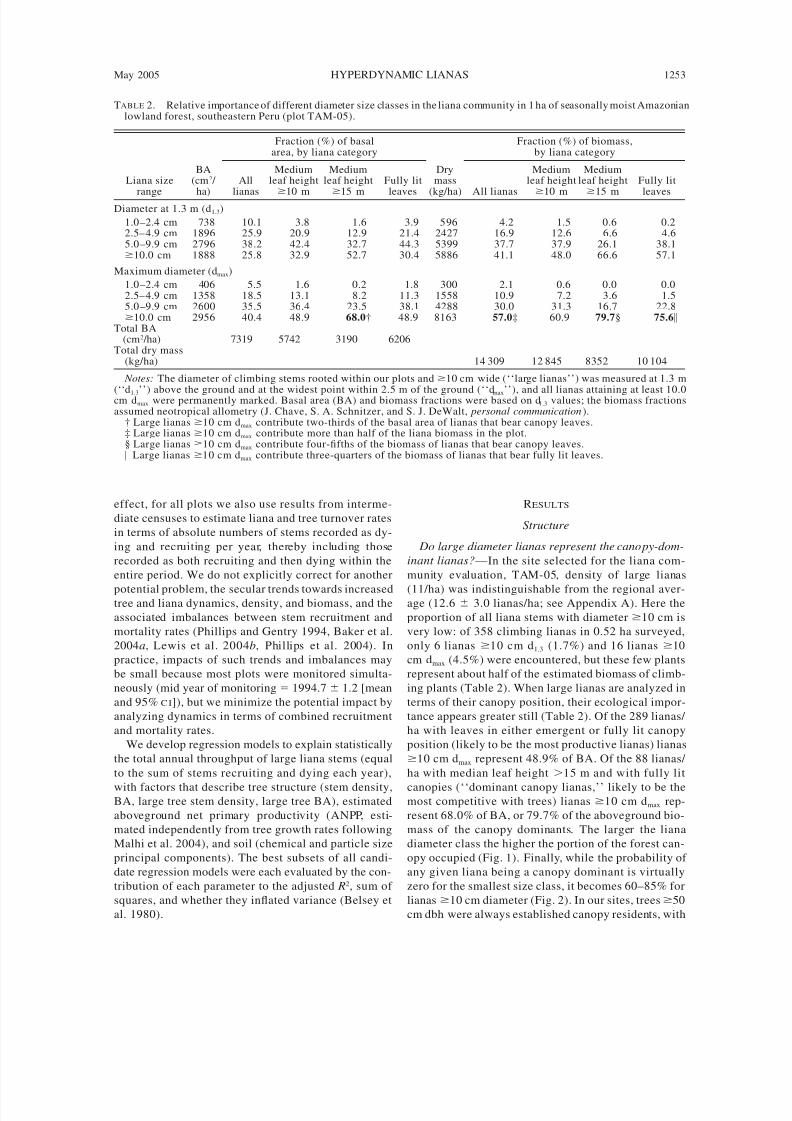
TABLE 2. Relative importance of different diameter size classes in the liana community in 1 ha of seasonally moist Amazonianlowland forest, southeastern Peru (plot TAM-05).
Liana size
range
BA(cm2 /
ha)
Fraction (%) of basalarea, by liana category
All
lianas
Mediumleaf height
10 m
Mediumleaf height
15 m
Fully lit
leaves
Drymass
(kg/ha)
Fraction (%) of biomass,by liana category
All lianas
Mediumleaf height
10 m
Mediumleaf height
15 m
Fully lit
leavesDiameter at 1.3 m (d1.3)
1.0–2.4 cm 738 10.1 3.8 1.6 3.9 596 4.2 1.5 0.6 0.22.5–4.9 cm 1896 25.9 20.9 12.9 21.4 2427 16.9 12.6 6.6 4.65.0–9.9 cm 2796 38.2 42.4 32.7 44.3 5399 37.7 37.9 26.1 38.110.0 cm 1888 25.8 32.9 52.7 30.4 5886 41.1 48.0 66.6 57.1
Maximum diameter (dmax)
1.0–2.4 cm 406 5.5 1.6 0.2 1.8 300 2.1 0.6 0.0 0.02.5–4.9 cm 1358 18.5 13.1 8.2 11.3 1558 10.9 7.2 3.6 1.55.0–9.9 cm 2600 35.5 36.4 23.5 38.1 4288 30.0 31.3 16.7 22.810.0 cm 2956 40.4 48.9 68.0† 48.9 8163 57.0‡ 60.9 79.7§ 75.6
Total BA(cm2 /ha) 7319 5742 3190 6206
Total dry mass(kg/ha) 14 309 12 845 8352 10 104
Notes: The diameter of climbing stems rooted within our plots and 10 cm wide (‘‘large lianas’’) was measured at 1.3 m
(‘‘d1.3’’) above the ground and at the widest point within 2.5 m of the ground (‘‘d max’’), and all lianas attaining at least 10.0cm dmax were permanently marked. Basal area (BA) and biomass fractions were based on d1.3 values; the biomass fractionsassumed neotropical allometry (J. Chave, S. A. Schnitzer, and S. J. DeWalt, personal communication).
† Large lianas 10 cm dmax contribute two-thirds of the basal area of lianas that bear canopy leaves.‡ Large lianas 10 cm dmax contribute more than half of the liana biomass in the plot.§ Large lianas 10 cm dmax contribute four-fifths of the biomass of lianas that bear canopy leaves. Large lianas 10 cm dmax contribute three-quarters of the biomass of lianas that bear fully lit leaves.
effect, for all plots we also use results from interme-
diate censuses to estimate liana and tree turnover rates
in terms of absolute numbers of stems recorded as dy-
ing and recruiting per year, thereby including those
recorded as both recruiting and then dying within the
entire period. We do not explicitly correct for another
potential problem, the secular trends towards increasedtree and liana dynamics, density, and biomass, and the
associated imbalances between stem recruitment and
mortality rates (Phillips and Gentry 1994, Baker et al.
2004a, Lewis et al. 2004b, Phillips et al. 2004). In
practice, impacts of such trends and imbalances may
be small because most plots were monitored simulta-
neously (mid year of monitoring 1994.7 1.2 [mean
and 95% CI]), but we minimize the potential impact by
analyzing dynamics in terms of combined recruitment
and mortality rates.
We develop regression models to explain statistically
the total annual throughput of large liana stems (equal
to the sum of stems recruiting and dying each year),
with factors that describe tree structure (stem density,BA, large tree stem density, large tree BA), estimated
aboveground net primary productivity (ANPP, esti-
mated independently from tree growth rates following
Malhi et al. 2004), and soil (chemical and particle size
principal components). The best subsets of all candi-
date regression models were each evaluated by the con-
tribution of each parameter to the adjusted R2, sum of
squares, and whether they inflated variance (Belsey et
al. 1980).
RESULTS
Structure
Do large diameter lianas represent the cano py-dom-
inant lianas?—In the site selected for the liana com-
munity evaluation, TAM-05, density of large lianas
(11/ha) was indistinguishable from the regional aver-age (12.6 3.0 lianas/ha; see Appendix A). Here the
proportion of all liana stems with diameter 10 cm is
very low: of 358 climbing lianas in 0.52 ha surveyed,
only 6 lianas 10 cm d1.3 (1.7%) and 16 lianas 10
cm dmax (4.5%) were encountered, but these few plants
represent about half of the estimated biomass of climb-
ing plants (Table 2). When large lianas are analyzed in
terms of their canopy position, their ecological impor-
tance appears greater still (Table 2). Of the 289 lianas/
ha with leaves in either emergent or fully lit canopy
position (likely to be the most productive lianas) lianas
10 cm dmax represent 48.9% of BA. Of the 88 lianas/
ha with median leaf height 15 m and with fully lit
canopies (‘‘dominant canopy lianas,’’ likely to be themost competitive with trees) lianas 10 cm dmax rep-
resent 68.0% of BA, or 79.7% of the aboveground bio-
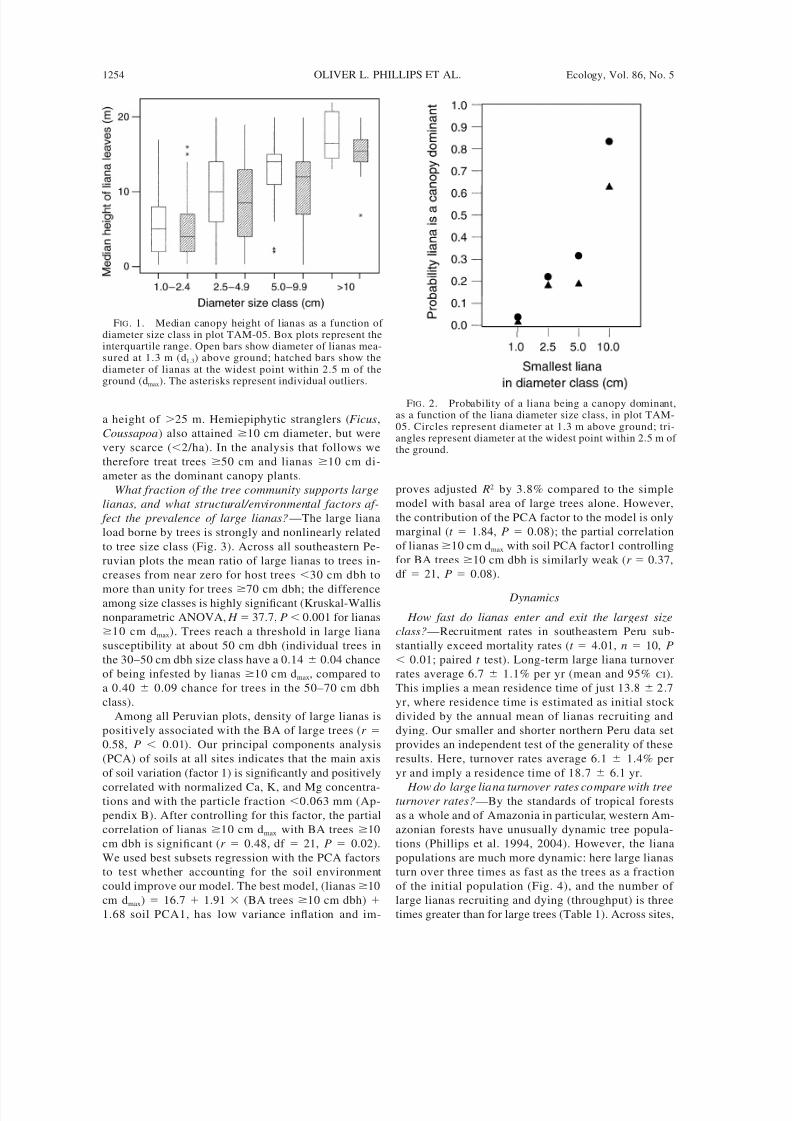
mass of the canopy dominants. The larger the liana
diameter class the higher the portion of the forest can-
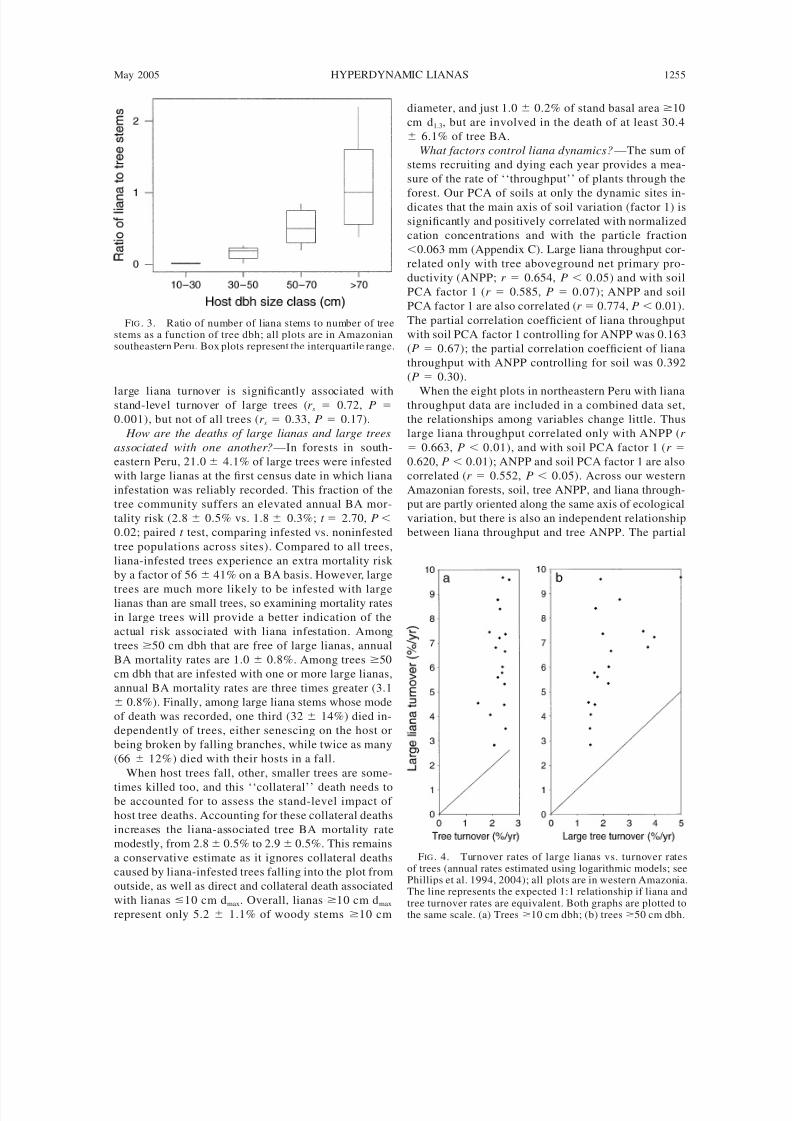
opy occupied (Fig. 1). Finally, while the probability of
any given liana being a canopy dominant is virtually
zero for the smallest size class, it becomes 60–85% for
lianas 10 cm diameter (Fig. 2). In our sites, trees 50
cm dbh were always established canopy residents, with
7/25/2019 Phillipsol12 - Lianas
http://slidepdf.com/reader/full/phillipsol12-lianas 6/10
1254 OLIVER L. PHILLIPS ET AL. Ecology, Vol. 86, No. 5
FIG. 1. Median canopy height of lianas as a function of diameter size class in plot TAM-05. Box plots represent theinterquartile range. Open bars show diameter of lianas mea-sured at 1.3 m (d1.3) above ground; hatched bars show thediameter of lianas at the widest point within 2.5 m of theground (dmax). The asterisks represent individual outliers.
FIG. 2. Probability of a liana being a canopy dominant,as a function of the liana diameter size class, in plot TAM-05. Circles represent diameter at 1.3 m above ground; tri-angles represent diameter at the widest point within 2.5 m of the ground.
a height of 25 m. Hemiepiphytic stranglers (Ficus,
Coussapoa) also attained 10 cm diameter, but were
very scarce (2/ha). In the analysis that follows we
therefore treat trees 50 cm and lianas 10 cm di-
ameter as the dominant canopy plants.
What fraction of the tree community supports large
lianas, and what structural/environmental factors af-
fect the prevalence of large lianas?—The large liana
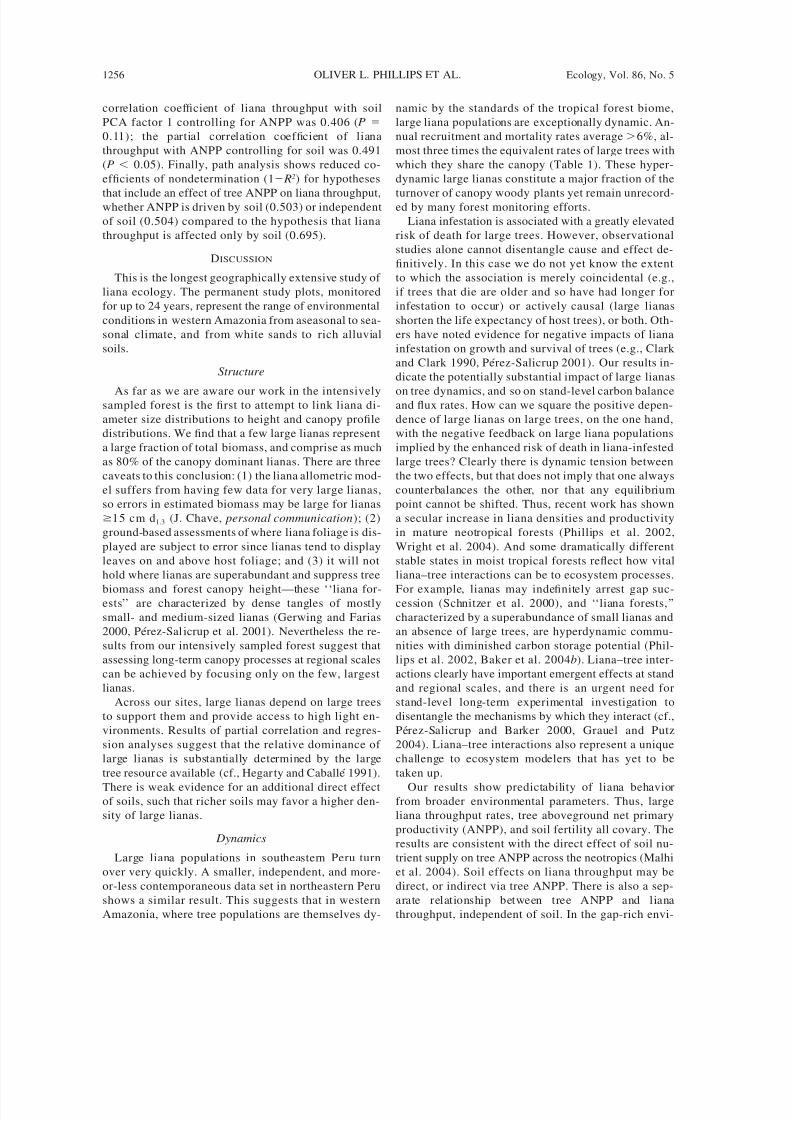
load borne by trees is strongly and nonlinearly related
to tree size class (Fig. 3). Across all southeastern Pe-
ruvian plots the mean ratio of large lianas to trees in-
creases from near zero for host trees 30 cm dbh to
more than unity for trees 70 cm dbh; the differenceamong size classes is highly significant (Kruskal-Wallis
nonparametric ANOVA, H 37.7, P 0.001 for lianas
10 cm dmax). Trees reach a threshold in large liana
susceptibility at about 50 cm dbh (individual trees in
the 30–50 cm dbh size class have a 0.14 0.04 chance
of being infested by lianas 10 cm dmax, compared to
a 0.40 0.09 chance for trees in the 50–70 cm dbh
class).
Among all Peruvian plots, density of large lianas is
positively associated with the BA of large trees ( r
0.58, P 0.01). Our principal components analysis
(PCA) of soils at all sites indicates that the main axis
of soil variation (factor 1) is significantly and positively
correlated with normalized Ca, K, and Mg concentra-tions and with the particle fraction 0.063 mm (Ap-
pendix B). After controlling for this factor, the partial
correlation of lianas 10 cm dmax with BA trees 10
cm dbh is significant (r 0.48, df 21, P 0.02).
We used best subsets regression with the PCA factors
to test whether accounting for the soil environment
could improve our model. The best model, (lianas 10
cm dmax) 16.7 1.91 (BA trees 10 cm dbh)
1.68 soil PCA1, has low variance inflation and im-
proves adjusted R2 by 3.8% compared to the simple
model with basal area of large trees alone. However,
the contribution of the PCA factor to the model is only
marginal (t 1.84, P 0.08); the partial correlation
of lianas 10 cm dmax with soil PCA factor1 controlling
for BA trees 10 cm dbh is similarly weak (r 0.37,
df 21, P 0.08).
Dynamics
How fast do lianas enter and exit the largest size
class?—Recruitment rates in southeastern Peru sub-
stantially exceed mortality rates (t 4.01, n 10, P
0.01; paired t test). Long-term large liana turnover
rates average 6.7 1.1% per yr (mean and 95% CI).
This implies a mean residence time of just 13.8 2 .7
yr, where residence time is estimated as initial stock
divided by the annual mean of lianas recruiting and
dying. Our smaller and shorter northern Peru data set
provides an independent test of the generality of these
results. Here, turnover rates average 6.1 1.4% per
yr and imply a residence time of 18.7 6.1 yr.
How do large lia na turnover rates co mpare with treeturnover rates?—By the standards of tropical forests
as a whole and of Amazonia in particular, western Am-
azonian forests have unusually dynamic tree popula-
tions (Phillips et al. 1994, 2004). However, the liana
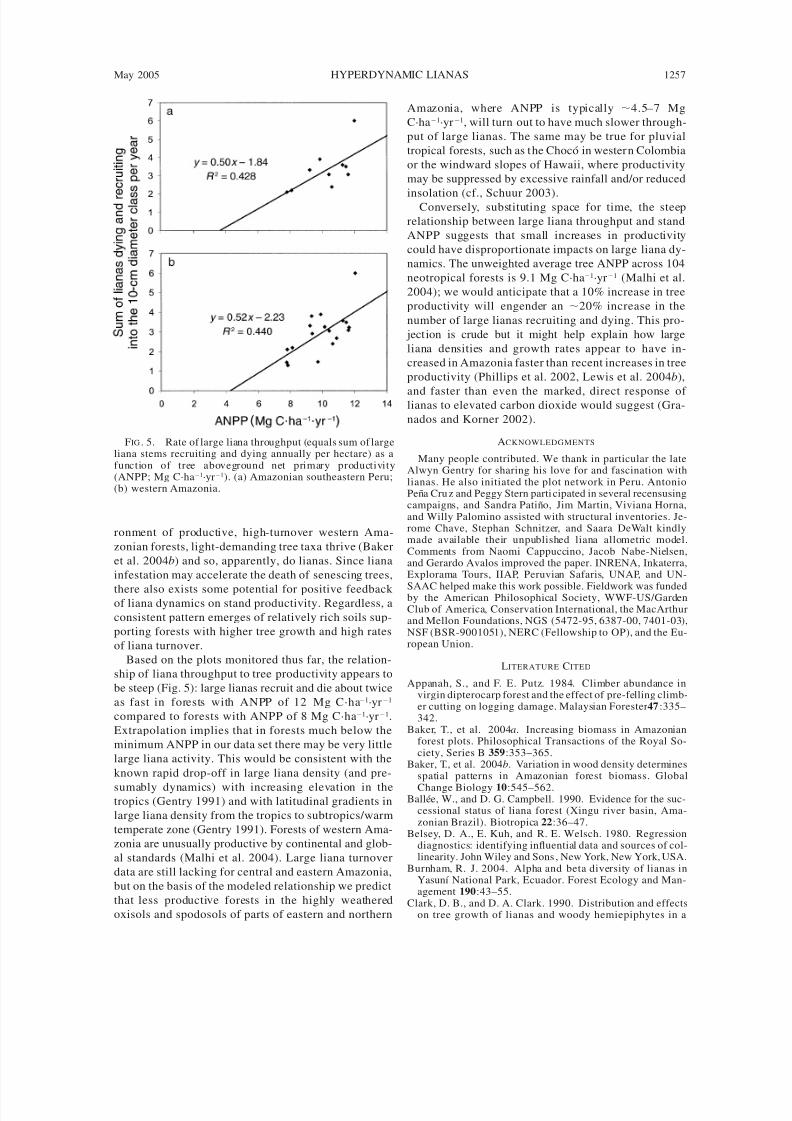
populations are much more dynamic: here large lianas
turn over three times as fast as the trees as a fraction
of the initial population (Fig. 4), and the number of
large lianas recruiting and dying (throughput) is three
times greater than for large trees (Table 1). Across sites,
7/25/2019 Phillipsol12 - Lianas
http://slidepdf.com/reader/full/phillipsol12-lianas 7/10
May 2005 1255HYPERDYNAMIC LIANAS
FIG . 3. Ratio of number of liana stems to number of treestems as a function of tree dbh; all plots are in Amazoniansoutheastern Peru. Box plots represent the interquartile range.
FIG . 4. Turnover rates of large lianas vs. turnover ratesof trees (annual rates estimated using logarithmic models; seePhillips et al. 1994, 2004); all plots are in western Amazonia.The line represents the expected 1:1 relationship if liana andtree turnover rates are equivalent. Both graphs are plotted tothe same scale. (a) Trees 10 cm dbh; (b) trees 50 cm dbh.
large liana turnover is significantly associated withstand-level turnover of large trees (r s 0.72, P
0.001), but not of all trees (r s 0.33, P 0.17).
How are the deaths of large lianas and large trees
associated with one another?—In forests in south-
eastern Peru, 21.0 4.1% of large trees were infested
with large lianas at the first census date in which liana
infestation was reliably recorded. This fraction of the
tree community suffers an elevated annual BA mor-
tality risk (2.8 0.5% vs. 1.8 0.3%; t 2.70, P
0.02; paired t test, comparing infested vs. noninfested
tree populations across sites). Compared to all trees,
liana-infested trees experience an extra mortality risk
by a factor of 56 41% on a BA basis. However, large
trees are much more likely to be infested with largelianas than are small trees, so examining mortality rates
in large trees will provide a better indication of the
actual risk associated with liana infestation. Among
trees 50 cm dbh that are free of large lianas, annual
BA mortality rates are 1.0 0.8%. Among trees 50
cm dbh that are infested with one or more large lianas,
annual BA mortality rates are three times greater (3.1
0.8%). Finally, among large liana stems whose mode
of death was recorded, one third (32 14%) died in-
dependently of trees, either senescing on the host or
being broken by falling branches, while twice as many
(66 12%) died with their hosts in a fall.
When host trees fall, other, smaller trees are some-
times killed too, and this ‘‘collateral’’ death needs tobe accounted for to assess the stand-level impact of
host tree deaths. Accounting for these collateral deaths
increases the liana-associated tree BA mortality rate
modestly, from 2.8 0.5% to 2.9 0.5%. This remains
a conservative estimate as it ignores collateral deaths
caused by liana-infested trees falling into the plot from
outside, as well as direct and collateral death associated
with lianas 10 cm dmax. Overall, lianas 10 cm dmax
represent only 5.2 1.1% of woody stems 10 cm
diameter, and just 1.0 0.2% of stand basal area 10
cm d1.3, but are involved in the death of at least 30.4
6.1% of tree BA.
What factors control liana dynamics?—The sum of
stems recruiting and dying each year provides a mea-
sure of the rate of ‘‘throughput’’ of plants through the
forest. Our PCA of soils at only the dynamic sites in-dicates that the main axis of soil variation (factor 1) is
significantly and positively correlated with normalized
cation concentrations and with the particle fraction
0.063 mm (Appendix C). Large liana throughput cor-
related only with tree aboveground net primary pro-
ductivity (ANPP; r 0.654, P 0.05) and with soil
PCA factor 1 (r 0.585, P 0.07); ANPP and soil
PCA factor 1 are also correlated (r 0.774, P 0.01).
The partial correlation coefficient of liana throughput
with soil PCA factor 1 controlling for ANPP was 0.163
(P 0.67); the partial correlation coefficient of liana
throughput with ANPP controlling for soil was 0.392
(P 0.30).
When the eight plots in northeastern Peru with lianathroughput data are included in a combined data set,
the relationships among variables change little. Thus
large liana throughput correlated only with ANPP ( r
0.663, P 0.01), and with soil PCA factor 1 ( r
0.620, P 0.01); ANPP and soil PCA factor 1 are also
correlated (r 0.552, P 0.05). Across our western
Amazonian forests, soil, tree ANPP, and liana through-
put are partly oriented along the same axis of ecological
variation, but there is also an independent relationship
between liana throughput and tree ANPP. The partial
7/25/2019 Phillipsol12 - Lianas
http://slidepdf.com/reader/full/phillipsol12-lianas 8/10
1256 OLIVER L. PHILLIPS ET AL. Ecology, Vol. 86, No. 5
correlation coefficient of liana throughput with soil
PCA factor 1 controlling for ANPP was 0.406 (P
0.11); the partial correlation coefficient of liana
throughput with ANPP controlling for soil was 0.491
(P 0.05). Finally, path analysis shows reduced co-
efficients of nondetermination (1 R2) for hypotheses
that include an effect of tree ANPP on liana throughput,whether ANPP is driven by soil (0.503) or independent
of soil (0.504) compared to the hypothesis that liana
throughput is affected only by soil (0.695).
DISCUSSION
This is the longest geographically extensive study of
liana ecology. The permanent study plots, monitored
for up to 24 years, represent the range of environmental
conditions in western Amazonia from aseasonal to sea-
sonal climate, and from white sands to rich alluvial
soils.
Structure
As far as we are aware our work in the intensivelysampled forest is the first to attempt to link liana di-
ameter size distributions to height and canopy profile
distributions. We find that a few large lianas represent
a large fraction of total biomass, and comprise as much
as 80% of the canopy dominant lianas. There are three
caveats to this conclusion: (1) the liana allometric mod-
el suffers from having few data for very large lianas,
so errors in estimated biomass may be large for lianas
15 cm d1.3 (J. Chave, personal communication); (2)
ground-based assessments of where liana foliage is dis-
played are subject to error since lianas tend to display
leaves on and above host foliage; and (3) it will not
hold where lianas are superabundant and suppress tree
biomass and forest canopy height—these ‘‘liana for-ests’’ are characterized by dense tangles of mostly
small- and medium-sized lianas (Gerwing and Farias
2000, Perez-Sal icrup et al. 2001). Nevertheless the re-
sults from our intensively sampled forest suggest that
assessing long-term canopy processes at regional scales
can be achieved by focusing only on the few, largest
lianas.
Across our sites, large lianas depend on large trees
to support them and provide access to high light en-
vironments. Results of partial correlation and regres-
sion analyses suggest that the relative dominance of
large lianas is substantially determined by the large
tree resour ce available (cf., Hegar ty and Caballe 1991).
There is weak evidence for an additional direct effectof soils, such that richer soils may favor a higher den-
sity of large lianas.
Dynamics
Large liana populations in southeastern Peru turn
over very quickly. A smaller, independent, and more-
or-less contemporaneous data set in northeastern Peru
shows a similar result. This suggests that in western
Amazonia, where tree populations are themselves dy-
namic by the standards of the tropical forest biome,
large liana populations are exceptionally dynamic. An-
nual recruitment and mortality rates average 6%, al-
most three times the equivalent rates of large trees with
which they share the canopy (Table 1). These hyper-
dynamic large lianas constitute a major fraction of the
turnover of canopy woody plants yet remain unrecord-ed by many forest monitoring efforts.
Liana infestation is associated with a greatly elevated
risk of death for large trees. However, observational
studies alone cannot disentangle cause and effect de-
finitively. In this case we do not yet know the extent
to which the association is merely coincidental (e.g.,
if trees that die are older and so have had longer for
infestation to occur) or actively causal (large lianas
shorten the life expectancy of host trees), or both. Oth-
ers have noted evidence for negative impacts of liana
infestation on growth and survival of trees (e.g., Clark
and Clark 1990, Perez-Salicrup 2001). Our results in-
dicate the potentially substantial impact of large lianas
on tree dynamics, and so on stand-level carbon balanceand flux rates. How can we square the positive depen-
dence of large lianas on large trees, on the one hand,
with the negative feedback on large liana populations
implied by the enhanced risk of death in liana-infested
large trees? Clearly there is dynamic tension between
the two effects, but that does not imply that one always
counterbalances the other, nor that any equilibrium
point cannot be shifted. Thus, recent work has shown
a secular increase in liana densities and productivity
in mature neotropical forests (Phillips et al. 2002,
Wright et al. 2004). And some dramatically different
stable states in moist tropical forests reflect how vital
liana–tree interactions can be to ecosystem processes.
For example, lianas may indefinitely arrest gap suc-cession (Schnitzer et al. 2000), and ‘‘liana forests,’’
characterized by a superabundance of small lianas and
an absence of large trees, are hyperdynamic commu-
nities with diminished carbon storage potential (Phil-
lips et al. 2002, Baker et al. 2004b). Liana–tree inter-
actions clearly have important emergent effects at stand
and regional scales, and there is an urgent need for
stand-level long-term experimental investigation to
disentangle the mechanisms by which they interact (cf.,
Perez-Salicrup and Barker 2000, Grauel and Putz
2004). Liana–tree interactions also represent a unique
challenge to ecosystem modelers that has yet to be
taken up.
Our results show predictability of liana behaviorfrom broader environmental parameters. Thus, large
liana throughput rates, tree aboveground net primary
productivity (ANPP), and soil fertility all covary. The
results are consistent with the direct effect of soil nu-
trient supply on tree ANPP across the neotropics (Malhi
et al. 2004). Soil effects on liana throughput may be
direct, or indirect via tree ANPP. There is also a sep-
arate relationship between tree ANPP and liana
throughput, independent of soil. In the gap-rich envi-
7/25/2019 Phillipsol12 - Lianas
http://slidepdf.com/reader/full/phillipsol12-lianas 9/10
May 2005 1257HYPERDYNAMIC LIANAS
FIG . 5. Rate of large liana throughput (equals sum of largeliana stems recruiting and dying annually per hectare) as afunction of tree aboveground net primary productivity(ANPP; Mg C·ha1·yr1). (a) Amazonian southeastern Peru;(b) western Amazonia.
ronment of productive, high-turnover western Ama-
zonian forests, light-demanding tree taxa thrive (Baker
et al. 2004b) and so, apparently, do lianas. Since liana
infestation may accelerate the death of senescing trees,
there also exists some potential for positive feedback of liana dynamics on stand productivity. Regardless, a
consistent pattern emerges of relatively rich soils sup-
porting forests with higher tree growth and high rates
of liana turnover.
Based on the plots monitored thus far, the relation-
ship of liana throughput to tree productivity appears to
be steep (Fig. 5): large lianas recruit and die about twice
as fast in forests with ANPP of 12 Mg C·ha1·yr1
compared to forests with ANPP of 8 Mg C·ha1·yr1.
Extrapolation implies that in forests much below the
minimum ANPP in our data set there may be very little
large liana activity. This would be consistent with the
known rapid drop-off in large liana density (and pre-
sumably dynamics) with increasing elevation in thetropics (Gentry 1991) and with latitudinal gradients in
large liana density from the tropics to subtropics/warm
temperate zone (Gentry 1991). Forests of western Ama-
zonia are unusually productive by continental and glob-
al standards (Malhi et al. 2004). Large liana turnover
data are still lacking for central and eastern Amazonia,
but on the basis of the modeled relationship we predict
that less productive forests in the highly weathered
oxisols and spodosols of parts of eastern and northern
Amazonia, where ANPP is typically 4.5–7 Mg
C·ha1·yr1, will turn out to have much slower through-
put of large lianas. The same may be true for pluvial
tropical forests, such as t he Choco in wester n Colombia
or the windward slopes of Hawaii, where productivity
may be suppressed by excessive rainfall and/or reduced
insolation (cf., Schuur 2003).Conversely, substituting space for time, the steep
relationship between large liana throughput and stand
ANPP suggests that small increases in productivity
could have disproportionate impacts on large liana dy-
namics. The unweighted average tree ANPP across 104
neotropical forests is 9.1 Mg C·ha1·yr1 (Malhi et al.
2004); we would anticipate that a 10% increase in tree
productivity will engender an 20% increase in the
number of large lianas recruiting and dying. This pro-
jection is crude but it might help explain how large
liana densities and growth rates appear to have in-
creased in Amazonia faster than recent increases in tree
productivity (Phillips et al. 2002, Lewis et al. 2004 b),
and faster than even the marked, direct response of lianas to elevated carbon dioxide would suggest (Gra-
nados and Korner 2002).
ACKNOWLEDGMENTS
Many people contributed. We thank in particular the lateAlwyn Gentry for sharing his love for and fascination withlianas. He also initiated the plot network in Peru. AntonioPena Cru z and Peggy Stern parti cipated in several recensusingcampaigns, and Sandra Patino, Jim Martin, Viviana Horna,and Willy Palomino assisted with structural inventories. Je-rome Chave, Stephan Schnitzer, and Saara DeWalt kindlymade available their unpublished liana allometric model.Comments from Naomi Cappuccino, Jacob Nabe-Nielsen,and Gerardo Avalos improved the paper. INRENA, Inkaterra,Explorama Tours, IIAP, Peruvian Safaris, UNAP, and UN-
SAAC helped make this work possible. Fieldwork was fundedby the American Philosophical Society, WWF-US/GardenClub of America, Conservation International, the MacArthurand Mellon Foundations, NGS (5472-95, 6387-00, 7401-03),NSF (BSR-9001051), NERC (Fellowship to OP), and the Eu-ropean Union.
LITERATURE CITED
Appanah, S., and F. E. Putz. 1984. Climber abundance invirgin dipterocarp forest and the effect of pre-felling climb-er cutting on logging damage. Malaysian Forester 47 :335–342.
Baker, T., et al. 2004a. Increasing biomass in Amazonianforest plots. Philosophical Transactions of the Royal So-ciety, Series B 359:353–365.
Baker, T., et al. 2004b. Variation in wood density determinesspatial patterns in Amazonian forest biomass. Global
Change Biology 10:545–562.Ballee, W., and D. G. Campbell. 1990. Evidence for the suc-
cessional status of liana forest (Xingu river basin, Ama-zonian Brazil). Biotropica 22:36–47.
Belsey, D. A., E. Kuh, and R. E. Welsch. 1980. Regressiondiagnostics: identifying influential data and sources of col-linearity. John Wiley and Sons , New York, New York, USA.
Burnham, R. J. 2004. Alpha and beta diversity of lianas inYasunı National Park, Ecuador. Forest Ecology and Man-agement 190:43–55.
Clark, D. B., and D. A. Clark. 1990. Distribution and effectson tree growth of lianas and woody hemiepiphytes in a
7/25/2019 Phillipsol12 - Lianas
http://slidepdf.com/reader/full/phillipsol12-lianas 10/10
1258 OLIVER L. PHILLIPS ET AL. Ecology, Vol. 86, No. 5
Costa Rican tropical wet forest. Journal of Tropical Ecology6:321–331.
Darwin, C. 1867. On the movements and habits of climbingplants. Journal of the Linnean Society (Botany) 9:1–118.
Gentry, A. H. 1991. The distribution and evolution of climb-ing plants. Pages 3–49 in F. E. Putz and H. A. Mooney,editors. The biology of vines. Cambridge University Press,Cambridge, UK.
Gerwing, J. J., and D. L. Farias. 2000. Integrating liana abun-dance and forest stature into an estimate of total above-ground biomass for an eastern Amazonian forest. Journalof Tropical Ecology 16:327–335.
Granados, J., and C. Korner. 2002. In deep shade, elevatedCO2 increases the vigour of tropical climbing plants. GlobalChange Biology 8:1109–1117.
Grauel, W. T., and F. E. Putz. 2004. Effects of lianas ongrowth and regeneration of Prioria copaifera in Darien,Panama. Forest Ecology and Management 190:99–108.
Hegarty, E. E., and G. Caballe. 1991. Distributio n and abun-dance in forest communities. Pages 313–335 in F. E. Putzand H. A. Mooney, editors. The biology of vines. Cam-bridge University Press, Cambridge, UK.
Lewis, S. L., et al. 2004a. Tropical forest tree mortality,recruitment and turnover rates: calculation, interpretation,and comparison when census intervals vary. Journal of
Ecology 92:929–944.Lewis, S. L., et al. 2004b. Concerted changes in tropical
forest structure and dynamics: evidence from 50 SouthAmerican long-term plots. Philosophical Transactions of the Royal Society, Series B 359:421–436.
Malhi, Y., et al. 2004. The above-ground wood productivityand net primary productivity of 100 neotropical forests.Global Change Biology 10:1–29.
Perez-Salicrup, D. R. 2001. Effect of liana cutting on treeregeneration in a liana forest in Amazonian Bolivia. Ecol-ogy 82:389–396.
Perez-Salicrup, D. R., and M. G. Barker. 2000. Effect of lianacutting on water potential and growth of adult Senna mul-tijuga (Caesalpinioideae) trees in a Bolivian tropical forest.Oecologia 124:469–475.
Perez-Salicrup, D. R., A. Claros, R. Guzman, J. Licona, F.Ledezma, M. Pinard, and F. Putz. 2001. Cost and efficiency
of cutting lianas in a lowland liana forest of Bolivia. Bio-tropica 33:324–329.
Phillips, O. L., and A. H. Gentry. 1994. Increasing turnoverthrough time in tropical forests. Science 263:954–957.
Phillips, O. L., P. Hall, A. Gentr y, S. Sawyer, and R. Vasquez.1994. Dynamics and species richness of tropical forests.Proceedings of the National Academy of Sciences, USA91:2805–2809.
Phillips, O. L., et al. 2002. Increasing dominance of largelianas in Amazonian forests. Nature 418:770–774.
Phillips, O. L., R. Vasquez Martınez, P. Nunez Vargas, A.Lorenzo Mont eagudo, M. Chuspe Zans , W. Galiano San-chez, A. Pen a Cruz, M. Timan a, M. Yli- Hall a, and S. Ro se.2003. Efficient plot-based floristic assessment of tropicalforests. Journal of Tropical Ecology 19:629–645.
Phillips, O. L., et al. 2004. Pattern and process in Amazonforest dynamics, 1976–2001. Philosophical Transactions of the Royal Society, Series B 359:381–407.
Putz, F. E. 1984a. The natural history of lianas on BarroColorado Island, Panama. Ecology 65:1713–1724.
Putz, F. E. 1984b. How trees avoid and shed lianas. Biotropica16:19–23.
Schnitzer, S. A., and F. Bongers. 2002. The ecology of lianasand their role in forests. Trends in Ecology and Evolution17:223–230.
Schnitzer, S. A., J. W. Dalling, and W. P. Carson. 2000. Theimpact of lianas on tree regeneration in tropical forest can-opy gaps: evidence for an alternative pathway of gap-phaseregeneration. Journal of Ecology 88:655–666.
Schuur, E. A. G. 2003. Productivity and global climate re-visited: the sensitivity of tropical forest growth to precip-itation. Ecology 84:1165–1170.
Sheil, D., and R. M. May. 1996. Mortality and recruitmentrate evaluations in heterogeneous tropical forests. Journalof Ecology 84:91–100.
Stevens, G. C. 1987. Lianas as structural parasites: the Bur-
sera simaruba example. Ecology 68:77–81.Wright, S. J., O. Cald eron , A. Hernandez, and S. Paton. 2004 .
Are lianas increasing in importance in tropical forests? A16-year record from Barro Colorado Islan d, Panama. Ecol-ogy 85:485–489.
APPENDIX A
A table describing the structure of western Amazonian forests is available in ESA’s Electronic Data Archive: Ecological Archives E086-069-A1.
APPENDIX B
Principal components analysis of soil chemical and physical properties, for all sites with structural information, is availablein ESA’s Electronic Data Archive: Ecological Archives E086-069-A2.
APPENDIX C
Principal components analysis of soil chemical and physical properties, for those sites with dynamic information, is available
in ESA’s Electronic Data Archive: Ecological Archives E086-069-A3.