Embed Size (px)
Citation preview
November 2013
China’s Leading New Media Platform:
Where Internet, Mobile and TV Truly Converge
Phoenix New Media (NYSE: FENG)
2
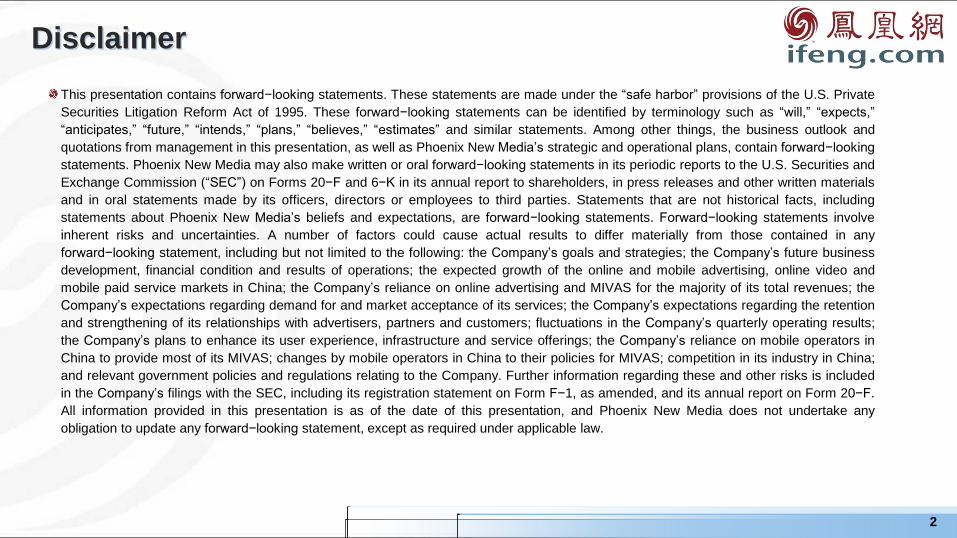
Disclaimer
This presentation contains forward−looking statements. These statements are made under the “safe harbor” provisions of the U.S. Private
Securities Litigation Reform Act of 1995. These forward−looking statements can be identified by terminology such as “will,” “expects,”
“anticipates,” “future,” “intends,” “plans,” “believes,” “estimates” and similar statements. Among other things, the business outlook and
quotations from management in this presentation, as well as Phoenix New Media’s strategic and operational plans, contain forward−looking
statements. Phoenix New Media may also make written or oral forward−looking statements in its periodic reports to the U.S. Securities and
Exchange Commission (“SEC”) on Forms 20−F and 6−K in its annual report to shareholders, in press releases and other written materials
and in oral statements made by its officers, directors or employees to third parties. Statements that are not historical facts, including
statements about Phoenix New Media’s beliefs and expectations, are forward−looking statements. Forward−looking statements involve
inherent risks and uncertainties. A number of factors could cause actual results to differ materially from those contained in any
forward−looking statement, including but not limited to the following: the Company’s goals and strategies; the Company’s future business
development, financial condition and results of operations; the expected growth of the online and mobile advertising, online video and
mobile paid service markets in China; the Company’s reliance on online advertising and MIVAS for the majority of its total revenues; the
Company’s expectations regarding demand for and market acceptance of its services; the Company’s expectations regarding the retention
and strengthening of its relationships with advertisers, partners and customers; fluctuations in the Company’s quarterly operating results;
the Company’s plans to enhance its user experience, infrastructure and service offerings; the Company’s reliance on mobile operators in
China to provide most of its MIVAS; changes by mobile operators in China to their policies for MIVAS; competition in its industry in China;
and relevant government policies and regulations relating to the Company. Further information regarding these and other risks is included
in the Company’s filings with the SEC, including its registration statement on Form F−1, as amended, and its annual report on Form 20−F.
All information provided in this presentation is as of the date of this presentation, and Phoenix New Media does not undertake any
obligation to update any forward−looking statement, except as required under applicable law.

3
Company Snapshot
Exchange / Ticker NYSE: FENG
Market Cap US$ 800M
Price US$10.36
Weighted Avg. ADS
Outstanding 77.2M
Analysts Coverage
Morgan Stanley - Gillian Chung
Deutsche Bank - Alan Hellawell
Macquarie Group - Jiong Shao
J.P.Morgan - Alex Yao
CICC - Haofei Chen
*As of November 15, 2013

4
China’s Leading New Media Platform: Where Internet, Mobile and TV Truly Converge
Notes
1. iResearch’s iUserTracker ranking for September 2013
2. Operating statistics in September 2013 (company data)
#1-ranked news channel by daily unique
visitors(1)
#7-ranked Chinese website by monthly unique
visitor(1)
#7-ranked Chinese website by daily time
spent(1)
#5-ranked Chinese website by daily page view(1)
22M + daily mobile unique visitors (2)
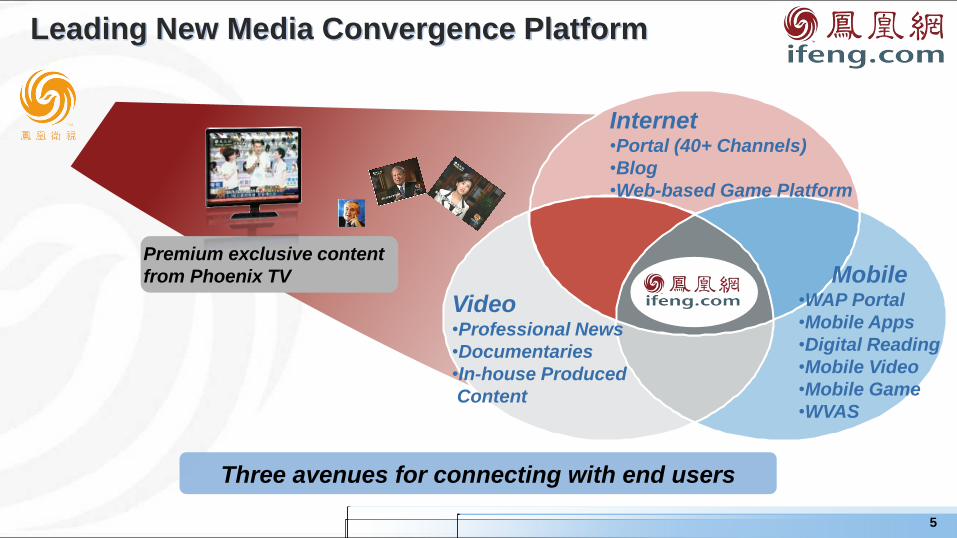
Leading New Media Convergence Platform
5
Internet •Portal (40+ Channels)
•Blog
•Web-based Game Platform
Mobile •WAP Portal
•Mobile Apps
•Digital Reading
•Mobile Video
•Mobile Game
•WVAS
Video •Professional News
•Documentaries
•In-house Produced
Content
Premium exclusive content
from Phoenix TV
Three avenues for connecting with end users

6
1998 2005 2006 2007 2009 2010 2011
Phoenix TV founded- a
Leading Chinese
Language TV Network
2nd largest shareholder of
Phoenix TV VC investors
2008
Unique Roots
IPO on NYSE:
May 12, 2011
1996
“New Media” subsidiary
established
Spin-off and established
converged tech platform

7
Preferred Media Destination for Mainstream
Internet Users
#2 home page Daily Unique Visitor(1) among all Chinese media
websites.
Source: iResearch data
ifeng strong media DNA from PTV
Diverse and Premium
Content Editing and Production
Capability
3rd party content Phoenix TV
content
In-house
produced
content
UGC
Higher user demographic with better education, higher income and
more mature.
Daily UV: 20% Increase YoY
Monthly UV: 267 million
Source: iResearch / iUserTracker
Traffic Growth on ifeng.com
32.6
39.2
259 267
200
300
0
10
20
30
40
2012Q3 2013Q3
Daily UV Monthly UV
(Millions)

8
Differentiated & Profitable Online Video Strategy
Online Video
Professional News & short-form video clips
Phoenix TV + Differentiated 3rd party video
Unique and differentiated in-house productions
Low content and bandwidth cost
Highly suitable for mobile consumption
High ad frequency
Mobile Video
Source: iResearch / iUserTracker
#8-ranked Chinese online video website
by Daily Unique Visitor.
9 Source: Company data
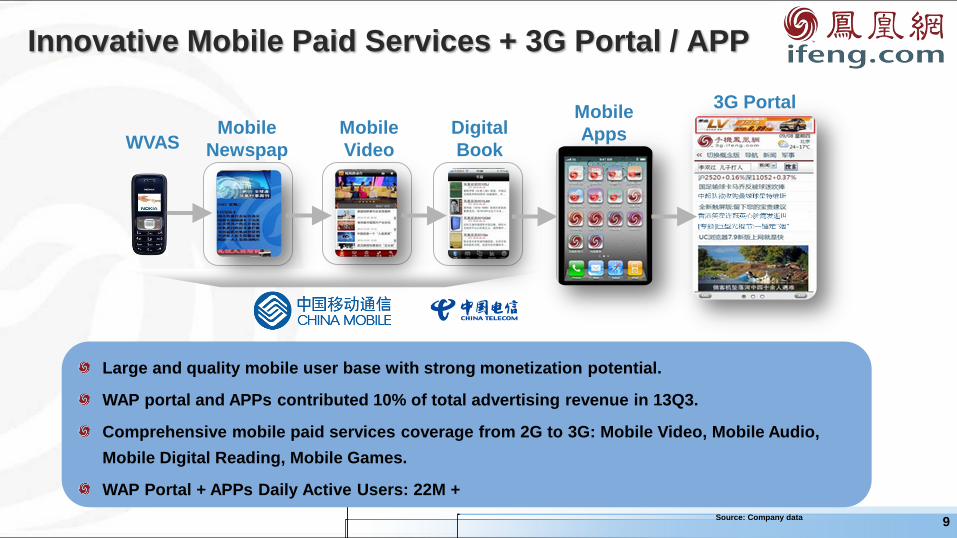
Innovative Mobile Paid Services + 3G Portal / APP
Mobile
Video
Digital
Book
Mobile
Newspap
er
WVAS
Mobile
Apps
3G Portal
Large and quality mobile user base with strong monetization potential.
WAP portal and APPs contributed 10% of total advertising revenue in 13Q3.
Comprehensive mobile paid services coverage from 2G to 3G: Mobile Video, Mobile Audio,
Mobile Digital Reading, Mobile Games.
WAP Portal + APPs Daily Active Users: 22M +
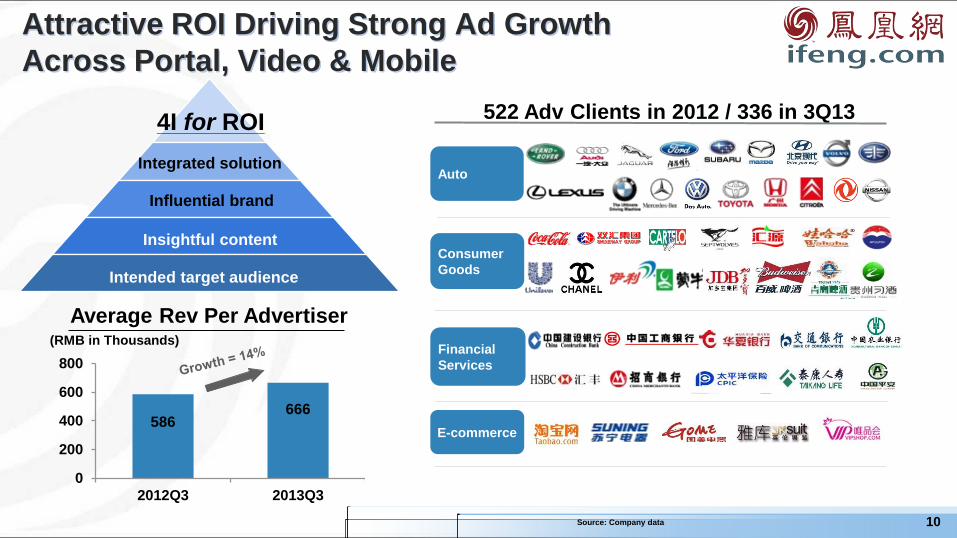
Consumer
Goods
Auto
522 Adv Clients in 2012 / 336 in 3Q13
Financial
Services
E-commerce
10
Attractive ROI Driving Strong Ad Growth
Across Portal, Video & Mobile
Source: Company data
Average Rev Per Advertiser
586 666
0
200
400
600
800
2012Q3 2013Q3
(RMB in Thousands)
4I for ROI
Intended target audience
Insightful content
Integrated solution
Influential brand
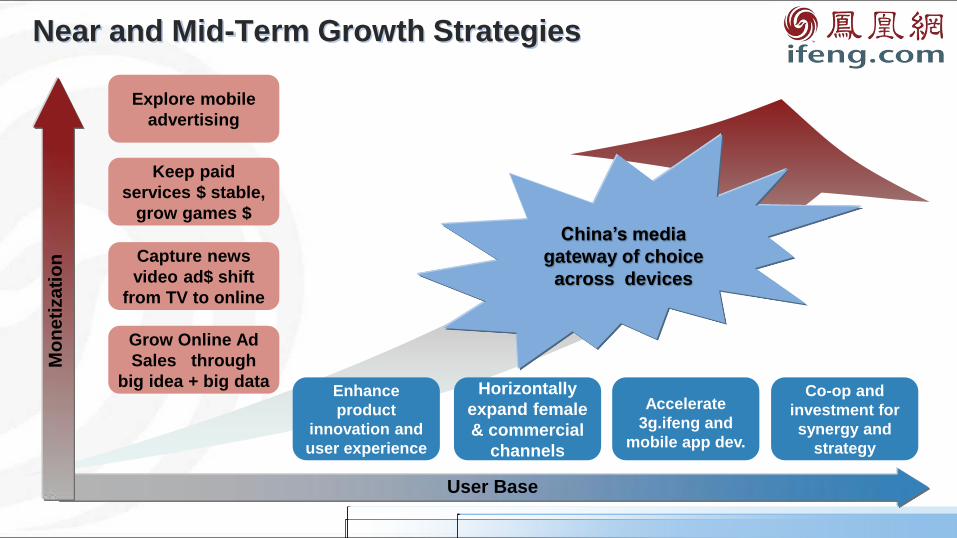
Near and Mid-Term Growth Strategies
Co-op and
investment for
synergy and
strategy
Grow Online Ad
Sales through
big idea + big data
Keep paid
services $ stable,
grow games $
Explore mobile
advertising
User Base
Mo
neti
zati
on
China’s media
gateway of choice
across devices
Capture news
video ad$ shift
from TV to online
Horizontally
expand female
& commercial
channels
Enhance
product
innovation and
user experience
Accelerate
3g.ifeng and
mobile app dev.
Financial Overview
13
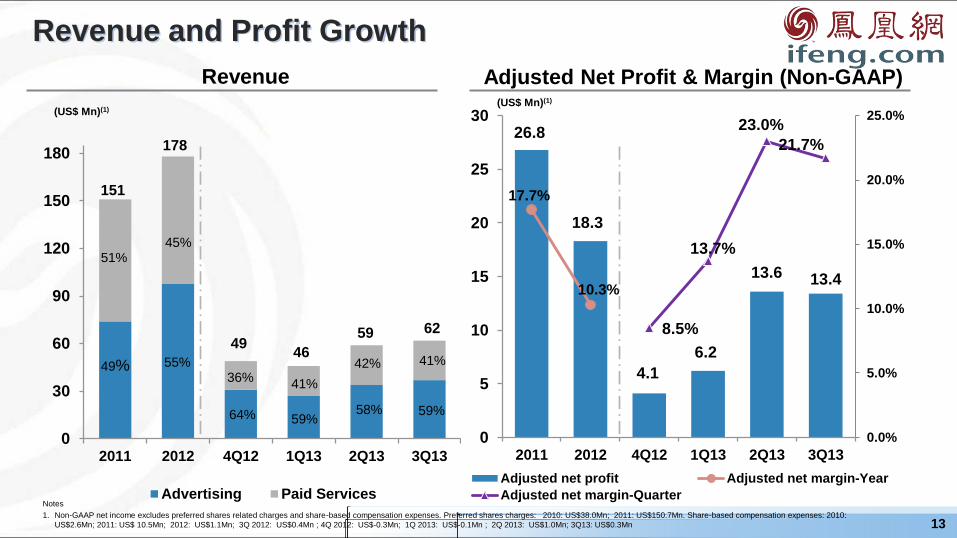
Revenue
Revenue and Profit Growth
0
30
60
90
120
150
180
2011 2012 4Q12 1Q13 2Q13 3Q13
Advertising Paid Services
59%
41%
58%
42% 41%
59%
151
178
49 46
59 62
(US$ Mn)(1)
26.8
18.3
4.1
6.2
13.6 13.4
17.7%
10.3%
8.5%
13.7%
23.0%
21.7%
0.0%
5.0%
10.0%
15.0%
20.0%
25.0%
0
5
10
15
20
25
30
2011 2012 4Q12 1Q13 2Q13 3Q13
Adjusted net profit Adjusted net margin-Year
Adjusted net margin-Quarter
Adjusted Net Profit & Margin (Non-GAAP)
Notes
1. Non-GAAP net income excludes preferred shares related charges and share-based compensation expenses. Preferred shares charges: 2010: US$38.0Mn; 2011: US$150.7Mn. Share-based compensation expenses: 2010:
US$2.6Mn; 2011: US$ 10.5Mn; 2012: US$1.1Mn; 3Q 2012: US$0.4Mn ; 4Q 2012: US$-0.3Mn; 1Q 2013: US$-0.1Mn ; 2Q 2013: US$1.0Mn; 3Q13: US$0.3Mn
(US$ Mn)(1)
49%
51%
55%
45%
36%
64%

14
Cost of Revenues and Operating Expenses
Notes
1. Excludes share-based compensation expenses: 2010: US$2.6Mn; 2011: US$7.6Mn; 2012: US$1.1Mn; 3Q 2012: US$0.4Mn ; 4Q 2012: US$-0.3Mn ; 1Q 2013: US$-0.1Mn ; 2Q 2013: US$1.0Mn; 3Q13: US$ 0.3 Mn
Cost of Revenues Breakdown
(Non-GAAP) (1)
30.1%
23.7%
15.6% 17.6%
18.7% 20.1%
16.0%
20.4%
24.6%
20.1%
17.1%
19.4%
3.9% 6.1% 6.3% 6.6%
5.6% 4.8%
6.3% 6.5% 8.5%
6.7% 5.8% 6.4%
0%
5%
10%
15%
20%
25%
30%
35%
2011 2012 4Q12 1Q13 2Q13 3Q13
Revenue Sharing Fees Content and Operational CostsBandwidth Costs Sales Tax and Surcharges
As a % of Revenues
15.3%
17.6%
22.1%
19.5%
17.3% 17.2%
6.3%
9.2% 9.4% 9.4%
7.4%
4.7%
6.1%
8.2% 8.0% 9.1%
7.1% 7.1%
0%
5%
10%
15%
20%
25%
2011 2012 4Q12 1Q13 2Q13 3Q13
S&M G&A R&D
Operating Expenses Breakdown
(Non-GAAP) (1)
As a % of Revenues

15
Key Investment Highlights
Famous and Influential Media Brand
Multiple High-growth Revenue Streams
Robust and Scalable Technology
Highly Attractive and Fast Growing User Base
Leading Internet, Mobile and TV Convergence Platform
Exclusive and Proprietary Content

16
Appendix
17
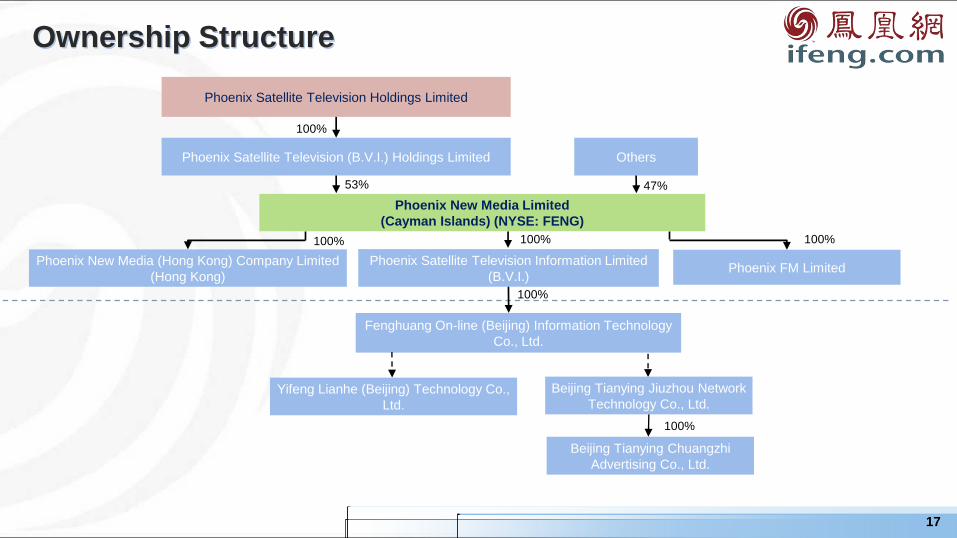
Ownership Structure
Phoenix Satellite Television Holdings Limited
Phoenix Satellite Television (B.V.I.) Holdings Limited
100%
53%
Phoenix New Media Limited
(Cayman Islands) (NYSE: FENG)
100%
47%
Others
Fenghuang On-line (Beijing) Information Technology
Co., Ltd.
100%
Yifeng Lianhe (Beijing) Technology Co.,
Ltd.
Beijing Tianying Jiuzhou Network
Technology Co., Ltd.
100%
Beijing Tianying Chuangzhi
Advertising Co., Ltd.
Phoenix Satellite Television Information Limited
(B.V.I.)
Phoenix New Media (Hong Kong) Company Limited
(Hong Kong)
100%
Phoenix FM Limited
100%

18
Education
Years of
Experience
Selected
Experience
Phoenix TV
Shuang Liu
CEO
J.D., Duke Law School
B.A., University of
International Business &
Economics, Beijing
12+ (media industry)
Ya Li
COO
Executive Management
Education, Wharton School
of Business
Univ of Sci & Tech of China
18+ (Internet industry and
entrepreneurship)
Management Team
Betty Ho
CFO
B.C.in Finance from the
University of Toronto
AICPA and HKICPA
20+ (Internet industry, TMT,
and consumer retail)
Ling Jin
EVP
EMBA, Cheung Kong
Graduate School of
Business
10+ (Internet industry,
advertising industry)
19
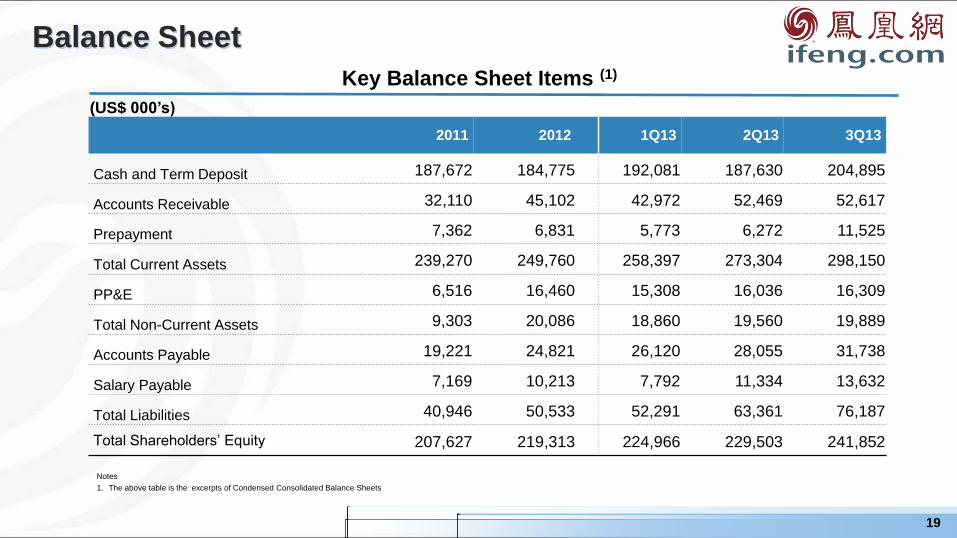
Balance Sheet
2011 2012 1Q13 2Q13 3Q13
Cash and Term Deposit 187,672 184,775 192,081 187,630 204,895
Accounts Receivable 32,110 45,102 42,972 52,469 52,617
Prepayment 7,362 6,831 5,773 6,272 11,525
Total Current Assets 239,270 249,760 258,397 273,304 298,150
PP&E 6,516 16,460 15,308 16,036 16,309
Total Non-Current Assets 9,303 20,086 18,860 19,560 19,889
Accounts Payable 19,221 24,821 26,120 28,055 31,738
Salary Payable 7,169 10,213 7,792 11,334 13,632
Total Liabilities 40,946 50,533 52,291 63,361 76,187
Total Shareholders’ Equity 207,627 219,313 224,966 229,503 241,852
(US$ 000’s)
Key Balance Sheet Items (1)
Notes
1. The above table is the excerpts of Condensed Consolidated Balance Sheets

20
Key Contacts
IR Team Matthew Zhao
Jessie Li
E-mail: [email protected]
Website: ir.ifeng.com
IR Consultant Jeremy Peruski / ICR
US Investor Hotline: +1 (646) 405-4883


![Phoenix, revista de insolven] - unpirct.ro › media › pdf › phoenix › revista4.pdf · Phoenix, aprilie-iunie 2003 cyan magenta black cyan magenta black Raportul prezentat de](https://img.pdfslide.net/doc/110x75/5f287685e069ec7a7357e9e6/phoenix-revista-de-insolven-a-media-a-pdf-a-phoenix-a-revista4pdf.jpg)