Embed Size (px)
Citation preview
ORIGINAL ARTICLE
Phosphorus dynamics and phosphatase activity of soilsunder corn production with supplemental irrigationin humid coastal plain region, USA
Gilbert C. Sigua . Kenneth C. Stone . Philip J. Bauer . Ariel A. Szogi
Received: 3 March 2017 / Accepted: 24 September 2017 / Published online: 27 September 2017
� Springer Science+Business Media B.V. 2017
Abstract A 3-year (2013–2015) field study was
conducted to evaluate the effect of integrated nutrient
management (NM) and three irrigation scheduling
methods (IS): irrigator pro (IPro); normalized differ-
ence vegetative index (NDVI) and soil water poten-
tials (SWP) on phosphorus (P) dynamics and
phosphatase activity in four Coastal Plains soil types
(ST) at various growth stages (CS: V6, six leaves;
V16, sixteen leaves; and R1, silking) of corn (Zea
mays L.). Nitrogen fertilizer was applied at two rates:
157 and 224 kg ha-1 through the irrigation system in
three applications. Phosphorus dynamics and phos-
phatase activity varied significantly (p B 0.0001) with
year (Y), CS and ST, but not with NM. Phosphorus
uptake of corn had an increase of about 1200% from
V6 to R1. Both the Mehlich extractable P and water
soluble P showed declining trends from V6 to R1.
Concentration of P in pore water differed significantly
(p B 0.05) with IS in 2014 and 2015, but not in 2013.
The order of the concentrations of P in pore water
(averaged across ST) as affected by IS is as follows:
2013 (IPro = NDVI = SWP); 2014 (SWP =
IPro\NDVI); and 2015 (IPro\NDVI\ SWP).
Concentration of phosphatase among the different
ST was affected by CS, from V6 to R1 and soil depth,
but not with NM. The difference in phosphatase
concentration between the upper and lower soil
horizons (averaged across Y and ST) was about
67.7 lg g-1 h-1. Our results have significant impli-
cation on P mobility, availability and management in
areas where inputs of P in fertilizers may have had
exceeded P output in harvested crops. Our results
further suggest that understanding of P inputs and
outputs which include P accumulation in soils and
plants, as well as P losses is critical to determining the
environmental balance and accountability of P in
agricultural ecosystem. It is imperative to have a
holistic understanding of P dynamics from soil to plant
by optimizing P management and improving P-use
efficiency.
Keywords Phosphorus � Phosphatase activity �Coastal plain region � Corn � Irrigation scheduling �Soil types � Silking � Nutrient use efficiency � Water
use efficiency
Disclaimer: Mention of a specific product or vendor does not
constitute a guarantee or warranty of the product by the USDA
or imply its approval to the exclusion of other products by the
USDA or imply it approval to the exclusion of other products
that may be suitable.
G. C. Sigua (&) � K. C. Stone � P. J. Bauer � A. A. Szogi
United States Department of Agriculture, Agricultural
Research Services, Coastal Plains Soils, Water and Plant
Research Center, 2611 West Lucas Street, Florence,
SC 29501, USA
e-mail: [email protected]
123
Nutr Cycl Agroecosyst (2017) 109:249–267
DOI 10.1007/s10705-017-9882-6
Introduction
Soil P exists in various chemical forms including both
inorganic P and organic P. These P forms differ in their
behavior and chemical fate in soils (Hansen et al.
2004; Turner et al. 2007). Phosphorus dynamics in the
soil–plant system is a function of the integrative
effects of P transformation, availability and utilization
caused by soil, rhizosphere and plant processes (Shen
et al. 2011). Critical to determining environmental
balance and accountability is an understanding of P
inputs and outputs in agricultural ecosystem which
include among others, P accumulation by plants and P
losses. Phosphorus losses from soils by both leaching
and runoff results in inefficient utilization of P
fertilizer and increased risk of eutrophication of rivers
and estuaries (Berkheiser et al. 1980; Enfield and Ellis
1983; Sigua et al. 2005). Further research effort on
simultaneous intensification of crop production and
water quality protection with supplemental irrigation
is therefore warranted.
Irrigation management for corn (Zea mays L.)
production in the southeastern Coastal Plain region of
USA is difficult because of the highly variable climate
along with typical low water holding capacity and low
fertility of the soils. Despite of the variety of methods
and tools developed to schedule irrigation, farmer
adoption of irrigation scheduling technique is still
limited because variability of rainfall is often difficult
to adequately accommodate in the planning of irriga-
tion calendar (Stone et al. 2015, 2016). However,
water shortage often causes nutrient deficiency par-
ticularly P (Clarke et al. 1990; Recio et al. 1999;
Haefele et al. 2006). Therefore, integrated effect of P
fertilization and irrigation scheduling may improve
the nutrient uptake increase in grain weight and yield
of cereal crops (Hossain et al. 1996; Turk and Tawaha
2002; Yousaf et al. 2014). Future climate change could
have the potential to significantly alter the conditions
for crop production, with important implications of
irrigation management for worldwide food security
(Rosenzweig and Hillel 1998; Afandi et al. 2010).
Phosphorus plays an important function in plant
physiology of most cereal crops including corn. It
strengthens the straw and increase formation and fruit
production. However, when it is applied to soil, it may
become fixed and a limiting factor to crop growth and
productivity (Mandal and Khan 1972). With increas-
ing demand of agricultural production due to global
increase of population in the next decade, P is
receiving more attention as a nonrenewable resource
(Cordell et al. 2009; Gilbert 2009). One aspect of P
dynamics that is very seldom mentioned is the role of
phosphatase enzyme in the soils. Phosphatase activity
is strongly regulated by P addition to the soil and it is
possible that production of phosphatase may also play
important role in the regulation of P supply to plants
(Olander and Vitosek 2000). Although phosphatase
activity has been extensively studied in soils as shown
by some reviews (Malcom 1983; Tabatabai 1994),
very limited information is available on how irrigation
and other agricultural management were affecting its
functionality in the soils. Phosphatase enzyme cat-
alyzes the hydrolysis of ester-phosphate bonds, lead-
ing to the release of phosphate, which can be taken up
by plants or microorganism (Nannipieri et al. 2011).
There have been fewer investigations concerning
ecological agriculture and enzyme activity. Enzyme
activity is also influenced by plants because they have
been shown to stimulate the activity of enzymes in the
rhizosphere and can be higher activity in planted than
in unplanted soils. On the other hand, there are also
some inhibitors of enzyme activity. The claim that
phosphatase activity can be depressed by phosphate
fertilizers and N fertilizers with similar effect on
enzymes involved in the nitrogen cycle and these
nutrients may warrant additional investigation.
Application of commercial P fertilizers to agricul-
tural land in the past decades have improved soil P
fertility and crop yields, but also contributed to P
pollution in waterways (Shigaki et al. 2006; Sigua
et al. 2011). The rate at which soil P accumulates in
terrestrial ecosystem especially under irrigation sys-
tem is still uncertain, as are the mechanisms respon-
sible for the current P sink and/or source (Sigua et al.
2009, 2011). Aiming at reducing consumption of
chemical P fertilizer, it is imperative to have a holistic
understanding of P dynamics from soil to plant by
optimizing P management and improving P-use effi-
ciency. Additionally, the dynamics of applied P in
soils and its cycling in agroecosystems are of
increased interest due to its contribution to the current
environmental, agronomic and economic issues on
intensification of agricultural production (Sharpley
and Turnley 2000). Our objective for conducting this
study was to determine the effect of integrated nutrient
management and irrigation scheduling on P dynamics
and phosphatase activity of soils at various growth
250 Nutr Cycl Agroecosyst (2017) 109:249–267
123
stages (V6, V16 and R1) of corn (Zea mays L.)
production in humid southeastern Coastal Plain region
of United States.
Materials and methods
Site description
From 2013 to 2015, corn (Zea mays L.) was grown
under conservation tillage on a 6-ha site under a
variable-rate center pivot irrigation (VRI) system near
Florence, South Carolina. Each year, field preparation
started with an application of glyphosate herbicide to
control winter weeds. Field tillage at corn planting
consisted of in-row sub-soiling. Corn (Dekalb 66-97 in
2012, 2013 and 2014) was planted in 76 cm rows, with
a planting population of 79,000 seeds per hectare. The
planting dates for the 3 years were: 03/30/2013;
04/09/2014; and 04/04/2015. The corn field received
an annual lime application of 1.7 tons ha-1 in 2013
and 2014. Phosphorus and potassium fertilizers were
also applied in blanket application at the rate of
118 kg P2O5 ha-1 and 135 kg K2O ha-1 in 2013,
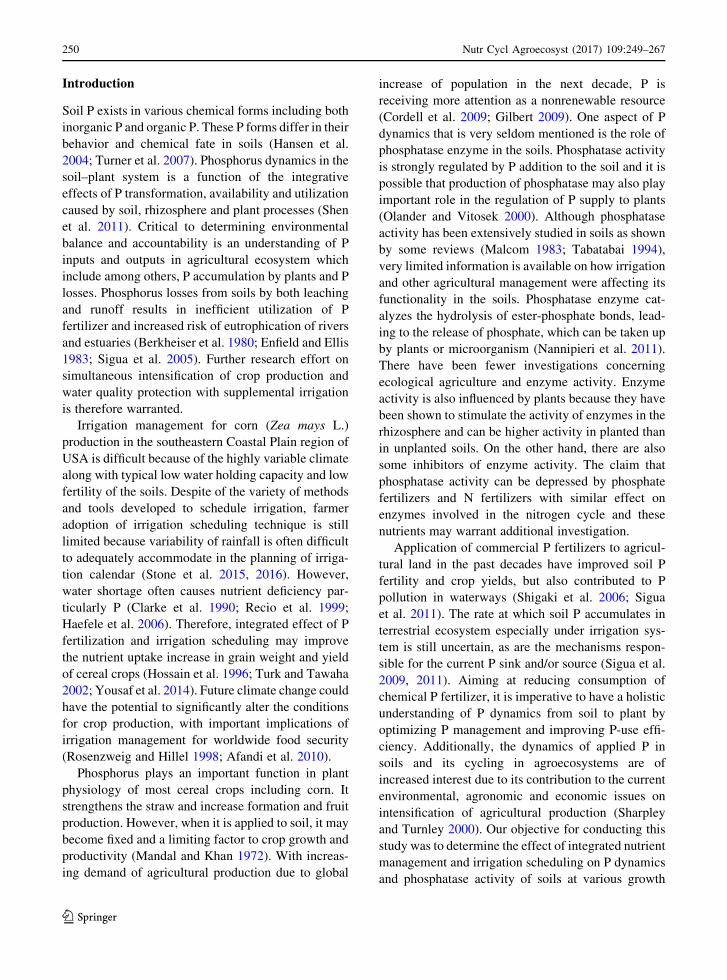
2014 and 2015, respectively. The monthly average
rainfall and the amount of irrigation application in the
study site during the growing season of corn from
2013 to 2015 are presented in Fig. 1.
Experimental treatments and experimental design
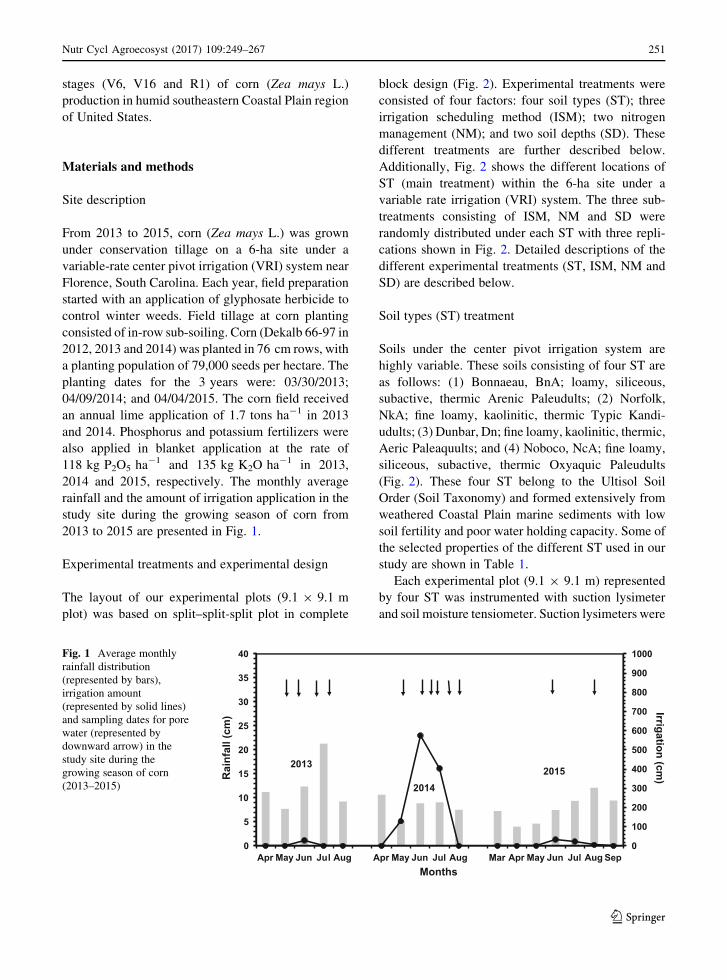
The layout of our experimental plots (9.1 9 9.1 m
plot) was based on split–split-split plot in complete
block design (Fig. 2). Experimental treatments were
consisted of four factors: four soil types (ST); three
irrigation scheduling method (ISM); two nitrogen
management (NM); and two soil depths (SD). These
different treatments are further described below.
Additionally, Fig. 2 shows the different locations of
ST (main treatment) within the 6-ha site under a
variable rate irrigation (VRI) system. The three sub-
treatments consisting of ISM, NM and SD were
randomly distributed under each ST with three repli-
cations shown in Fig. 2. Detailed descriptions of the
different experimental treatments (ST, ISM, NM and
SD) are described below.
Soil types (ST) treatment
Soils under the center pivot irrigation system are
highly variable. These soils consisting of four ST are
as follows: (1) Bonnaeau, BnA; loamy, siliceous,
subactive, thermic Arenic Paleudults; (2) Norfolk,
NkA; fine loamy, kaolinitic, thermic Typic Kandi-
udults; (3) Dunbar, Dn; fine loamy, kaolinitic, thermic,
Aeric Paleaquults; and (4) Noboco, NcA; fine loamy,
siliceous, subactive, thermic Oxyaquic Paleudults
(Fig. 2). These four ST belong to the Ultisol Soil
Order (Soil Taxonomy) and formed extensively from
weathered Coastal Plain marine sediments with low
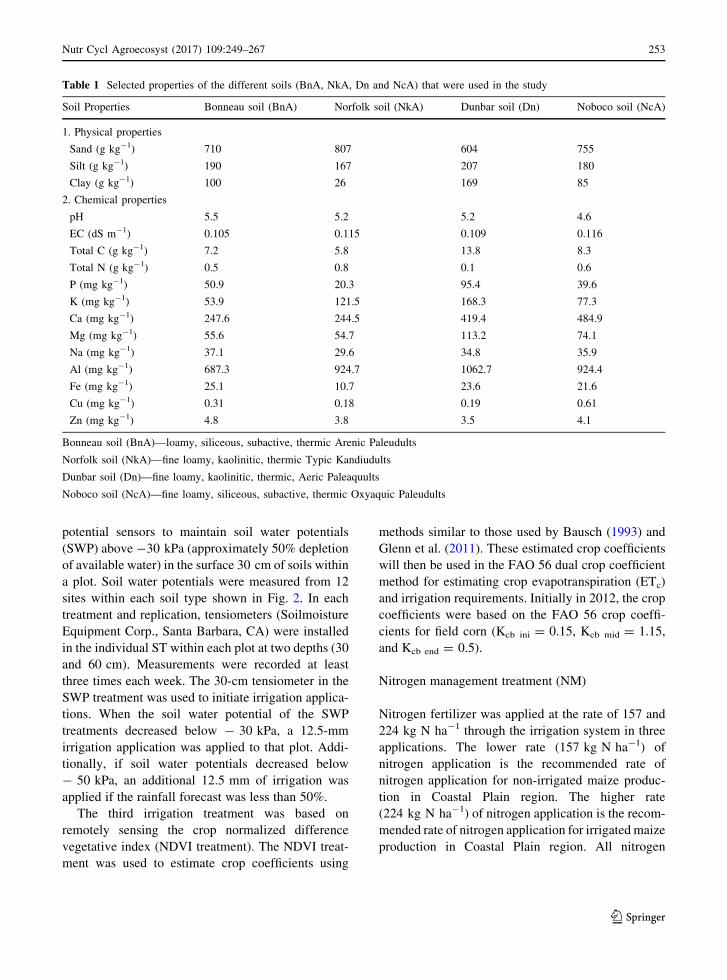
soil fertility and poor water holding capacity. Some of
the selected properties of the different ST used in our
study are shown in Table 1.
Each experimental plot (9.1 9 9.1 m) represented
by four ST was instrumented with suction lysimeter
and soil moisture tensiometer. Suction lysimeters were
0
100
200
300
400
500
600
700
800
900
1000
0
5
10
15
20
25
30
35
40
Apr May Jun Jul Aug Apr May Jun Jul Aug Mar Apr May Jun Jul AugSep
Irrigation (cm)R
ainf
all (
cm)
Months
2013
2014 2015
Fig. 1 Average monthly
rainfall distribution
(represented by bars),
irrigation amount
(represented by solid lines)
and sampling dates for pore
water (represented by
downward arrow) in the
study site during the
growing season of corn
(2013–2015)
Nutr Cycl Agroecosyst (2017) 109:249–267 251
123
installed at two depths (i.e., 30.5 and 91.4 cm) while
soil tensiometer were installed at 30 and 60 cm soil
depth. Additional descriptions on the installations of
suction lysimeter and soil tensiometer can be found in
early paper reported by Sigua et al. (2017).
Center-pivot irrigated system and irrigation
scheduling method (ISM) treatment
Irrigation was performed with a center pivot irrigation
system modified to permit variable application depths
to individual areas of about 9.1 9 9.1 m in size
(Omary et al. 1996). The center pivot length (137 m)
was divided into 13 segments, each 9.1 m in length.
Variable rate water applications were accomplished
by using three manifolds in each segment; each had
nozzles sized to deliver 19, 29, or 49 of a base
application depth at that location along the center
pivot length. A more detailed description of the water
delivery can be found in Omary et al. (1996), Stone
et al. (2015) and Sigua et al. (2017).
Three methods of irrigation scheduling treatments
were evaluated for our study. These three methods of
irrigation scheduling treatments were reported in early
paper of Sigua et al. (2017). Irrigation scheduling
methods under the center pivot irrigation system was
replicated three times and was randomly arranged on
every quadrant as shown in Fig. 2. The first irrigation
treatment was based on the Irrigator Pro for Corn
expert system (IPRO) that was developed by the
USDA-ARS-National Peanut Research Laboratory,
Dawson, GA. This expert system has been tested
extensively in uniformly irrigated fields (Davidson
et al. 1998a, b; Lamb et al. 2004, 2007). In this
research, IPRO for corn was implemented using
spatial management zones corresponding to variable
ST. Irrigator Pro uses soil texture and soil water
potential measurements to estimate the soil water
holding capacity in the root zone for water balance
calculations.
The second irrigation treatment (Soil Water Poten-
tial, SWP) treatment) was based on using soil water
Fig. 2 Plot map showing the different soil types included in the study and different irrigation scheduling methods under the pivot
irrigation system (Source: Sigua et al. 2016. Agric. Water Manage. 186:75–85)
252 Nutr Cycl Agroecosyst (2017) 109:249–267
123
potential sensors to maintain soil water potentials
(SWP) above -30 kPa (approximately 50% depletion
of available water) in the surface 30 cm of soils within
a plot. Soil water potentials were measured from 12
sites within each soil type shown in Fig. 2. In each
treatment and replication, tensiometers (Soilmoisture
Equipment Corp., Santa Barbara, CA) were installed
in the individual ST within each plot at two depths (30
and 60 cm). Measurements were recorded at least
three times each week. The 30-cm tensiometer in the
SWP treatment was used to initiate irrigation applica-
tions. When the soil water potential of the SWP
treatments decreased below - 30 kPa, a 12.5-mm
irrigation application was applied to that plot. Addi-
tionally, if soil water potentials decreased below
- 50 kPa, an additional 12.5 mm of irrigation was
applied if the rainfall forecast was less than 50%.
The third irrigation treatment was based on
remotely sensing the crop normalized difference
vegetative index (NDVI treatment). The NDVI treat-
ment was used to estimate crop coefficients using
methods similar to those used by Bausch (1993) and
Glenn et al. (2011). These estimated crop coefficients
will then be used in the FAO 56 dual crop coefficient
method for estimating crop evapotranspiration (ETc)
and irrigation requirements. Initially in 2012, the crop
coefficients were based on the FAO 56 crop coeffi-
cients for field corn (Kcb ini = 0.15, Kcb mid = 1.15,
and Kcb end = 0.5).
Nitrogen management treatment (NM)
Nitrogen fertilizer was applied at the rate of 157 and
224 kg N ha-1 through the irrigation system in three
applications. The lower rate (157 kg N ha-1) of
nitrogen application is the recommended rate of
nitrogen application for non-irrigated maize produc-
tion in Coastal Plain region. The higher rate
(224 kg N ha-1) of nitrogen application is the recom-
mended rate of nitrogen application for irrigated maize
production in Coastal Plain region. All nitrogen
Table 1 Selected properties of the different soils (BnA, NkA, Dn and NcA) that were used in the study
Soil Properties Bonneau soil (BnA) Norfolk soil (NkA) Dunbar soil (Dn) Noboco soil (NcA)
1. Physical properties
Sand (g kg-1) 710 807 604 755
Silt (g kg-1) 190 167 207 180
Clay (g kg-1) 100 26 169 85
2. Chemical properties
pH 5.5 5.2 5.2 4.6
EC (dS m-1) 0.105 0.115 0.109 0.116
Total C (g kg-1) 7.2 5.8 13.8 8.3
Total N (g kg-1) 0.5 0.8 0.1 0.6
P (mg kg-1) 50.9 20.3 95.4 39.6
K (mg kg-1) 53.9 121.5 168.3 77.3
Ca (mg kg-1) 247.6 244.5 419.4 484.9
Mg (mg kg-1) 55.6 54.7 113.2 74.1
Na (mg kg-1) 37.1 29.6 34.8 35.9
Al (mg kg-1) 687.3 924.7 1062.7 924.4
Fe (mg kg-1) 25.1 10.7 23.6 21.6
Cu (mg kg-1) 0.31 0.18 0.19 0.61
Zn (mg kg-1) 4.8 3.8 3.5 4.1
Bonneau soil (BnA)—loamy, siliceous, subactive, thermic Arenic Paleudults
Norfolk soil (NkA)—fine loamy, kaolinitic, thermic Typic Kandiudults
Dunbar soil (Dn)—fine loamy, kaolinitic, thermic, Aeric Paleaquults
Noboco soil (NcA)—fine loamy, siliceous, subactive, thermic Oxyaquic Paleudults
Nutr Cycl Agroecosyst (2017) 109:249–267 253
123
fertilizer, except pre-plant granular applications, was
applied via fertigation.
Collection of pore water
The two depths where pore water samples were
collected as samples become available were 30.5 and
91.4 cm, respectively. Pore water sample from the
suction lysimeter was collected from sampling sites
shown in Fig. 2 using a flask with two-hole rubber
stopper. One hole was directly connected to the plastic
tubing from the sampler and one hole was connected to
the hand vacuum pump. Stroking the hand pump
created vacuum within the flask which in turn
withdraws the sample up from the sampler and into
the collection bottle. Suction lysimeter were com-
pletely evacuated 1 day before the sampling process to
ensure that the water samples are fresh and accept-
able for chemical analysis. Figure 1 shows the differ-
ent sampling dates (shown by down arrows) for
leached or pore water in the study site during the
growing season of corn. Total number of pore water
samples collected in 3 years (2013–2015) from four
ST of BnA, NkA, Dn and NcA were 113, 97, 96 and
110, respectively.
Analyses of pore water samples
Pore water samples were transported to the laboratory
following collection and refrigerated at 4 �C. Water
samples were filtered using a 0.2 lm nylon filter and
were analyzed for total P using an Inductively Coupled
Plasma Spectroscopy (ICP).
Soil sampling and soil analysis
The different sampling locations represented by four
ST are shown in Fig. 2. Soil samples were collected at
0–15 and 15–30 cm during the three stages of corn
growth namely: V6: 6 leaves; V16: 16 leaves; and R1:
silking). A total of 576 soil samples (soil type = 4;
soil depth = 2; growth stage = 3; nutrient manage-
ment = 2; year = 3; replications = 4) were collected
from 2013 to 2015.
Soil samples were air-dried and passed through a
2-mm mesh sieve prior to extraction of soil P. Soil P
was extracted separately with deionized distilled water
(1:5 soil:DI) for water soluble concentration
of P (WSP) and with double acid
(0.025 N H2SO4 ? 0.05 N HCl; Mehlich 1953) for
the extractable concentration of P (MEP). These two
extracts were analyzed separately by Inductively
Coupled Plasma (ICP) spectroscopy. Soil samples
were also analyzed for the concentration of P enzyme
(acid phosphatase) following the procedures described
by Eivazi and Tabatabai (1977).
Plant sampling, phosphorus tissue analysis
and phosphorus uptake
Aboveground biomass of ten corn plants was collected
at three stages of corn growth (V6: 6 leaves; V16:16
leaves; R1: silking). Freshly cut aboveground biomass
was oven-dried at 60 �C for about 48 h. Aboveground
biomass was ground to pass through 1-mm mesh
screen in a Wiley mill. Ground samples were digested
in an auto-block using a mixture of nitric and peroxide
and were analyzed for tissue P concentration using an
ICP spectroscopy. Phosphorus uptake of corn at three
growth stages (i.e., V6, V16 and R1) was calculated
using Eq. 1 as shown below.
PUCS ¼ Concentration of Phosphorus, CPCS½ �� ABYCS ð1Þ
where PUCS, phosphorus uptake (kg ha-1) of corn at
various growth stages; CPCS, P concentration (%) of
corn tissues at various growth stages of corn; and
ABYCS, aboveground biomass (kg ha-1) of corn at
various growth stages of corn.
Data reduction and statistical analysis
Data (concentrations of P in plants, soils, pore water; P
uptake; phosphatase activity) were analyzed with a
five-way ANOVA using PROC GLM (SAS 2000).
The model included soil type (ST), irrigation schedul-
ing (IS), nutrient management (NM), soil depth (SD)
and growth stage (CS). The pooled data (2013–2015)
were tested initially for normality (SAS 2000). For this
study, F test indicated a significant (p B 0.0001) year
(Y) effect, so means of ST, IS, NM, SD and CS on
concentrations of P in pore water, soils, plants, P
uptake and phosphatase activity were separated
following the least significance difference (LSD) test
by year (SAS 2000).
Relationships of P uptake of corn and soils’ MEP
and WSP with growth stages of corn in four ST from
254 Nutr Cycl Agroecosyst (2017) 109:249–267
123
2013 to 2015 were determined following the princi-
ples of SAS PROC REG (SAS 2000). Regression
analyses for P uptake, soil’s MEP and soil’s WSP with
growth stages of corn were based on the corresponding
number of days after emergence (DAE) of corn to
reflect V6, V16 and R1 growth stages as 14, 56 and 68
DAE, respectively.
Results
Concentration of P in corn tissues and P uptake
of corn
Both the concentration of P and P uptake of corn
varied significantly (p B 0.0001) with Y, ST, CS.
However, the concentrations of P in corn tissues and P
uptake of corn (averaged across Y, ST, IS and CS)
were not affected by NM at all years (2013–2015). The
greatest concentration of P in corn tissues of about
3475 ± 1272 mg kg-1 was in 2013 from BnA soil
while the lowest concentration was in 2014 from NkA
soil (2248 ± 1398 mg kg-1). Dn soil in 2014 had the
greatest uptake of P (21.2 ± 17.4 kg ha-1) while BnA
soil in 2013 (6.9 ± 5.5 kg ha-1) had the lowest P
uptake (Table 2).
Concentrations of P in tissues of corn was signif-
icantly (p B 0.05) affected by IS in 2014, but did not
vary significantly with irrigation scheduling method in
2013 and 2015 (Table 2). In 2014, corn plants with
IPro (2599 ± 1468 mg kg-1) had the greatest con-
centration of P in their tissues followed by SWP
(2540 ± 1600 mg kg-1) and NDVI (2417 ±
1540 mg kg-1). On the other hand, corn uptake of P
was significantly affected by the different IS in 2013,
2014 and 2015 (Table 2). The greatest P uptake of
corn in 2013 and 2014 was from plots with IPro
irrigation with mean value of 8.9 ± 7.5 and
17.2 ± 15.2 kg ha-1, respectively. In 2015, P uptake
(kg ha-1) was in this order: SWP (14.8 ±
8.8)[NDVI (13.5 ± 7.6) = IPro (12.6 ± 6.7).
From 2013 to 2015, both the concentration of P in
corn tissues and P uptake of corn were affected
significantly by CS. Overall, P uptake increased from
V6 to R1 (Table 2). Concentration of P in tissues of corn
when averaged across years (2013–2015) ranged from
4090 ± 641 to 1025 ± 416 mg kg-1, which is equiv-
alent to about 75% reduction in P concentration from V6
to R1 (Table 2). Phosphorus uptake of corn had an
increase of about 1200% from V6 (3.1 ± 1.9 kg ha-1)
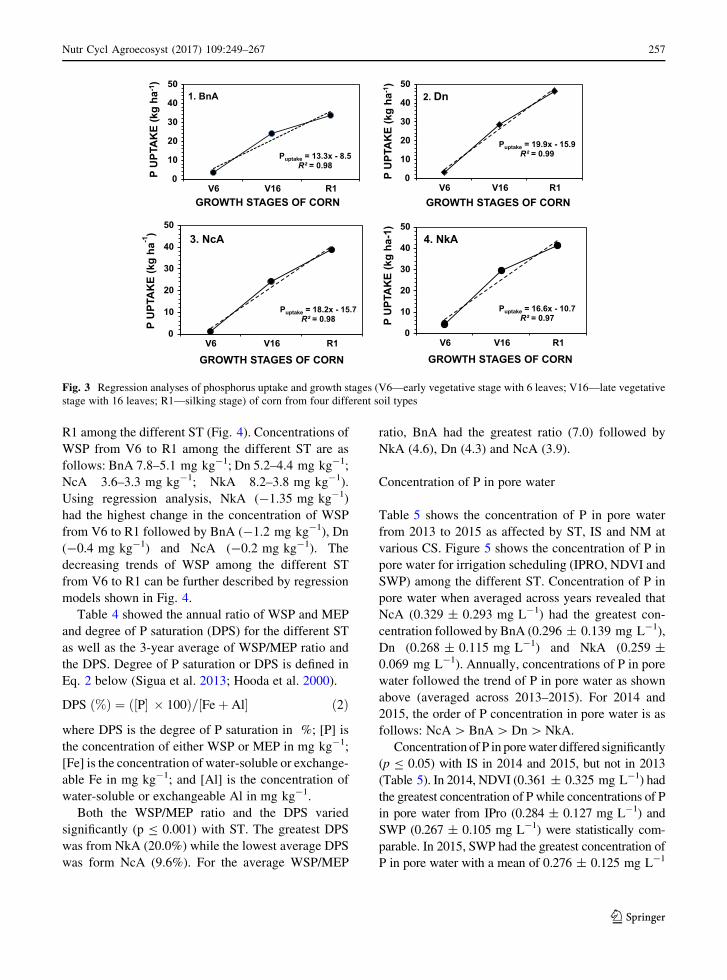
to R1 (40.3 ± 5.7 kg ha-1). Figure 3 shows the P
uptake of corn in different ST from V6 to R1. Again, P
uptake of corn demonstrated a remarkable increase from
V6 to R1. This trend supported the overall significant
effects of the different ST on P uptake of corn as
described above. Regression models presented in Fig. 3
showed an overall linear trend for the cumulative P
uptake of corn from V6 to R1in four ST, respectively.
The different regression models describing P uptake of
corn at various stages of growth (V6, V16 and R1)
varied remarkably among the different ST:
(BnA = 13.3x - 8.5; R2 = 0.98; Dn = 19.9x -
15.9; R2 = 0.99; NcA = 18.2x - 15.7; R2 = 98;
Nka = 16.6x - 10.7; R2 = 0.97; where x is the num-
ber of days after emergence of corn).
Concentrations of P in Soils: Mehlich
Extractable P and Water Soluble P
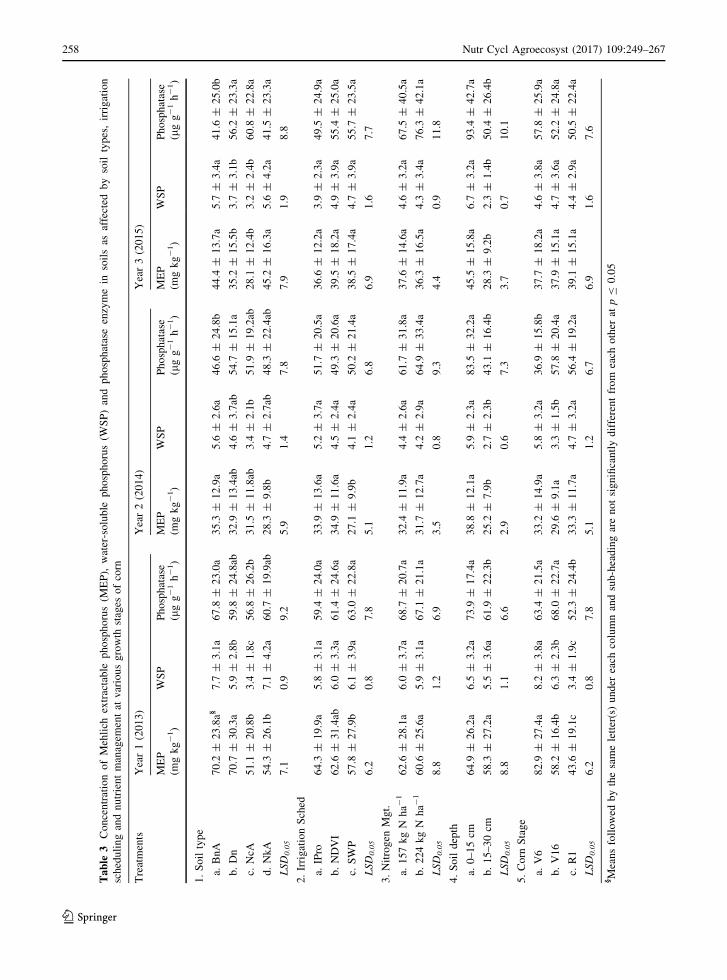
Mehlich extractable P (MEP)
Concentration of MEP was significantly (p B 0.0001)
affected by Y, ST, IS and CS. However, concentra-
tions of MEP in soils (averaged across Y, ST, IS and
CS) was not affected by NM at all years (Table 3). The
concentration of MEP when averaged among years
(2013–2015) showed that BnA (50.0 ±
22.9 mg kg-1) had the greatest concentration fol-
lowed by Dn (46.3 ± 27.2 mg kg-1), NkA
(42.6 ± 21.4 mg kg-1) and NcA (36.8 ±
18.4 mg kg-1). In 2013, 2014, and 2015, BnA had
the greatest concentration of MEP with mean values of
70.2 ± 23.8, 35.3 ± 12.9 and 44.4 ± 13.7 mg kg-1,
respectively (Table 3). Unlike the effect of ST, IS
effect on MEP was only significant (p B 0.05) in 2013
and 2014 where IPro and NDVI had comparable mean
values of 64.3 ± 19.9 and 62.6 ± 31.4 mg kg-1,
respectively (Table 3). The concentration of MEP in
2013 was about 57.8 ± 27.9 mg kg-1.
Soil MEP varied significantly (p B 0.0001) with soil
depth. Concentration of MEP (averaged across Y, ST,
and CS) in the upper soil depth (0–15 cm) was
significantly (p B 0.05) greater than the concentration
of MEP in the lower soil depth (15–30 cm) with values
of 48.4 ± 20.9 and 35.4 ± 21.2 mg kg-1, respectively
(Table 3). Result is suggesting that at any given ST and
year, concentration of MEP remained to be significantly
higher in the upper soil layer and this could have had
Nutr Cycl Agroecosyst (2017) 109:249–267 255
123
some significant implications with respect to P avail-
ability and mobility in Coastal Plain region.
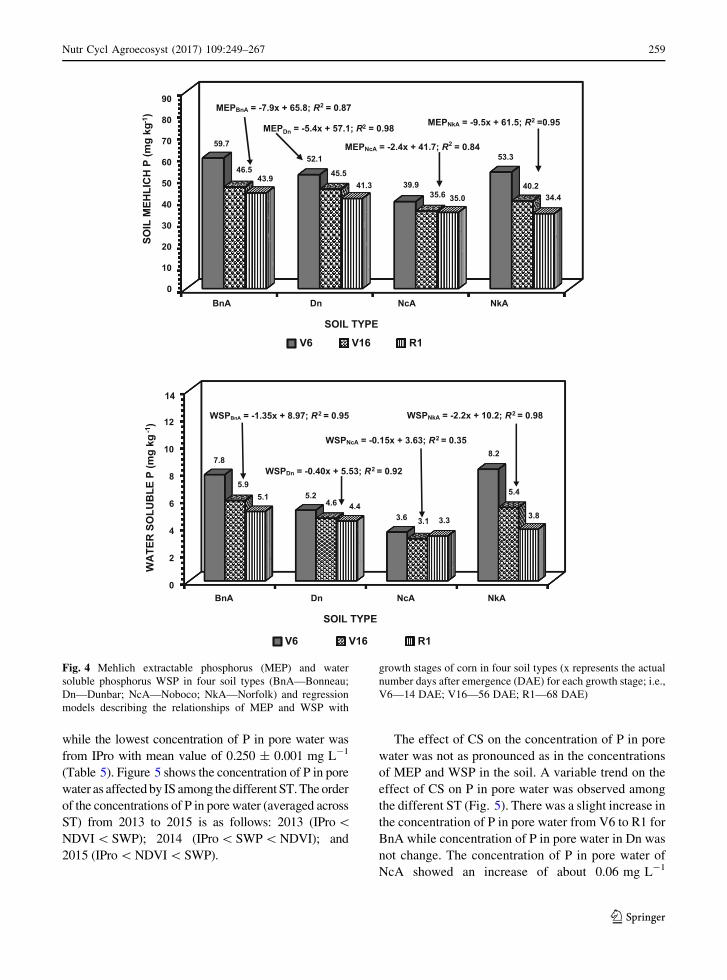
Concentration of MEP in the soils (averaged across
years) showed a declining trend from V6 to R1 stages of
corn. Soil MEP decreased significantly from V6
(51.2 ± 30.6 mg kg-1) to R1 (38.6 ± 16.1 mg kg-1).
Similarly, concentrations of MEP showed a decreasing
trend from V6 to R1 among the different ST: (BnA
59.7–43.9 mg kg-1; Dn 521–41.3 mg kg-1; NcA
39.9–35.0 mg kg-1; NkA 53.3–34.4 mg kg-1) as
shown in Fig. 4. The decreasing trends of MEP among
the different ST from V6 to R1 can be further described
by regression models shown in Fig. 4.
Water soluble P (WSP)
Like the concentration of MEP, concentration of WSP
varied significantly (p B 0.0001) with Y, ST, CS and
SD. However, concentration of WSP at all years
(2013–2015) was not significantly affected by NM
(Table 3). The greatest concentration of WSP in 2013,
2014 and 2015 was observed from BnA with mean
values of 7.7 ± 3.1, 5.6 ± 2.6 and 5.7 ±
3.4 mg kg-1, respectively (Table 3). The lowest con-
centration of WSP in 2013, 2014 and 2015 was from
NcA with mean values of 3.4 ± 1.8, 3.4 ± 2.1 and
3.2 ± 2.4 mg kg-1, respectively.
Similar to soil MEP, the upper soil depth (0–15 cm)
when averaged across Y, ST and CS had the highest
concentration of WSP (6.4 ± 2.9 mg kg-1). The
lowest concentration of WSP (3.3 ± 2.8 mg kg-1)
was found in the lower soil depth (15–30 cm). Result
is suggesting that there will be about 50% less
concentration of WSP in the lower soil depth and this
may have had significant implication on P mobility
and availability.
On the interaction effect of ST and CS, concentra-
tions of WSP showed a decreasing trend from V6 to
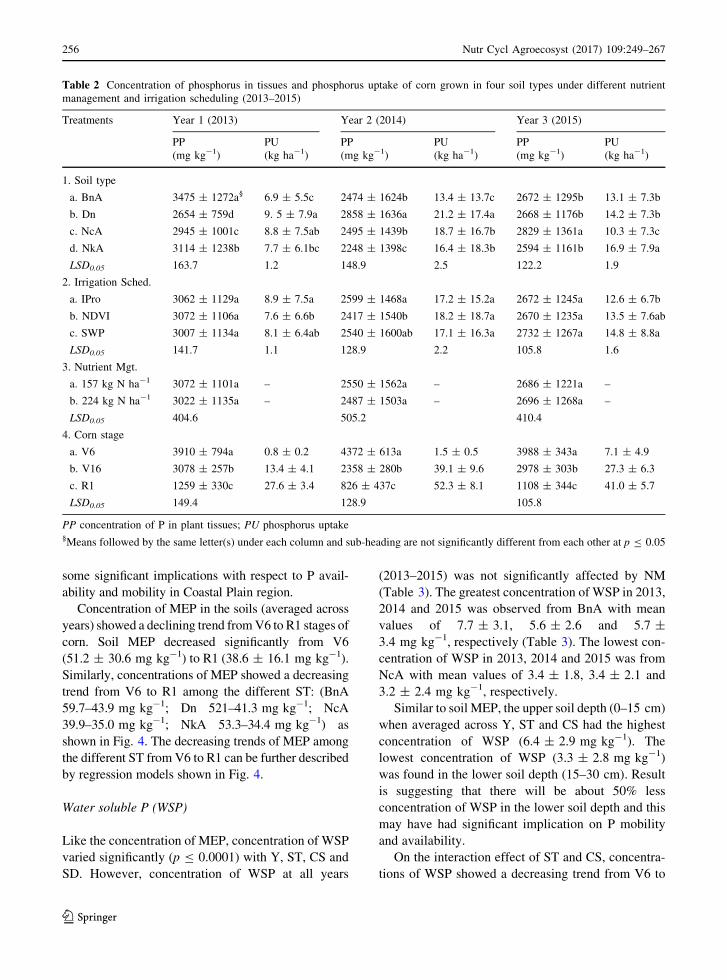
Table 2 Concentration of phosphorus in tissues and phosphorus uptake of corn grown in four soil types under different nutrient
management and irrigation scheduling (2013–2015)
Treatments Year 1 (2013) Year 2 (2014) Year 3 (2015)
PP PU PP PU PP PU
(mg kg-1) (kg ha-1) (mg kg-1) (kg ha-1) (mg kg-1) (kg ha-1)
1. Soil type
a. BnA 3475 ± 1272a§ 6.9 ± 5.5c 2474 ± 1624b 13.4 ± 13.7c 2672 ± 1295b 13.1 ± 7.3b
b. Dn 2654 ± 759d 9. 5 ± 7.9a 2858 ± 1636a 21.2 ± 17.4a 2668 ± 1176b 14.2 ± 7.3b
c. NcA 2945 ± 1001c 8.8 ± 7.5ab 2495 ± 1439b 18.7 ± 16.7b 2829 ± 1361a 10.3 ± 7.3c
d. NkA 3114 ± 1238b 7.7 ± 6.1bc 2248 ± 1398c 16.4 ± 18.3b 2594 ± 1161b 16.9 ± 7.9a
LSD0.05 163.7 1.2 148.9 2.5 122.2 1.9
2. Irrigation Sched.
a. IPro 3062 ± 1129a 8.9 ± 7.5a 2599 ± 1468a 17.2 ± 15.2a 2672 ± 1245a 12.6 ± 6.7b
b. NDVI 3072 ± 1106a 7.6 ± 6.6b 2417 ± 1540b 18.2 ± 18.7a 2670 ± 1235a 13.5 ± 7.6ab
c. SWP 3007 ± 1134a 8.1 ± 6.4ab 2540 ± 1600ab 17.1 ± 16.3a 2732 ± 1267a 14.8 ± 8.8a
LSD0.05 141.7 1.1 128.9 2.2 105.8 1.6
3. Nutrient Mgt.
a. 157 kg N ha-1 3072 ± 1101a – 2550 ± 1562a – 2686 ± 1221a –
b. 224 kg N ha-1 3022 ± 1135a – 2487 ± 1503a – 2696 ± 1268a –
LSD0.05 404.6 505.2 410.4
4. Corn stage
a. V6 3910 ± 794a 0.8 ± 0.2 4372 ± 613a 1.5 ± 0.5 3988 ± 343a 7.1 ± 4.9
b. V16 3078 ± 257b 13.4 ± 4.1 2358 ± 280b 39.1 ± 9.6 2978 ± 303b 27.3 ± 6.3
c. R1 1259 ± 330c 27.6 ± 3.4 826 ± 437c 52.3 ± 8.1 1108 ± 344c 41.0 ± 5.7
LSD0.05 149.4 128.9 105.8
PP concentration of P in plant tissues; PU phosphorus uptake§Means followed by the same letter(s) under each column and sub-heading are not significantly different from each other at p B 0.05
256 Nutr Cycl Agroecosyst (2017) 109:249–267
123
R1 among the different ST (Fig. 4). Concentrations of
WSP from V6 to R1 among the different ST are as
follows: BnA 7.8–5.1 mg kg-1; Dn 5.2–4.4 mg kg-1;
NcA 3.6–3.3 mg kg-1; NkA 8.2–3.8 mg kg-1).
Using regression analysis, NkA (-1.35 mg kg-1)
had the highest change in the concentration of WSP
from V6 to R1 followed by BnA (-1.2 mg kg-1), Dn
(-0.4 mg kg-1) and NcA (-0.2 mg kg-1). The
decreasing trends of WSP among the different ST
from V6 to R1 can be further described by regression
models shown in Fig. 4.
Table 4 showed the annual ratio of WSP and MEP
and degree of P saturation (DPS) for the different ST
as well as the 3-year average of WSP/MEP ratio and
the DPS. Degree of P saturation or DPS is defined in
Eq. 2 below (Sigua et al. 2013; Hooda et al. 2000).
DPS %ð Þ ¼ P½ � � 100ð Þ= Fe þ Al½ � ð2Þ
where DPS is the degree of P saturation in %; [P] is
the concentration of either WSP or MEP in mg kg-1;
[Fe] is the concentration of water-soluble or exchange-
able Fe in mg kg-1; and [Al] is the concentration of
water-soluble or exchangeable Al in mg kg-1.
Both the WSP/MEP ratio and the DPS varied
significantly (p B 0.001) with ST. The greatest DPS
was from NkA (20.0%) while the lowest average DPS
was form NcA (9.6%). For the average WSP/MEP
ratio, BnA had the greatest ratio (7.0) followed by
NkA (4.6), Dn (4.3) and NcA (3.9).
Concentration of P in pore water
Table 5 shows the concentration of P in pore water
from 2013 to 2015 as affected by ST, IS and NM at
various CS. Figure 5 shows the concentration of P in
pore water for irrigation scheduling (IPRO, NDVI and
SWP) among the different ST. Concentration of P in
pore water when averaged across years revealed that
NcA (0.329 ± 0.293 mg L-1) had the greatest con-
centration followed by BnA (0.296 ± 0.139 mg L-1),
Dn (0.268 ± 0.115 mg L-1) and NkA (0.259 ±
0.069 mg L-1). Annually, concentrations of P in pore
water followed the trend of P in pore water as shown
above (averaged across 2013–2015). For 2014 and
2015, the order of P concentration in pore water is as
follows: NcA[BnA[Dn[NkA.
Concentration of P in pore water differed significantly
(p B 0.05) with IS in 2014 and 2015, but not in 2013
(Table 5). In 2014, NDVI (0.361 ± 0.325 mg L-1) had
the greatest concentration of P while concentrations of P
in pore water from IPro (0.284 ± 0.127 mg L-1) and
SWP (0.267 ± 0.105 mg L-1) were statistically com-
parable. In 2015, SWP had the greatest concentration of
P in pore water with a mean of 0.276 ± 0.125 mg L-1
Puptake = 19.9x - 15.9 R² = 0.99
0
10
20
30
40
50
P U
PTA
KE
(kg
ha-1
)
GROWTH STAGES OF CORN
2. Dn
Puptake = 18.2x - 15.7 R² = 0.98
0
10
20
30
40
50
P U
PTA
KE
(kg
ha-1
)
GROWTH STAGES OF CORN
3. NcA
Puptake = 13.3x - 8.5 R² = 0.98
0
10
20
30
40
50
P U
PTA
KE
(kg
ha-1
)
GROWTH STAGES OF CORN
1. BnA
Puptake = 16.6x - 10.7 R² = 0.97
0
10
20
30
40
50
V6 V16 R1
V6 V16 R1
V6 V16 R1
V6 V16 R1
P U
PTA
KE
(kg
ha-1
)
GROWTH STAGES OF CORN
4. NkA
Fig. 3 Regression analyses of phosphorus uptake and growth stages (V6—early vegetative stage with 6 leaves; V16—late vegetative
stage with 16 leaves; R1—silking stage) of corn from four different soil types
Nutr Cycl Agroecosyst (2017) 109:249–267 257
123
Table
3C
on
cen
trat
ion
of
Meh
lich
extr
acta
ble
ph
osp
ho
rus
(ME
P),
wat
er-s
olu
ble
ph
osp
ho
rus
(WS
P)
and
ph
osp
hat
ase
enzy
me
inso
ils
asaf
fect
edb
yso
ilty
pes
,ir
rig
atio
n
sch
edu
lin
gan
dn
utr
ien
tm
anag
emen
tat
var
iou
sg
row
thst
ages
of
corn
Tre
atm
ents
Yea
r1
(20
13
)Y
ear
2(2
01
4)
Yea
r3
(20
15
)
ME
PW
SP
Ph
osp
hat
ase
ME
PW
SP
Ph
osp
hat
ase
ME
PW
SP
Ph
osp
hat
ase
(mg
kg-
1)
(lg
g-
1h-
1)
(mg
kg-
1)
(lg
g-
1h-
1)
(mg
kg-
1)
(lg
g-
1h-
1)
1.
So
ilty
pe
a.B
nA
70
.2±
23
.8a§
7.7
±3
.1a
67
.8±
23
.0a
35
.3±
12
.9a
5.6
±2
.6a
46
.6±
24
.8b
44
.4±
13
.7a
5.7
±3
.4a
41
.6±
25
.0b
b.
Dn
70
.7±
30
.3a
5.9
±2
.8b
59
.8±
24
.8ab
32
.9±
13
.4ab
4.6
±3
.7ab
54
.7±
15
.1a
35
.2±
15
.5b
3.7
±3
.1b
56
.2±
23
.3a
c.N
cA5
1.1
±2
0.8
b3
.4±
1.8
c5
6.8
±2
6.2
b3
1.5
±1
1.8
ab3
.4±
2.1
b5
1.9
±1
9.2
ab2
8.1
±1
2.4
b3
.2±
2.4
b6
0.8
±2
2.8
a
d.
Nk
A5
4.3
±2
6.1
b7
.1±
4.2
a6
0.7
±1
9.9
ab2
8.3
±9
.8b
4.7
±2
.7ab
48
.3±
22
.4ab
45
.2±
16
.3a
5.6
±4
.2a
41
.5±
23
.3a
LSD0.05
7.1
0.9
9.2
5.9
1.4
7.8
7.9
1.9
8.8
2.
Irri
gat
ion
Sch
ed
a.IP
ro6
4.3
±1
9.9
a5
.8±
3.1
a5
9.4
±2
4.0
a3
3.9
±1
3.6
a5
.2±
3.7
a5
1.7
±2
0.5
a3
6.6
±1
2.2
a3
.9±
2.3
a4
9.5
±2
4.9
a
b.
ND
VI
62
.6±
31
.4ab
6.0
±3
.3a
61
.4±
24
.6a
34
.9±
11
.6a
4.5
±2
.4a
49
.3±
20
.6a
39
.5±
18
.2a
4.9
±3
.9a
55
.4±
25
.0a
c.S
WP
57
.8±
27
.9b
6.1
±3
.9a
63
.0±
22
.8a
27
.1±
9.9
b4
.1±
2.4
a5
0.2
±2
1.4
a3
8.5
±1
7.4
a4
.7±
3.9
a5
5.7
±2
3.5
a
LSD0.05
6.2
0.8
7.8
5.1
1.2
6.8
6.9
1.6
7.7
3.
Nit
rog
enM
gt.
a.1
57
kg
Nh
a-1
62
.6±
28
.1a
6.0
±3
.7a
68
.7±
20
.7a
32
.4±
11
.9a
4.4
±2
.6a
61
.7±
31
.8a
37
.6±
14
.6a
4.6
±3
.2a
67
.5±
40
.5a
b.
22
4k
gN
ha-
16
0.6
±2
5.6
a5
.9±
3.1
a6
7.1
±2
1.1
a3
1.7
±1
2.7
a4
.2±
2.9
a6
4.9
±3
3.4
a3
6.3
±1
6.5
a4
.3±
3.4
a7
6.3
±4
2.1
a
LSD0.05
8.8
1.2
6.9
3.5
0.8
9.3
4.4
0.9
11
.8
4.
So
ild
epth
a.0
–1
5cm
64
.9±
26
.2a
6.5
±3
.2a
73
.9±
17
.4a
38
.8±
12
.1a
5.9
±2
.3a
83
.5±
32
.2a
45
.5±
15
.8a
6.7
±3
.2a
93
.4±
42
.7a
b.
15
–3
0cm
58
.3±
27
.2a
5.5
±3
.6a
61
.9±
22
.3b
25
.2±
7.9
b2
.7±
2.3
b4
3.1
±1
6.4
b2
8.3
±9
.2b
2.3
±1
.4b
50
.4±
26
.4b
LSD0.05
8.8
1.1
6.6
2.9
0.6
7.3
3.7
0.7
10
.1
5.
Co
rnS
tag
e
a.V
68
2.9
±2
7.4
a8
.2±
3.8
a6
3.4
±2
1.5
a3
3.2
±1
4.9
a5
.8±
3.2
a3
6.9
±1
5.8
b3
7.7
±1
8.2
a4
.6±
3.8
a5
7.8
±2
5.9
a
b.
V1
65
8.2
±1
6.4
b6
.3±
2.3
b6
8.0
±2
2.7
a2
9.6
±9
.1a
3.3
±1
.5b
57
.8±
20
.4a
37
.9±
15
.1a
4.7
±3
.6a
52
.2±
24
.8a
c.R
14
3.6
±1
9.1
c3
.4±
1.9
c5
2.3
±2
4.4
b3
3.3
±1
1.7
a4
.7±
3.2
a5
6.4
±1
9.2
a3
9.1
±1
5.1
a4
.4±
2.9
a5
0.5
±2
2.4
a
LSD0.05
6.2
0.8
7.8
5.1
1.2
6.7
6.9
1.6
7.6
§M
ean
sfo
llo
wed
by
the
sam
ele
tter
(s)
un
der
each
colu
mn
and
sub
-hea
din
gar
en
ot
sig
nifi
can
tly
dif
fere
nt
fro
mea
cho
ther
atpB
0.0
5
258 Nutr Cycl Agroecosyst (2017) 109:249–267
123
while the lowest concentration of P in pore water was
from IPro with mean value of 0.250 ± 0.001 mg L-1
(Table 5). Figure 5 shows the concentration of P in pore
water as affected by IS among the different ST. The order
of the concentrations of P in pore water (averaged across
ST) from 2013 to 2015 is as follows: 2013 (IPro\NDVI\SWP); 2014 (IPro\SWP\NDVI); and
2015 (IPro\NDVI\SWP).
The effect of CS on the concentration of P in pore
water was not as pronounced as in the concentrations
of MEP and WSP in the soil. A variable trend on the
effect of CS on P in pore water was observed among
the different ST (Fig. 5). There was a slight increase in
the concentration of P in pore water from V6 to R1 for
BnA while concentration of P in pore water in Dn was
not change. The concentration of P in pore water of
NcA showed an increase of about 0.06 mg L-1
14
)
0
10
20
30
40
50
60
70
80
90
BnA Dn NcA NkA
59.7
52.1
39.9
53.3 46.5 45.5
35.6 40.2
43.9 41.3
35.0 34.4
SOIL
MEH
LIC
H P
(mg
kg )-1
SOIL TYPE
V6 V16 R1
MEPDn = -5.4x + 57.1; R2 = 0.98
0
2
4
6
8
10
12
BnA Dn NcA NkA
7.8
5.2
3.6
8.2
5.9
4.6
3.1
5.4 5.1 4.4
3.3 3.8
WA
TER
SO
LUB
LE P
(mg
kg-1
SOIL TYPE
V6 V16 R1
WSPBnA = -1.35x + 8.97; R2 = 0.95
WSPDn = -0.40x + 5.53; R2 = 0.92
WSPNcA = -0.15x + 3.63; R2 = 0.35
WSPNkA = -2.2x + 10.2; R2 = 0.98
MEPBnA = -7.9x + 65.8; R2 = 0.87
MEPNcA = -2.4x + 41.7; R2 = 0.84
MEPNkA = -9.5x + 61.5; R2 =0.95
Fig. 4 Mehlich extractable phosphorus (MEP) and water
soluble phosphorus WSP in four soil types (BnA—Bonneau;
Dn—Dunbar; NcA—Noboco; NkA—Norfolk) and regression
models describing the relationships of MEP and WSP with
growth stages of corn in four soil types (x represents the actual
number days after emergence (DAE) for each growth stage; i.e.,
V6—14 DAE; V16—56 DAE; R1—68 DAE)
Nutr Cycl Agroecosyst (2017) 109:249–267 259
123
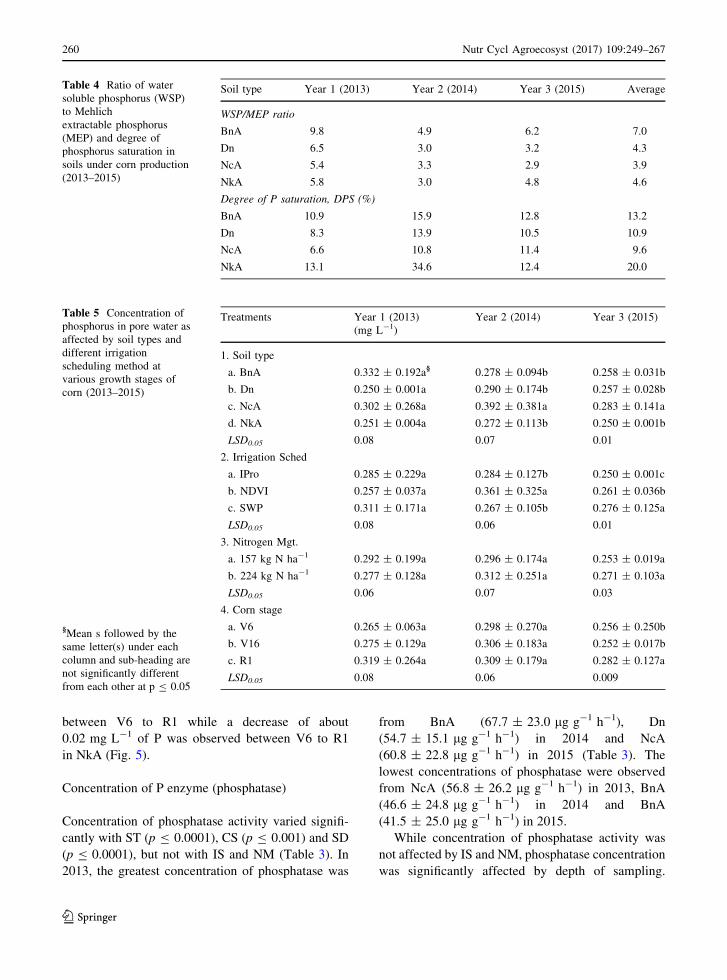
between V6 to R1 while a decrease of about
0.02 mg L-1 of P was observed between V6 to R1
in NkA (Fig. 5).
Concentration of P enzyme (phosphatase)
Concentration of phosphatase activity varied signifi-
cantly with ST (p B 0.0001), CS (p B 0.001) and SD
(p B 0.0001), but not with IS and NM (Table 3). In
2013, the greatest concentration of phosphatase was
from BnA (67.7 ± 23.0 lg g-1 h-1), Dn
(54.7 ± 15.1 lg g-1 h-1) in 2014 and NcA
(60.8 ± 22.8 lg g-1 h-1) in 2015 (Table 3). The
lowest concentrations of phosphatase were observed
from NcA (56.8 ± 26.2 lg g-1 h-1) in 2013, BnA
(46.6 ± 24.8 lg g-1 h-1) in 2014 and BnA
(41.5 ± 25.0 lg g-1 h-1) in 2015.
While concentration of phosphatase activity was
not affected by IS and NM, phosphatase concentration
was significantly affected by depth of sampling.
Table 4 Ratio of water
soluble phosphorus (WSP)
to Mehlich
extractable phosphorus
(MEP) and degree of
phosphorus saturation in
soils under corn production
(2013–2015)
Soil type Year 1 (2013) Year 2 (2014) Year 3 (2015) Average
WSP/MEP ratio
BnA 9.8 4.9 6.2 7.0
Dn 6.5 3.0 3.2 4.3
NcA 5.4 3.3 2.9 3.9
NkA 5.8 3.0 4.8 4.6
Degree of P saturation, DPS (%)
BnA 10.9 15.9 12.8 13.2
Dn 8.3 13.9 10.5 10.9
NcA 6.6 10.8 11.4 9.6
NkA 13.1 34.6 12.4 20.0
Table 5 Concentration of
phosphorus in pore water as
affected by soil types and
different irrigation
scheduling method at
various growth stages of
corn (2013–2015)
§Mean s followed by the
same letter(s) under each
column and sub-heading are
not significantly different
from each other at p B 0.05
Treatments Year 1 (2013) Year 2 (2014) Year 3 (2015)
(mg L-1)
1. Soil type
a. BnA 0.332 ± 0.192a§ 0.278 ± 0.094b 0.258 ± 0.031b
b. Dn 0.250 ± 0.001a 0.290 ± 0.174b 0.257 ± 0.028b
c. NcA 0.302 ± 0.268a 0.392 ± 0.381a 0.283 ± 0.141a
d. NkA 0.251 ± 0.004a 0.272 ± 0.113b 0.250 ± 0.001b
LSD0.05 0.08 0.07 0.01
2. Irrigation Sched
a. IPro 0.285 ± 0.229a 0.284 ± 0.127b 0.250 ± 0.001c
b. NDVI 0.257 ± 0.037a 0.361 ± 0.325a 0.261 ± 0.036b
c. SWP 0.311 ± 0.171a 0.267 ± 0.105b 0.276 ± 0.125a
LSD0.05 0.08 0.06 0.01
3. Nitrogen Mgt.
a. 157 kg N ha-1 0.292 ± 0.199a 0.296 ± 0.174a 0.253 ± 0.019a
b. 224 kg N ha-1 0.277 ± 0.128a 0.312 ± 0.251a 0.271 ± 0.103a
LSD0.05 0.06 0.07 0.03
4. Corn stage
a. V6 0.265 ± 0.063a 0.298 ± 0.270a 0.256 ± 0.250b
b. V16 0.275 ± 0.129a 0.306 ± 0.183a 0.252 ± 0.017b
c. R1 0.319 ± 0.264a 0.309 ± 0.179a 0.282 ± 0.127a
LSD0.05 0.08 0.06 0.009
260 Nutr Cycl Agroecosyst (2017) 109:249–267
123
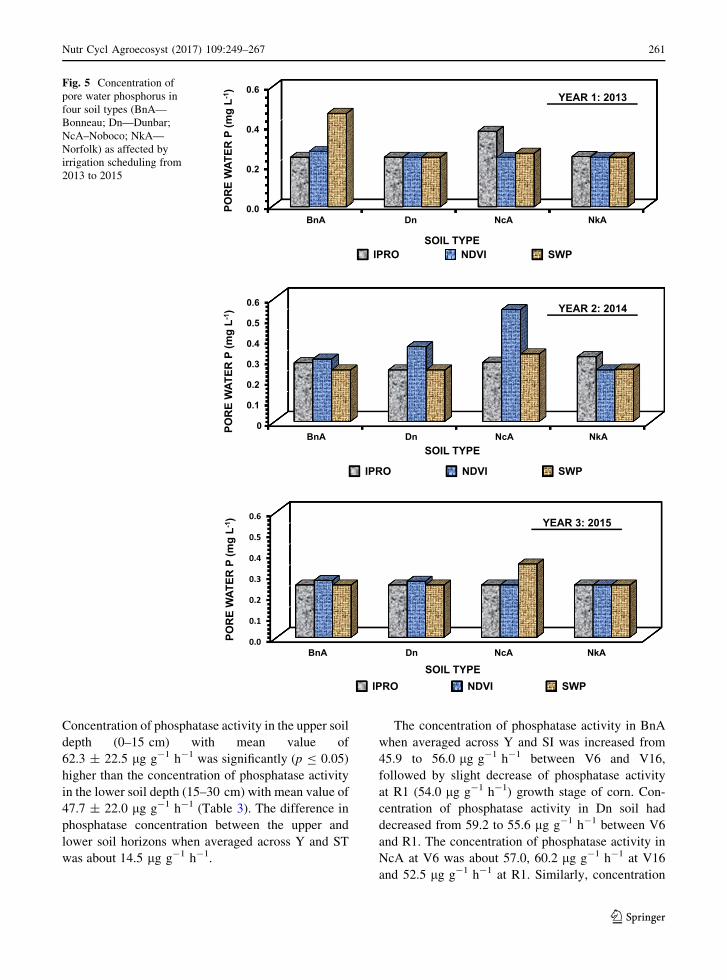
Concentration of phosphatase activity in the upper soil
depth (0–15 cm) with mean value of
62.3 ± 22.5 lg g-1 h-1 was significantly (p B 0.05)
higher than the concentration of phosphatase activity
in the lower soil depth (15–30 cm) with mean value of
47.7 ± 22.0 lg g-1 h-1 (Table 3). The difference in
phosphatase concentration between the upper and
lower soil horizons when averaged across Y and ST
was about 14.5 lg g-1 h-1.
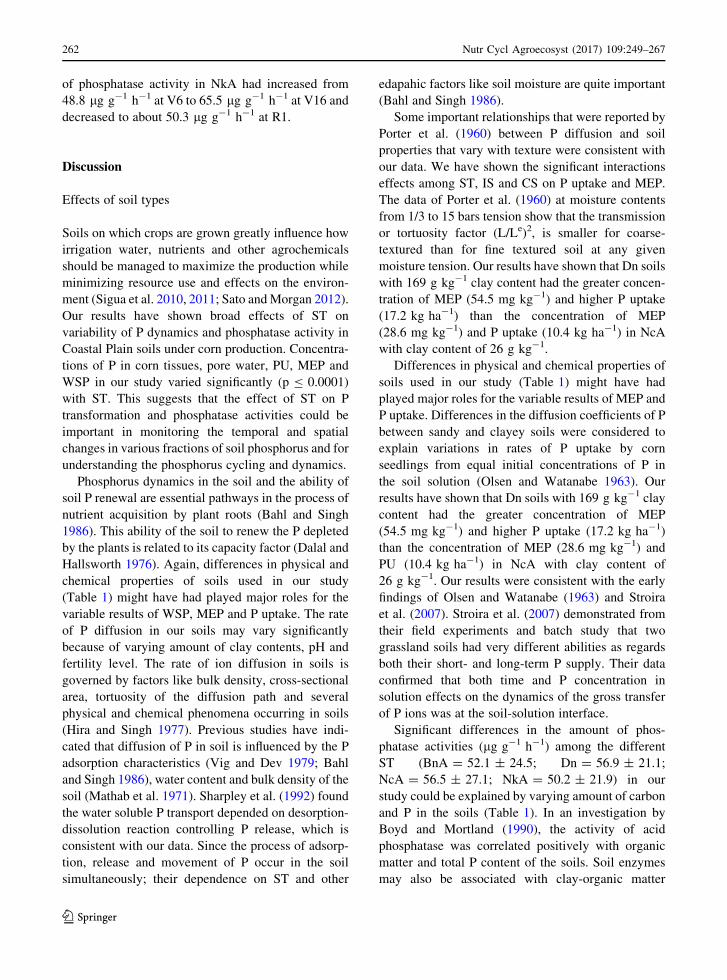
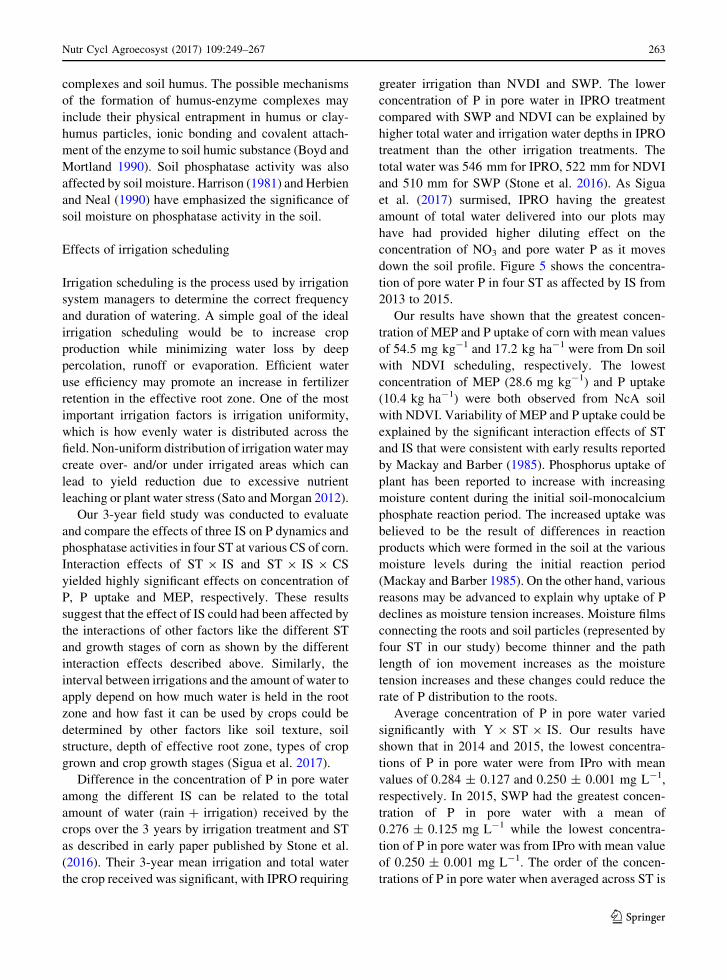
The concentration of phosphatase activity in BnA
when averaged across Y and SI was increased from
45.9 to 56.0 lg g-1 h-1 between V6 and V16,
followed by slight decrease of phosphatase activity
at R1 (54.0 lg g-1 h-1) growth stage of corn. Con-
centration of phosphatase activity in Dn soil had
decreased from 59.2 to 55.6 lg g-1 h-1 between V6
and R1. The concentration of phosphatase activity in
NcA at V6 was about 57.0, 60.2 lg g-1 h-1 at V16
and 52.5 lg g-1 h-1 at R1. Similarly, concentration
0.0
0.2
0.4
0.6
POR
E W
ATER
P (m
g L-
1 )
SOIL TYPE IPRO NDVI SWP
YEAR 1: 2013
0
0.1
0.2
0.3
0.4
0.5
0.6
POR
E W
ATER
P (m
g L-
1 )
SOIL TYPE
IPRO NDVI SWP
YEAR 2: 2014
0.0
0.1
0.2
0.3
0.4
0.5
0.6
BnA Dn NcA NkA
BnA Dn NcA NkA
BnA Dn NcA NkA
POR
E W
ATER
P (m
g L-
1 )
SOIL TYPE IPRO NDVI SWP
YEAR 3: 2015
Fig. 5 Concentration of
pore water phosphorus in
four soil types (BnA—
Bonneau; Dn—Dunbar;
NcA–Noboco; NkA—
Norfolk) as affected by
irrigation scheduling from
2013 to 2015
Nutr Cycl Agroecosyst (2017) 109:249–267 261
123
of phosphatase activity in NkA had increased from
48.8 lg g-1 h-1 at V6 to 65.5 lg g-1 h-1 at V16 and
decreased to about 50.3 lg g-1 h-1 at R1.
Discussion
Effects of soil types
Soils on which crops are grown greatly influence how
irrigation water, nutrients and other agrochemicals
should be managed to maximize the production while
minimizing resource use and effects on the environ-
ment (Sigua et al. 2010, 2011; Sato and Morgan 2012).
Our results have shown broad effects of ST on
variability of P dynamics and phosphatase activity in
Coastal Plain soils under corn production. Concentra-
tions of P in corn tissues, pore water, PU, MEP and
WSP in our study varied significantly (p B 0.0001)
with ST. This suggests that the effect of ST on P
transformation and phosphatase activities could be
important in monitoring the temporal and spatial
changes in various fractions of soil phosphorus and for
understanding the phosphorus cycling and dynamics.
Phosphorus dynamics in the soil and the ability of
soil P renewal are essential pathways in the process of
nutrient acquisition by plant roots (Bahl and Singh
1986). This ability of the soil to renew the P depleted
by the plants is related to its capacity factor (Dalal and
Hallsworth 1976). Again, differences in physical and
chemical properties of soils used in our study
(Table 1) might have had played major roles for the
variable results of WSP, MEP and P uptake. The rate
of P diffusion in our soils may vary significantly
because of varying amount of clay contents, pH and
fertility level. The rate of ion diffusion in soils is
governed by factors like bulk density, cross-sectional
area, tortuosity of the diffusion path and several
physical and chemical phenomena occurring in soils
(Hira and Singh 1977). Previous studies have indi-
cated that diffusion of P in soil is influenced by the P
adsorption characteristics (Vig and Dev 1979; Bahl
and Singh 1986), water content and bulk density of the
soil (Mathab et al. 1971). Sharpley et al. (1992) found
the water soluble P transport depended on desorption-
dissolution reaction controlling P release, which is
consistent with our data. Since the process of adsorp-
tion, release and movement of P occur in the soil
simultaneously; their dependence on ST and other
edapahic factors like soil moisture are quite important
(Bahl and Singh 1986).
Some important relationships that were reported by
Porter et al. (1960) between P diffusion and soil
properties that vary with texture were consistent with
our data. We have shown the significant interactions
effects among ST, IS and CS on P uptake and MEP.
The data of Porter et al. (1960) at moisture contents
from 1/3 to 15 bars tension show that the transmission
or tortuosity factor (L/Le)2, is smaller for coarse-
textured than for fine textured soil at any given
moisture tension. Our results have shown that Dn soils
with 169 g kg-1 clay content had the greater concen-
tration of MEP (54.5 mg kg-1) and higher P uptake
(17.2 kg ha-1) than the concentration of MEP
(28.6 mg kg-1) and P uptake (10.4 kg ha-1) in NcA
with clay content of 26 g kg-1.
Differences in physical and chemical properties of
soils used in our study (Table 1) might have had
played major roles for the variable results of MEP and
P uptake. Differences in the diffusion coefficients of P
between sandy and clayey soils were considered to
explain variations in rates of P uptake by corn
seedlings from equal initial concentrations of P in
the soil solution (Olsen and Watanabe 1963). Our
results have shown that Dn soils with 169 g kg-1 clay
content had the greater concentration of MEP
(54.5 mg kg-1) and higher P uptake (17.2 kg ha-1)
than the concentration of MEP (28.6 mg kg-1) and
PU (10.4 kg ha-1) in NcA with clay content of
26 g kg-1. Our results were consistent with the early
findings of Olsen and Watanabe (1963) and Stroira
et al. (2007). Stroira et al. (2007) demonstrated from
their field experiments and batch study that two
grassland soils had very different abilities as regards
both their short- and long-term P supply. Their data
confirmed that both time and P concentration in
solution effects on the dynamics of the gross transfer
of P ions was at the soil-solution interface.
Significant differences in the amount of phos-
phatase activities (lg g-1 h-1) among the different
ST (BnA = 52.1 ± 24.5; Dn = 56.9 ± 21.1;
NcA = 56.5 ± 27.1; NkA = 50.2 ± 21.9) in our
study could be explained by varying amount of carbon
and P in the soils (Table 1). In an investigation by
Boyd and Mortland (1990), the activity of acid
phosphatase was correlated positively with organic
matter and total P content of the soils. Soil enzymes
may also be associated with clay-organic matter
262 Nutr Cycl Agroecosyst (2017) 109:249–267
123
complexes and soil humus. The possible mechanisms
of the formation of humus-enzyme complexes may
include their physical entrapment in humus or clay-
humus particles, ionic bonding and covalent attach-
ment of the enzyme to soil humic substance (Boyd and
Mortland 1990). Soil phosphatase activity was also
affected by soil moisture. Harrison (1981) and Herbien
and Neal (1990) have emphasized the significance of
soil moisture on phosphatase activity in the soil.
Effects of irrigation scheduling
Irrigation scheduling is the process used by irrigation
system managers to determine the correct frequency
and duration of watering. A simple goal of the ideal
irrigation scheduling would be to increase crop
production while minimizing water loss by deep
percolation, runoff or evaporation. Efficient water
use efficiency may promote an increase in fertilizer
retention in the effective root zone. One of the most
important irrigation factors is irrigation uniformity,
which is how evenly water is distributed across the
field. Non-uniform distribution of irrigation water may
create over- and/or under irrigated areas which can
lead to yield reduction due to excessive nutrient
leaching or plant water stress (Sato and Morgan 2012).
Our 3-year field study was conducted to evaluate
and compare the effects of three IS on P dynamics and
phosphatase activities in four ST at various CS of corn.
Interaction effects of ST 9 IS and ST 9 IS 9 CS
yielded highly significant effects on concentration of
P, P uptake and MEP, respectively. These results
suggest that the effect of IS could had been affected by
the interactions of other factors like the different ST
and growth stages of corn as shown by the different
interaction effects described above. Similarly, the
interval between irrigations and the amount of water to
apply depend on how much water is held in the root
zone and how fast it can be used by crops could be
determined by other factors like soil texture, soil
structure, depth of effective root zone, types of crop
grown and crop growth stages (Sigua et al. 2017).
Difference in the concentration of P in pore water
among the different IS can be related to the total
amount of water (rain ? irrigation) received by the
crops over the 3 years by irrigation treatment and ST
as described in early paper published by Stone et al.
(2016). Their 3-year mean irrigation and total water
the crop received was significant, with IPRO requiring
greater irrigation than NVDI and SWP. The lower
concentration of P in pore water in IPRO treatment
compared with SWP and NDVI can be explained by
higher total water and irrigation water depths in IPRO
treatment than the other irrigation treatments. The
total water was 546 mm for IPRO, 522 mm for NDVI
and 510 mm for SWP (Stone et al. 2016). As Sigua
et al. (2017) surmised, IPRO having the greatest
amount of total water delivered into our plots may
have had provided higher diluting effect on the
concentration of NO3 and pore water P as it moves
down the soil profile. Figure 5 shows the concentra-
tion of pore water P in four ST as affected by IS from
2013 to 2015.
Our results have shown that the greatest concen-
tration of MEP and P uptake of corn with mean values
of 54.5 mg kg-1 and 17.2 kg ha-1 were from Dn soil
with NDVI scheduling, respectively. The lowest
concentration of MEP (28.6 mg kg-1) and P uptake
(10.4 kg ha-1) were both observed from NcA soil
with NDVI. Variability of MEP and P uptake could be
explained by the significant interaction effects of ST
and IS that were consistent with early results reported
by Mackay and Barber (1985). Phosphorus uptake of
plant has been reported to increase with increasing
moisture content during the initial soil-monocalcium
phosphate reaction period. The increased uptake was
believed to be the result of differences in reaction
products which were formed in the soil at the various
moisture levels during the initial reaction period
(Mackay and Barber 1985). On the other hand, various
reasons may be advanced to explain why uptake of P
declines as moisture tension increases. Moisture films
connecting the roots and soil particles (represented by
four ST in our study) become thinner and the path
length of ion movement increases as the moisture
tension increases and these changes could reduce the
rate of P distribution to the roots.
Average concentration of P in pore water varied
significantly with Y 9 ST 9 IS. Our results have
shown that in 2014 and 2015, the lowest concentra-
tions of P in pore water were from IPro with mean
values of 0.284 ± 0.127 and 0.250 ± 0.001 mg L-1,
respectively. In 2015, SWP had the greatest concen-
tration of P in pore water with a mean of
0.276 ± 0.125 mg L-1 while the lowest concentra-
tion of P in pore water was from IPro with mean value
of 0.250 ± 0.001 mg L-1. The order of the concen-
trations of P in pore water when averaged across ST is
Nutr Cycl Agroecosyst (2017) 109:249–267 263
123
as follows: 2013 (IPro = NDVI = SWP); 2014
(IPro = SWP\NDVI); and 2015 (IPro\NDVI\ SWP). Our results have shown that the
different IS had minimized pore water concentrations
of P in soils under corn production in Coastal Plain
region. Since IPro method resulted in lower pore water
P concentrations, results indicate that this scheduling
method may be a way to reduce nutrient losses to
leaching on these Coastal Plains soils. Our results were
consistent with the early findings of Sigua et al.
(2016, 2017) on using IPro in minimizing the
concentration of pore water nitrate.
Effects of nutrient management
Phosphorus dynamics and phosphatase activities of
four ST in Coastal Plain region were not significantly
affected by NM. Additionally, we did not observe any
interaction effects among ST, IS and CS with NM on P
dynamics and phosphatase activities at all years in our
study. Our results were in agreement with Ajwa et al.
(1999) and Dillard et al. (2015). Ajwa et al. (1999)
observed that acid phosphatase activity was not
significantly different in plots that had been amended
with 0 and 100 kg N ha-1. These authors reported
further that there was no difference in acid phos-
phatase activity of either fertilized and unfertilized
soils. Similarly, Dillard et al. (2015) from their work
on the effects of nitrogen fertilization on soil nutrient
concentration and phosphatase activity reported no
significant effects of N fertilization on soil phos-
phatase activity and concentrations of water soluble P.
Olander and Vitosek (2000) suggested that the reason
of not observing any significant effect of N fertiliza-
tion on phosphatase activity in soils could be mediated
through direct use of N as a primary component of
N-rich enzymes, indirectly through increased produc-
tivity and P demand in response to alleviation of N
deficiency.
Our results suggest that addition of nitrogen
fertilizer at the rates of 157 and 224 kg N ha-1 had
negative feedbacks on phosphatase activity, which is
strongly supported by the results reported by Olander
and Vitosek (2000). If the levels of N are greater than
some threshold level ([ 100 kg N ha-1), phosphatase
activity could have a negative feedback and further
additions of the nutrient may result in additional
suppression of enzyme activity. Where N supply is
low, additions of N may stimulate production of
phosphatase because N is essential for enzyme
synthesis (Olander and Vitosek 2000). Dick et al.
(1988) found that N fertilization in agricultural
systems increased acid phosphatase activity, but
Clarholm (1993) found that N fertilization had no
effect on phosphatase activity. Therefore, negative
correlations between phosphatase activity and appli-
cation of N in our study are consistent with mechanism
where production or activity of the enzymes is
regulated or eventually inhibited by the large supply
of the nutrients from application of fertilizers
(McCarthy et al. 1992; Dick et al. 1994; Sinsabaugh
1994).
Effects of stages of corn growth
Phosphorus dynamics and uptake of P by plant roots
are both active processes in the soil that can be
affected by stages of plant growth (i.e., seedlings to
maturity). As water is taken up by plants at various
stages of growth to support transpiration, P may be
moved to the root surface through mass flow and could
alter P dynamics in general. Overall, P dynamics and
phosphatase activity varied significantly with CS.
Phosphorus uptake of corn had an increase of about
1200% from V6 to R1. Concentrations of MEP and
WSP in the soils (averaged across Y) showed a
declining trend from V6 to R1 stages of corn. Soil
MEP decreased significantly from V6 (51.2 ±
30.6 mg kg-1) to R1 (38.6 ± 16.1 mg kg-1). Con-
centration of WSP also decreased significantly from
V6 (6.2 mg kg-1) to R1 (4.2 mg kg-1). The two main
factors controlling the availability of soil P to plant
roots are the concentration of phosphate ions in the soil
solution and the ability of soil to replenish these ions
when roots remove them. Root length and diameter
and the efficiency of P uptake by the roots determine
the rate and extent of P uptake (Syers et al. 2008).
Phosphorus uptake of corn in our study was
consistent with the normal patterns of plant uptake.
Nutrient uptake parallels plant vegetative growth (V1
to V16) in many ways. Corn in our study take up the
majority of nutrients (685% increased) during the
periods of vegetative growth (V6 3.1 kg ha-1; V16
23.6 kg ha-1) and translocate stored nutrients to
developing grain during reproductive growth (silking
or R1 stage). Nutrient uptake increases rapidly from 4
to 6 leaf stage (V4 to V6), just prior to tasseling, and
then stays at high levels until after pollination. After
264 Nutr Cycl Agroecosyst (2017) 109:249–267
123
pollination, nutrient uptake slows down. Plant uptake
of P is governed by diffusive action of P in soils
(Stroira et al. 2007). Plant roots absorb P ions in
solution and P ions release from soil constituents. A
consensus exists that the diffusive supply of P in the
soil is the major mechanism governing P uptake of
plants (Hinsinger 1998). Adequate nutrients early in
the growing season are necessary to maximize yield
and ensure that nitrogen and P are available for good
grain or seed fill.
Summary and conclusion
A 3-year (2013–2015) field study was conducted to
evaluate the effect of integrated nutrient management
and three irrigation scheduling methods (IS): irrigator
pro (IPro); normalized difference vegetative index
(NDVI); and soil water potentials (SWP) on P
dynamics and concentration of phosphatase activity
in four Coastal Plains ST at various CS (V6, V16 and
R1) of corn. The dynamics of applied P in soils and its
cycling in agroecosystems are of increased interest
due to its contribution to the current environmental,
agronomic and economic issues on intensification of
agricultural production. The following conclusions are
drawn from this study:
1. Soil types have shown broad and significant
effects on P dynamics and phosphatase activity
in Coastal Plain soils under corn production.
Concentrations of P in corn tissues and pore water,
P uptake, MEP and WSP in our study varied
significantly with ST. This suggests that the effect
of ST on P transformation and phosphatase
activities could be huge in monitoring the tempo-
ral and spatial changes in various fractions of soil
P and for understanding the P cycling and
dynamics;
2. Phosphorus concentrations in plants, soils, pore
water, P uptake and phosphatase activity was not
significantly affected by IS. However, the inter-
action effects of ST 9 IS and ST 9 IS 9 CS
yielded highly significant effects on P uptake and
MEP and P concentrations in corn plants. These
results suggest that the effect of IS could had been
affected by the interactions of other factors like
the different ST and growth stages of corn;
3. Phosphorus dynamics and phosphatase activities
of four ST in Coastal Plain region were not
significantly affected by NM. Addition of nitrogen
fertilizer at the rates of 157 and 224 kg N ha-1
had negative feedbacks on phosphatase activity. If
the levels of N are greater than some threshold
level ([ 100 kg N ha-1), phosphatase activity
could have a negative feedback and further
additions of the nutrient may result in additional
suppression of enzyme activity; and
4. Overall, P dynamics and phosphatase activity
varied significantly with CS. Phosphorus uptake
of corn had an increase of about 1200% from V6
to R1. Concentrations of MEP and WSP in the
soils (averaged across year) showed a declining
trend from V6 to R1 stages of corn. Soil MEP
decreased significantly from V6 (51.2 ±
30.6 mg kg-1) to R1 (38.6 ± 16.1 mg kg-1).
Concentration of WSP also decreased signifi-
cantly from V6 (6.2 mg kg-1) to R1
(4.2 mg kg-1).
Overall, our results further suggest that understand-
ing of P inputs and outputs which include P accumu-
lation in soils and plants, as well as P losses is critical
to determining the environmental balance and
accountability of P in agricultural ecosystem. Clearly,
soil P dynamics have agronomic and environmental
importance that may impact the development of
effective and sustainable management plans.
Acknowledgements The information in this article has been
funded through the United States Department of Agriculture-
Agricultural Research Service National Program 211
(Improving Conservation Effectiveness; Project #
6082-13000-009-00D). We thank Mr. William T. Myers for
his field and laboratory assistance and Paul Shumaker for his
valuable assistance in laboratory analyses of soils.
References
Afandi GS, Khalil FA, Ouda SA (2010) Using irrigation
scheduling to increase water productivity of wheat-maize
rotation under climate change conditions. Chilean J Agric
Res 70(3):474–478
Ajwa HA, Curtis CJ, Rice CW (1999) Changes in enzyme
activities and microbial biomass of tallgrass prairie soil as
related to burning and nitrogen fertilization. Soil Biol
Biochem 31:769–777
Bahl GS, Singh NT (1986) Phosphorus diffusion in soils in
relation to some edaphic factors and its influence on P
uptake by maize and wheat. J Agric Sci Camb 107:335–341
Nutr Cycl Agroecosyst (2017) 109:249–267 265
123
Bausch WC (1993) Soil background effects on the reference-
based coefficients for corn. Remote Sens Environ
46:213–222
Berkheiser VE, Street JJ, Rao PSC, Yuan TL (1980) Partitioning
of inorganic orthophosphate in soil–water systems. CRC
Crit Rev Environ Control 10:179–224
Boyd SA, Mortland MM (1990) Enzyme interaction with clay
and clay organic matter complexes. Soil Biochem 6:1–28
Clarholm M (1993) Microbial biomass P, labile and acid
phosphatase activity in humus layer of a spruce forest, after
repeated additions of fertilizers. Biol Fertil Soils
16:287–292
Clarke JM, Campbell CA, Cutforth HW, Depauw RM, Win-
kleman GE (1990) Nitrogen and phosphorus uptake,
translocation and utilization efficiency of wheat in relation
to environment and cultivar yield and protein levels. Can J
Plant Sci 70:965–977
Cordell D, Drangert JO, White S (2009) The story of phos-
phorus: global food security and food for thought. Glob
Environ Change 19:292–305
Dalal RC, Hallsworth EG (1976) Evaluation of the parameters
of soil phosphorus availability factors in predicting yield
response and phosphorus uptake. Soil Sci Soc Am J
40:541–546
Davidson JI Jr, Griffin WJ, Lamb MC, Williams RG, Sullivan G
(1998a) Validation of EXNUT for scheduling peanut irri-
gation in North Carolina. Peanut Sci 25:50–58
Davidson JI Jr, Bennett CT, Tyson TW, Baldwin JA, Beasley JP,
Bader MJ, Tyson AW (1998b) Peanut irrigation manage-
ment using EXNUT and MOISNUT compute programs.
Peanut Sci 25:103–110
Dick RP, Rasumessen PE, Kerle EA (1988) Influence of long-
term residue management on soil enzyme activities in
relation to soil chemical properties of a wheat-fallow sys-
tem. Biol Fertil Soils 6:159–164
Dick RP, Sandor JA, Eash NS (1994) Soil enzyme activities
after 1500 years of terrace agriculture in the Colca Valley,
Peru. Agr Ecosyst Environ 50:123–131
Dillard SL, Wood CW, Wood BH, Feng Y, Owsley WF,
Muntifering RB (2015) Effects of nitrogen fertilization on
soil nutrient concentration and phosphatase activity and
forage nutrient uptake from a grazed pasture system.
J Environ Manag 154:208–215
Eivazi F, Tabatabai MA (1977) Phosphatases in soils. Soil Biol
Biochem 9:167–172
Enfield CG, Ellis R (1983) The movement of phosphorus in
soils. In: Chemical mobility and reactivity in soil systems.
SSSA Special Publication No. 11
Gilbert N (2009) Environment: the disappearing nutrient. Nat-
ure 461:716–718
Glenn EP, Neale CMU, Hunsaker DJ, Nagler PL (2011)
Vegetation index-based crop coefficients to estimate
evapotranspiration by remote sensing in agricultural and
natural ecosystems. Hydrol Process 25:4050–4062
Haefele SM, Naklang K, Harnpichitvitaya D, Jearakongman S,
Skulkhu E, Romye P (2006) Factors affecting rice yield and
fertilizer response in rainfed lowland of northeast Thailand.
Field Crop Res 98:39–51
Hansen JC, Cade-Menum BJ, Strawn DG (2004) Phosphorus
speciation in manure-amended alkaline soils. J Environ
Qual 33:1521–1527
Harrison AF (1981) Phosphorus in woodland soils. Inst Terr
Ecol 1980:36–43
Herbien SA, Neal JL (1990) Phosphatase activity in arctic
tundra soils disturbed by vehicles. Soil Biol Biochem
22:853–858
Hinsinger P (1998) How do plant roots acquire mineral nutri-
ents? Chemical processes involved in the rhizosphere. Adv
Agron 64:225–265
Hira GS, Singh NT (1977) Observed and predicted rates of
phosphorus diffusion in soils of varying bulk density and
water content. Soil Sci Soc Am J 41:537–540
Hooda PS, Rendell AR, Edwards AC, Withers PJ, Aitken MN,
Truesdale VW (2000) Relating soil P indices to potential P
release to water. J Environ Qual 29:904–910
Hossain MA, Begum S, Rahman AKMM, Arabinda S,
Salahuddin ABM (1996) Growth analysis of mustard and
rapeseed in relation to grain filling period and yield
potential. J Agric Res 34:359–369
Lamb MC, Master MH, Rowland D, Sorensen RB, Zhu H,
Blakenship RD, Butts CL (2004) Impact of sprinkler irri-
gation amount and rotation on peanut yield. Peanut Sci
31:108–113
Lamb MC, Rowland DL, Sorensen RB, Butts RB, Faircloth CL,
Nutt RC (2007) Economic returns of irrigated and non-
irrigated peanut based cropping systems. Peanut Sci
34:10–16
Mackay AD, Barber SA (1985) Soil moisture effects on root
growth and phosphorus uptake by corn. Agron J
77:519–523
Malcom RE (1983) Assessment of phosphatase activity in soils.
Soil Biol Biochem 15:403–408
Mandal LN, Khan SK (1972) Release of phosphorus from
insoluble phosphatic materials in acidic lowland rice soils.
J Indian Soc Soil Sci 20:19–25
Mathab SK, Godfrey CL, Sownboda AR, Thomas GW (1971)
Phosphorus diffusion in soils. I. The effect of applied P,
clay and water content. Soil Sci Soc Am J 35:393–397
McCarthy GW, Shogren DR, Bremner JM (1992) Regulations
of urease production in soils by microbial assimilation of
nitrogen. Biol Fertil Soils 12:261–264
Mehlich A (1953) Determination of P, Ca, Mg, K, Na and NH4.
North Carolina soil test division, Mimeo, Raleigh
Nannipieri P, Giagnoni L, Landi L, Renella G (2011) Role of
phosphatase enzymes in soil. In: Bunemann EK (ed)
Phosphorus in action. Soil Biol 26:215–243
Olander LP, Vitosek PM (2000) Regulation of soil phosphatase
and chitinase activity by N and P availability. Biochemistry
49:175–190
Olsen SR, Watanabe FS (1963) Diffusion of phosphorus as
related to soil texture and plant uptake. Soil Sci Soc Am
Proc 27:643–652
Omary M, Camp CR, Sadler EJ (1996) Center pivot irrigation
system modification to provide variable water applicaiton
depths. Appl Eng Agric 13(2):235–239
Porter LK, Kemper WD, Jackson RD, Stewart BA (1960)
Chloride diffusion in soils as influence by moisture content.
Soil Sci Soc Am Proc 24:460–463
Recio B, Rubio F, Lomban J, Ibanez J (1999) An econometric
irrigated crop allocation model for analyzing the impact of
water restriction policies. Agric Water Manag 42:47–63
266 Nutr Cycl Agroecosyst (2017) 109:249–267
123
Rosenzweig C, Hillel D (1998) Climate change and the global
harvest. Potential impacts of the greenhouse effect on
agriculture. Oxford University Press Inc., New York
SAS Institute (2000) SAS/STAT user’s guide. Release 6.03.
SAS Institute. Cary, NC
Sato S, Morgan KT (2012) Nutrient mobility and availability
with selected irrigation and drainage systems for veg-
etable crops on sandy soils. In: Soriano MH (ed) Soil health
and land management. pp 89–110
Sharpley AN, Turnley H (2000) Phosphorus research strategies
to meet agricultural and environmental challenges of 21st
century. J Environ Qual 29:176–181
Sharpley AN, Chapra SC, Wedepohl R, Sims R, Reddy Daniel
JT, Reddy KR (1992) Managing agricultural phosphorus
for protection of surface waters: issues and options. J En-
viron Qual 23:437–451
Shen J, Yuan L, Junling Z, Haigang L, Zhaohai B, Xinping C
(2011) Phosphorus dynamics: from soil to plant. Plant
Physiol 156:997–1005
Shigaki F, Sharpley A, Prochnow LI (2006) Animal-based
agriculture, phosphorus management and water quality in
Brazil: options for the future. Sci Agric 63:194–209
Sigua GC, Williams MJ, Coleman SW, Starks R (2005) Nitro-
gen and phosphorus status of soils and trophic state of lakes
associated with forage-based beef cattle operations in
Florida. J Environ Qual 35(1):240–252
Sigua GC, Coleman SW, Albano JP (2009) Quantifying soil
organic carbon in forage-based cow-calf congregation-
grazing zone interface. Nutr Cycl Agroecosyst 85(3):
215–223
Sigua GC, Hubbard RK, Coleman SW (2010) Quantifying
phosphorus levels in soils, plants, surface water and shal-
low groundwater associated with bahiagrass-based pas-
tures. Environ Sci Pollut Res J 17:210–2019
Sigua GC, Coleman SW, Albano A, Williams M (2011) Spatial
distribution of soil phosphorus and herbage mass in beef
cattle pastures: effects of slope aspect and slope position.
Nutr Cycl Agroecosyst 89:59–70
Sigua GC, Chase CC, Albano J (2013) Soil-extractable phos-
phorus and phosphorus saturation threshold in beef cattle
pastures as affected by grazing management and forage
type. Environ Sci Pollut Res 21(3):1691–1700
Sigua GC, Stone KC, Bauer PJ, Szogi AA (2016) Nitrate
leaching, water-use efficiency and yield of corn with dif-
ferent irrigation and nitrogen management systems in
Coastal Plains, USA. WIT Trans Ecol Environ
203:159–170
Sigua GC, Stone KC, Bauer PJ, Szogi AA, Shumaker PD (2017)
Impacts of irrigation scheduling on pore water nitrate and
phosphate in coastal plain region of the United States.
Agric Water Manage 186:75–85
Sinsabaugh RL (1994) Enzymic analysis of microbial pattern
and process. Biol Fertil Soils 17:69–74
Stone KC, Bauer PJ, Busscher WJ, Millen JA, Evans DE,
Strickland EE (2015) Variable-rate irrigation management
using an expert system in the eastern coastal plain. Irrig Sci
33:167–175
Stone KC, Bauer PJ, Sigua GC (2016) Irrigation management
using an expert system, soil water potentials and vegetative
indices for spatial applications. ASAE, St. Joseph
Stroira C, Morel C, Jouany C (2007) Nitrogen fertilization
effects on grassland soil acidification: consequences on
diffusive phosphorus ions. Soil Sci Soc Am J 75:112–120
Syers JK, Johnson AE, Curtin D (2008) Efficiency of soil and
fertilizer phosphorus use. FAO Fertilizer and Plant Nutri-
tion Bulletin 18. Rome, Italy, p 108
Tabatabai MA (1994) Soil enzymes. In: Weaver RW, Angle S,
Bottomley P, Bezdisek D, Smith S, Tabatabai A, Wollum
A (eds) Methods of soil analysis. Part 2. Microbiological
and biochemical properties. Soil Science Society-America,
Madison, pp 775–833
Turk MA, Tawaha AM (2002) Impact of seedling rate, seeding
date, rate and methods of phosphorus application in faba
bean (Vicia faba, L) in the absence of moisture stress.
Biotechnol Agron Soc Environ 6:171–178
Turner BL, Richardson AE, Mullaney EJ (2007) Inositol
phosphates: linking agriculture and the environment. CAB
International, Wallingford, p 304
Vig AC, Dev G (1979) Kinetics of phosphate desorption in soils.
J Nucl Agric Biol 8:62–66
Yousaf M, Fahad A, Shah AN, Khan MJ, Saiel SAI, Ali SAI,
Wang Y, Osman KA (2014) The effect of nitrogen appli-
cation rates and timing of first irrigation on wheat growth
and yield. J Agric Innov Res 2(4):645–653
Nutr Cycl Agroecosyst (2017) 109:249–267 267
123