Embed Size (px)
Citation preview
Available online at www.sciencedirect.com
s 71 (2008) 99–111www.elsevier.com/locate/jmarsys
Journal of Marine System
Phosphorus pool variations and their relation to cyanobacteriadevelopment in the Baltic Sea: A three-year study
Monika Nausch ⁎, Günther Nausch, Norbert Wasmund, Klaus Nagel
Baltic Sea Research Institute Warnemünde, Seestrasse 15, D-18119 Rostock-Warnemünde, Germany
Received 11 September 2006; received in revised form 13 March 2007; accepted 6 June 2007Available online 21 June 2007
Abstract
Diazotrophic cyanobacteria are the dominant organisms in the phytoplankton community in summer in the Baltic Sea, and canform huge surface blooms. The excess of dissolved inorganic phosphorus (DIP) after the spring phytoplankton bloom in May andits decline until summer has been used in calculations and modelling of nitrogen fixation rates. However, this method was basedmainly on data obtained in May and July or August. The period of cyanobacteria development was not covered. In 2001, 2004 and2005, from May until August, phosphorus and other pool concentrations were investigated at a higher resolution, and related tocyanobacteria development to restore this temporal inconsistency. This study addresses the importance for cyanobacteriadevelopment of (a) winter convection, (b) the DIP excess in May, and (c) organic phosphorus pools. Our results did not show arelationship between DIP concentrations in May, as a result of convection processes in winter and assimilation by phytoplankton inthe spring bloom, and the occurrence or intensity of cyanobacteria blooms in summer. The DIP excess in May was not additivelystored as particulate organic phosphorus (POP) during its disappearance. It did, however, equate the current POP in the same orderof magnitude as POP was exported. Thus, the POP pool remained constant until June. The DIP excess supported only between46.8% and 84.6% of the new phytoplankton production in June, requiring an additional phosphorus source for summer autotrophy.Cyanobacteria seem to develop in July on the basis of POP measured in June. In 2001, this source was enough to explaincyanobacteria biomass increase, which was accompanied by an increase in particulate C:P ratio. In 2005, this process was unable toexplain the biomass production in July supporting the requirement for additional phosphorus. In summary, the use of DIP excess inMay is insufficient for modelling cyanobacteria blooms and the calculation of nitrogen fixation by cyanobacteria in summer: usingMay excess DIP results in an underestimation of the possible summer fixation rate. Additional phosphorus sources, which are notincluded in the calculations, seem to be necessary.© 2007 Elsevier B.V. All rights reserved.
Keywords: Phosphorus; Cyanobacteria; Baltic Sea
⁎ Corresponding author. Tel.: +49 381 5197 227; fax: +49 381 5197440.
E-mail address: [email protected](M. Nausch).
0924-7963/$ - see front matter © 2007 Elsevier B.V. All rights reserved.doi:10.1016/j.jmarsys.2007.06.004
1. Introduction
The heterocystous cyanobacteria Nodularia spumi-gena and Aphanizomenon sp. are the dominatingnitrogen-fixing species in the Baltic Sea (Kononen,1992; Wasmund, 1997; Finni et al., 2001). They arethe only diazotrophic cyanobacteria species that form
100 M. Nausch et al. / Journal of Marine Systems 71 (2008) 99–111
blooms in brackish water (Sellner, 1997). Their effect onthe ecosystem is manifold. They form huge blooms insummer and affect nutrient cycles by introducing newnitrogen via dinitrogen fixation. Sedimentation of 35 gm−2 year−1 particulate matter (Struck et al., 2004) andits remineralization influences oxygen conditions indeep basins, leading to oxygen exhaustion and hydrogensulphide production within two to three years after anoxygen enriched salt water inflow from the North Sea(Feistel et al., 2003; Nausch et al., 2003). In addition, N.spumigena reduces water quality by producing the toxinnodularin (Sellner, 1997) and aesthetically unpleasantconditions for recreational activities (Galat and Verdin,1989; Mazur-Marzec et al., 2006).
Preconditions for the development of diazotrophiccyanobacteria have been described many times formarine (Carpenter et al., 1992; Karl et al., 2002) andfreshwater ecosystems (Berman et al., 1998; Berman,2001). One of the most important preconditions is a lowN:P ratio of inorganic nutrients (Niemi, 1979; Smith,1990; Pollinger et al., 1998; Levings and Schindler,1999) and the availability of dissolved inorganicphosphorus (DIP) in water when dissolved inorganicnitrogen (DIN) is already exhausted (Kononen et al.,1996; Liao, 1977; Rydin et al., 2002). This preconditionexists in the Baltic Sea. In comparison with the Redfieldratio (Redfield et al., 1963), the low N:P ratio of about8:1 in the winter surface layer (Matthäus et al., 2001),generated by vertical convection, is the result ofdenitrification and DIP release in the anoxic deepwater (Niemi, 1979; Hille et al., 2005). It causes theexhaustion of DIN by the spring phytoplankton bloom,whereas an excess of DIP remains if nitrogen andphosphorus are taken up according to the Redfield ratio(Redfield et al., 1963). The remaining DIP declines untilsummer, when diazotrophic cyanobacteria appear, oftenin high biomass. Therefore, it is assumed that the diazo-trophic cyanobacteria use the excess DIP for growth.This assumption has been the basis for calculations andmodelling of new primary production and of nitrogenfixation rates (Rahm et al., 2000; Wasmund et al.,2005a, b). Janssen et al. (2004) explained the inter-annual variability of cyanobacteria blooms in the BalticSea using a three-dimensional ecosystem model. Ac-cording to their hypothesis, an increased convectiondepth generated by stronger wind in winter causeselevated DIP input into the surface layer, with theconsequence that more DIP remains after the springbloom, ideal preconditions for subsequent cyanobacteriadevelopment.
Algae and cyanobacteria store phosphate internallywhen DIP is available (Elgavish et al., 1982; Thompson
et al., 1994) and reduce this internal phosphorus duringfurther growth as DIP is depleted (Gage and Gorham,1985). The same mechanism has been described for thedevelopment of heterocystous cyanobacteria in theBaltic Sea (Larsson et al., 2001). It is supported byhigh C: P ratios in particulate material, often observed insummer (Groenlund et al., 1996; Larsson et al., 2001;Nausch et al., 2004). If the DIP excess in May is takenup and stored by cyanobacteria, the DIP decline fromMay onwards should be reflected in an increase in theorganic phosphorus pool.
Hitherto, calculations and modelling (Rahm et al.,2000; Janssen et al., 2004) to explore P-cyanobacteriarelationship have been based predominantly on datafrom monitoring cruises undertaken through the Hel-sinki Convention. Monitoring cruises are performed atintervals of two or three months, one in May and thefollowing in the second half of July or in August, beforeand after main cyanobacteria development, from June toJuly (Wasmund et al., 2005b). There is measurable DIPin May and absence in summer when heterocystouscyanobacteria normally occur. From these data, the useof DIP excess can be deduced logically. However,investigations of phosphorus pool changes duringcyanobacteria development are scarce. In 2001, 2004and 2005, phosphorus and biomass pool sizes werestudied from May until the second half of July at ahigher temporal resolution, to close this gap. Inparticular, two questions were examined: (1) is theDIP excess in May the basis for subsequent phyto-plankton development; and (2) to what extent is theorganic phosphorus pool involved in cyanobacterianutrition?
2. Material and methods
2.1. Water sampling and hydrographic conditions
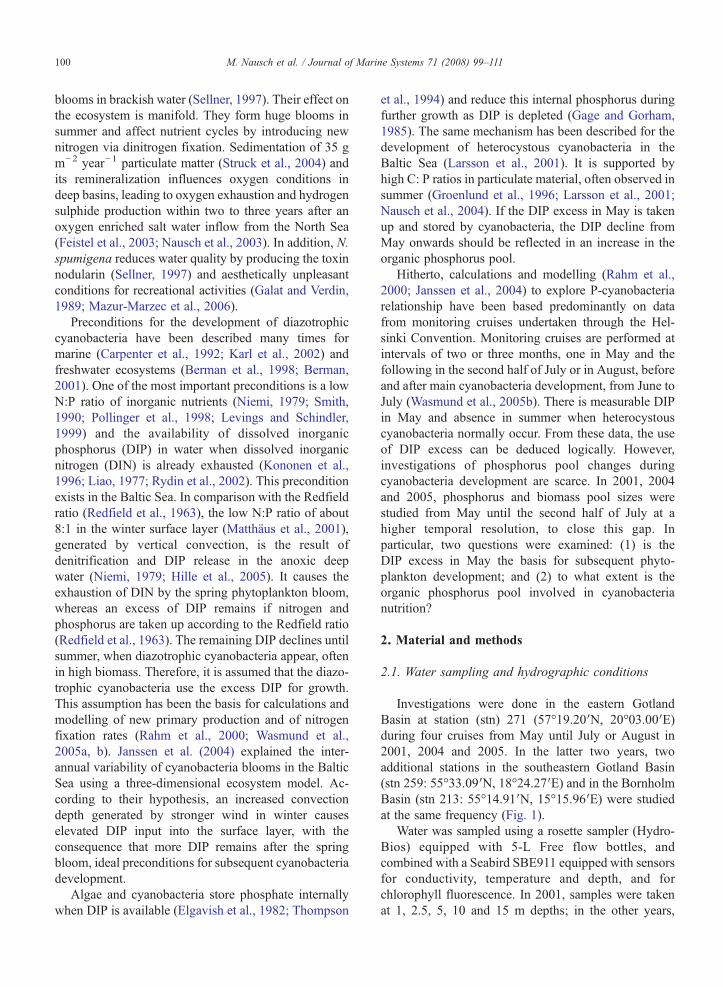
Investigations were done in the eastern GotlandBasin at station (stn) 271 (57°19.20′N, 20°03.00′E)during four cruises from May until July or August in2001, 2004 and 2005. In the latter two years, twoadditional stations in the southeastern Gotland Basin(stn 259: 55°33.09′N, 18°24.27′E) and in the BornholmBasin (stn 213: 55°14.91′N, 15°15.96′E) were studiedat the same frequency (Fig. 1).
Water was sampled using a rosette sampler (Hydro-Bios) equipped with 5-L Free flow bottles, andcombined with a Seabird SBE911 equipped with sensorsfor conductivity, temperature and depth, and forchlorophyll fluorescence. In 2001, samples were takenat 1, 2.5, 5, 10 and 15 m depths; in the other years,
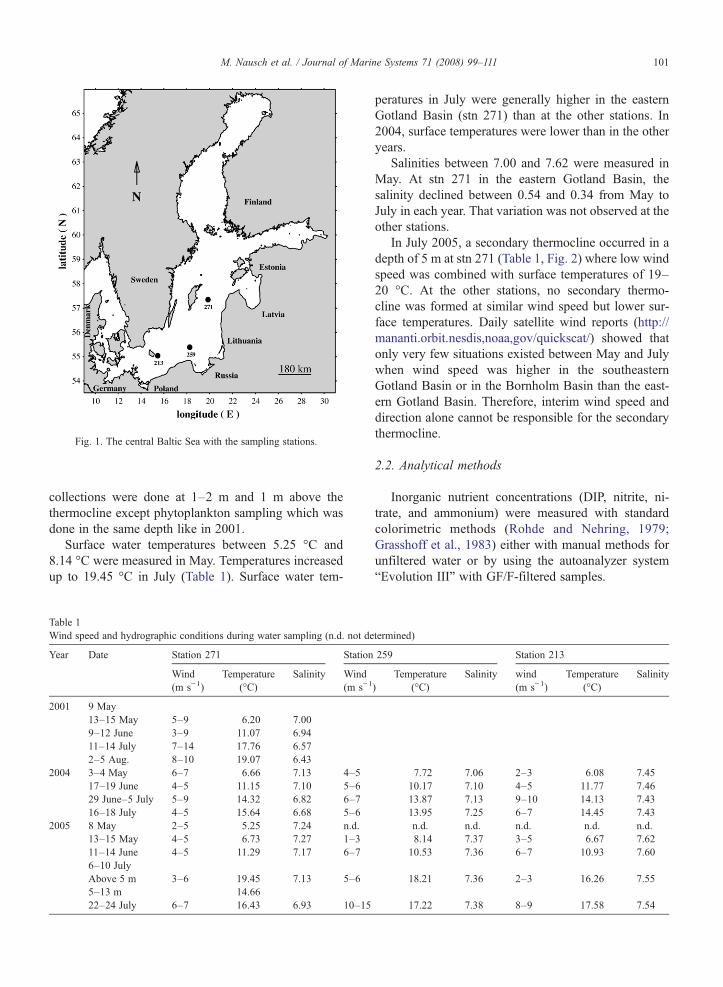
Fig. 1. The central Baltic Sea with the sampling stations.
101M. Nausch et al. / Journal of Marine Systems 71 (2008) 99–111
collections were done at 1–2 m and 1 m above thethermocline except phytoplankton sampling which wasdone in the same depth like in 2001.
Surface water temperatures between 5.25 °C and8.14 °C were measured in May. Temperatures increasedup to 19.45 °C in July (Table 1). Surface water tem-
Table 1Wind speed and hydrographic conditions during water sampling (n.d. not de
Year Date Station 271 Station
Wind(m s−1)
Temperature(°C)
Salinity Wind(m s−1
2001 9 May13–15 May 5–9 6.20 7.009–12 June 3–9 11.07 6.9411–14 July 7–14 17.76 6.572–5 Aug. 8–10 19.07 6.43
2004 3–4 May 6–7 6.66 7.13 4–517–19 June 4–5 11.15 7.10 5–629 June–5 July 5–9 14.32 6.82 6–716–18 July 4–5 15.64 6.68 5–6
2005 8 May 2–5 5.25 7.24 n.d.13–15 May 4–5 6.73 7.27 1–311–14 June 4–5 11.29 7.17 6–76–10 JulyAbove 5 m 3–6 19.45 7.13 5–65–13 m 14.6622–24 July 6–7 16.43 6.93 10–15
peratures in July were generally higher in the easternGotland Basin (stn 271) than at the other stations. In2004, surface temperatures were lower than in the otheryears.
Salinities between 7.00 and 7.62 were measured inMay. At stn 271 in the eastern Gotland Basin, thesalinity declined between 0.54 and 0.34 from May toJuly in each year. That variation was not observed at theother stations.
In July 2005, a secondary thermocline occurred in adepth of 5 m at stn 271 (Table 1, Fig. 2) where low windspeed was combined with surface temperatures of 19–20 °C. At the other stations, no secondary thermo-cline was formed at similar wind speed but lower sur-face temperatures. Daily satellite wind reports (http://mananti.orbit.nesdis,noaa,gov/quickscat/) showed thatonly very few situations existed between May and Julywhen wind speed was higher in the southeasternGotland Basin or in the Bornholm Basin than the east-ern Gotland Basin. Therefore, interim wind speed anddirection alone cannot be responsible for the secondarythermocline.
2.2. Analytical methods
Inorganic nutrient concentrations (DIP, nitrite, ni-trate, and ammonium) were measured with standardcolorimetric methods (Rohde and Nehring, 1979;Grasshoff et al., 1983) either with manual methods forunfiltered water or by using the autoanalyzer system“Evolution III” with GF/F-filtered samples.
termined)
259 Station 213
)Temperature
(°C)Salinity wind
(m s−1)Temperature
(°C)Salinity
7.72 7.06 2–3 6.08 7.4510.17 7.10 4–5 11.77 7.4613.87 7.13 9–10 14.13 7.4313.95 7.25 6–7 14.45 7.43n.d. n.d. n.d. n.d. n.d.8.14 7.37 3–5 6.67 7.6210.53 7.36 6–7 10.93 7.60
18.21 7.36 2–3 16.26 7.55
17.22 7.38 8–9 17.58 7.54
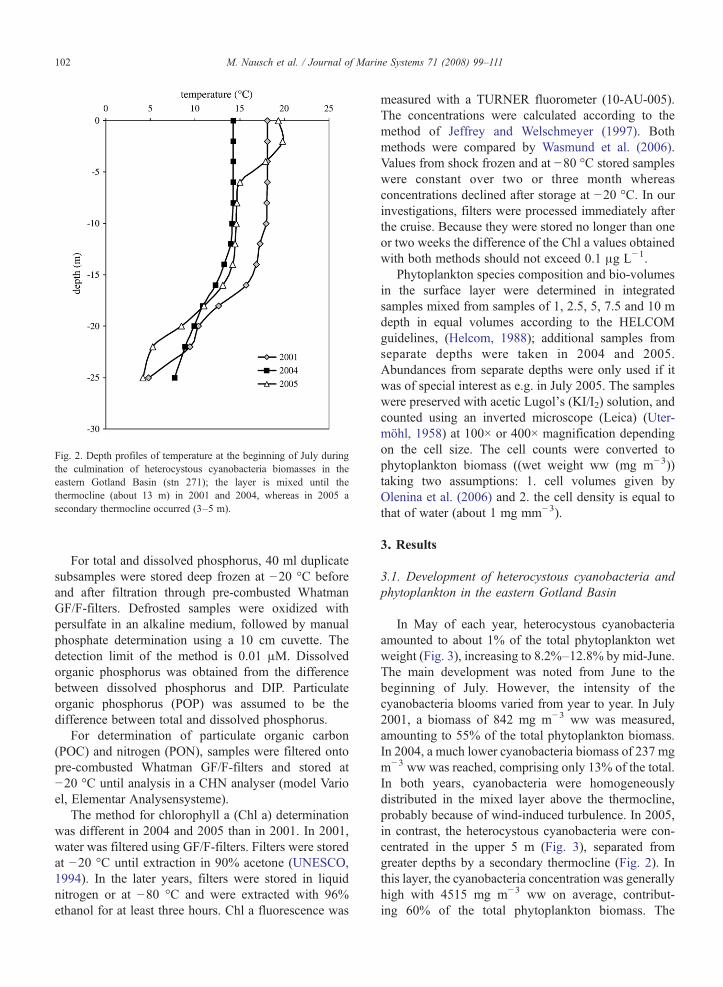
Fig. 2. Depth profiles of temperature at the beginning of July duringthe culmination of heterocystous cyanobacteria biomasses in theeastern Gotland Basin (stn 271); the layer is mixed until thethermocline (about 13 m) in 2001 and 2004, whereas in 2005 asecondary thermocline occurred (3–5 m).
102 M. Nausch et al. / Journal of Marine Systems 71 (2008) 99–111
For total and dissolved phosphorus, 40 ml duplicatesubsamples were stored deep frozen at −20 °C beforeand after filtration through pre-combusted WhatmanGF/F-filters. Defrosted samples were oxidized withpersulfate in an alkaline medium, followed by manualphosphate determination using a 10 cm cuvette. Thedetection limit of the method is 0.01 μM. Dissolvedorganic phosphorus was obtained from the differencebetween dissolved phosphorus and DIP. Particulateorganic phosphorus (POP) was assumed to be thedifference between total and dissolved phosphorus.
For determination of particulate organic carbon(POC) and nitrogen (PON), samples were filtered ontopre-combusted Whatman GF/F-filters and stored at−20 °C until analysis in a CHN analyser (model Varioel, Elementar Analysensysteme).
The method for chlorophyll a (Chl a) determinationwas different in 2004 and 2005 than in 2001. In 2001,water was filtered using GF/F-filters. Filters were storedat −20 °C until extraction in 90% acetone (UNESCO,1994). In the later years, filters were stored in liquidnitrogen or at −80 °C and were extracted with 96%ethanol for at least three hours. Chl a fluorescence was
measured with a TURNER fluorometer (10-AU-005).The concentrations were calculated according to themethod of Jeffrey and Welschmeyer (1997). Bothmethods were compared by Wasmund et al. (2006).Values from shock frozen and at −80 °C stored sampleswere constant over two or three month whereasconcentrations declined after storage at −20 °C. In ourinvestigations, filters were processed immediately afterthe cruise. Because they were stored no longer than oneor two weeks the difference of the Chl a values obtainedwith both methods should not exceed 0.1 μg L−1.
Phytoplankton species composition and bio-volumesin the surface layer were determined in integratedsamples mixed from samples of 1, 2.5, 5, 7.5 and 10 mdepth in equal volumes according to the HELCOMguidelines, (Helcom, 1988); additional samples fromseparate depths were taken in 2004 and 2005.Abundances from separate depths were only used if itwas of special interest as e.g. in July 2005. The sampleswere preserved with acetic Lugol's (KI/I2) solution, andcounted using an inverted microscope (Leica) (Uter-möhl, 1958) at 100× or 400× magnification dependingon the cell size. The cell counts were converted tophytoplankton biomass ((wet weight ww (mg m−3))taking two assumptions: 1. cell volumes given byOlenina et al. (2006) and 2. the cell density is equal tothat of water (about 1 mg mm−3).
3. Results
3.1. Development of heterocystous cyanobacteria andphytoplankton in the eastern Gotland Basin
In May of each year, heterocystous cyanobacteriaamounted to about 1% of the total phytoplankton wetweight (Fig. 3), increasing to 8.2%–12.8% by mid-June.The main development was noted from June to thebeginning of July. However, the intensity of thecyanobacteria blooms varied from year to year. In July2001, a biomass of 842 mg m−3 ww was measured,amounting to 55% of the total phytoplankton biomass.In 2004, a much lower cyanobacteria biomass of 237 mgm−3 ww was reached, comprising only 13% of the total.In both years, cyanobacteria were homogeneouslydistributed in the mixed layer above the thermocline,probably because of wind-induced turbulence. In 2005,in contrast, the heterocystous cyanobacteria were con-centrated in the upper 5 m (Fig. 3), separated fromgreater depths by a secondary thermocline (Fig. 2). Inthis layer, the cyanobacteria concentration was generallyhigh with 4515 mg m−3 ww on average, contribut-ing 60% of the total phytoplankton biomass. The
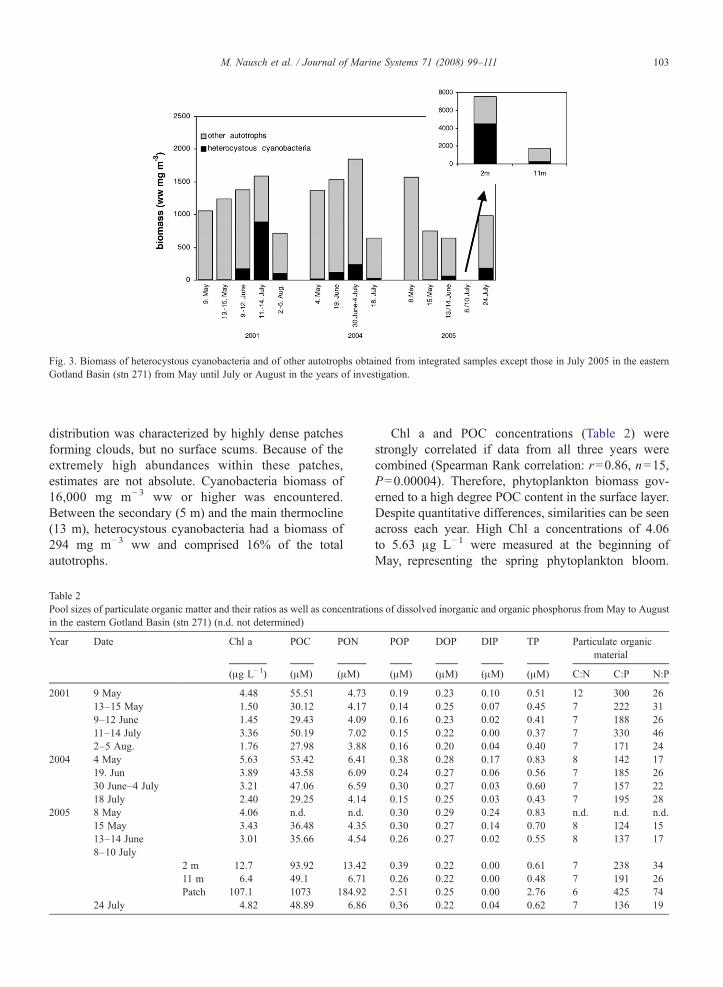
Fig. 3. Biomass of heterocystous cyanobacteria and of other autotrophs obtained from integrated samples except those in July 2005 in the easternGotland Basin (stn 271) from May until July or August in the years of investigation.
103M. Nausch et al. / Journal of Marine Systems 71 (2008) 99–111
distribution was characterized by highly dense patchesforming clouds, but no surface scums. Because of theextremely high abundances within these patches,estimates are not absolute. Cyanobacteria biomass of16,000 mg m− 3 ww or higher was encountered.Between the secondary (5 m) and the main thermocline(13 m), heterocystous cyanobacteria had a biomass of294 mg m−3 ww and comprised 16% of the totalautotrophs.
Table 2Pool sizes of particulate organic matter and their ratios as well as concentratioin the eastern Gotland Basin (stn 271) (n.d. not determined)
Year Date Chl a POC PON
(μg L−1) (μM) (μM)
2001 9 May 4.48 55.51 4.7313–15 May 1.50 30.12 4.179–12 June 1.45 29.43 4.0911–14 July 3.36 50.19 7.022–5 Aug. 1.76 27.98 3.88
2004 4 May 5.63 53.42 6.4119. Jun 3.89 43.58 6.0930 June–4 July 3.21 47.06 6.5918 July 2.40 29.25 4.14
2005 8 May 4.06 n.d. n.d.15 May 3.43 36.48 4.3513–14 June 3.01 35.66 4.548–10 July
2 m 12.7 93.92 13.4211 m 6.4 49.1 6.71Patch 107.1 1073 184.92
24 July 4.82 48.89 6.86
Chl a and POC concentrations (Table 2) werestrongly correlated if data from all three years werecombined (Spearman Rank correlation: r=0.86, n=15,P=0.00004). Therefore, phytoplankton biomass gov-erned to a high degree POC content in the surface layer.Despite quantitative differences, similarities can be seenacross each year. High Chl a concentrations of 4.06to 5.63 μg L−1 were measured at the beginning ofMay, representing the spring phytoplankton bloom.
ns of dissolved inorganic and organic phosphorus from May to August
POP DOP DIP TP Particulate organicmaterial
(μM) (μM) (μM) (μM) C:N C:P N:P
0.19 0.23 0.10 0.51 12 300 260.14 0.25 0.07 0.45 7 222 310.16 0.23 0.02 0.41 7 188 260.15 0.22 0.00 0.37 7 330 460.16 0.20 0.04 0.40 7 171 240.38 0.28 0.17 0.83 8 142 170.24 0.27 0.06 0.56 7 185 260.30 0.27 0.03 0.60 7 157 220.15 0.25 0.03 0.43 7 195 280.30 0.29 0.24 0.83 n.d. n.d. n.d.0.30 0.27 0.14 0.70 8 124 150.26 0.27 0.02 0.55 8 137 17
0.39 0.22 0.00 0.61 7 238 340.26 0.22 0.00 0.48 7 191 262.51 0.25 0.00 2.76 6 425 740.36 0.22 0.04 0.62 7 136 19
104 M. Nausch et al. / Journal of Marine Systems 71 (2008) 99–111
Concentrations then declined down to 1.4 or 3.45 μgL−1 until June. Intense cyanobacteria development inthe first half of July, as observed in 2001 and 2005,resulted in an increase in Chl a concentration to 3.36 and12.7 μg L−1, respectively. The increase in heterocystouscyanobacteria biomass was larger than the increase ofChl a and POC concentrations, indicating that some ofthe phytoplankton were replaced by trichomous withlower cellular pigment and carbon content. For example,in 2001, POC doubled from June to July whereasheterocystous cyanobacteria increased by a factor of 5.The low cyanobacteria biomass peak in 2004 did notelevate Chl a and POC concentrations.
3.2. Variability of phosphorus pools in the easternGotland Basin
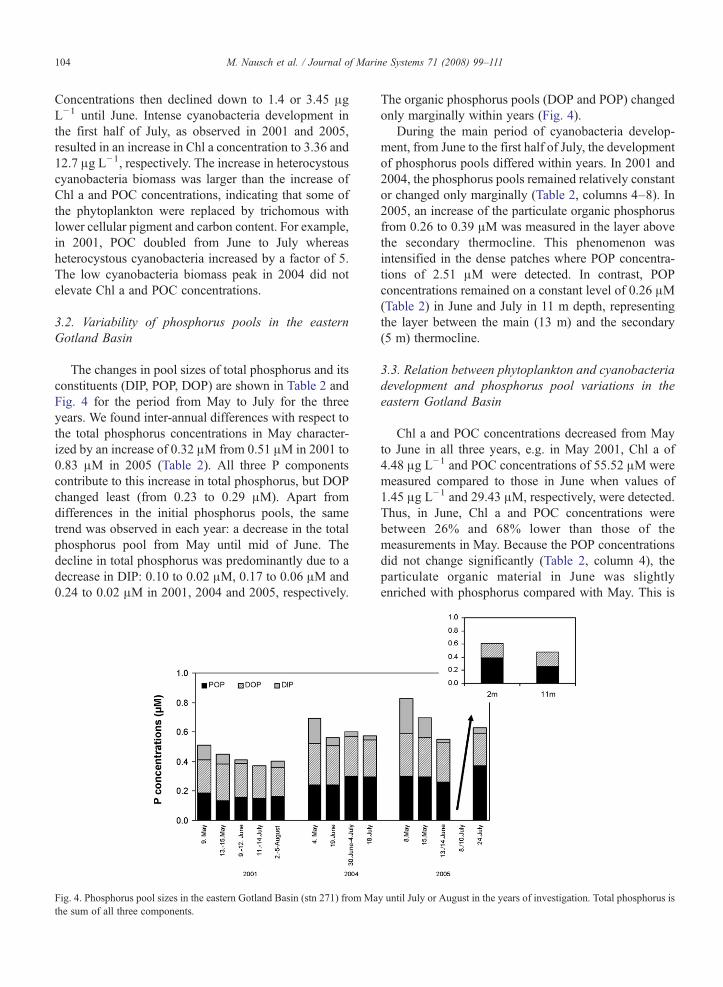
The changes in pool sizes of total phosphorus and itsconstituents (DIP, POP, DOP) are shown in Table 2 andFig. 4 for the period from May to July for the threeyears. We found inter-annual differences with respect tothe total phosphorus concentrations in May character-ized by an increase of 0.32 μM from 0.51 μM in 2001 to0.83 μM in 2005 (Table 2). All three P componentscontribute to this increase in total phosphorus, but DOPchanged least (from 0.23 to 0.29 μM). Apart fromdifferences in the initial phosphorus pools, the sametrend was observed in each year: a decrease in the totalphosphorus pool from May until mid of June. Thedecline in total phosphorus was predominantly due to adecrease in DIP: 0.10 to 0.02 μM, 0.17 to 0.06 μM and0.24 to 0.02 μM in 2001, 2004 and 2005, respectively.
Fig. 4. Phosphorus pool sizes in the eastern Gotland Basin (stn 271) from Mathe sum of all three components.
The organic phosphorus pools (DOP and POP) changedonly marginally within years (Fig. 4).
During the main period of cyanobacteria develop-ment, from June to the first half of July, the developmentof phosphorus pools differed within years. In 2001 and2004, the phosphorus pools remained relatively constantor changed only marginally (Table 2, columns 4–8). In2005, an increase of the particulate organic phosphorusfrom 0.26 to 0.39 μM was measured in the layer abovethe secondary thermocline. This phenomenon wasintensified in the dense patches where POP concentra-tions of 2.51 μM were detected. In contrast, POPconcentrations remained on a constant level of 0.26 μM(Table 2) in June and July in 11 m depth, representingthe layer between the main (13 m) and the secondary(5 m) thermocline.
3.3. Relation between phytoplankton and cyanobacteriadevelopment and phosphorus pool variations in theeastern Gotland Basin
Chl a and POC concentrations decreased from Mayto June in all three years, e.g. in May 2001, Chl a of4.48 μg L−1 and POC concentrations of 55.52 μM weremeasured compared to those in June when values of1.45 μg L−1 and 29.43 μM, respectively, were detected.Thus, in June, Chl a and POC concentrations werebetween 26% and 68% lower than those of themeasurements in May. Because the POP concentrationsdid not change significantly (Table 2, column 4), theparticulate organic material in June was slightlyenriched with phosphorus compared with May. This is
y until July or August in the years of investigation. Total phosphorus is
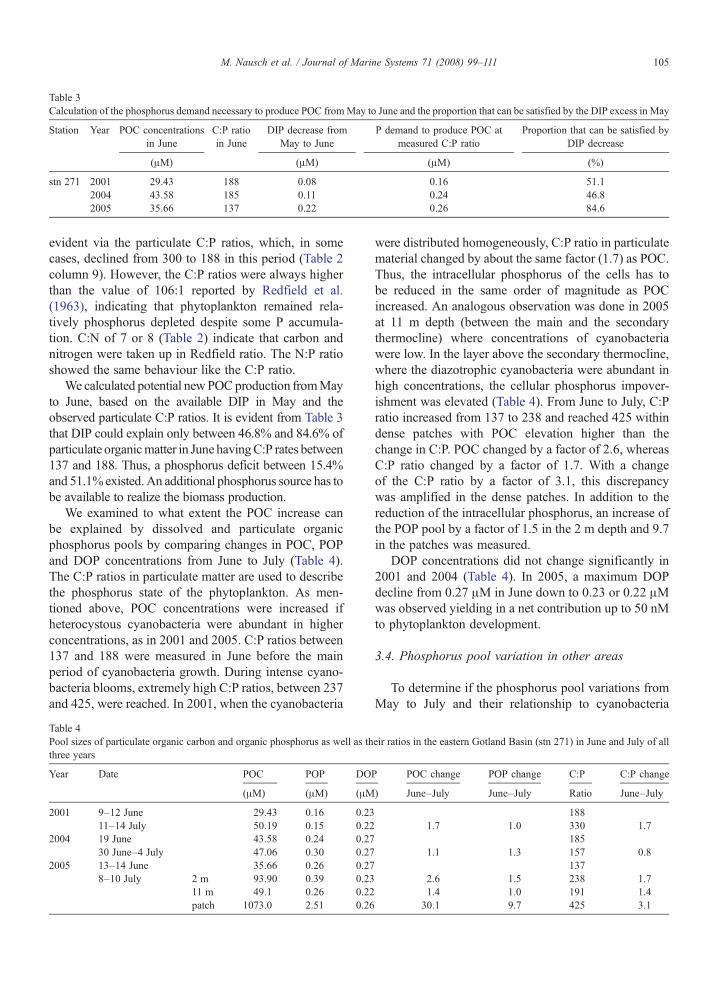
Table 3Calculation of the phosphorus demand necessary to produce POC fromMay to June and the proportion that can be satisfied by the DIP excess in May
Station Year POC concentrationsin June
C:P ratioin June
DIP decrease fromMay to June
P demand to produce POC atmeasured C:P ratio
Proportion that can be satisfied byDIP decrease
(μM) (μM) (μM) (%)
stn 271 2001 29.43 188 0.08 0.16 51.12004 43.58 185 0.11 0.24 46.82005 35.66 137 0.22 0.26 84.6
105M. Nausch et al. / Journal of Marine Systems 71 (2008) 99–111
evident via the particulate C:P ratios, which, in somecases, declined from 300 to 188 in this period (Table 2column 9). However, the C:P ratios were always higherthan the value of 106:1 reported by Redfield et al.(1963), indicating that phytoplankton remained rela-tively phosphorus depleted despite some P accumula-tion. C:N of 7 or 8 (Table 2) indicate that carbon andnitrogen were taken up in Redfield ratio. The N:P ratioshowed the same behaviour like the C:P ratio.
We calculated potential newPOCproduction fromMayto June, based on the available DIP in May and theobserved particulate C:P ratios. It is evident from Table 3that DIP could explain only between 46.8% and 84.6% ofparticulate organicmatter in June havingC:P rates between137 and 188. Thus, a phosphorus deficit between 15.4%and 51.1%existed.An additional phosphorus source has tobe available to realize the biomass production.
We examined to what extent the POC increase canbe explained by dissolved and particulate organicphosphorus pools by comparing changes in POC, POPand DOP concentrations from June to July (Table 4).The C:P ratios in particulate matter are used to describethe phosphorus state of the phytoplankton. As men-tioned above, POC concentrations were increased ifheterocystous cyanobacteria were abundant in higherconcentrations, as in 2001 and 2005. C:P ratios between137 and 188 were measured in June before the mainperiod of cyanobacteria growth. During intense cyano-bacteria blooms, extremely high C:P ratios, between 237and 425, were reached. In 2001, when the cyanobacteria
Table 4Pool sizes of particulate organic carbon and organic phosphorus as well as ththree years
Year Date POC POP DO
(μM) (μM) (μM
2001 9–12 June 29.43 0.16 0.2311–14 July 50.19 0.15 0.22
2004 19 June 43.58 0.24 0.2730 June–4 July 47.06 0.30 0.27
2005 13–14 June 35.66 0.26 0.278–10 July 2 m 93.90 0.39 0.23
11 m 49.1 0.26 0.22patch 1073.0 2.51 0.26
were distributed homogeneously, C:P ratio in particulatematerial changed by about the same factor (1.7) as POC.Thus, the intracellular phosphorus of the cells has tobe reduced in the same order of magnitude as POCincreased. An analogous observation was done in 2005at 11 m depth (between the main and the secondarythermocline) where concentrations of cyanobacteriawere low. In the layer above the secondary thermocline,where the diazotrophic cyanobacteria were abundant inhigh concentrations, the cellular phosphorus impover-ishment was elevated (Table 4). From June to July, C:Pratio increased from 137 to 238 and reached 425 withindense patches with POC elevation higher than thechange in C:P. POC changed by a factor of 2.6, whereasC:P ratio changed by a factor of 1.7. With a changeof the C:P ratio by a factor of 3.1, this discrepancywas amplified in the dense patches. In addition to thereduction of the intracellular phosphorus, an increase ofthe POP pool by a factor of 1.5 in the 2 m depth and 9.7in the patches was measured.
DOP concentrations did not change significantly in2001 and 2004 (Table 4). In 2005, a maximum DOPdecline from 0.27 μM in June down to 0.23 or 0.22 μMwas observed yielding in a net contribution up to 50 nMto phytoplankton development.
3.4. Phosphorus pool variation in other areas
To determine if the phosphorus pool variations fromMay to July and their relationship to cyanobacteria
eir ratios in the eastern Gotland Basin (stn 271) in June and July of all
P POC change POP change C:P C:P change
) June–July June–July Ratio June–July
1881.7 1.0 330 1.7
1851.1 1.3 157 0.8
1372.6 1.5 238 1.71.4 1.0 191 1.430.1 9.7 425 3.1
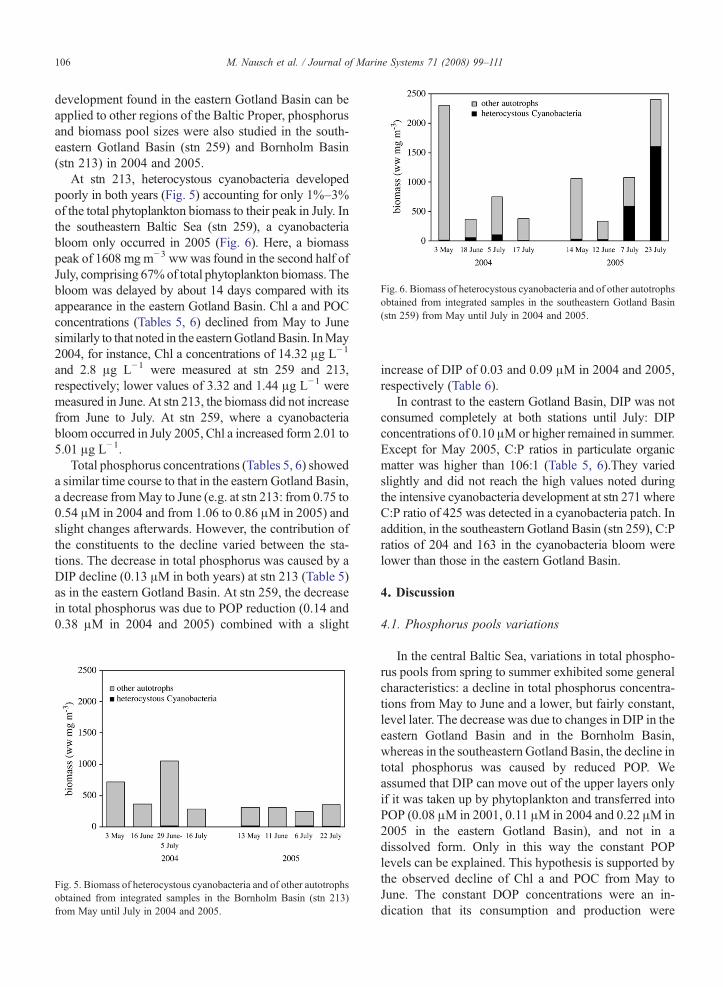
Fig. 6. Biomass of heterocystous cyanobacteria and of other autotrophsobtained from integrated samples in the southeastern Gotland Basin(stn 259) from May until July in 2004 and 2005.
106 M. Nausch et al. / Journal of Marine Systems 71 (2008) 99–111
development found in the eastern Gotland Basin can beapplied to other regions of the Baltic Proper, phosphorusand biomass pool sizes were also studied in the south-eastern Gotland Basin (stn 259) and Bornholm Basin(stn 213) in 2004 and 2005.
At stn 213, heterocystous cyanobacteria developedpoorly in both years (Fig. 5) accounting for only 1%–3%of the total phytoplankton biomass to their peak in July. Inthe southeastern Baltic Sea (stn 259), a cyanobacteriabloom only occurred in 2005 (Fig. 6). Here, a biomasspeak of 1608 mg m−3 wwwas found in the second half ofJuly, comprising 67% of total phytoplankton biomass. Thebloom was delayed by about 14 days compared with itsappearance in the eastern Gotland Basin. Chl a and POCconcentrations (Tables 5, 6) declined from May to Junesimilarly to that noted in the easternGotlandBasin. InMay2004, for instance, Chl a concentrations of 14.32 μg L−1
and 2.8 μg L−1 were measured at stn 259 and 213,respectively; lower values of 3.32 and 1.44 μg L−1 weremeasured in June. At stn 213, the biomass did not increasefrom June to July. At stn 259, where a cyanobacteriabloom occurred in July 2005, Chl a increased form 2.01 to5.01 μg L−1.
Total phosphorus concentrations (Tables 5, 6) showeda similar time course to that in the eastern Gotland Basin,a decrease fromMay to June (e.g. at stn 213: from 0.75 to0.54 μM in 2004 and from 1.06 to 0.86 μM in 2005) andslight changes afterwards. However, the contribution ofthe constituents to the decline varied between the sta-tions. The decrease in total phosphorus was caused by aDIP decline (0.13 μM in both years) at stn 213 (Table 5)as in the eastern Gotland Basin. At stn 259, the decreasein total phosphorus was due to POP reduction (0.14 and0.38 μM in 2004 and 2005) combined with a slight
Fig. 5. Biomass of heterocystous cyanobacteria and of other autotrophsobtained from integrated samples in the Bornholm Basin (stn 213)from May until July in 2004 and 2005.
increase of DIP of 0.03 and 0.09 μM in 2004 and 2005,respectively (Table 6).
In contrast to the eastern Gotland Basin, DIP was notconsumed completely at both stations until July: DIPconcentrations of 0.10 μMor higher remained in summer.Except for May 2005, C:P ratios in particulate organicmatter was higher than 106:1 (Table 5, 6).They variedslightly and did not reach the high values noted duringthe intensive cyanobacteria development at stn 271 whereC:P ratio of 425 was detected in a cyanobacteria patch. Inaddition, in the southeastern Gotland Basin (stn 259), C:Pratios of 204 and 163 in the cyanobacteria bloom werelower than those in the eastern Gotland Basin.
4. Discussion
4.1. Phosphorus pools variations
In the central Baltic Sea, variations in total phospho-rus pools from spring to summer exhibited some generalcharacteristics: a decline in total phosphorus concentra-tions from May to June and a lower, but fairly constant,level later. The decrease was due to changes in DIP in theeastern Gotland Basin and in the Bornholm Basin,whereas in the southeastern Gotland Basin, the decline intotal phosphorus was caused by reduced POP. Weassumed that DIP can move out of the upper layers onlyif it was taken up by phytoplankton and transferred intoPOP (0.08 μM in 2001, 0.11 μM in 2004 and 0.22 μM in2005 in the eastern Gotland Basin), and not in adissolved form. Only in this way the constant POPlevels can be explained. This hypothesis is supported bythe observed decline of Chl a and POC from May toJune. The constant DOP concentrations were an in-dication that its consumption and production were
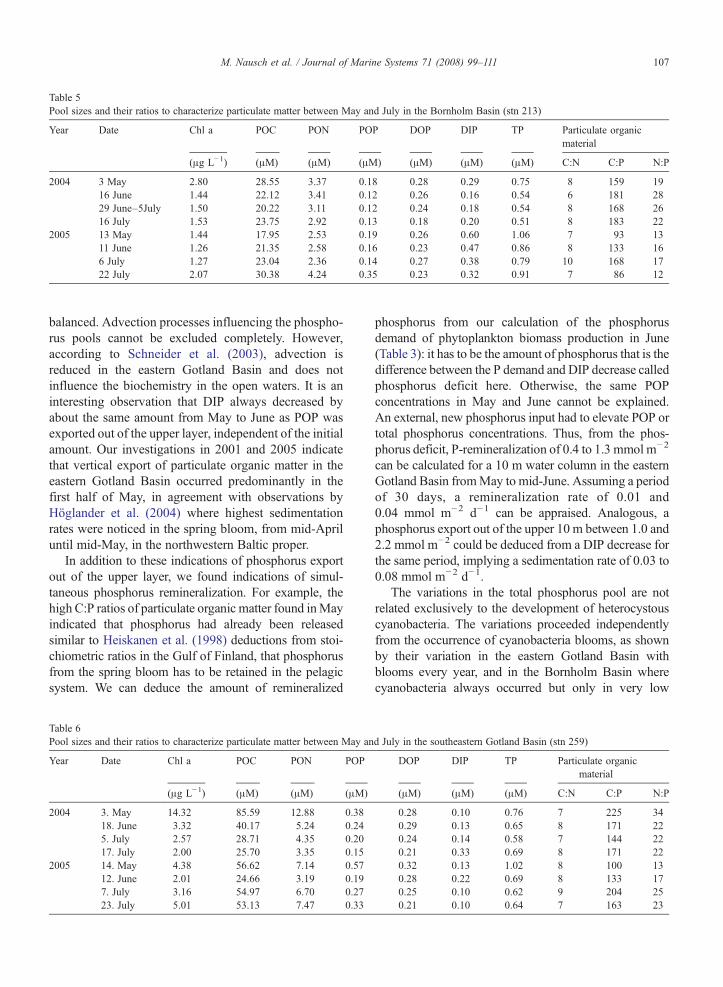
Table 5Pool sizes and their ratios to characterize particulate matter between May and July in the Bornholm Basin (stn 213)
Year Date Chl a POC PON POP DOP DIP TP Particulate organicmaterial
(μg L−1) (μM) (μM) (μM) (μM) (μM) (μM) C:N C:P N:P
2004 3 May 2.80 28.55 3.37 0.18 0.28 0.29 0.75 8 159 1916 June 1.44 22.12 3.41 0.12 0.26 0.16 0.54 6 181 2829 June–5July 1.50 20.22 3.11 0.12 0.24 0.18 0.54 8 168 2616 July 1.53 23.75 2.92 0.13 0.18 0.20 0.51 8 183 22
2005 13 May 1.44 17.95 2.53 0.19 0.26 0.60 1.06 7 93 1311 June 1.26 21.35 2.58 0.16 0.23 0.47 0.86 8 133 166 July 1.27 23.04 2.36 0.14 0.27 0.38 0.79 10 168 1722 July 2.07 30.38 4.24 0.35 0.23 0.32 0.91 7 86 12
107M. Nausch et al. / Journal of Marine Systems 71 (2008) 99–111
balanced. Advection processes influencing the phospho-rus pools cannot be excluded completely. However,according to Schneider et al. (2003), advection isreduced in the eastern Gotland Basin and does notinfluence the biochemistry in the open waters. It is aninteresting observation that DIP always decreased byabout the same amount from May to June as POP wasexported out of the upper layer, independent of the initialamount. Our investigations in 2001 and 2005 indicatethat vertical export of particulate organic matter in theeastern Gotland Basin occurred predominantly in thefirst half of May, in agreement with observations byHöglander et al. (2004) where highest sedimentationrates were noticed in the spring bloom, from mid-Apriluntil mid-May, in the northwestern Baltic proper.
In addition to these indications of phosphorus exportout of the upper layer, we found indications of simul-taneous phosphorus remineralization. For example, thehigh C:P ratios of particulate organic matter found inMayindicated that phosphorus had already been releasedsimilar to Heiskanen et al. (1998) deductions from stoi-chiometric ratios in the Gulf of Finland, that phosphorusfrom the spring bloom has to be retained in the pelagicsystem. We can deduce the amount of remineralized
Table 6Pool sizes and their ratios to characterize particulate matter between May an
Year Date Chl a POC PON POP
(μg L−1) (μM) (μM) (μM)
2004 3. May 14.32 85.59 12.88 0.3818. June 3.32 40.17 5.24 0.245. July 2.57 28.71 4.35 0.2017. July 2.00 25.70 3.35 0.15
2005 14. May 4.38 56.62 7.14 0.5712. June 2.01 24.66 3.19 0.197. July 3.16 54.97 6.70 0.2723. July 5.01 53.13 7.47 0.33
phosphorus from our calculation of the phosphorusdemand of phytoplankton biomass production in June(Table 3): it has to be the amount of phosphorus that is thedifference between the P demand and DIP decrease calledphosphorus deficit here. Otherwise, the same POPconcentrations in May and June cannot be explained.An external, new phosphorus input had to elevate POP ortotal phosphorus concentrations. Thus, from the phos-phorus deficit, P-remineralization of 0.4 to 1.3 mmol m−2
can be calculated for a 10 m water column in the easternGotland Basin fromMay to mid-June. Assuming a periodof 30 days, a remineralization rate of 0.01 and0.04 mmol m−2 d−1 can be appraised. Analogous, aphosphorus export out of the upper 10 m between 1.0 and2.2 mmol m−2 could be deduced from a DIP decrease forthe same period, implying a sedimentation rate of 0.03 to0.08 mmol m−2 d−1.
The variations in the total phosphorus pool are notrelated exclusively to the development of heterocystouscyanobacteria. The variations proceeded independentlyfrom the occurrence of cyanobacteria blooms, as shownby their variation in the eastern Gotland Basin withblooms every year, and in the Bornholm Basin wherecyanobacteria always occurred but only in very low
d July in the southeastern Gotland Basin (stn 259)
DOP DIP TP Particulate organicmaterial
(μM) (μM) (μM) C:N C:P N:P
0.28 0.10 0.76 7 225 340.29 0.13 0.65 8 171 220.24 0.14 0.58 7 144 220.21 0.33 0.69 8 171 220.32 0.13 1.02 8 100 130.28 0.22 0.69 8 133 170.25 0.10 0.62 9 204 250.21 0.10 0.64 7 163 23
108 M. Nausch et al. / Journal of Marine Systems 71 (2008) 99–111
quantities. According to our investigations, the followingchanges in phosphorus and other pool sizes seem to becombined with massive blooms of diazotrophic hetero-cystous cyanobacteria: (1) An increase of Chl a and POCfrom June to July is coupled with extremely high C:Pratios in particulate organic matter in July and withadditional POP elevation in extreme situations, and(2) DIP exhaustion. However, it is not clear whether thelast point is an essential characteristic. Thus, in thesoutheastern Gotland Basin, a cyanobacteria bloom wasobserved in the presence of 0.10 μM of DIP. Possibly, theclimax of cyanobacteria development was not reachedthere or a continuous supply was present to maintainresidual DIP. Therefore, it is not clear if DIP is alwaysconsumed or can remain before and during cyanobacteriadevelopment.
In our investigations, particulate organic matter C: Pvalues were higher than those of 106:1 found byRedfieldet al. (1963) indicating no elevated phosphorus storagebefore the mass development of cyanobacteria occurred.C:P ratios ranged between 137 and 188 in the easternGotland Basin in June before the cyanobacteriabloomed. In contrast, Larsson et al. (2001) demonstrated,with C:P ratios below the Redfield ratio, that phosphorusis stored internally by isolated cyanobacteria. But, atconstant POP concentrations as found in our study, Pstorage in cyanobacteria had to be at the expense of theother phytoplankton. In June, the heterocystous cyano-bacteria comprised only 12% or 13% of the totalphytoplankton wet weight and its C:P ratios may onlymarginally affect the C:P ratios of the entire particulatereservoir. Presently, it is unknown if heterocystouscyanobacteria are able to accumulate phosphorus whileother phytoplankton is depleted.
4.2. Diazotrophic cyanobacteria and phosphorus
The main period of diazotrophic cyanobacteriagrowth started in June, after DIP was depleted. Thisobservation is in agreement with that of Larsson et al.(2001) and seems to be valid for the eastern and thewestern Gotland Basin. It was not true for the south-eastern Gotland Basin, where a cyanobacteria bloomdeveloped in the presence of DIP.
In the eastern Gotland Basin, we observed differentmechanisms of phosphorus supply for cyanobacteriabloom formation. The first mechanism, in 2001, ex-plained cyanobacteria growth on the basis of particulateorganic phosphorus measured in June. The increase ofPOC from June to the first half of July was coupled withthe reduction of intracellular phosphorus, resulting in anelevation of the particulate organic matter C:P. No
external phosphorus input was necessary to explainbiomass production. Phosphorus remineralization andcycling within the upper layer may be the dominantprocesses sustaining cyanobacteria growth. The secondmechanism was observed in summer 2005. In that year,the typical distribution of heterocystous cyanobacteria,often reported for the Baltic Sea (Kankaanpaeae et al.,2001), occurred. This is characterized by near surfaceaccumulations and patches above a secondary thermo-cline and lower concentrations below. Between the mainand the secondary thermocline, the biomass increase canbe also explained by the reduction of intracellularphosphorus similar to that observed in 2001 only. Inthe layer above the secondary thermocline, an increase inPOP was measured besides the increase of POC andrising C:P ratios. Biomass development is based, in thissituation, on an additional phosphorus supply but withsimultaneous reduction of the intracellular phosphorus.The source of this additional phosphorus supply couldnot identified and can be only an object for speculationsin the present study. An upwelling of phosphate enricheddeep water as reported for the Gulf of Finland byKononen et al. (1996) and Kahru et al. (2000) had to bealready visible in the layer between the main and thesecondary thermocline. DIP concentrations start toincrease already in the lower part of the thermocline(own unpublished observations) and can function as apotential source coming into the euphotic layer byturbulences or thermocline tilting. Active transport intothe upper layer by P scavenging in deeper layers isreported for Trichodesmium (Letelier and Karl, 1998)and seems to be also relevant for Aphanizomenon (Olrik,pers communication). But, these processes have to occurbefore the secondary thermal stratification is formedunder calm wind conditions. The secondary thermoclineis a stable barrier that inhibits exchange processes. Asseen from the patchy distribution of cyanobacteria, thePOP elevations are local events, generated by locallyrestricted accumulation. In this case, areas with low POPconcentrations have to exist nearby. To answer thequestions, more knowledge about the spatial distributionand patchiness of cyanobacteria is necessary.
It is assumed that the high cyanobacteria concentra-tions near the surface are the result of cyanobacteriafloating up from deeper layers due to their gas vesicles(Walsby et al., 1995). The much higher C: P ratios abovethe secondary thermocline compared with that in the layerbelow demonstrated continual growth combined with afurther reduction of the internal phosphorus pool.Therefore, cyanobacteria blooms cannot be explainedsolely by upward transport of cyanobacteria from deeperlayers but rather by active growth in this layer.
109M. Nausch et al. / Journal of Marine Systems 71 (2008) 99–111
In all our samples, DOP concentrations ranged be-tween 0.20 and 0.29μM. In 2001, lower particulatematterC: P levels and extremely high DOP concentrations up to0.75 μM were found in surface scums (Nausch et al.,2004), which were not present in our recent investiga-tions. These observations might suggest that the surfacescums may be a final, senescent stage that is combinedwith the elevated release of dissolved organic matter.
4.3. Comparisons with modelling and calculations
According to model simulations from Janssen et al.(2004) based on a 10-year dataset, there exists a relationbetween late winter-phosphate concentrations in thesurface layer and the intensity of cyanobacteria bloomsin the successive summer. They found that a largefraction of the inter-annual variability in cyanobacteriablooms could be attributed to variations in excess of DIPin the surface layer which depends on the mixed layerdepth in winter and on coastal upwelling. In our moredetailed study, this relationship was not seen. Forexample, the abundances of diazotrophic cyanobacteriaremained low in 2004 despite higher DIP winterconcentrations (Nausch et al., 2005), resulting also ina higher total phosphorus pool in May 2004 than in2001. Calculations from the C:P ratios in 2004 indicatedthat the potential for a cyanobacteria bloom existed, butno bloom was formed. In 2005, a massive cyanobacteriabloom occurred in the eastern Gotland Basin but not inthe Bornholm Basin, despite the presence of DIP duringthe whole period. Water temperature was similar at allstations. Satellite observations (http://mananti.orbit.nes-dis,noaa,gov/quickscat/) demonstrated that wind speedand directions differed infrequently between the inves-tigated areas. But, meteorological observations from theweather station of ARKONA registered more frequentwind speeds higher than 10 m s−1 in June and July in2004 compared to the other years (Nausch et al., 2002,2005, 2006) which may be the cause for the absence ofsurface accumulations in this year. At present thesespatial differences of the bloom development cannot beexplained. The hypothesis that higher nutrient inputresults in more intense cyanobacteria growth is notsufficient to explain the occurrence of their blooms.
It was empirically assumed that DIP excess is takenup and stored in phytoplankton. A DIP excess in Mayformed the basis for calculations of possible nitrogenfixation (Rahm et al., 2000; Wasmund et al., 2005b).Consequently, a DIP decrease had to be reflectedpredominantly in increasing POP or DOP concentra-tions. This assumption is not supported by our results.We found, that an additional DIP source is necessary to
produce the biomass in June. Furthermore, DIP inputseems to be necessary for strong cyanobacteria growthforming intense surface blooms. Such input is notconsidered in the calculations of Rahm et al. (2000) andWasmund et al. (2005b) and is difficult to quantify.
5. Conclusions
Our results demonstrate that the phosphorus dynamicsfromMay until July in the Baltic proper is very complex.Changes in nutrient concentrations during the springphytoplankton bloom and the remainingDIP excess aloneare not sufficient for prediction of cyanobacteria blooms.The destiny of the remainingDIP fromMay to June seemsto be independent from the intensity of cyanobacteriadevelopment later. The phosphorus–cyanobacteria rela-tionship can be described as follows: The DIP consumedfrom May to June was transferred to POP and equalizedthe quantity of POP settling out of the upper mixed layer.As only a certain proportion (47%–85%) of the POP wasbased on DIP uptake, the calculation of possible nitrogenfixation on the basis of DIP resulted in an underestima-tion. The heterocystous cyanobacteria apparently grew onPOP reserves measured in June. The POP in Junecombined with elevation of the C: P ratios in July couldbe used for prediction in some situations if cyanobacteriaare dispersed in the water column. In other situations likein extreme surface accumulations, an additional phos-phorus source seems to be necessary. This source isunknown and will be the object of further investigations.A real modelling and prediction can be done if thecharacteristics of surface accumulations and the sourcesare known.
Acknowledgments
We thank the crews of the RV “Professor AlbrechtPenck “and RV “Gauss” for their help during sampling.We have to thank many technicians for the intensivesupport during field work or in the laboratoryperforming the different analyses: K. Bohn, A. Grütt-müller, R. Hansen, B. Sadkowiak, D. Setzkorn, I. Topp,and Ä. Welz.
References
Berman, T., Pollinger, U., Zohary, T., 1998. A short history of stabilityand change in phytoplankton populations in Lake Kinneret. Isr. J.Plant Sci. 46, 73–80.
Berman, T., 2001. The role of DON and the effect of N:P ratios onoccurrence of cyanobacterial blooms: implications from theoutgrow of Aphanizomenon in Lake Kinneret. Limnol. Oceanogr.46, 443–447.
110 M. Nausch et al. / Journal of Marine Systems 71 (2008) 99–111
Carpenter, E.J., Capone, D.C., Rueter, J.G., 1992. Marine PelagicCyanobacteria: Trichodesmium and Other Diazotrophs. KluverAcad. Press, Dordrecht.
Elgavish, A., Halmann, M., Berman, T., 1982. A comparative study ofphosphorus utilization and storage in batch culture of Peridiniumcincutum, Pediastrum duplex and Cosmarium sp., from LakeKinneret (Israel). Phycologia 21, 47–54.
Feistel, R., Nausch, G., Matthäus, W., Hagen, E., 2003. Temporal andspatial evolution of the Baltic deep water renewal in spring 2003.Oceanologia 45 (4), 623–642.
Finni, T., Kononen, K., Olsonen, R., Wallstroem, K., 2001. The historyof cyanobacterial blooms in the Baltic Sea. Ambio 30, 172–178.
Gage, M.A., Gorham, E., 1985. Alkaline phosphatase activity andcellular phosphorus as an index of the phosphorus status ofphytoplankton in Minnesota Lake. Freshw. Biol. 15, 227–233.
Galat, D.L., Verdin, J.P., 1989. Patchiness, collapse and succession of acyanobacterial bloom evaluated by synoptic sampling and remotesensing. J. Plankton Res. 11, 925–948.
Grasshoff, K., Ehrhardt, M., Kremling, K., 1983. Methods of SeawaterAnalysis, 2nd edition. Verlag Chemie, Weinheim.
Groenlund, L., Kononen, K., Lahdes, E., Maekelae, K., 1996.Community development and modes of phosphorus utilization ina late summer ecosystem in the central Gulf of Finland, the BalticSea. Hydrobiologia 331, 97–108.
Heiskanen, A.S., Haapala, J., Gundersen, K., 1998. Sedimentation andpelagic retention of particulate C, N and P in the coastal northernBaltic Sea. Estuar. Coast. Shelf Sci. 46, 703–712.
Helcom, 1988. Guidelines for the Baltic Sea Monitoring Program forthe third stage. Baltic Sea Environ. Proc. 27D, 161.
Hille, S., Nausch, G., Leipe, T., 2005. Sedimentary deposition and refluxof phosphorus (P) in the Eastern Gotland Basin and their couplingwith the water column P concentrations. Oceanologia 47, 663–679.
Höglander, H., Larsson, U., Hajdu, S., 2004. Vertical distribution andsettling of spring phytoplankton in the offshore NW Baltic Seaproper. Mar. Ecol. Prog. Ser. 283, 15–27.
Janssen, F., Neumann, T., Schmidt, M., 2004. Inter-annual variabilityin cyanobacteria blooms in the Baltic Sea controlled by wintertimehydrographic conditions. Mar. Ecol. Prog. Ser. 275, 59–68.
Jeffrey, S.W., Welschmeyer, N.A., 1997. Spectrophotometric andfluorometric equations in common use in oceanography. In:Jeffrey, S.W., Mantoura, R.F.C., Wright, S.W. (Eds.), Phytoplank-ton Pigments in Oceanography: Guidelines to Modern Method.UNESCO Publishing, pp. 597–615.
Kankaanpaeae, H.T., Sipiae, V.O., Kuparinen, J.S., Ott, J.L.,Carmicael, W.W., 2001. Nodularin analyses and toxicity of a No-dularia spumigena (Nostocales, Cyanobacteria) water-bloom inthe western Gulf of Finland, Baltic Sea, in August 1999.Phycologia 40, 268–274.
Kahru, M., Leppaenen, J.-M., Rud, O., Savaged, O.P., 2000.Cyanobacteria blooms in the Gulf of Finland triggered by saltwaterinflow into the Baltic Sea. Mar. Ecol. Prog. Ser. 207, 13–18.
Karl, D.,Michaels, A., Bergman, B., Capone, D., Carpenter, E., Letellier,R., Lipschultz, F., Pearl, H., Digman, D., Stal, L., 2002. Dinitrogenfixation in the world oceans. Biogeochemistry 57/58, 47–58.
Kononen, K., 1992. Dynamics of the toxic cyanobacterial blooms inthe Baltic Sea. Finn. Mar. Res. 261, 3–36.
Kononen, K., Kuparinen, J., Mäkelä, K., 1996. Initiation ofcyanobacterial blooms in a frontal region at the entrance to theGulf of Finland, Baltic Sea. Limnol. Oceanogr. 41, 98–112.
Larsson, U., Hajdu, S., Walve, J., Elmgren, R., 2001. Baltic Seanitrogen fixation estimated from the summer increase in uppermixed layer total nitrogen. Limnol. Oceanogr. 46, 811–820.
Letelier, R.M., Karl, D.M., 1998. Trichdesmium spp. physiology andnutrient fluxes in the North Pacific subtropical gyre. Aquat.Microb. Ecol. 15, 265–276.
Levings, C.D., Schindler, J.E., 1999. Influence of nitrogen to phosphorussupply ratios and physicochemical conditions on cyanobacteriaand phytoplankton species composition in the Experimental LakesArea, Canada. Can. J. Fish. Aquat. Sci./J. Can. Sci. 56, 451–466.
Liao, C.F.H., 1977. The effect of nutrient enrichment on nitrogenfixation activity in the Bay of Quinte, Lake Ontario. Hydrobiologia56, 273–279.
Mazur-Marzec, H., Krężel, A., Kobos, J., Pliñski, M., 2006. ToxicNodularia spumigena blooms in the coastal waters of the Gulf ofGdańsk: a ten-year survey. Oceanologia 48, 255–273.
Matthäus, W., Nausch, G., Lass, H.U., Nagel, K., Siegel, H., 2001.Hydrographisch-chemische Zustandseinschätzung der Ostsee2000. Meereswiss. Ber. Warnemünde 45, 27–88.
Nausch, G., Feistel, R., Lass, H.U., Nagel, K., Siegel, H., 2002.Hydrographisch-chemische Zustandseinschätzung der Ostsee2001. Meereswiss. Ber. Warnemünde 49, 1–77.
Nausch, G., Matthäus, W., Feistel, R., 2003. Hydrographic andhydrochemical conditions in the Gotland Deep area between 1992and 2003. Oceanologia 45 (4), 557–569.
Nausch, M., Nausch, G., Wasmund, N., 2004. Phosphorus dynamicsduring the transition from nitrogen to phosphate limitation in thecentral Baltic Sea. Mar. Ecol. Prog. Ser. 266, 15–25.
Nausch, G., Feistel, R., Lass, H.U., Nagel, K., Siegel, H., 2005.Hydrographisch-chemische Zustandseinschätzung der Ostsee2004. Meereswiss. Ber. Warnemünde 62, 1–78.
Nausch, G., Feistel, R., Lass, H.U., Nagel, K., Siegel, H., 2006.Hydrographisch-chemische Zustandseinschätzung der Ostsee2005. Meereswiss. Ber. Warnemünde 66, 1–82.
Niemi, A., 1979. Blue-green algal blooms and N:P ratio in the BalticSea. Acta Bot. Fenn. 110, 57–61.
Olenina, I., Hajdu, S., Andersson, A., Edler, L., Wasmund, N., Busch,S., Göbel, J., Gromisz, S., Huseby, S., Huttunen, M., Jaanus, A.,Kokkonen, P., Ledaine, I., Niemkiewicz, E., 2006. Biovolumesand size-classes of phytoplankton in the Baltic Sea. Baltic SeaEnviron. Proc. 106, 144pp.
Pollinger, U., Hadas, O., Yacobi, Y.Z., Zohary, T., Berman, T., 1998.Aphanizomenon ovalisporum (Forti) in Lake Kinneret, Israel.J. Plankton Res. 20, 1321–1339.
Rahm, L., Joensson, A., Wulff, F., 2000. Nitrogen fixation in the BalticProper: an empirical study. J. Mar. Syst. 25, 239–248.
Redfield, A.C., Ketchum, B.H., Richards, F.A., 1963. The influence oforganisms on the composition of sea water. In: Hill, M.N. (Ed.),The Sea, vol II. John Wiley & Sons, New York, pp. 26–77.
Rohde, K.H., Nehring, D., 1979. Ausgewählte Methoden zurBestimmung von Inhaltsstoffen im Meer- und Brackwasser.Geod. Geoph. Veröff. R. IV 27, 1–68.
Rydin, E., Hyenstrand, P., Gunnerhed, M., Blomqvist, P., 2002.Nutrient limitation of cyanobactrial blooms: an enclosure exper-iment from the coastal zone of the NW Baltic proper. Mar. Ecol.Prog. Ser. 239, 31–36.
Schneider, B., Nausch, G., Nagel, K., Wasmund, N., 2003. The surfacewater CO2 budget fort he Baltic Proper: a new way to determinenitrogen fixation. J. Mar. Syst. 42, 53–64.
Sellner, K.G., 1997. Physiology, ecology, and toxic properties ofmarine cyanobacterial blooms. Limnol. Oceanogr. 42, 1089–1104.
Smith, V.H., 1990. Nitrogen, phosphorus, and nitrogen fixation in lacus-trine and estuarine ecosystems. Limnol. Oceanogr. 35, 1852–1859.
Struck, U., Pollehne, F., Bauerfeind, E., Bodungen, B.V., 2004. Sourceof nitrogen for the vertical particle flux in the Gotland Sea (Baltic
111M. Nausch et al. / Journal of Marine Systems 71 (2008) 99–111
Proper) — results from sediment trap studies. J. Mar. Syst. 45,91–101.
Thompson, P.A., Oh, H.M., Rhee, G.Y., 1994. Storage of phosphorusin nitrogen-fixing Anabaena flos aquae (Cyanophyceae). J.Phycol. 30, 267–273.
UNESCO, 1994. Protocols for the Joint Global Ocean Flux Study(JGOFS) core measurements. IOC/SCOR Manual and Guides 29,128–134.
Utermöhl, H., 1958. Zur Vervollkommnung der quantitativenPhytoplankton-Methodik. Mitt. Int. Ver. Theor. Angew. Limnol.9, 1–38.
Walsby, A.E., Hayes, P.K., Boje, R., 1995. The gas vesicles, buoyantand vertical distribution of cyanobacteria in Baltic Sea. Eur.J. Phycol. 30, 87–94.
Wasmund, N., 1997. Occurrence of cyanobacterial blooms in theBaltic Sea in relation to environmental conditions. Int. Revue ges.Hydrobiol. 82, 169–184.
Wasmund, N., Nausch, G., Schneider, B., 2005a. Primary productionrates calculated by different concepts — an opportunity to studythe complex production systems in the Baltic Proper. J. Sea Res.54, 244–255.
Wasmund, N., Nausch, G., Schneider, B., Nagel, K., Voss, M., 2005b.Comparison of nitrogen fixation rates determined with differentmethods: a study in the Baltic Proper. Mar. Ecol. Prog. Ser. 297,23–31.
Wasmund, N., Topp, I., Schories, D., 2006. Optimising the storage andextraction of chlorophyll samples. Oceanologia 48, 125–144.