Embed Size (px)
Citation preview
PHOTO- AND VIDEO-BASED3D RANGING AND MODELING
Yuan-Fang WangDepartment of Computer Science
University of CaliforniaSanta Barbara, CA 93106
Abstract
In this paper, we present our research on photo- and video-based 3D ranging and modeling. We have constructed sucha 3D ranging and modeling system, PhotoModel3D, that was made available for free, non-commercial use over theWeb. The system has received over a hundred thousands Web visits and thousands of use in the past two years alone.Currently, we demo 900 3D models thus constructed using photos and videos contributed from anonymous users allover the world. Here, we describe the algorithms used in the 3D pipeline and present the results of a comparisonstudy and an accuracy analysis of its performance.
Keywords: photo, video, 3D, model, reconstruction, vision
1 IntroductionIn this paper, we present our research on photo- and video-based 3D ranging and modeling. Image-based 3D modelingis widely considered an ill-posed, inverse problem in computer vision that is difficult to solve efficiently, robustly andaccurately [7, 11, 21]. Furthermore, photo- and video-based 3D modeling is complicated, as it comprises a pipelineof intertwined components, touching upon many facets of computer vision, e.g., 2D feature analysis and tracking,localized 2D to 3D structure and motion inference, global numerical optimization, 3D surface generation, and multi-view texture mapping. A complete 3D pipeline must successfully address all these problems and more.
Recently, the rapid maturity and wide adoption of some crucial infrastructure and hardware technologies has greatlyfacilitated such image-based, 3D ranging research. In 2011alone, over 1.4 billion camera phones and another 100million digital cameras were sold worldwide. A commodity PCthese days comes with a 2-, 4-, or 6-core CPU withgigabytes or terabytes of disk storage for processing and storing image and video data. Wired, wireless, and cellularnetworks abound that allow easy upload and download of videos and photos. The technological confluence is enabling“rubber-meets-the-road” validation of over 40 years of 3D image-based ranging and modeling research, and helppushing the academic research into the real-world consumerand military markets.
We have developed such a photo- and video-based 3D ranging and modeling software that we call PhotoModel3D [28].PhotoModel3D employs a photo-based and photo-only analysis paradigm known as either structure from motion (SfM)in the computer-vision and computer-graphics communities[7, 11, 21, 19, 25, 9] or simultaneous localization andmapping (SLAM) in the robotics communityy [5, 13, 22, 17]. Regardless of the nomenclature, the general principlesof such a 3D modeling system are to exploit the motion parallax effect exhibited in multiple images taken by atravelling camera to infer the 3D scene structures and the camera poses. PhotoModel3D (1) works with both discreteimages and continuous videos taken by a consumer-market digital camera, camcorder, or camera phone of any makeand model, (2) uses no special equipment (e.g., lens and tripod), active projection, artificial lighting, prior cameracalibration, and man-made markers and registration patterns, (3) requires no user training (just point and shoot),(4) is fully automated and end-to-end (from photographs to fully colored and textured 3D models) without manualintervention or data-specific parameter tuning, (5) is a software-based solution that runs on commodity Linux and
1
.
Windows servers without the need of special hardware (GPU, DSP, etc.) acceleration, (6) has been demonstrated inan unbiased study to outperform many state-of-the-art 3D modeling pipelines based on a similar SfM principle [29],(7) has been shown to infer 3D models of high fidelity, with an average 3D structure error less than 0.2% measuredagainst ground-truthed 3D LIDAR models, (8) has been deployed on the web allowing free, non-commercial use formore than 2 years; receiving over 100 thousands web visits and thousands of use, and (9) has successfully constructedthousands of 3D models of a large variety of 3D scenes using images and videos contributed from anonymous usersall over the world.
The remainder of the paper will describe our 3D processing flow and algorithms used in PhotoModel3D. The dis-cussion will be followed by the presentation of an comparionand an accuracy study. Finally, we will summarize thecurrent status of our research and development in a concluding remark.
2 Technical Description
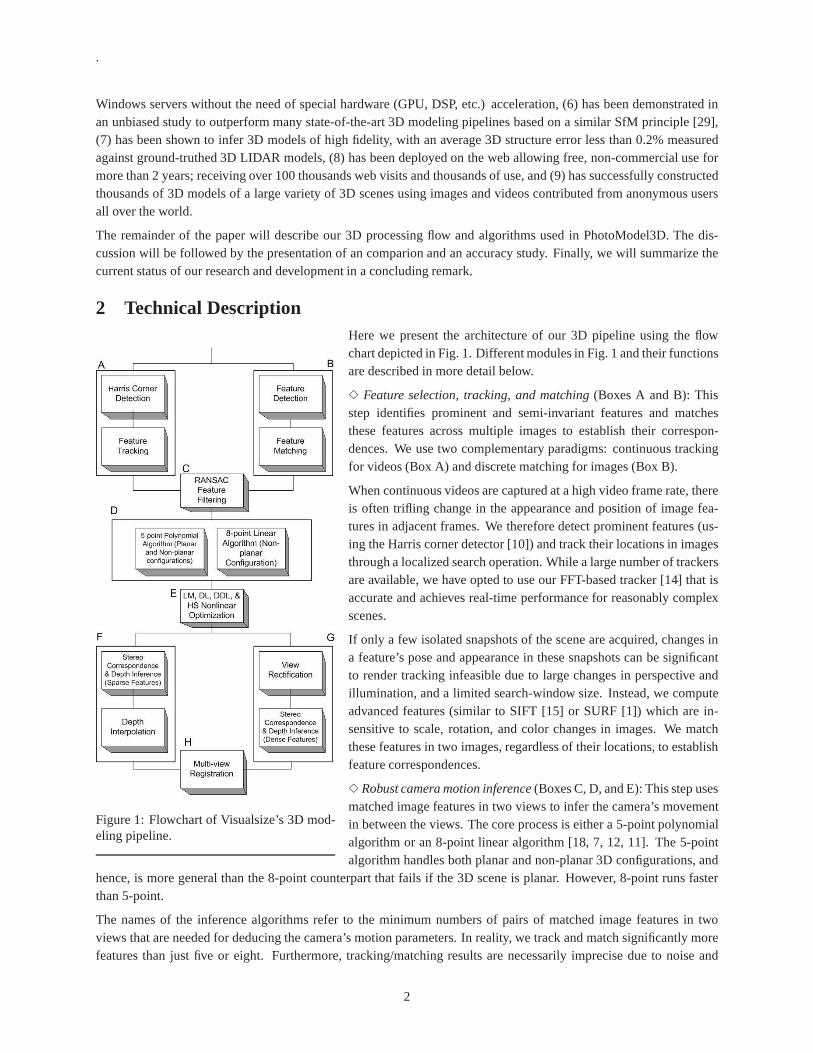
Figure 1: Flowchart of Visualsize’s 3D mod-eling pipeline.
Here we present the architecture of our 3D pipeline using theflowchart depicted in Fig. 1. Different modules in Fig. 1 and their functionsare described in more detail below.
3 Feature selection, tracking, and matching(Boxes A and B): Thisstep identifies prominent and semi-invariant features and matchesthese features across multiple images to establish their correspon-dences. We use two complementary paradigms: continuous trackingfor videos (Box A) and discrete matching for images (Box B).
When continuous videos are captured at a high video frame rate, thereis often trifling change in the appearance and position of image fea-tures in adjacent frames. We therefore detect prominent features (us-ing the Harris corner detector [10]) and track their locations in imagesthrough a localized search operation. While a large number of trackersare available, we have opted to use our FFT-based tracker [14] that isaccurate and achieves real-time performance for reasonably complexscenes.
If only a few isolated snapshots of the scene are acquired, changes ina feature’s pose and appearance in these snapshots can be significantto render tracking infeasible due to large changes in perspective andillumination, and a limited search-window size. Instead, we computeadvanced features (similar to SIFT [15] or SURF [1]) which are in-sensitive to scale, rotation, and color changes in images. We matchthese features in two images, regardless of their locations, to establishfeature correspondences.
3 Robust camera motion inference(Boxes C, D, and E): This step usesmatched image features in two views to infer the camera’s movementin between the views. The core process is either a 5-point polynomialalgorithm or an 8-point linear algorithm [18, 7, 12, 11]. The5-pointalgorithm handles both planar and non-planar 3D configurations, and
hence, is more general than the 8-point counterpart that fails if the 3D scene is planar. However, 8-point runs fasterthan 5-point.
The names of the inference algorithms refer to the minimum numbers of pairs of matched image features in twoviews that are needed for deducing the camera’s motion parameters. In reality, we track and match significantly morefeatures than just five or eight. Furthermore, tracking/matching results are necessarily imprecise due to noise and
2

.
image quantization. Catastrophic failure in tracking (loss of trajectory) and matching (erroneous pairing assignments)do happen occasionally. To improve the robustness in cameramotion inference, we use a nonlinear selection andfiltering strategy called RANSAC [8] to better condition thefeature matching process.
Finally, nonlinear optimization (Box E) is used to give a final “polish” to the best result from RANSAC and the 5-point or 8-point linear algorithms. We have used the Levenberg-Marquart (LM) [11], Dog Leg (DL), Double Dog Leg(DDL), and Hook-Step (HS) algorithms [2, 6], which are different variances of procedures for optimally combiningthe Gauss-Newton method and the gradient-descent method. While LM, DL, DDL, and HS are nonlinear iterativeoptimization procedures, convergence is fast because of a good initial guess has been obtained (Boxes C and D).
3 Stereo rectification, matching, and depth inference(Boxes F and G): This step is to infer 3D surface depth andconstruct a 3D model that captures both structure and appearance information. We consider two different approaches.In one approach (Box F), only the depths of the tracked/matched image features (Boxes A and B) are explicitlycomputed to form a sparse depth map. Depths of the intermediate pixels are estimated through bi-linear interpolationfrom those of the tracked/matched features. This approach is computationally efficient and works well if the scenestructure is smooth.
A more accurate 3D model can be constructed by computing pixel disparity and inferring 3D depth ateach and everypixel in the images (Box G). To efficiently and reliably perform stereo analysis, the image pair should be in a standardside-by-side configuration. If not, we must either identifythe corresponding epipolar lines in the two images, or rectifythe two images to rearrange the image pixels in such a way thatthe corresponding pixels in the two images lie on thesame image scan lines [20]. We then apply a stereo matching algorithm based on dynamic programming [3], whichtakes into consideration pixel-, neighborhood-, and globally-based similarity criteria in matching.
3 Multi-view registration(Box H): The final step is for registering partial 3D models constructed from multiple 2-viewanalyses into a more complete 3D model. We treat each partial2-view model as a cloud of 3D points, and these pointclouds are related by rigid-body transforms in space. We solve the registration problem by finding the rigid-bodyregistration parameters to match 3D point clouds with one another using least-square.
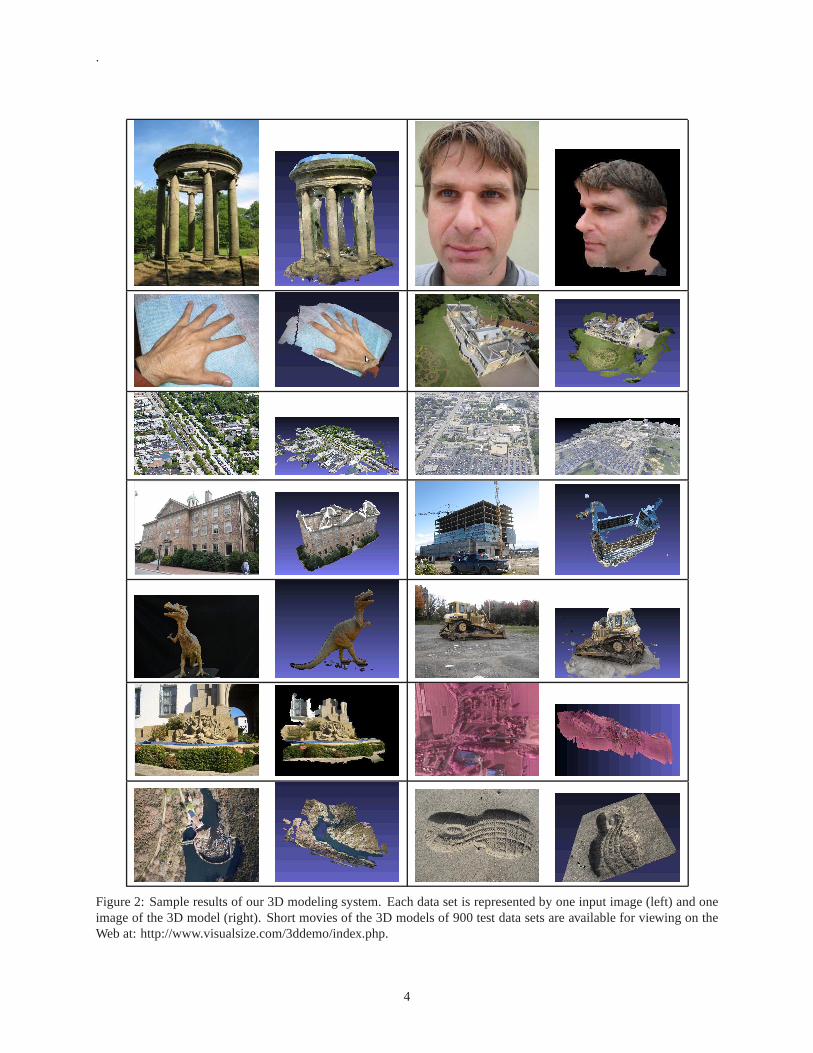
Fig. 2 shows sample 3D models. Note that depending on the requirement of a particular application, we can generateboth texture-mapped models and point-cloud models, thoughonly texture-mapped models are shown. A lot moreresults, currently comprising 900 3D models of all kinds of objects: human faces and others, soft and hard objects,smooth and rough appearance, large and small targets, nature and man-made scenes, complete (360o all-around) andpartial 3D models, indoor and outdoor settings, ground and airborne photos, short (as few as 5 images) and long (asmany as 800 images) sequences, are available at our website http://www.visualsize.com.
3 Experimental ResultsWe present two studies here: one is a performance comparisonof five 3D modeling systems based on the same SfMprinciple, and the other is an accuray study to learn how faithful our computer models can be to the ground-truthedLiDAR models of the same 3D scenes.
3.1 Performance ComparisonWe present here a comparison study of five 3D modeling systemsbased on the SfM principles (Bundler [25], Bundler+ PMVS2 [9], Project Photofly from Autodesk, ARC 3D Web Service [27], and our own [29]). The usage scenario wetry to emulate in this study is that of a commercial 3D modeling system that accepts 3D modeling requests from clients(cell phones, tablets, PCs, etc.) over the Web, executes the3D modeling pipeline on a back-end server, and returnsthe 3D model as a result. The users (1) are not computer visionexperts and cannot provide additional informationother than the photos themselves, (2) are not willing to go through lengthy training, or purchase expensive cameras orspecialized photography equipment for building 3D models,(3) may be cost conscientious especially when connectingto the back-end server through a mobile device where the usermay have to pay for the bandwidth usage (and hence,no uploading large photos that tie up Web links for a long time), and (4) are accustomed to the “instant gratification”
3
.
Figure 2: Sample results of our 3D modeling system. Each dataset is represented by one input image (left) and oneimage of the 3D model (right). Short movies of the 3D models of900 test data sets are available for viewing on theWeb at: http://www.visualsize.com/3ddemo/index.php.
4

.
Web experience, and hence, are impatient to get the results back.
While similar performance comparison has been attempted before [23, 24, 26], our study stands out by performing“rubber-meets-the-road” validation tests that closely mimic what a commercial 3D modeling system needs to accom-plish in the real world. The novelty of our comparison study is three-fold:
(1) The comparison was performed by exercising the full 3D modeling pipelines, from input images all the way to 3Dmodels, instead of testing some isolated components in a 3D pipeline [24],
(2) In addition to the ground-truthed 3D data provided by [26], we have used over 100 data sets (122 to be exact), withover three thousand images, representing a variety of 3D scenes, collected from a large number of consumer-marketdigital cameras and camera phones of many makes/models, andcontributed by anonymous users all over the world.Furthermore, these images were shot without prior camera calibration, use of special equipment (tripod, lens, etc.) andlighting (laser and structured light projection), and usertraining in image acquisition. In contrast, [23, 24, 26] haveused small, calibrated data sets, and
(3) To ensure that the comparison is fair and the results do not depend on the details of implementation, we haveincluded only those 3D modeling systems that are available for use on the Web or locally in a binary format; comprisea complete, fully-automated 3D pipeline that leads from input images to 3D models—without any user interventionand without data-dependent parameter tuning; and are able to perform the feats using images of a reasonable size.Furthermore, a diligent Web search has unearthed no other 3Dmodeling system that fits the comparison requirements,and hence, our selection is believed to be comprehensive andprovides a holistic view of the state of the art.
The test platform was a PC with a 2.8Ghz Intel Core 2 Duo CPU, 4GRAM, running Windows 7. The experimentalprocedures were extremely straightforward: As all these 3Dmodeling systems need were input images, all we didwas to provide them with the input images and then waited for the computation to finish. We felt that the simplicityof the procedures better ensured fairness. We (1) have used the binary releases of these programs so we could nothave compiled them incorrectly, (2) we have used the defaultexecution scripts supplied with the releases withoutmodification so we could not have tuned the parameters wrongly, and (3) we have run these programs on the samemachine using the same number of CPU cores, the same amount ofmemory, and under similar runtime conditions.For Project Photofly and ARC 3D Web Service, the images were uploaded to their servers on the Web and there wasno end-user tunable parameters on their GUI.
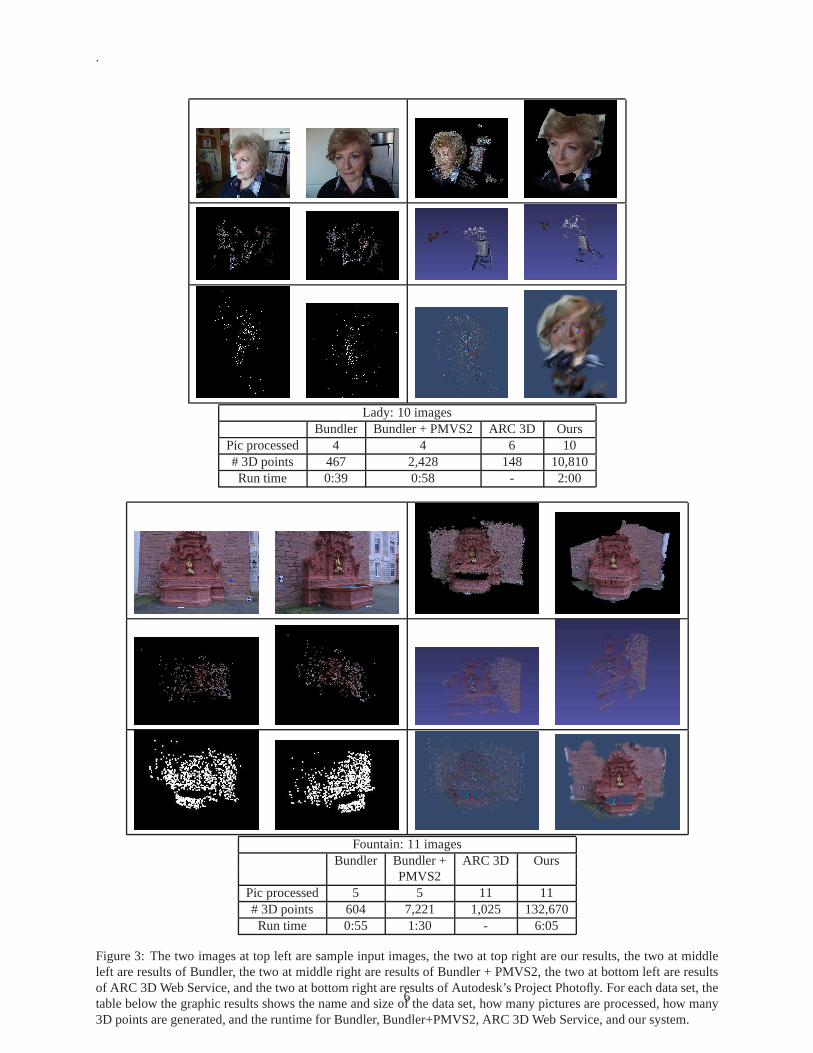
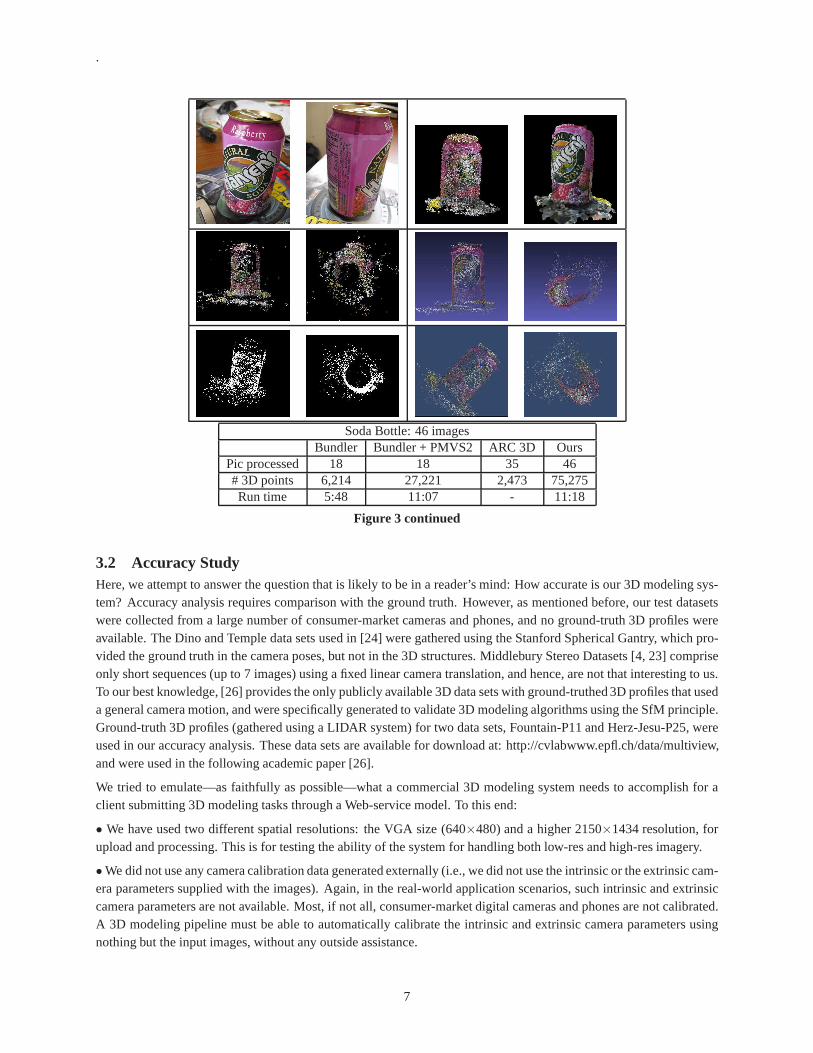
Fig. 3 presents three such results of running the five modeling systems on ten sample data sets. The two images at topleft are sample input images, the two at top right are our results, the two at middle left are results of Bundler, the two atmiddle right are results of Bundler + PMVS2, the two at bottomleft are results of ARC 3D Web Service, and the twoat bottom right are results of Autodesk’s Project Photofly. The table below the graphic results shows the name and sizeof the data set, how many pictures were processed, how many 3Dpoints were generated, and the runtime for Bundler,Bundler+PMVS2, ARC 3D Web Service, and our system. Runtime of ARC 3D and Photofly was not included asdata sets were processed on their cloud servers. Photofly used a proprietary point-cloud format so the cloud densityinformation was not available either.
Results of Bundler, Bundler+PMVS2, and ARC 3D Web Service are presented in discrete point-cloud format as theseprograms did not generate 3D texture-mapped models. We supplement texture-mapped results for Project Photoflyand our system if one point-cloud picture is enough to illustrate the density and quality of such a discrete structure. Aspage limit does not allow us to show all these examples, and the quality and accuracy of a 3D model is best evaluatedby viewing the model in 3D—instead of just a few screen shots,we strongly urge interested readers to browse our Website for more information [29]. In terms of cloud density andquality, and the chance of success, the test data indicatedthat ours outperformed Project Photofly, which outperformed Bundler+PMVS2, which outperformed Bundler, andwhich outperformed ARC 3D. This observation also confirms our experience with the much larger, over 100 data setensemble.
5
.
Lady: 10 imagesBundler Bundler + PMVS2 ARC 3D Ours
Pic processed 4 4 6 10# 3D points 467 2,428 148 10,810Run time 0:39 0:58 - 2:00
Fountain: 11 imagesBundler Bundler + ARC 3D Ours
PMVS2Pic processed 5 5 11 11# 3D points 604 7,221 1,025 132,670Run time 0:55 1:30 - 6:05
Figure 3: The two images at top left are sample input images, the two at top right are our results, the two at middleleft are results of Bundler, the two at middle right are results of Bundler + PMVS2, the two at bottom left are resultsof ARC 3D Web Service, and the two at bottom right are results of Autodesk’s Project Photofly. For each data set, thetable below the graphic results shows the name and size of thedata set, how many pictures are processed, how many3D points are generated, and the runtime for Bundler, Bundler+PMVS2, ARC 3D Web Service, and our system.
6
.
Soda Bottle: 46 imagesBundler Bundler + PMVS2 ARC 3D Ours
Pic processed 18 18 35 46# 3D points 6,214 27,221 2,473 75,275Run time 5:48 11:07 - 11:18
Figure 3 continued
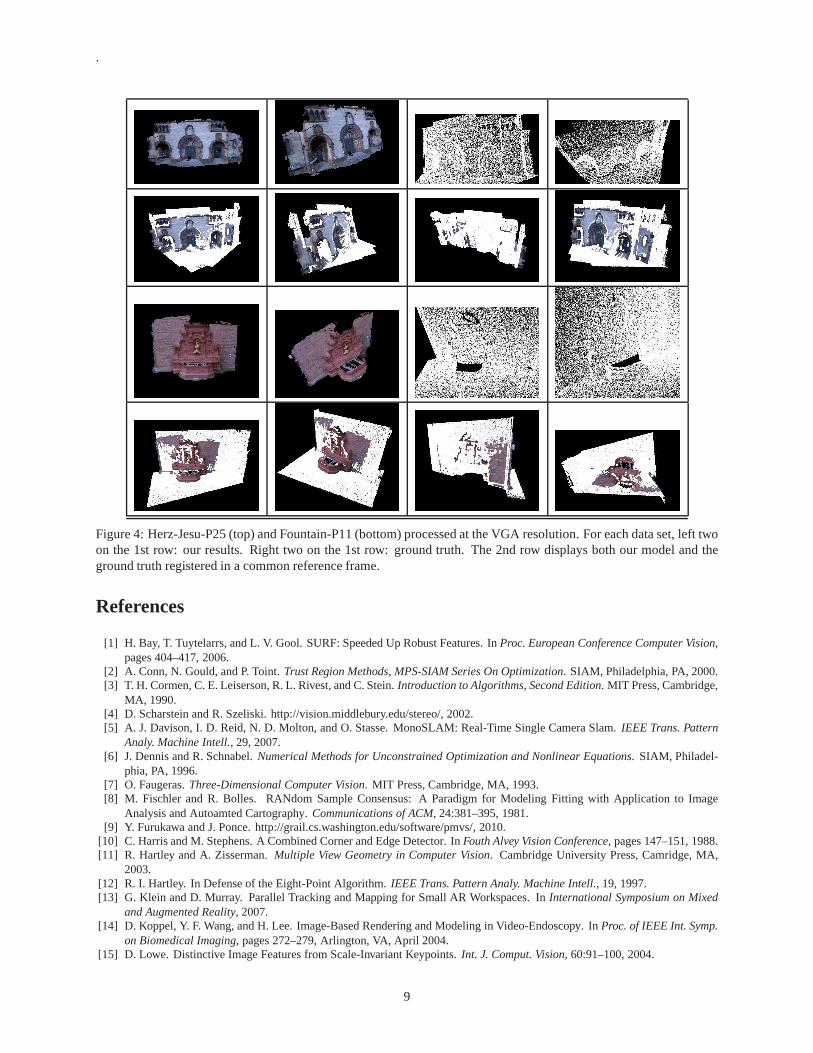
3.2 Accuracy StudyHere, we attempt to answer the question that is likely to be ina reader’s mind: How accurate is our 3D modeling sys-tem? Accuracy analysis requires comparison with the groundtruth. However, as mentioned before, our test datasetswere collected from a large number of consumer-market cameras and phones, and no ground-truth 3D profiles wereavailable. The Dino and Temple data sets used in [24] were gathered using the Stanford Spherical Gantry, which pro-vided the ground truth in the camera poses, but not in the 3D structures. Middlebury Stereo Datasets [4, 23] compriseonly short sequences (up to 7 images) using a fixed linear camera translation, and hence, are not that interesting to us.To our best knowledge, [26] provides the only publicly available 3D data sets with ground-truthed 3D profiles that useda general camera motion, and were specifically generated to validate 3D modeling algorithms using the SfM principle.Ground-truth 3D profiles (gathered using a LIDAR system) fortwo data sets, Fountain-P11 and Herz-Jesu-P25, wereused in our accuracy analysis. These data sets are availablefor download at: http://cvlabwww.epfl.ch/data/multiview,and were used in the following academic paper [26].
We tried to emulate—as faithfully as possible—what a commercial 3D modeling system needs to accomplish for aclient submitting 3D modeling tasks through a Web-service model. To this end:
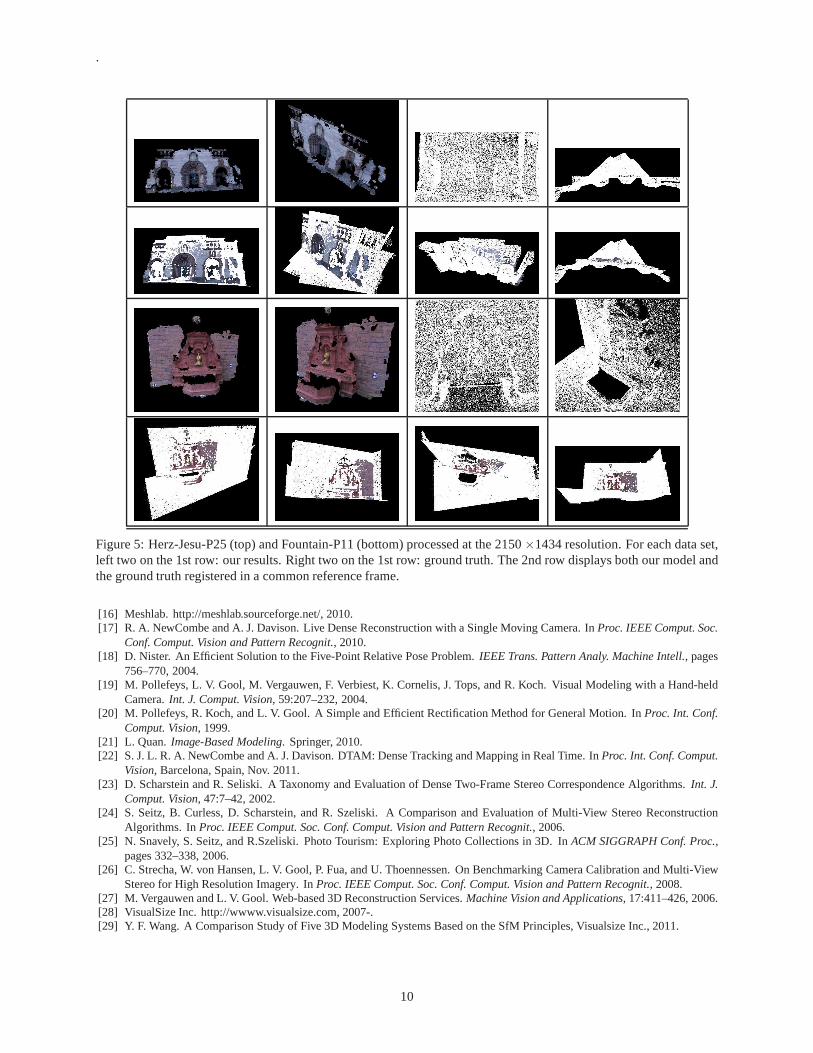
• We have used two different spatial resolutions: the VGA size(640×480) and a higher 2150×1434 resolution, forupload and processing. This is for testing the ability of thesystem for handling both low-res and high-res imagery.
• We did not use any camera calibration data generated externally (i.e., we did not use the intrinsic or the extrinsic cam-era parameters supplied with the images). Again, in the real-world application scenarios, such intrinsic and extrinsiccamera parameters are not available. Most, if not all, consumer-market digital cameras and phones are not calibrated.A 3D modeling pipeline must be able to automatically calibrate the intrinsic and extrinsic camera parameters usingnothing but the input images, without any outside assistance.
7
.
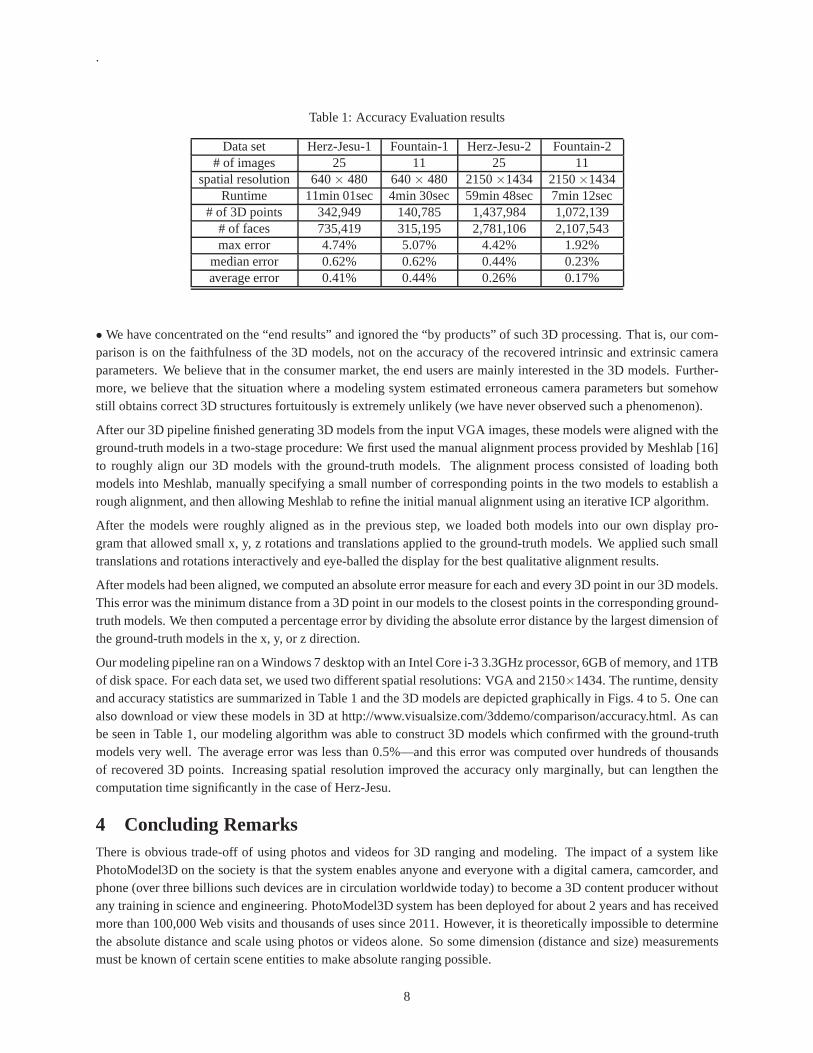
Table 1: Accuracy Evaluation results
Data set Herz-Jesu-1 Fountain-1 Herz-Jesu-2 Fountain-2# of images 25 11 25 11
spatial resolution 640× 480 640× 480 2150×1434 2150×1434Runtime 11min 01sec 4min 30sec 59min 48sec 7min 12sec
# of 3D points 342,949 140,785 1,437,984 1,072,139# of faces 735,419 315,195 2,781,106 2,107,543max error 4.74% 5.07% 4.42% 1.92%
median error 0.62% 0.62% 0.44% 0.23%average error 0.41% 0.44% 0.26% 0.17%
• We have concentrated on the “end results” and ignored the “byproducts” of such 3D processing. That is, our com-parison is on the faithfulness of the 3D models, not on the accuracy of the recovered intrinsic and extrinsic cameraparameters. We believe that in the consumer market, the end users are mainly interested in the 3D models. Further-more, we believe that the situation where a modeling system estimated erroneous camera parameters but somehowstill obtains correct 3D structures fortuitously is extremely unlikely (we have never observed such a phenomenon).
After our 3D pipeline finished generating 3D models from the input VGA images, these models were aligned with theground-truth models in a two-stage procedure: We first used the manual alignment process provided by Meshlab [16]to roughly align our 3D models with the ground-truth models.The alignment process consisted of loading bothmodels into Meshlab, manually specifying a small number of corresponding points in the two models to establish arough alignment, and then allowing Meshlab to refine the initial manual alignment using an iterative ICP algorithm.
After the models were roughly aligned as in the previous step, we loaded both models into our own display pro-gram that allowed small x, y, z rotations and translations applied to the ground-truth models. We applied such smalltranslations and rotations interactively and eye-balled the display for the best qualitative alignment results.
After models had been aligned, we computed an absolute errormeasure for each and every 3D point in our 3D models.This error was the minimum distance from a 3D point in our models to the closest points in the corresponding ground-truth models. We then computed a percentage error by dividing the absolute error distance by the largest dimension ofthe ground-truth models in the x, y, or z direction.
Our modeling pipeline ran on a Windows 7 desktop with an IntelCore i-3 3.3GHz processor, 6GB of memory, and 1TBof disk space. For each data set, we used two different spatial resolutions: VGA and 2150×1434. The runtime, densityand accuracy statistics are summarized in Table 1 and the 3D models are depicted graphically in Figs. 4 to 5. One canalso download or view these models in 3D at http://www.visualsize.com/3ddemo/comparison/accuracy.html. As canbe seen in Table 1, our modeling algorithm was able to construct 3D models which confirmed with the ground-truthmodels very well. The average error was less than 0.5%—and this error was computed over hundreds of thousandsof recovered 3D points. Increasing spatial resolution improved the accuracy only marginally, but can lengthen thecomputation time significantly in the case of Herz-Jesu.
4 Concluding RemarksThere is obvious trade-off of using photos and videos for 3D ranging and modeling. The impact of a system likePhotoModel3D on the society is that the system enables anyone and everyone with a digital camera, camcorder, andphone (over three billions such devices are in circulation worldwide today) to become a 3D content producer withoutany training in science and engineering. PhotoModel3D system has been deployed for about 2 years and has receivedmore than 100,000 Web visits and thousands of uses since 2011. However, it is theoretically impossible to determinethe absolute distance and scale using photos or videos alone. So some dimension (distance and size) measurementsmust be known of certain scene entities to make absolute ranging possible.
8
.
Figure 4: Herz-Jesu-P25 (top) and Fountain-P11 (bottom) processed at the VGA resolution. For each data set, left twoon the 1st row: our results. Right two on the 1st row: ground truth. The 2nd row displays both our model and theground truth registered in a common reference frame.
References
[1] H. Bay, T. Tuytelarrs, and L. V. Gool. SURF: Speeded Up Robust Features. InProc. European Conference Computer Vision,pages 404–417, 2006.
[2] A. Conn, N. Gould, and P. Toint.Trust Region Methods, MPS-SIAM Series On Optimization. SIAM, Philadelphia, PA, 2000.[3] T. H. Cormen, C. E. Leiserson, R. L. Rivest, and C. Stein.Introduction to Algorithms, Second Edition. MIT Press, Cambridge,
MA, 1990.[4] D. Scharstein and R. Szeliski. http://vision.middlebury.edu/stereo/, 2002.[5] A. J. Davison, I. D. Reid, N. D. Molton, and O. Stasse. MonoSLAM: Real-Time Single Camera Slam.IEEE Trans. Pattern
Analy. Machine Intell., 29, 2007.[6] J. Dennis and R. Schnabel.Numerical Methods for Unconstrained Optimization and Nonlinear Equations. SIAM, Philadel-
phia, PA, 1996.[7] O. Faugeras.Three-Dimensional Computer Vision. MIT Press, Cambridge, MA, 1993.[8] M. Fischler and R. Bolles. RANdom Sample Consensus: A Paradigm for Modeling Fitting with Application to Image
Analysis and Autoamted Cartography.Communications of ACM, 24:381–395, 1981.[9] Y. Furukawa and J. Ponce. http://grail.cs.washington.edu/software/pmvs/, 2010.
[10] C. Harris and M. Stephens. A Combined Corner and Edge Detector. InFouth Alvey Vision Conference, pages 147–151, 1988.[11] R. Hartley and A. Zisserman.Multiple View Geometry in Computer Vision. Cambridge University Press, Camridge, MA,
2003.[12] R. I. Hartley. In Defense of the Eight-Point Algorithm.IEEE Trans. Pattern Analy. Machine Intell., 19, 1997.[13] G. Klein and D. Murray. Parallel Tracking and Mapping for Small AR Workspaces. InInternational Symposium on Mixed
and Augmented Reality, 2007.[14] D. Koppel, Y. F. Wang, and H. Lee. Image-Based Renderingand Modeling in Video-Endoscopy. InProc. of IEEE Int. Symp.
on Biomedical Imaging, pages 272–279, Arlington, VA, April 2004.[15] D. Lowe. Distinctive Image Features from Scale-Invariant Keypoints.Int. J. Comput. Vision, 60:91–100, 2004.
9
.
Figure 5: Herz-Jesu-P25 (top) and Fountain-P11 (bottom) processed at the 2150×1434 resolution. For each data set,left two on the 1st row: our results. Right two on the 1st row: ground truth. The 2nd row displays both our model andthe ground truth registered in a common reference frame.
[16] Meshlab. http://meshlab.sourceforge.net/, 2010.[17] R. A. NewCombe and A. J. Davison. Live Dense Reconstruction with a Single Moving Camera. InProc. IEEE Comput. Soc.
Conf. Comput. Vision and Pattern Recognit., 2010.[18] D. Nister. An Efficient Solution to the Five-Point Relative Pose Problem.IEEE Trans. Pattern Analy. Machine Intell., pages
756–770, 2004.[19] M. Pollefeys, L. V. Gool, M. Vergauwen, F. Verbiest, K. Cornelis, J. Tops, and R. Koch. Visual Modeling with a Hand-held
Camera.Int. J. Comput. Vision, 59:207–232, 2004.[20] M. Pollefeys, R. Koch, and L. V. Gool. A Simple and Efficient Rectification Method for General Motion. InProc. Int. Conf.
Comput. Vision, 1999.[21] L. Quan.Image-Based Modeling. Springer, 2010.[22] S. J. L. R. A. NewCombe and A. J. Davison. DTAM: Dense Tracking and Mapping in Real Time. InProc. Int. Conf. Comput.
Vision, Barcelona, Spain, Nov. 2011.[23] D. Scharstein and R. Seliski. A Taxonomy and Evaluationof Dense Two-Frame Stereo Correspondence Algorithms.Int. J.
Comput. Vision, 47:7–42, 2002.[24] S. Seitz, B. Curless, D. Scharstein, and R. Szeliski. A Comparison and Evaluation of Multi-View Stereo Reconstruction
Algorithms. InProc. IEEE Comput. Soc. Conf. Comput. Vision and Pattern Recognit., 2006.[25] N. Snavely, S. Seitz, and R.Szeliski. Photo Tourism: Exploring Photo Collections in 3D. InACM SIGGRAPH Conf. Proc.,
pages 332–338, 2006.[26] C. Strecha, W. von Hansen, L. V. Gool, P. Fua, and U. Thoennessen. On Benchmarking Camera Calibration and Multi-View
Stereo for High Resolution Imagery. InProc. IEEE Comput. Soc. Conf. Comput. Vision and Pattern Recognit., 2008.[27] M. Vergauwen and L. V. Gool. Web-based 3D Reconstruction Services.Machine Vision and Applications, 17:411–426, 2006.[28] VisualSize Inc. http://wwww.visualsize.com, 2007-.[29] Y. F. Wang. A Comparison Study of Five 3D Modeling Systems Based on the SfM Principles, Visualsize Inc., 2011.
10