Embed Size (px)
Citation preview

Supplementary Information:
Photo-Induced Charge Recombination Kinetics in Low
Bandgap PCPDTBT Polymer:CdSe Quantum Dot Bulk
Heterojunction Solar Cells.
Josep Albero, a Yunfei Zhou, b Michael Eck, b Frank Rauscher, d Phenwisa Nyamakon, d
Ines Dumsch, e Sybille Allard, e Ullrich Scherf, e Michael Krüger b and Emilio
Palomares,*a,c
a Institute of Chemical Research of Catalonia (ICIQ), Avda. Països Catalans 16, E-
43007 Tarragona, Spain. Fax: (+34) 977 920 224; Tel: (+34) 977920200; E-mail:
b Freiburg Materials Research Centre (FMF), University of Freiburg, Stefan Meier
Strasse 21, D-79104 Freiburg, Germany. Fax: (+49) (0)761 203 4701; Tel: (+49)
(0)761 203 4755; E-mail: [email protected]
c Catalan Institution for Research and Advanced Studies (ICREA), Avda. Lluis
Companys 23, E-08010 Barcelona, Spain.
d Bayer technology services GmbH, Process Technology Building E41, D-51368,
Leverkusen, Germany.
e Institut für Polymertechnologie, Bergishe Universität Wuppertal, Gauss-Strasse 20, D-
42097 Wuppertal Germany. Fax: (+49) (0)202 439 3880; Tel: (+49) (0)202 439 2493;
E-mail: [email protected]
Electronic Supplementary Material (ESI) for Chemical ScienceThis journal is © The Royal Society of Chemistry 2011
Experimental section. Device preparation. The CdSe QD:PCPDTBT bulk heterojunction devices were prepared using CdSe quantum dots with a mean diameter of 4.7 nm which were synthetized with a mixture of trioctylphosphine (TOP) and oleic acid (OA) ligands.1 Before mixing with the polymer QDs were treated by hexanoic acid.2 A chlorobenzene QD solution at 23 mg/ml was mixed with a 1,2,4-trichlorobenzene (TCB) PCPDTBT solution at 20 mg/ml at certain ratio. The ITO substrates were cleaned and covered with an aqueous PEDOT:PSS dispersion (Baytron AL4083, from H.C. Starck) by spin coating. The films were annealed at 150ºC for 30 minutes. Afterwards, the CdSe Qds:Polymer solution was spin-coated onto the surface of PEDOT:PSS to form photoactive films. The cathodes were thermally deposited onto the CdSe Qds:Polymer blend, obtaining an active area of 9 mm2. Device thermal annealing was done on a hot plate under nitrogen atmosphere. The devices were encapsulated with an UV curing epoxy, in order to ensure inert conditions during all the characterization. Spectroscopic characterization. The film UV-Vis absorption was recorded with a Shimadzu 1600 spectrophotometer. The measurement of incident photon-to-current conversion efficiency (IPCE) was plotted as a function of the excitation wavelength by using the incident light from a 300 W xenon lamp (ILC Technology, USA), which was focused through a Gemini-180 double monochromator (Jobin Yvon Ltd.) For transient photovoltage (TPV) measurements, the devices were connected to the 1 Mohm input terminal of an oscilloscope, and illuminated with white light to set the light bias. A small optical perturbation was applied using nitrogen pumped dye LASER as an excitation source with wavelength of 535 nm (frecuency 1.5 Hz, pulse duration < 1 ns), which resulted in voltage transient amplitude of 4 mV. The intensity of the LASER pulse was attenuated as necessary using a circular neutral density filter. The Charge Extraction (CE) technique was measured with a ring white LED illumination source. The devices were illuminated under different light intensities (from darkness to 1 sun intensity) at open circuit conditions, which allows the device to reach an equilibrium in open circuit voltage , depending on the applied light intensity. This applied light bias was turned off in <1 µs, while simultaneously, the cell is switched from open to short circuit and the Lumber of charges are recorded in the oscilloscope. 3
L-TAS measurements were performed by excitation of the blend films at 535 nm with pulses from a nitrogen-pumped dye laser PTI GL-301 (<1ns pulse duration, 1.5 Hz, intensity 0.09 mJ/cm2). The resulting photoinduced changes in the optical density were monitored at different wavelengths by employing a 150 W tungsten lamp, with 1 nm bandwidth monochromators located before and after the sample, a home-built photodiode based detection system, and a TDS-200 Tecktronik oscilloscope.
Electronic Supplementary Material (ESI) for Chemical ScienceThis journal is © The Royal Society of Chemistry 2011
The J-V characteristics measurements were carried out with an ABET 150 W Xenon light source equipped with the correct set of filters to achieve the solar spectrum 1.5 AM G. The light intensity was adjusted to 100 mW/cm2 using a calibrated Si photodiode. The applied potential and cell current were measured with Keithley model 2600 digital source meter. The current to voltage (I-V curve) was measured automatically with a home-built Labview© software. Comparison of P3HT/PCBM vs PCPDTBT/CdSe bulk heterojunction solar cells.
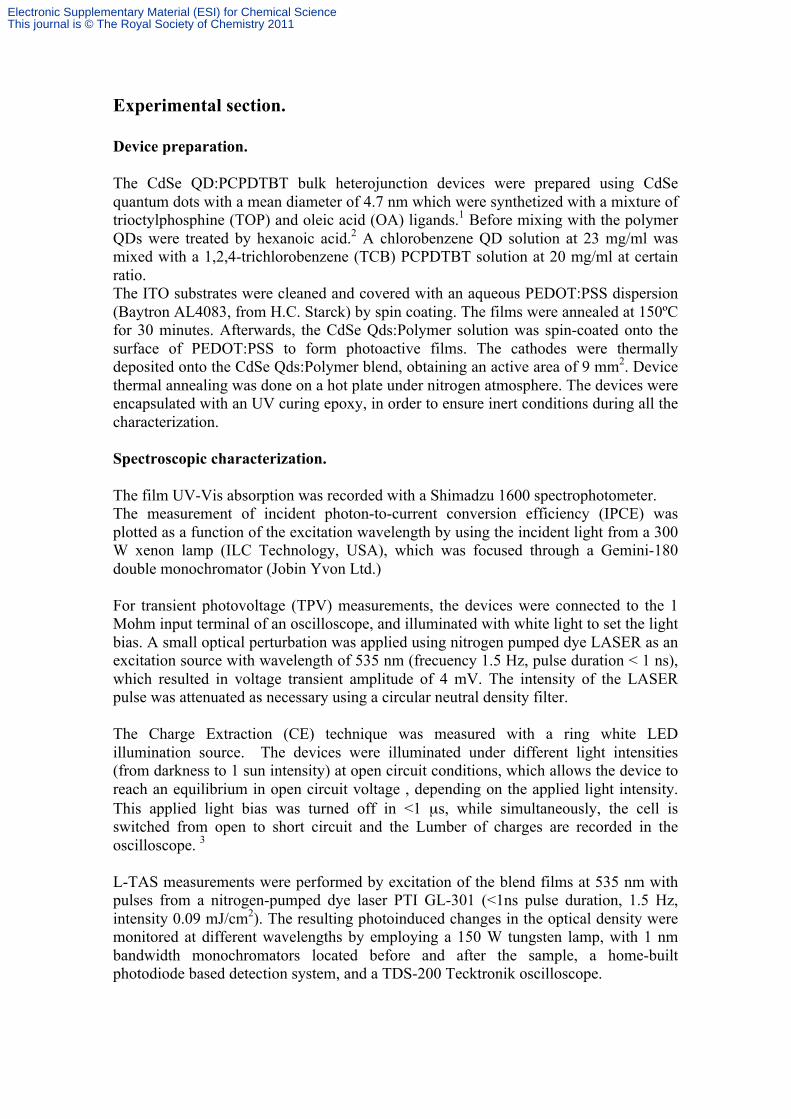
a) b) Figure SI1. Comparison of L-TAS of a) P3HT/PCBM and b) PCPDTBT/CdSe thin films, monitored at 980nm after laser excitation at 535nm. In the case of P3HT/PCBM the experimental points were fitted to a power law function, obtaining an exponential factor of 0.5.
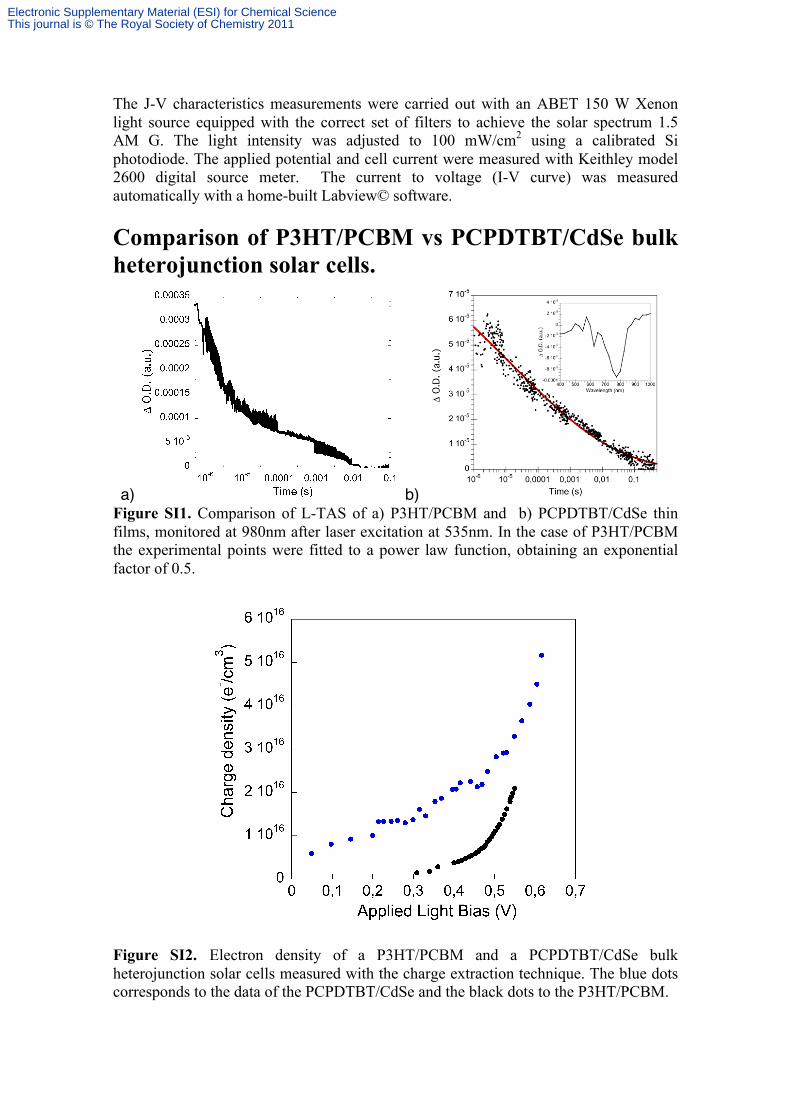
Figure SI2. Electron density of a P3HT/PCBM and a PCPDTBT/CdSe bulk heterojunction solar cells measured with the charge extraction technique. The blue dots corresponds to the data of the PCPDTBT/CdSe and the black dots to the P3HT/PCBM.
Electronic Supplementary Material (ESI) for Chemical ScienceThis journal is © The Royal Society of Chemistry 2011
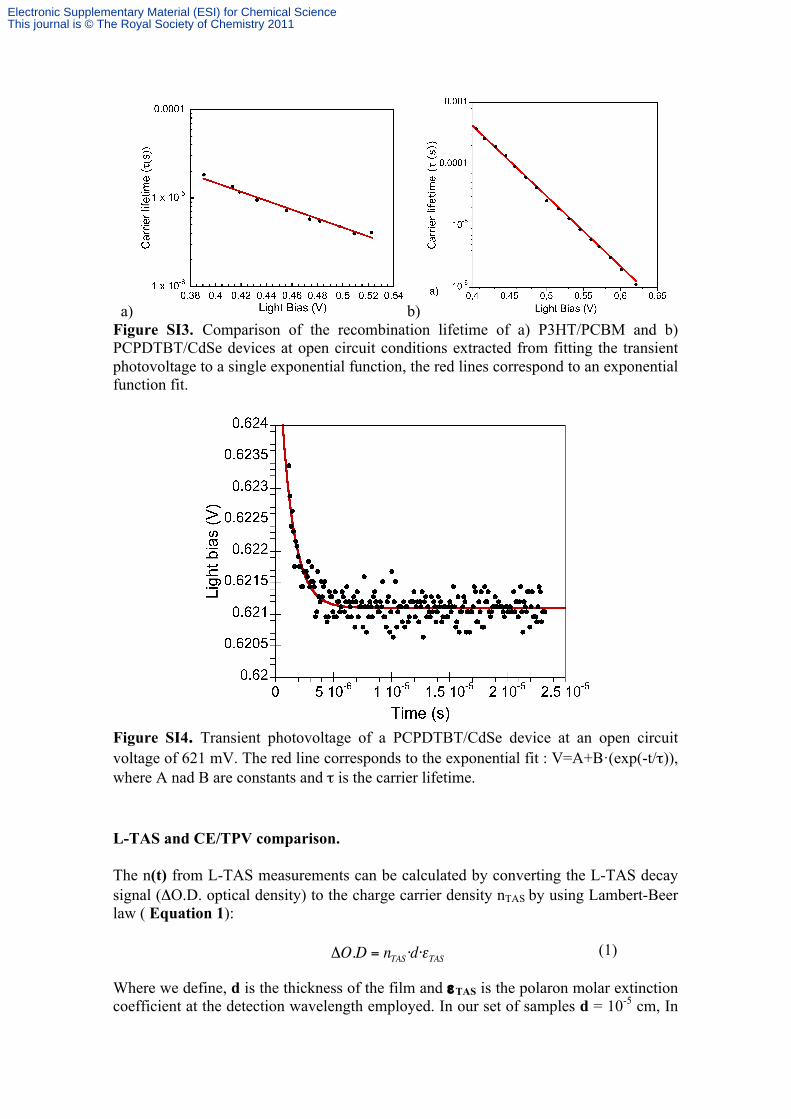
a) b) Figure SI3. Comparison of the recombination lifetime of a) P3HT/PCBM and b) PCPDTBT/CdSe devices at open circuit conditions extracted from fitting the transient photovoltage to a single exponential function, the red lines correspond to an exponential function fit.
Figure SI4. Transient photovoltage of a PCPDTBT/CdSe device at an open circuit voltage of 621 mV. The red line corresponds to the exponential fit : V=A+B·(exp(-t/τ)), where A nad B are constants and τ is the carrier lifetime. L-TAS and CE/TPV comparison. The n(t) from L-TAS measurements can be calculated by converting the L-TAS decay signal (ΔO.D. optical density) to the charge carrier density nTAS by using Lambert-Beer law ( Equation 1):
(1)
Where we define, d is the thickness of the film and εTAS is the polaron molar extinction coefficient at the detection wavelength employed. In our set of samples d = 10-5 cm, In
!O.D = nTAS ·d·"TAS
Electronic Supplementary Material (ESI) for Chemical ScienceThis journal is © The Royal Society of Chemistry 2011

order to determine the εTAS at 980nm (wavelength monitored at the L-TAS experiments we performed several adjustments to the experimental data as reported by Maurano et al 4. As can be seen in Figure SI5, the εTAS value results independent of the decay slope, which is constant and we only observe a change in the decay amplitude.
Figure SI5. n(t) from TAS data for different εTAS values.
Using Equation 2 we can calculated n(t) as determined by Shuttle et al 5 . (2) In the CdSe Qds:PCPDTBT case λ = 3, n0=5.88·1015 cm-3, τΔn0=1.24s. Moreover, we have used several values on nt=0 in order to see if there is substancial difference in n(t) when nt=0 vary. The dependence of n(t) with nt=0 is shown in Figure SI6, and as can be seen there is almost no difference. We used a value of 5·1015 cm3 for nt=0 as it is in good agreement with the value of charge carrier density (n) obtained by the CE technique as described in the manuscript.
n(t) = nt=0 1+!·nt=0
! ·t(1+ !)·"#n0 ·n0
!
$
%&&
'
())
*1/!
Electronic Supplementary Material (ESI) for Chemical ScienceThis journal is © The Royal Society of Chemistry 2011
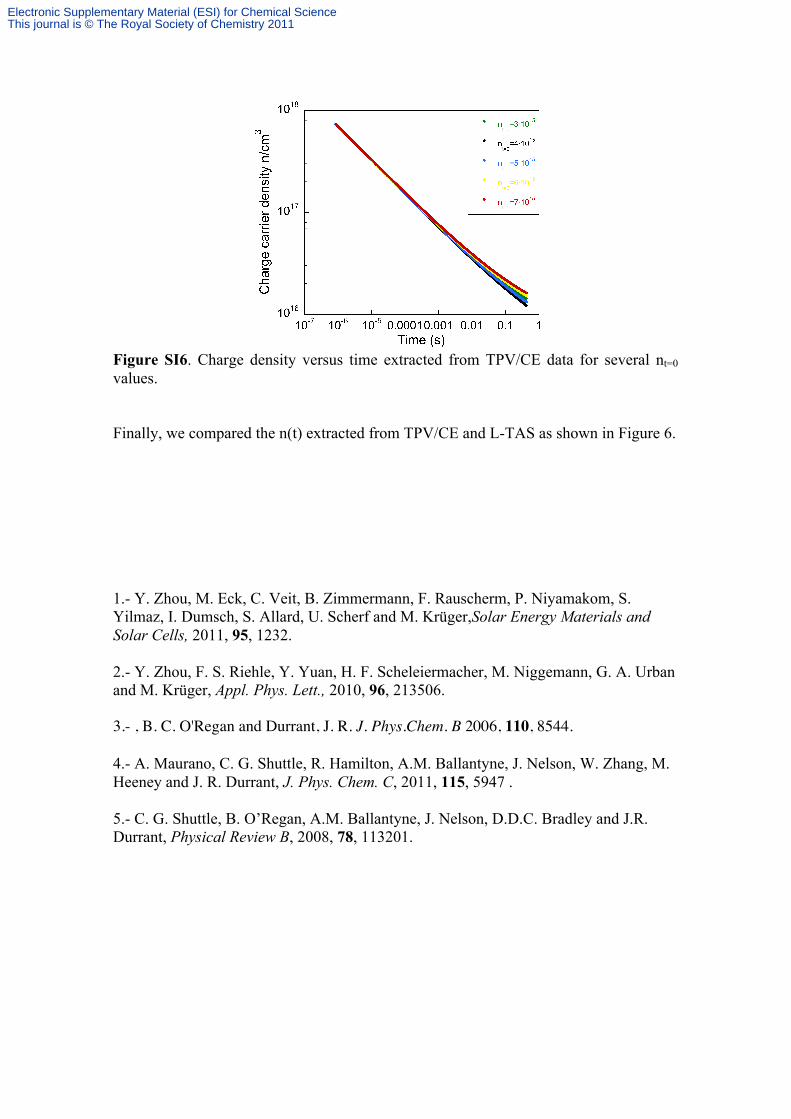
Figure SI6. Charge density versus time extracted from TPV/CE data for several nt=0 values. Finally, we compared the n(t) extracted from TPV/CE and L-TAS as shown in Figure 6. 1.- Y. Zhou, M. Eck, C. Veit, B. Zimmermann, F. Rauscherm, P. Niyamakom, S. Yilmaz, I. Dumsch, S. Allard, U. Scherf and M. Krüger,Solar Energy Materials and Solar Cells, 2011, 95, 1232. 2.- Y. Zhou, F. S. Riehle, Y. Yuan, H. F. Scheleiermacher, M. Niggemann, G. A. Urban and M. Krüger, Appl. Phys. Lett., 2010, 96, 213506. 3.- , B. C. O'Regan and Durrant, J. R. J. Phys.Chem. B 2006, 110, 8544. 4.- A. Maurano, C. G. Shuttle, R. Hamilton, A.M. Ballantyne, J. Nelson, W. Zhang, M. Heeney and J. R. Durrant, J. Phys. Chem. C, 2011, 115, 5947 . 5.- C. G. Shuttle, B. O’Regan, A.M. Ballantyne, J. Nelson, D.D.C. Bradley and J.R. Durrant, Physical Review B, 2008, 78, 113201.
Electronic Supplementary Material (ESI) for Chemical ScienceThis journal is © The Royal Society of Chemistry 2011