Embed Size (px)
Citation preview
Charge generation and recombination
in solid-state dye-sensitized solar cells
Dissertation zur Erlangung des Grades
“Doktor der Naturwissenschaften”
im Promotionsfach Chemie
am Fachbereich Chemie, Pharmazie und Geowissenschaften
der Johannes Gutenberg-Universität
in Mainz
Yoojin Kim
geb. in Seoul
Mainz, in September 2014


I
This dissertation contains work of my own carried out at the Max Planck Institute for Polymer
Research (Max Planck Institut für Polymerforschung) in Mainz. I hereby declare that I wrote this
dissertation without any unauthorized external assistance and I used only results acknowledged in the
work. I complied with the rules of standard scientific practice as formulated in the statutes of the
Johannes Gutenberg-University Mainz to insure standard scientific practice. This dissertation has not
been submitted in whole or in part for the award of a degree at this or any other university.
Yoojin Kim

II

III
After arriving in Mainz I planted some seeds, in my house, I still remember the first chilly morning
when weak, dainty, and light green buds stuck their leaves out of the soil. They grew quickly, proving
that they could grow at a pace which I couldn‟t imagine. Since arriving here at MPIP I‟ve wonder at
which pace I grew, as well. Probably not as fast. But still, faster than I thought I could.
I‟d like to sincerely thank my supervisor, Dr. Frédéric Laquai for his constructive advice and warm
help. He encouraged and motivated me throughout my Ph.D. I‟d like to thank Prof. Rudolf Zentel for
evaluating my thesis. Without my friends, Ralf, Hun, Michael, Valentin, Fabian, Hannah, Julian,
Dominik, Clare, Ian and Simon, who made me laugh so much and gave me lots of kind help. I can‟t
imagine my life in Mainz. Last, I‟d like to thank my lifetime companion, Stefan, for his great patience
with me and his jokes; my mum and Yooil for standing by me all the time; and my Junim for
everything you gave me.
So now, it‟s time to go outside to get more wind, rain, and sun.

IV
SUMMARY
This dissertation deals with charge generation and recombination in solid-state dye-sensitized solar
cells that use spiro-OMeTAD as a hole conductor. It is divided into three case studies: i.) core-
enlarged rylene dyes, ii.) a perylene monoimide dye, and iii.) donor – π spacer (cyclopentadithiophene)
– acceptor dyes. Despite high molar extinction coefficients and high absorbance of sensitized films,
some of those dye molecules did not show high photovoltaic efficiencies. In order to understand the
origin of the poor device performance, broadband ultrafast transient absorption spectroscopy was
carried out on solar cell devices.
Specifically, the effect of anchor groups, dipole moments, photoluminescence lifetimes, Li cation-
sensitivity, and carrier dynamics, which have a significant influence on the power conversion
efficiency are investigated. In the first case study, the shortest core-enlarged rylene dye exhibited the
highest power conversion efficiency among the other dye molecules due to much longer lifetimes of
excited states than the core-extended rylene dye did. The lifetimes further decreased when the maleic
acid anchor group underwent ring opening during adsorption onto a mesoporous metal oxide
semiconductor surface. This was due to changes in dipole moment between the ground and excited
state as calculated by density functional theory (DFT, B3LYP) supporting unfavorable injection upon
ring opening of the anhydride anchoring groups by a changed direction of dipole moments. In the
second study, a perylene monoimide derivative dye, ID889, showed an efficiency of 4.5% in a solid-
state dye-sensitized device. ID889 could generate long-lived dye cations even without the help of an
additive; however, after Li cation use, stabilized charge generation and regeneration processes were
observed. Furthermore, reductive quenching was not observed in an ID889-sensitized device when a
soft-modelling technique, multivariate curve resolution (MCR), was used to determine the dynamics
of excitons based on TA data. Last, in cyclopentadithiophene (CPDT) building block dyes with a
typical D-π-A molecular structure, FPH224 and 233 showed better power conversion efficiencies in
devices than FPH231 and 303 due to high injection efficiency (IE) and long lifetime of the excited
state. This appeared to originate from a reductive quenching of FPH231 and 303, whereas FPH224
and 233 exhibited moderate rates of spiro cation decay dynamics.

V
VI
ZUSAMMENFASSUNG
Diese Doktorarbeit befasst sich mit Ladungsgeneration und – rekombination in Feststoff-
Farbstoffsolarzellen, die spiro-OMeTAD als Lochleiter verwenden. Die vorliegende Arbeit ist in drei
Fallstudien unterteilt: i.) Kern-erweiterte Rylen-Farbstoffe, ii.) ein Perylenmonoimid-Farbstoff und iii.)
Donor-π verbrückte (Cyclopentadithiophen)-Akzeptor-Farbstoffe. Trotz ihres hohen molaren
Extinktionskoeffizienten und der hohen Absorbanz der sensibilisierten Filme, zeigen einige dieser
Farbstoffmoleküle nur geringe photovoltaischen Effizienzen. Um den Ursprung des geringen
Wirkungsgrades herauszufinden, wurde breitbandige, ultraschnelle transiente
Absorptionsspektroskopie an Solarzellen durchgeführt.
Insbesondere die Auswirkungen verschiedender Ankergruppen, Dipolmomente,
Photolumineszenzlebenszeiten, Lithium-Kationensensitivität und Ladungsträgerdynamik, die alle
einen großen Einfluss auf den Wirkungsgrad der Solarzelle besitzen, wurden untersucht. In der ersten
Fallstudie zeigte ein kurzer Rylen-Farbstoff aufgrund deutlich verlängerter Lebenszeiten die beste
Effizienz im Vergleich zu größeren Kern-erweiterten Rylen-Farbstoffen. Die Lebenszeit wurde weiter
reduziert, wenn Maleinsäure als Ankergruppe unter einer Ringöffnungsreaktion an die mesoporöse
Oberfläche des Metalloxid-Halbleiters adsorbierte. Dies konnte mit Hilfe von Berechnungen mittels
der Dichtefunktionaltheorie (DFT, B3LYP) auf die Differenz des Dipolmoments zwischen
Grundzustand und angeregtem Zustand zurückgeführt werden. Die Berechnungen bekräftigen die
unvorteilhafte Injektion von Ladungen durch die Änderung der Richtung des Dipolmoments, wenn
eine Ringöffnung der Anhydridgruppe stattfindet. In der zweiten Studie zeigte das Perylenmonoimid-
Derivat ID889 einen Wirkungsgrad von 4.5% in Feststoff-Farbstoffsolarzellen, wobei ID889 sogar
ohne Zuhilfenahme eines Additivs in der Lage ist langlebige Farbstoffkationen zu bilden. Die
Verwendung von Lithium-Kationen stabilisiert jedoch sowohl den Prozess der Ladungsgeneration als
auch den der Ladungsregeneration. Des Weiteren wurde in ID889-sensitivierten Bauteilen kein
reduktives Löschen beobachtet. Dabei wurde die Dynamik der Exzitonen mittels einer soft-modelling
Methode Kurvenanalyse aus den Daten der transienten Absorptionsspektroskopie gewonnen. Zuletzt
wurden Strukturen mit Cyclopentadithiophen(CPDT)-Baustein untersucht, die eine typische D-π-A
Molekülstruktur bilden. FPH224 und 233 zeigten dabei eine bessere Effizienz als FPH231 und 303
aufgrund einer großen Injektionseffizienz (IE) und längerer Lebenszeit der angeregten Zustände. Dies
kann auf reduktives Löschen in FPH231 und 303 zurückgeführt werden, wohingegen FPH224 und 233
einen moderaten Zerfall des Spirokationensignals zeigten.

VII

1
CONTENTS
1. INTRODUCTION…………………………………………………………………………………..07
2. BACKGROUND…………………………………………………………………………………....11
2.1 Interaction between electromagnetic radiation and conjugated organic molecules………….....11
2.1.1 Electronic states and configuration of organic molecules
2.1.2 Jablonski diagram
2.1.3 Absorption
Conditions for absorption
Transition probability for absorption and the Franck-Condon principle
Absorption related to Einstein coefficients
2.1.4. Stark effect
2.1.5 Emission
Einstein coefficients
Decay rates and quantum yield
2.1.6 Solvent polarity (Solvatochromism)
2.1.7. Metal complexes
2.2 Transfer process………………...………………………………………………………………20
2.2.1. Electron transfer: semi-classical Marcus theory
2.2.2. Energy transfer
2.3 Laser spectroscopy……………………………………………………………………………..23
2.3.1. Transient absorption spectroscopy (TAS)
2.3.2. Generation of femtosecond laser pulses
Creation
2
Amplification
2.3.3. Supercontinuum generation
2.4 Dye-sensitized solar cells (DSCs)……………………………………………………………...28
2.4.1 Excitons
2.4.2 Working principle of DSCs
Dye-sensitized solar cells using metal oxide semiconductors
2.4.3. Dyes
2.4.3.1. Ruthenium complex dyes
2.4.3.2. Organic dyes
Rylene related dyes
Cyclopentadithiophene (CPDT) related dyes
2.4.4. Crucial factors affecting injection of electron
Anchoring group
Dipole moment and interfacial environment
2.4.5. Solid-state DSCs
Additives
Solid-state hole transporter: Spiro-OMeTAD
Reductive quenching in solid-state DSCs
2.5 Multivariate curve resolution (MCR)…………………………………………………………..36
3. EXPERIMENTAL TECHNIQUES………………………………………………………………....37
3.1 Sample preparation……………………………………………………………………………..37
3.1.1. Device fabrication
3.1.2. Samples for spectroscopy
3.2. Steady-state measurements……………………………………………………………………40
3.2.1. J-V characteristics
3
3.2.2. External quantum efficiency
3.2.3. UV-Vis absorption
3.2.4. Photoinduced absorption spectroscopy
3.3. Time-resolved measurements………………………………………………………………….45
3.3.1. Photoluminescence spectroscopy
3.3.2. Transient absorption spectroscopy
3.4. Materials……………………………………………………………………………………….47
3.4.1. Naphthalene core-enlarged rylene family dyes
3.4.2. Perylene derivative dye
3.4.3. Cyclopentadithiophene building block dye
3.4.4. Z907
4. RYLENEANHYDRIDE SENSITIZERS…………………………………………………………...51
4.1. Materials……………………………………………………………………………………….51
4.2. Dyes in solution………………………………………………………………………………..54
4.2.1. Absorption and emission spectra of dye solutions
4.2.2. PL decay transients of dye solutions
4.3. Dipole moment of dyes in solution…………………………………………………………….57
4.4. Dye-sensitized metal oxide nanoparticle films…………………………………………….......59
4.5. Dipole moments calculated by density functional theory……………………………………....63
4.6. Detection of long-lived species ………………………………………………………………..64
4.6.1. Detection of dye and hole conductor cations
4.6.2. Quasi-steady-state photoinduced absorption spectroscopy
4.7. J-V curves and external quantum efficiency (EQE)…………………………………………....67
4.8. Ryleneanhydrides sensitizers: Conclusions…………………………………………………... ..69
4
5. PERYLENE MONOIMIDE DERIVATIVE SENSITIZER, ID889………………………………..71
5.1. Materials and samples used……………………………………………………………………71
5.2. Absorption/Emission spectra…………………………………………………………………..72
5.2.1. Dye solutions
5.2.2. Dye-sensitized nanoparticle films
5.2.3. Dye cation and anion absorption
5.3. Device characteristics and photoinduced absorption measurement …………………………..74
5.3.1. J-V characteristics
5.3.2. Quasi-steady-state photoinduced absorption (PIA) measurements
5.4 Measurement of dye solutions………………………………………………………………….77
5.4.1. Photoluminescence (PL) Streak Camera measurements
5.4.2. Transient Absorption (TA) measurements
5.5. Time-resolved Photoluminescence (PL) of dye-sensitized films……………………………...80
5.6. Transient absorption spectroscopy on films…………………………………………………...83
5.6.1. Main species observed
5.6.2. Charge Transfer (CT) states on alumina
5.6.3. Generation of free charge carriers after addition of Li-TFSI on titania surface
5.6.4. Regeneration using Spiro-OMeTAD and the critical role of Li-TFSI
5.7. Reductive quenching…………………………………………………………………………..94
5.8. ID889: Conclusions……………………………………………………………………………99
6. CYCLOPENTADITHIOPHENE (CPDT) BUILDING BLOCK DYES………………………….102
6.1. Materials and samples………………………………………………………………………..102
6.2. Dyes in solution………………………………………………………………………………104
6.2.1. Absorption and emission spectra

5
6.2.2. Decay dynamics
6.3. Films………………………………………………………………………………………….107
6.3.1. Absorption and Emission spectra
6.3.2. PL dynamics
6.3.3. Injection Efficiency (IE)
6.4. Device characteristics and photoinduced absorption experiments…………………………...113
6.4.1. J-V curves and EQE
6.4.2. Quasi-steady-state photoinduced absorption experiments
6.5. Transient Absorption Spectroscopy…………………………………………………………..117
6.5.1. FPH224
6.5.2. FPH233
6.5.3. FPH231
6.5.4. FPH303
6.6. Comparison of charge generation and recombination of all four dyes…………………..…...131
6.7. CPDT building block sensitizers: Conclusions………………………………………….…...132
7. DISCUSSION…………………………………………………………………………………......135
7.1 Energy levels………………………………………………………………………………….135
7.2 Anchoring groups……………………………………………………………………………..136
7.3 Dipole moments and Use of Li-TFSI…………………………………………………………137
7.4 Long-lived charges……………………………………………………………………………139
7.5 Conclusion……………………………………………………………………………………139
8. REFERENCES…………………………………………………………………………………….141

6
9. LIST OF ACRONYMS……………………………………………………………………………149
10. LIST OF FIGURES………………………………………………………………………………153

7
1. INTRODUCTION
The International Energy Outlook 2013 (IEO2013) estimates that energy consumption will increase by
over 50% from 524 quadrillion British thermal units (Btu, joule) in 2013 to 630 quadrillion Btu in
2040 [1]
. In this outlook, renewable and nuclear power are projected to be the fastest growing energy
sources, increasing by 2.5% per year, and renewable energy is anticipated to constitute almost 20% of
the total energy capacity in 2040. Photovoltaic and wind energy are expected to occupy the majority of
renewable energy capacity growth and photovoltaic energy may increase at a rate of 9.8% each year.
The sun radiates about 120-170 PW of energy to the earth and a massive demand for energy can be
resolved if even a small fraction of this solar energy can be converted. A.E. Becquerel discovered
electricity conversion using sunlight and built the first photovoltaic cell in 1839. For the first solid-
state solar cell, C. Fritts made a solar cell using selenium in 1883 after W. Smith and W.G.Adams
studied the photovoltaic effect in selenium in 1873 and 1876. Silicon solar cells became widely used
after G. Pearson reported a higher efficiency in silicon photovoltaics than in selenium cells in 1970.
During the cold war era, the space race pushed forward the study of photovoltaics and development of
practical uses due to the need to power satellites. Since then, various materials, such as silicon,
cadmium telluride or copper indium selenide, or compound-semiconductors from the III-V family, i.e.
Ga-As, Ga-P, or InGa-As, have achieved high performance and have been used as industrial
photovoltaic solar cells.
Against these expensive inorganic materials, emerging organic photovoltaic cells using polymers,
quantum dot technology, perovskite, and light absorbing dye-sensitized cells were proposed and
studied due to their low production cost potential and since they may be more environmentally
friendly. However, a main difference between inorganic and organic solar cells is how they respond to
absorption of a photon. Light absorption leads to direct creation of free electron-hole pairs in most
conventional (inorganic) semiconductor cells, whilst it generates a strongly bound electron-hole pair in
excitonic (organic) semiconductors due to different dielectric constants. Consequently, the efficiencies
of these cells and modules of organic photovoltaic devices remain between 8 and 16% [2] [3] [4]
and their
stabilities are not yet as good as those of inorganic devices. Therefore, efficiencies and long-term
stabilities have to be further improved to reach a broad market share and study of large-scale energy
generation is necessary.
Polymer-polymer or polymer-fullerene solar cells have exhibited gradual increases in efficiency
through development of new materials and changes in device architecture. Particularly, application of
the bulk heterojunction (BHJ) concept [5]
has significantly improved the efficiencies of devices
compared to a planar heterojunction (HJ) bilayer, as reported by Tang in 1986 [6]
. The BHJ device is
used to increase the contact area between donor and acceptor materials for enhanced charge generation
when a blend of donor and acceptor materials in a solution is casted onto a substrate. The morphology

8
in BHJ cells is closely related to the charge collection rate and this is further determined by the ratio of
donor and acceptor materials used, the drying process depending on the kind of solvent, the annealing
process, etc. However, a critical hindrance in polymer solar cells is the large Columbic interaction due
to the low dielectric constant of the materials, leading to difficult charge separation. In addition, a low
charge mobility causes charge recombination, due to slow charge collection. Although devices using
polymers are projected to one day exhibit efficiencies of about 20-22% in a single cell [7-9]
and 20-24%
in a tandem cell [10, 11]
when a Shockley–Queisser thermodynamic model [12]
is used, the maximum
efficiency of polymer-polymer single cell still remains at 9% [13]
due to the limited (internal) quantum
efficiency.
Quantum dots reduced below the size of the exciton Bohr radius were initially proposed to replace
expensive GaAs materials in inorganic tandem cells. GaAs devices show high absorption and a
bandgap tunable by elemental composition. Quantum dots are theoretically able to achieve comparable
efficiencies because the energy band gap of quantum dots can be easily tuned by changing the dot size.
Also, similar to GaAs, quantum dots can enhance optical absorbance by harvesting photons in the near
infrared region. Quantum dots are used not only in inorganic solar cells but also in hybrid solar cells
such as in dye-sensitized solar cells, replacing light absorbing dyes [14, 15]
. However, liquid electrolytes
used as a redox couple in the dye-sensitized solar cells cause photo-corrosion problems of quantum
dots. For better stability, a solid-state dye sensitized solar cell can be another solution [16]
, but the
efficiencies are still pretty low. The performance of quantum dot photovoltaic devices has markedly
increased in the last five years and one report has shown an efficiency of 5.2 % [17]
owing to the
quantum dots‟ ultrafast exciton dissociation and charge transfer.
Perovskite solar cells, another type of hybrid solar cell, consist of an extremely thin absorber layer of
perovskite with a thickness of less than 10 nm on top of mesoporous metal oxide particles such as
titania or alumina. The electrons are extracted from a fluorinated tin oxide (FTO) electrode and the
holes are collected from a counter-electrode after a hole-transfer process occurs with the liquid
electrolyte or solid-state hole conductor. Performance of perovskite solar cells has increased
significantly to 19.3 % at present [3, 18]
, from the 3% of its first report in 2009 [19]
, and it is expected to
increase further. The high performance is attributed to the long diffusion length of electron-hole pairs,
ranging from 100 nm [20]
to almost 1 μm, and optimized geometry of perovskites for better charge
collection [21]
. However, the material itself needs to be closely studied since its chemical composition
and crystal structure can differ, as can its photophysical properties.
Another hybrid solar cell, namely dye-sensitized solar cells (DSC), as studied in this dissertation, uses
dyes as a light harvesting photosensitizer, entering an excited state upon photon absorption followed
by injection of an electron into the conduction band of a metal oxide particle layer such as TiO2, ZnO
and SnO2. The oxidized dye generated after injection of electrons is regenerated by a liquid-state
electrolyte or by transfer of holes to a solid-state hole conductor. The electrons and holes are then

9
collected by a transparent conductive oxide (TCO) electrode and a counter-electrode such as platinum
or silver, respectively. DSCs have shown a gradual increase in performance since first introduced in
1991 [22]
, due to the development of dyes, redox mediators, hole conductors, and additives. Due to this
increased understanding and exploration, devices have reached efficiencies exceeding 12% at lab scale
in liquid-state DSCs [23]
and 6% in solid-state DSCs [24]
.
The critical benefits of DSCs in the market include easier manufacturing, device transparency,
selective light absorption properties, and mechanical flexibility. With these advantages, applications of
DSCs extend from powering small electronics such as mobiles (MKE Technology, Taiwan) and
tablets (G24 Innovation and Logitech) to large-area solar panels for building-integrated photovoltaics
(Dyesol Italian BIPV Company and Fraunhofer). Flexible dye sensitized solar cells (G24 Innovation,
NGK Laboratories, KIST) are expected to increase the applications of solar cells further, perhaps to
clothes or other flexible materials.
All these organic and hybrid solar cells go through 5 photovoltaic conversion steps: photon harvesting
by the absorbing system, excited state generation, charge separation, charge transport and charge
collection. In DSCs, a light absorbing dye, an electron donor, creates the excited state, whereupon an
electron is injected into the conduction band to a semiconducting layer, an electron acceptor. The
charges are separated after overcoming the strong Coulomb interaction of an electron and a hole. Here,
the electron injection yield is close to unity since the electron injection process takes place on the
ultrafast timescale, below a few hundred femtoseconds [25-29]
. The oxidized dye, after electron injection,
goes through a redox process with liquid-state electrolytes or regeneration by a solid-state hole
conductor, depending on the type of reducing agent, to be ready for the next photo-excitation process.
Figure 1-1. A variety of applications of dye-sensitized solar cells in electronics and building: tablet
manufactured by G24 Innovation and Logitech (top left), flexible dye-sensitized solar cells by G24
innovation (top right), and building-integrated photovoltaics by Fraunhofer (bottom).

10
Injected electrons in the metal oxide layer can recombine with oxidized dye molecules on the nano- to
milli-seconds timescale, thus regeneration needs to take place prior to recombination in a time range of
sub-milliseconds for liquid state [30, 31]
and nano- to microseconds for solid state DSCs [32-34]
. Finally,
even if recombination is avoided, the electron and hole have to diffuse to each electrode to be
collected. In this dissertation, the charge generation and recombination processes in solid-state DSCs
are reported with three case studies using organic dye molecules. A detailed description of the light
conversion processes will be given in theory section, Chapter 2.
This study has two primary objectives. The first is to understand how charge generation and
regeneration processes contribute to PCE in solid-state DSCs when new dye molecules are employed.
The second is to find out which physical properties and how the environment of the sensitizer
molecules is correlated with charge generation and regeneration or recombination. Three case studies
are introduced: rylene dyes, novel perylene dyes, and CPDT π-conjugated building block dyes with
different donor moieties and anchoring groups.
In rylene dyes, perylene, terrylene, and quaterrylene derivatives are investigated as the core size of the
rylene dyes is increased. The different efficiencies of these dyes are explained experimentally, with
optical absorbance, electron injection rates, and excited state lifetimes. Density functional theory (DFT)
is employed to relate the varying performances to changes of dipole moments when the acid anhydride
rylene dyes open on interaction with a mesoporous titania surface.
In the second case study a novel perylene imide derivative, containing a fused dibenzothiophene as
spacer and triarylamine moieties as an electron donor, is studied. Devices using this dye exhibited very
good EQE values, up to 70 %, leading to a high short circuit current and ultimately to an efficiency of
4.5 % in solid-state DSCs. The high photocurrent can be explained by long excited state lifetimes
determined by time-resolved photoluminescence, a favorable electron density in the HOMO/LUMO
level by DFT, facilitated injection/regeneration by the use of Li additive, and fast electron injection
without reductive quenching by transient absorption pump-probe spectroscopy and soft-modelling
using multivariate curve resolution (MCR).
In the last study, four dyes are investigated: three dyes have the structure A (carboxylic acid anchoring
group) - π (cyclopentadithiophene, CPDT) – D (different electron-rich donor moieties such as
triarylamine moiety and two novel moieties) and one dye has the structure A (rhodanine-3-acetic acid
and carboxylic acid anchoring group) - π (CPDT) – D (electron rich donor moiety). High performing
dyes have long-living TA signals due to efficient regeneration, whereas poor performing dyes show
less long-living signals of oxidized hole-transporting material.
The theory is described in Chapter 2 and the experimental methods and materials are described in
Chapter 3. We discuss the case studies using different molecules in Chapter 4, 5, and 6. Finally,
conclusions are presented in Chapter 7.

11
2. BACKGROUND
2.1 Interaction between electromagnetic radiation and conjugated organic molecules
Conjugated organic molecules that have a bandgap in the visible enter an excited state by gaining
energy from photon absorption with a photon energy corresponding to the bandgap. In this chapter,
interaction of a light-absorbing organic system with electromagnetic radiation is described by the
processes of photon absorption and emission.
2.1.1 Electronic states and configuration of organic molecules
A conjugation system has a sequence of alternating single and double bonds, with sp2 hybridization at
each participating carbon atom. In a conjugated system, the p-orbitals of each carbon atom combine to
form a large molecular orbital over the length of the system. This means that the system does not
really consist of alternating single and double bonds, as the electrons are delocalized over the
conjugated system. Hence, the bond lengths between each atom within the system are the same,
shorter and stronger than a single σ bond, but with a bond length greater than that of a non-delocalized
π bond.
A typical example of a conjugated system is a benzene ring, which shows very good stability due to
delocalization of electrons from 6 p-orbitals. The σ bonds are formed when a pair of atomic orbitals
overlaps end-on, whereas π bonds are formed when a pair of atomic orbitals overlaps side-on. Figure
2-1 shows schematically the σ and π bonds in a benzene ring.
Figure 2- 1. σ and π bonds in a benzene ring [35]
.
2.1.2 Jablonski diagram
The Jablonski diagram shown in Figure 2-2 shows the electronic states (Sn or Tn) and their vibrational
energy levels for a typical organic molecule. The molecule can be excited from the ground state (S0) to
the singlet excited states (Sn, n ≥ 1) by an absorption of a photon having an energy corresponding to
E=hv (h: Planck‟s constant, v: frequency of the absorbed light).
12
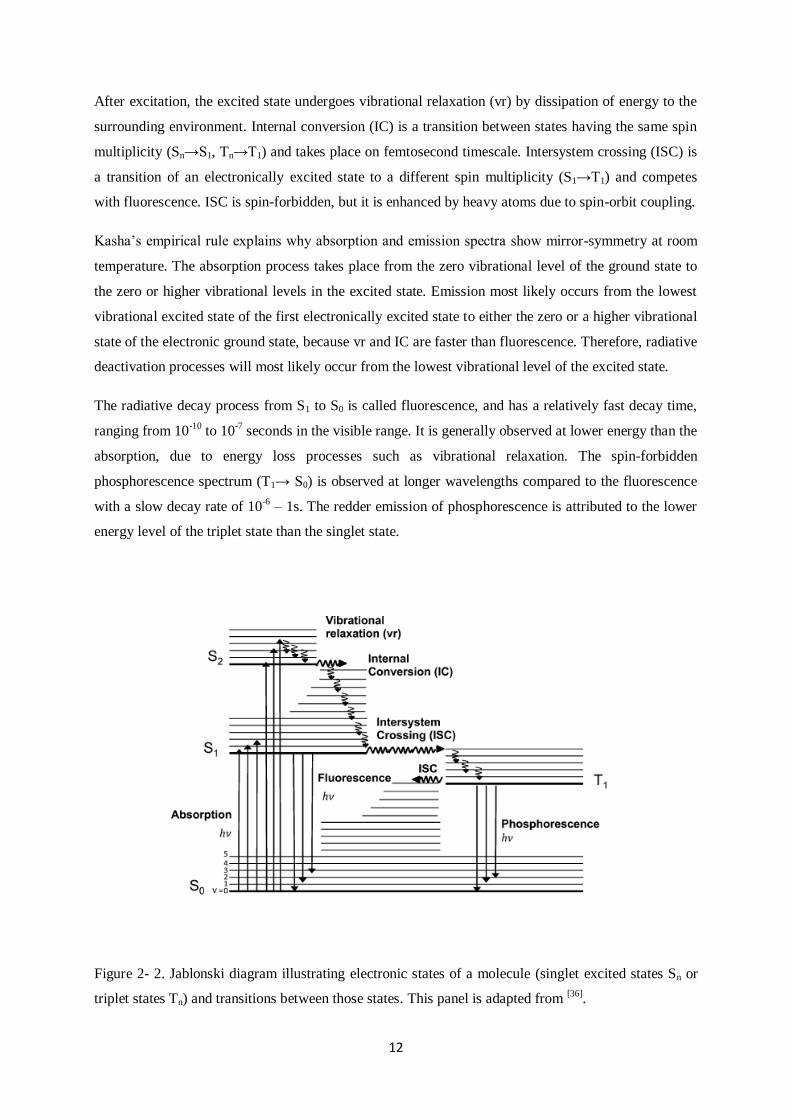
After excitation, the excited state undergoes vibrational relaxation (vr) by dissipation of energy to the
surrounding environment. Internal conversion (IC) is a transition between states having the same spin
multiplicity (Sn→S1, Tn→T1) and takes place on femtosecond timescale. Intersystem crossing (ISC) is
a transition of an electronically excited state to a different spin multiplicity (S1→T1) and competes
with fluorescence. ISC is spin-forbidden, but it is enhanced by heavy atoms due to spin-orbit coupling.
Kasha‟s empirical rule explains why absorption and emission spectra show mirror-symmetry at room
temperature. The absorption process takes place from the zero vibrational level of the ground state to
the zero or higher vibrational levels in the excited state. Emission most likely occurs from the lowest
vibrational excited state of the first electronically excited state to either the zero or a higher vibrational
state of the electronic ground state, because vr and IC are faster than fluorescence. Therefore, radiative
deactivation processes will most likely occur from the lowest vibrational level of the excited state.
The radiative decay process from S1 to S0 is called fluorescence, and has a relatively fast decay time,
ranging from 10-10
to 10-7 seconds in the visible range. It is generally observed at lower energy than the
absorption, due to energy loss processes such as vibrational relaxation. The spin-forbidden
phosphorescence spectrum (T1→ S0) is observed at longer wavelengths compared to the fluorescence
with a slow decay rate of 10-6 – 1s. The redder emission of phosphorescence is attributed to the lower
energy level of the triplet state than the singlet state.
Figure 2- 2. Jablonski diagram illustrating electronic states of a molecule (singlet excited states Sn or
triplet states Tn) and transitions between those states. This panel is adapted from [36]
.

13
2.1.3 Absorption
Conditions for absorption
Electrons fill the lowest lying orbitals of the molecules and the highest energy orbital filled with
electrons is called the highest occupied molecular orbital (HOMO). Electrons are promoted into
unoccupied molecular orbitals (which are typically non-bonding or anti-bonding) by excitation, with
the lowest energy unoccupied molecular orbital referred to as the LUMO. When a light-absorbing
system such as a molecule or an atom obtains energy from absorption of photons corresponding to the
energy of the bandgap between the HOMO and LUMO, then an electronically excited state is created.
However, if the energy is not matched with the bandgap then, the photons will not be absorbed but just
scattered, reflected, or transmitted.
Light absorption by a molecule can be described by interaction of the molecule‟s transition dipole
moment with the photon. The photon is a discrete quantum of electromagnetic radiation (EMR) that
has electric and magnetic field components. Oscillation of the dipole, induced by EMR, leads to
perturbation of the electronic wavefunctions. If this electromagnetic field perturbs the electronic
wavefunction effectively, then the electrons will be pushed away to the position and the momenta of a
higher energy state; therefore, an electronic transition finally takes place.
Transition probability for absorption and the Franck-Condon principle
As described above, an electronic transition occurs due to the interaction of an electromagnetic field
with a molecule's dipole moment. The transition probability of an electron for an absorption process is
calculated from the integral of the two wavefunctions of the initial electronic state, ψi , and the final
state, ψf .
Mif=<ψi | ⃗⃗ | ψf> (2. 1)
is a dipole moment operator that is defined as Σ j for a single electron, where e and j indicate the
electron charge and a vector position with respect to a nucleus, respectively. The transition dipole
moment, Mif, is related to the electronic transition between two states and the transition probability for
an absorption process is proportional to the square of the transition dipole moment, | ⃗⃗ if|2. The
transition dipole moment is defined by a product of three terms as shown in equation (2. 2 ) using the
Born-Oppenheimer (BO) approximation, where the wavefunction of a system can be described by
electronic and nuclear (vibrational, rotational) components due to the difference in the mass of
separated electron and nuclei. Therefore, the total molecular energy is the same as the product of the
electronic, vibrational, and rotational energies of the molecule in the solid state, ψ=ɸ∙S∙X;
Mif=<ɸi| ⃗⃗ |ɸf><Si|Sf>Ʃn<Xi,0|Xf,n> (vibrational transition : 0→ n) (2. 2)
14
Mif describes if the transition will be forbidden (zero-resultant) or allowed (non-zero-resultant) based
on selection rules. The first term on the right side is an integral containing the orbitals of the two states
and a dipole moment operator. This term, describing transition symmetry, needs to be an even function
for the integral to be a non-zero resultant (symmetry allowed), because integration of any odd function
will yield zero. Strong transitions such as π→π* and σ→σ* transitions show large spatial overlap
between the two states, and so the integral is large in these cases. The second term is a non-zero
resultant integral when the two states have the same spin multiplicity. In a spin forbidden transition, i.e.
from singlet to triplet, the integral will be 0. However, heavy atoms, such as palladium or platinum,
will also show spin-forbidden transition, due to spin-orbit coupling.
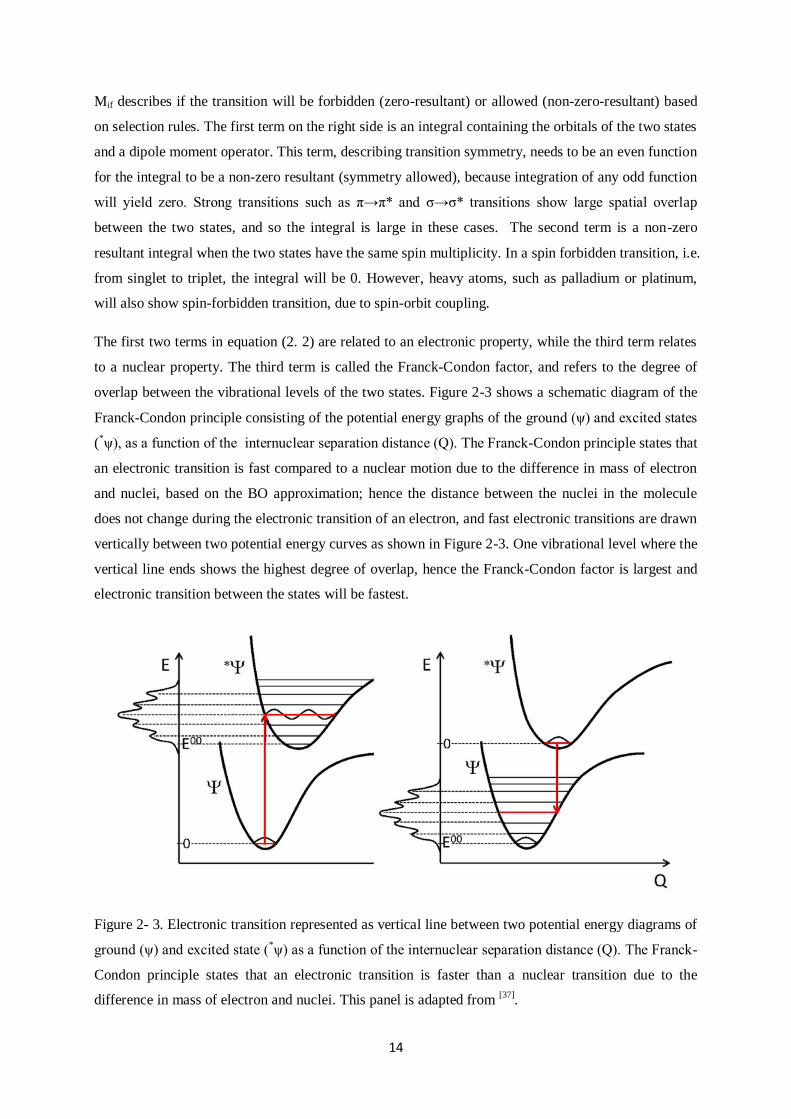
The first two terms in equation (2. 2) are related to an electronic property, while the third term relates
to a nuclear property. The third term is called the Franck-Condon factor, and refers to the degree of
overlap between the vibrational levels of the two states. Figure 2-3 shows a schematic diagram of the
Franck-Condon principle consisting of the potential energy graphs of the ground (ψ) and excited states
(*ψ), as a function of the internuclear separation distance (Q). The Franck-Condon principle states that
an electronic transition is fast compared to a nuclear motion due to the difference in mass of electron
and nuclei, based on the BO approximation; hence the distance between the nuclei in the molecule
does not change during the electronic transition of an electron, and fast electronic transitions are drawn
vertically between two potential energy curves as shown in Figure 2-3. One vibrational level where the
vertical line ends shows the highest degree of overlap, hence the Franck-Condon factor is largest and
electronic transition between the states will be fastest.
Figure 2- 3. Electronic transition represented as vertical line between two potential energy diagrams of
ground (ψ) and excited state (*ψ) as a function of the internuclear separation distance (Q). The Franck-
Condon principle states that an electronic transition is faster than a nuclear transition due to the
difference in mass of electron and nuclei. This panel is adapted from [37]
.
15
As a result of the selection rules, an electronic transition probability will be high when the two orbitals
are largely overlapped, the two states have the same spin multiplicity, and the Franck-Condon factor is
largest. However, no transition occurs when the transition probability is 0.
Absorption related to Einstein coefficients
The probability of a transition |Mif|2 has a linear relation to the absorption, ε(ṽ)dṽ, where ṽ is the
wavenumber and ε is the molar extinction coefficient. The integrated absorption coefficient (IAC) can
be experimentally obtained and is proportional to the photon harvesting process.
∫ ( )
(2. 3)
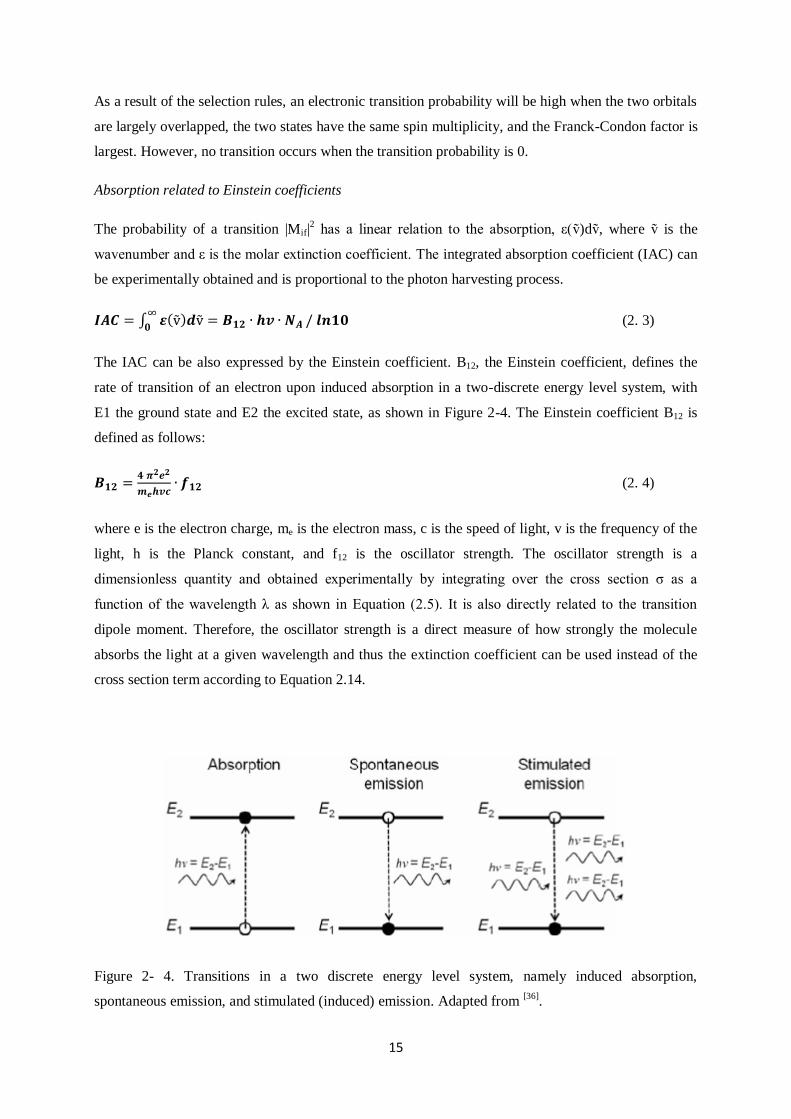
The IAC can be also expressed by the Einstein coefficient. B12, the Einstein coefficient, defines the
rate of transition of an electron upon induced absorption in a two-discrete energy level system, with
E1 the ground state and E2 the excited state, as shown in Figure 2-4. The Einstein coefficient B12 is
defined as follows:
(2. 4)
where e is the electron charge, me is the electron mass, c is the speed of light, v is the frequency of the
light, h is the Planck constant, and f12 is the oscillator strength. The oscillator strength is a
dimensionless quantity and obtained experimentally by integrating over the cross section σ as a
function of the wavelength λ as shown in Equation (2.5). It is also directly related to the transition
dipole moment. Therefore, the oscillator strength is a direct measure of how strongly the molecule
absorbs the light at a given wavelength and thus the extinction coefficient can be used instead of the
cross section term according to Equation 2.14.
Figure 2- 4. Transitions in a two discrete energy level system, namely induced absorption,
spontaneous emission, and stimulated (induced) emission. Adapted from [36]
.

16
∫
( )
(2. 5)
The oscillator strength is also used to determine if the transition is allowed or forbidden depending on
its value, i.e. f ≥ 1 for allowed transitions and f <<1 for forbidden transitions.
Different Einstein coefficients are used to define rates of electronic transitions such as induced
absorption, and spontaneous and induced (stimulated) emission. The Einstein coefficients A21 and B21
will be explained in Chapter 1.1.5.
2.1.4. Stark effect
The Zeeman effect splits up atomic nuclear spin levels into sublevels under a magnetic field, while the
Stark effect introduced by Johannes Stark in 1913 splits electronic levels under an external electric
field.
Figure 2- 5. The Stark effect on different energy levels due to interaction of dipole moments with an
external electric field. This panel is adapted from [38]
.

17
The Stark effect explains how an electric field induces energy level shifts on atoms or molecules. The
Stark effect can be divided into a linear and a quadratic term. The linear part is related to the change of
the dipole moment when the electronic transition takes place from the ground state to the excited state,
whereas the quadratic part relates to the change of the dipole moment induced by polarizability. We
only consider the linear Stark effect in this dissertation when observing molecules with a permanent
dipole moment caused by their donor-acceptor dye molecular structures. Therefore, changes in
position of the band maxima and the shape of absorption occur when the electric field affects
electronic transitions or transition dipole moments of the system.
As shown in Figure 2-5, energy levels of an atom or a molecule shift downward, if the electric field
and dipole moments are parallel (red arrow). This shift is energetically favorable, leading to red-
shifted absorption spectra, while the Stark spectrum shows a positive first derivative shape due to the
differences in absorption. However, when the electric field is antiparallel (blue arrow), the energy
level will shift upward and absorption spectra will be blue-shifted. When the direction of the dipole
moment is random, there is no net effect on the energy levels. Hence, when an electric field exists in a
system, the absorption spectra will broadened and then transient absorption spectroscopy
measurements will be also affected.
The Stark effect is often observed in the region of the ground state absorption of the dye in the bleach
signal if local electric fields exist. Therefore, derivative shape signals in the visible region where the
dyes absorb light can be often assigned to the Stark effect. The local electric field in solid-state DSCs
can be caused by photoinduced charges.
2.1.5 Emission
Emission spectra are normally observed at lower energy than absorption spectra due to the relaxation
processes as shown in the Jablonski diagram above. This difference in energy between absorption and
emission spectra is called Stokes shift.
Einstein coefficients
Radiative deactivation occurs via emission of a photon, while a radiationless deactivation will
dissipate most energy as heat and/or vibration rather than by photon emission. Deactivation means that
a molecule in the excited state returns to the ground state and thereby loses energy.
Radiative decay can be divided into two processes: spontaneous emission and stimulated (induced)
emission. The main difference between them is whether or not the decaying process is related to an
electromagnetic radiation (EMR) field. Spontaneous emission is a natural and intrinsic decay process
where an excited state (E2) spontaneously decays to a ground state (E1) by releasing energy as a
photon. Spontaneous emission is known as photoluminescence.

18
Stimulated emission, the prerequisite for lasing, becomes dominant when the population in the excited
state is larger than that in the initial state. This process is stimulated by the interaction of an excited
state (E2) with an electromagnetic wave. As a result, the state decays into the lower level (E1) by
emitting a photon. The emitted photons have the same characteristics as the incident EMR that is
frequency, phase, and direction.
The rate of spontaneous emission is proportional to the induced emission rates multiplied with the
radiation energy density of the two states (A21 B21∙ ) whereas the rate of stimulated
emission (B21) is the same as that of induced absorption (B21= B12). For a schematic diagram, see
Figure 2-4.
Decay rates and quantum yield
In a molecule, all deactivation processes, such as radiative deactivation, non-radiative deactivation,
and intersystem crossing, are competing with each other. Thus, the total decay rate of an excited state
is equal to the sum of the decay rates of all processes:
ktotal[S1]=(kf+kIC+kISC)[S1] (2. 6)
where S1 is the population of the excited state and kf, kIC, kISC are the transition rate constants for
fluorescence, internal conversion, and intersystem crossing, respectively. With the deactivation rate
constants, a photoluminescence (PL) quantum yield can be calculated. For example, the quantum yield
for fluorescence can be derived from the radiative decay rate divided by the sum of the decay rates of
the excited state.
Φf= kf/ (kf+kIC+kISC) (2. 7)
The population of excited states [S1] is time-dependent after photoexcitation and the decay can be
described as follows:
[S1]t=[S1]0 exp(
). (2. 8)
[S1]t is the population of the excited state at the time after excitation and t denotes the time elapsed
after the excitation pulse. τ indicates the excited state lifetime taking into account all decay channels,
according to:
τ=
. (2. 9)
For radiative decay, τ is defined simply by 1/kf. In this case, the equation (2.8) represents
monoexponential decay under the assumption that there is only one decay channel.
19
In this dissertation, most dynamics follow the stretched exponential decay: [S1]t=[S1]0∙exp (-(t/τ)β)+c.
The exponent β denotes a dispersion of relaxation times and c is a constant. This is known as the
Kohlrausch-Williams-Watts function, and is often used to describe relaxation in disordered materials.
In a dye-sensitized solar cell, the excited states of the dyes do not decay by just one simple decay
channel. They undergo an electron injection process, intra-/intermolecular charge transfer state
formation, or exhibit different lifetimes caused by the random orientation of dye molecules on the
titania metal oxide nanoparticles. Hence, the stretched exponential decay is used here which accounts
for the distribution of transfer rates.
To extract the mean excited state lifetime, the gamma function is used as shown in Equation (2.10).
Since the gamma function is mathematically an extension of the factorial function and can be used for
all complex numbers, an exponent from the stretched exponential decay function having a form of a
real number can be used in the gamma function to derive a mean relaxation time as shown in Equation
(2.10) and (2.11).
(
) (
) (2. 10)
(
) ∫
(
)
(2. 11)
2.1.6 Solvent polarity (Solvatochromism)
The absorption and emission of a dye in solution can change if the solvent polarity is varied, since
each solvent has a different dielectric constant and dipole moment. This phenomenon is called
solvatochromism. The interaction between solvent-solute will be considered in this section.
Negative solvatochromic properties result in blue-shifted (hypsochromic shift) absorption/emission
spectra of the dye molecules as the polarity of the solvent increases. This is due to the decrease of the
dipole moment of the dye on excitation, leading to greater stabilization of the ground state. An
increase in the dipole moment of the dye leads to a stabilization of the excited state as the polarity of
the solvent increases and absorption/emission spectra show a red-shift (bathochromic shift), termed
positive solvachromism.
Therefore, the disparity and directions of the ground/excited state dipole moments of a dye determine
the type of solvatochromism and also ultimately affect the electronic charge distribution.
In this dissertation different solvents were used to approximate the magnitudes of dipole moments and
to compare the different environments affecting CT states of dye molecules when Li cation additives
were used on dye-sensitized films.

20
2.1.7. Metal complexes
In contrast to organic molecules, electronic transitions in metal complexes are as follows: metal-
centered (MC) transition, ligand-centered (LC) transition, ligand-to-metal charge transfer (LMCT),
and metal-to-ligand charge transfer (MLCT). The MC and LC transition can be observed from the
first-row transition metals of the periodic table and from metal complexes with aromatic ligands,
respectively. The LMCT and MLCT transitions depend on which part is easier to oxidize or reduce.
Octahedral complexes of which Ru(II), i.e. Z907 (cis-Bis(isothiocyanato)(2,2‟-bipyridyl-4,4‟-
dicarboxylato)(4,4‟-di-nonyl-2‟-bipyridyl)ruthenium(II)), is a typical example show MLCT transitions.
In this complex, the metal center plays the role of an electron donating group and the ligand acts as an
electron withdrawing group leading to charge transfer M(II)• +
-L• -
from the metal center to the ligand
(MLCT). This transition can be observed from complexes with low oxidation potentials of the metal
center and a localized low-lying vacant MO in the ligand. The Z907 dye which goes through MLCT
transition is used as a reference dye in this dissertation and its molecular structure is shown in Figure
3-12.
2.2 Transfer processes
In a donor-acceptor system, generation of an excited state in one molecule will be caused by either
(photoexcited) electron transfer or an energy transfer process. In the following sections, the rate
constants and conditions of electron and energy transfer are explained.
2.2.1. Electron transfer: semi-classical Marcus theory
Marcus theory is a semi-classical model in that it uses the Boltzmann distribution of energies to
determine the electron transfer rates of a system in equilibrium, and makes use of Fermi‟s golden rule
to describe the nuclear motion. In Figure 2-6 (a), the potential energy curves of an electron transfer
reaction are represented as harmonic oscillators as a function of the nuclear coordinate. States before
and after electron transfer are denoted as the initial state (i) and the final state (f), respectively.
The electron transfer rate in Marcus‟ theory is influenced by two factors: the Franck-Condon Principle
and the First Law of thermodynamics. There is no change in nuclear configuration during
instantaneous electron transfer according to the Franck-Condon principle. For conservation of total
energy, electron transfer should be an isoenergetic process. In order to fulfil these requirements,
electron transfer takes place at an intersection of two parabolas having the same curvatures, and it is
here where the transfer rate is determined. The rate constant for an electron transfer process in Marcus
theory is given by
21
√
(
) (2. 12)
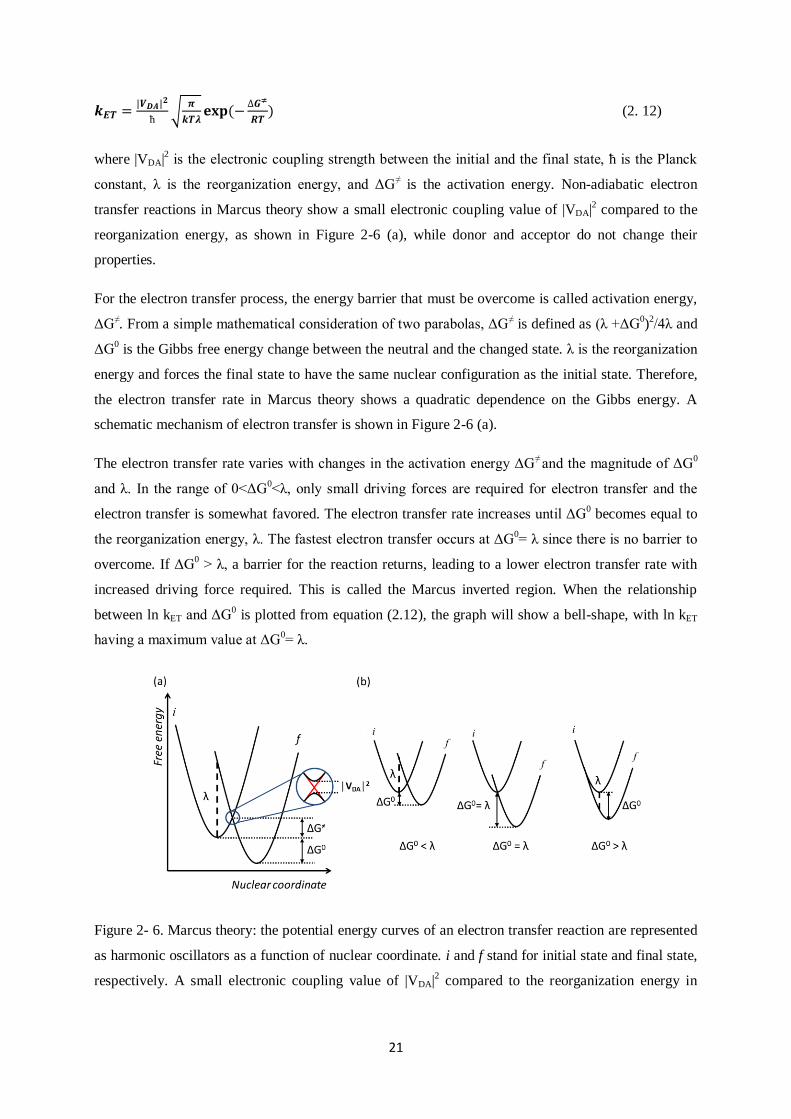
where |VDA|2 is the electronic coupling strength between the initial and the final state, ħ is the Planck
constant, λ is the reorganization energy, and ΔG≠ is the activation energy. Non-adiabatic electron
transfer reactions in Marcus theory show a small electronic coupling value of |VDA|2 compared to the
reorganization energy, as shown in Figure 2-6 (a), while donor and acceptor do not change their
properties.
For the electron transfer process, the energy barrier that must be overcome is called activation energy,
ΔG≠. From a simple mathematical consideration of two parabolas, ΔG
≠ is defined as (λ +ΔG
0)
2/4λ and
ΔG0 is the Gibbs free energy change between the neutral and the changed state. λ is the reorganization
energy and forces the final state to have the same nuclear configuration as the initial state. Therefore,
the electron transfer rate in Marcus theory shows a quadratic dependence on the Gibbs energy. A
schematic mechanism of electron transfer is shown in Figure 2-6 (a).
The electron transfer rate varies with changes in the activation energy ΔG≠ and the magnitude of ΔG
0
and λ. In the range of 0<ΔG0<λ, only small driving forces are required for electron transfer and the
electron transfer is somewhat favored. The electron transfer rate increases until ΔG0 becomes equal to
the reorganization energy, λ. The fastest electron transfer occurs at ΔG0= λ since there is no barrier to
overcome. If ΔG0 > λ, a barrier for the reaction returns, leading to a lower electron transfer rate with
increased driving force required. This is called the Marcus inverted region. When the relationship
between ln kET and ΔG0 is plotted from equation (2.12), the graph will show a bell-shape, with ln kET
having a maximum value at ΔG0= λ.
Figure 2- 6. Marcus theory: the potential energy curves of an electron transfer reaction are represented
as harmonic oscillators as a function of nuclear coordinate. i and f stand for initial state and final state,
respectively. A small electronic coupling value of |VDA|2 compared to the reorganization energy in

22
non-adiabatic electron transfer reactions (a), and different electronic situation depending on the
relation between the energy barrier and activation energy, ΔG≠ (b).
2.2.2. Energy transfer
Fermi‟s golden rule can be also applied to energy transfer processes since they are regarded as a non-
radiative transition between initial and final states.
(
)
(2. 13)
FCET
is the Franck Condon factor described above and |VDA|2 is the electronic coupling between the
donor and acceptor states. This |VDA|2 term can be explained by two different energy transfer
mechanisms: Förster and Dexter energy transfer.
Dexter energy transfer is an electron-exchange mechanism. The electron in the excited state of the
donor molecule is transferred to the excited state of the acceptor molecule, while an electron in the
ground state of the acceptor molecule transfers to the ground state of the donor molecule. This will
only occur at short distances, approximately 5-20 Å, which is shorter than Förster resonance energy
transfer because it needs strong spatial overlap of wavefunctions of the donor and acceptor.
Förster resonance energy transfer (FRET) originates from an electric field or transition dipole (caused
by relaxation processes of the donor molecule) that stimulates formation of the excited state of the
acceptor molecule. Relaxation processes of the acceptor species generate different transition dipoles
that stimulate deactivation processes of the excited donor molecule. This is why FRET is often called
non-radiative dipole–dipole coupling or a Coulombic mechanism. The rate constant for FRET has a
1/r6 distance dependence between the donor and acceptor molecules and the transfer distance is up to
10 nm in this energy transfer process.
Figure 2- 7. Schematic diagram of (a) electron transfer, (b) Dexter and (c) Förster energy transfer [39]
.
23
2.3 Laser spectroscopy
Norrish and Porter, who were awarded the Nobel Prize in Chemistry in 1967, developed flash
photolysis for detecting electronic absorption of excited species that were generated by gas-filled
discharge lamps. This achievement enabled studies of transient species such as excited states and
radical ions. With the introduction of pulsed lasers and selective excitation using monochromatic light,
transient absorption spectroscopy (TAS) allowed detection of the excited state dynamics of different
transient species on a time scale which can vary by more than 10 orders of magnitude.
Most photophysical processes in dye-sensitized solar cells, such as charge generation, relaxation,
recombination, and regeneration processes, generally take place on the femto- to milliseconds
timescale. To identify the processes in femto- to pico- timescales, TAS measurements using ultrafast
pulsed laser systems can be employed. In this chapter, the working principles of TAS and the
generation of ultrashort pulses will be briefly introduced.
2.3.1. Transient absorption spectroscopy (TAS)
The Beer-Lambert law describes how transmittance of light through matter varies with the absorption
coefficient and thickness of the material. According to this law, transmission is given by
, (2. 14)
where I is the intensity of transmitted light after passing through the sample, Io is the intensity of the
incident light, α is a frequency-dependent absorption coefficient, and d is the thickness of the sample.
α is a measure of how strongly a system absorbs photons that consists of the molar concentration and
the molar extinction coefficient.
The absorbance, A, is given by the change in population between initial state, Ni, and final state, Nf,
and the cross-section, σ, when molecules experience electronic transitions.
∑ ( )( ) . (2. 15)
Detection of transient absorption signals is based on changes in concentration of photoinduced species
over time. Transient absorption spectroscopy is a pump-probe technique. The first step of the
experiment is the excitation of the system with a short „pump‟ laser pulse. The system is then allowed
to evolve for a given delay time, where it will undergo relaxation, recombination, or charge transfer.
First, a probe pulse absorption spectrum of the system in the ground state is taken. Then a pump pulse
is used to excite the system, and the system is allowed to evolve for a given delay. Another probe
pulse absorption spectrum is then taken, and the difference between this spectrum and the first

24
provides insights into the transitions of excited states. This is repeated multiple times whilst varying
the delay time between pump and probe.
Changes in the excited state population with respect to time evolution, t, are observed according to:
( ) ∑ ( ) ( ) . (2. 16)
If there is no absorption in the final state f (f=0), then ΔN0(t) reflects the depleted population in the
ground-state leading to increased transmission. Therefore, this yields positive ΔT signals and is called
ground state bleaching (GSB). When transitions to the ground state or to higher-lying excited states
occur (f>0) then stimulated emission (SE) and photoinduced absorption (PIA) can be observed, and
they result in positive and negative ΔT signals, respectively. The SE signals are induced by the probe
pulse when the excited species that have been created by the pump pulse shows an emissive transition.
Hence, SE signals can be generally observed in the photoluminescence wavelength range. PIA is
revealed by a negative ΔT signal due to additional absorption of an excited state generated by the
pump pulse to a higher excited state, ultimately leading to a smaller transmission signal after the pump
pulse compared to the transmission signal before the pump pulse. A schematic diagram of TA spectra
is shown in Figure 2-8.
Figure 2- 8. A schematic diagram of signals obtained from transient absorption spectroscopy.
2.3.2. Generation of femtosecond laser pulses
Creation
In order to study the dynamics of excited species on the sub-nanosecond timescale it is necessary to
generate the fs laser pulses with mode-locking techniques. Generation of mode-locked pulses is
attained via constructive interference of laser beam modes having different frequencies as shown in
Figure 2-9 (a). Mode-locking builds short and intense pulses in a resonant cavity from uncoupled
modes having different frequencies. The cavity sustains the laser action by using two highly reflective

25
mirrors, an output coupler (R1) and a high reflector (R2). The cavity round trip time, T, is determined
by the cavity roundtrip length, 2L, between R1 and R2 (T = 2Ln/c where n is refractive index and c is
speed of light). The laser repetition rate Δf is defined as the inverse of T (Δf=1/T). A wider spectral
bandwidth contains a larger number of longitudinal cavity modes and is able to achieve shorter pulses,
based on the uncertainty principle,
. Schematic diagrams of the generation of mode-locked
pulses and cavity modes are depicted in Figure 2-9.
Figure 2- 9. A schematic diagram of generation of mode-locked pulses having different frequencies (a)
and a laser resonator using gain and loss medium in a cavity mode (b). The panel is adapted from [40]
.
Mode-locking is classified as active or passive. Active mode-locking uses an external signal to
modulate the loss in the laser resonator in synchronization with the round-trip time. It is a very good
method for initiating mode-locking but it needs an extra modulator. For passive mode-locking, a
saturable absorber can control the loss modulation. A widely used technique is Kerr lens mode-locking
(KLM). The Kerr lens (e.g. Ti:Sapphire) is a nonlinear medium and shows nonlinear intensity
dependent properties. This causes a self-focusing of the incident beam, leading to an increase in light
intensity. The aperture behind the Kerr lens allows only focused light to pass through and blocks
unfocused and low intensity light, resulting in a focused, high intensity beam.
A Ti:Sapphire oscillator is often used as a fs laser in ultrafast measurements due to its wide gain
spectrum and high saturation of absorption.

26
Figure 2- 10. Passive mode-locking using a Kerr lens to allow only focused light to pass through. The
panel is adapted from [40]
.
Amplification
Regular oscillators cannot provide peak powers above a few gigawatts per square centimeter and at
this high intensity spectral and temporal pulse distortion and thermal breakdown damage can occur.
Therefore, the peak power needs to be reduced by temporal stretching at the laser pulse before
amplification.
In chirped pulse amplification (CPA), an initial short (fs) pulse generated from a mode-locked Ti:Sa
oscillator has typically a pulse duration of 100 fs, an energy of 1 nJ and an intensity of 1 MW/cm2. A
pair of gratings spreads the beam into its frequency components, and the laser pulse is temporally
stretched by a factor of 103 to 10
5. The stretched pulse therefore shows a longer pulse duration of
approximately 100 ps and a decreased intensity of 1 KW/cm2. Amplification of this low intensity,
stretched pulse is carried out by a power amplifier by a factor of 104 or more, i.e. the intensity of the
amplified pulse is approximately 10 MW/cm2 compared to that of the stretched pulse of 1 kW/cm
2.
The amplified laser pulse is then compressed again to the same pulse width as the original pulse (100
fs) and its pulse energy and intensity finally reach 1 mJ and 10 GW/cm2, respectively. The chirped
pulsed amplification process is schematically shown in Figure 2-11.

27
Figure 2- 11. Process of chirped pulse amplification of a femtosecond laser pulse.
2.3.3. Supercontinuum generation
A broad spectrum of light can be created in a nonlinear medium such as a sapphire plate. As shown in
Figure 2-12, an 800 nm-centered excitation pulse generated from a Ti:Sapphire laser passes through
lens L1, and in a sapphire plate generates a continuum of light ranging from 400 to 1800 nm. This
broadened pulse, used as a probe in a pump-probe experiment, is then collimated by lens L2.
Figure 2- 12. A schematic diagram of supercontinuum white light generation. The panel is adapted
from [41]
.

28
2.4 Dye-sensitized solar cells (DSCs)
2.4.1 Excitons
Inorganic materials have different excited state characteristics compared to organic materials due to
their larger dielectric constant resulting in a different kind of excitons. Excitons are quasi-particles
without charge, namely electron-hole pairs generated by absorption of photons. The type of exciton
affects the photophysics of the systems.
Figure 2- 13. Different exciton radii of Wannier and Frenkel excitons due to the different dielectric
permittivity of the material. The panel is adapted from [42]
.
In inorganic materials, a large dielectric constant (ε ≈ 12) causes effective screening of the Coulombic
interaction between electron and hole, called Wannier excitons [43]
. The generated excitons are only
weakly bound in inorganic materials, having a binding energy of about 0.015 eV, and thus a larger
exciton radius (≤100 Å) than lattice distance. Free charge can be generated from these excitons, as
their binding energy is comparable to kbT.
In organic materials, the excitons are Frenkel type excitons, having a relatively small radius of less
than 10 Å. This is due to the stronger Coulombic interaction, which itself is due to the smaller
dielectric permittivity (ε≈4) of organic materials. Excitons are localized on a molecule due to the
stronger binding energy of 0.3-1 eV, as shown in Figure 2-14. In solids, the Frenkel exciton moves by
a hopping process that is described by an energy transfer mechanism, as depicted above. For a
schematic diagram, see Figure 2-13.
2.4.2 Working principle of DSCs
Dye-sensitized solar cells using metal oxide semiconductors

29
Excitonic solar cells, such as a polymer and dye-sensitized solar cell, are governed by majority charge
carriers, in contrast to conventional inorganic solar cells. When it comes to dye-sensitized solar cells,
metal oxide semiconductors, such as TiO2 and ZnO, act as electron acceptors, and photosensitizers
(dyes) work as electron donors. The Fermi energy level of the semiconducting nanoparticle layer is
initially determined by the type of materials, but is additionally shifted by the trap density, inclusion of
mobile charges (electrons) from sensitizers, and changes in the surface environment of the metal oxide
layer caused by additives. The open circuit voltage in devices is given by the difference between the
Fermi energy level of the metal oxide layer and the HOMO level of the solid-state hole transporter
material (HTM); therefore, VOC in devices varies with the properties of the dye sensitizer and hole
transport material. A schematic diagram to explain the working principle of dye-sensitized solar cells
is given in Figure 2-14.
Process A : Dye + hv→ Dye*
Process B : Dye* → Dye + hv or thermal energy
Process C : Dye* → e- + Dye
+ and TiO2|TiO2 + e
-
Process D : TiO2|e- + Dye
+ → Dye
Process E : Dye+ → Dye + HTM|h
+ (solid-state DSC) or
2Dye+ + 3I
- → 2Dye + I3
‾ / I3
‾ +2e
- → 3 I
- (liquid-electrolyte DSC)
Process F : TiO2|e- + HTM|h
+ → HTM
Upon absorption of a photon (process A), an electronically excited state is created on the dye. The
dye‟s excited state decays in less than a hundred nanoseconds [44]
(process B) in a radiative
deactivation process or it emits thermal energy in a radiationless deactivation process. The dye can
also undergo an oxidation process by injection of electrons into the metal oxide layer (process C),
which transfers an electron from the LUMO level of the dye's excited state to the conduction band of
the mesoporous nanoparticle semiconducting layer. Injected electrons then diffuse by hopping to the
fluorinated tin oxide (FTO) electrode. Process C generally takes place on an ultrafast time scale, a few
tens of fs for Ru dyes [25-29]
and a few picoseconds for organic dyes [45]
, but slower injection originating
from triplet states in Ru dyes [46]
is observed too. The reduction process of a dye's oxidised state is
carried out by a redox mediator or a hole transporting material (process E). For an efficient device, this
regeneration process needs to be much faster than the recombination (process D and F). Regeneration
of solid-state DSCs occurs on a timescale of pico- to a few nano-seconds [47]
, which is several orders
of magnitude faster than in liquid-state devices, where regeneration generally proceeds on a nano- to
milliseconds [41,44,45]
timescale. This fast regeneration process in solid-state DSCs is attributed to direct
hole transfer (via an energy gradient) into the HOMO level of a solid-state hole transporter from the

30
oxidized state of the dye molecule [47]
, whereas the redox reaction in a liquid-state system is diffusion-
limited [48]
. Injected electrons can recombine with either an oxidized dye molecule (process D) or a
hole conductor carrying holes (process F). The former is normally called a back-electron transfer and
this process takes place on a timescale between nano- and milliseconds [49-56]
, while the latter process
is in the range of a few tens of milliseconds for liquid-state DSCs [30, 31]
and of nano- to microseconds
for solid-state DSCs [32-34]
.
Figure 2- 14. Working principle of solid-state dye-sensitized solar cells. A: absorption of a photon, B:
excited state decay, C: injection of electrons, D: recombination between injected electrons and
oxidized dye molecule, E: reduction process of a dyes‟ oxidized state, and F: recombination between
injected electrons and an oxidized hole conductor.
Electrons and holes in solid-state DSCs are finally extracted by a transparent conductive oxide layer
(TCO) anode such as FTO and a counter-electrode such as silver, respectively. In addition, to prevent
another recombination path due to the direct contact between the TCO and the hole conducting
material, a compact titania layer on top of the TCO film is necessary.
2.4.3. Dyes
Studies of photosensitizers such as the dye molecules had significant influence on the development of
DSC performance. A sensitizer should possess an absorption band in the visible range or up to the
near-infrared range due to the high photon flux of the sun in these wavelength regions. Dye molecule
design enables not only to selectively change absorption bands of the dye but also to modify energy
levels, namely the HOMO/LUMO energies.
2.4.3.1. Ruthenium complex dyes
Among the many different dyes, ruthenium (Ru(II)) complexes have attracted a lot of attention due to
their outstanding characteristics, such as wide absorption bands, high external quantum efficiencies,

31
favorable energy levels and relatively long excited state lifetimes. Among several Ru complexes, Ru
complexes with carboxylated bi- or poly-pyridine ligands such as N3 [57]
, N719 [58]
, CYC-B11[59]
, Z907
[60, 61], and Z910
[62] were extensively studied due to their higher conversion efficiencies, ranging from
6 to 11%. Especially, N3, N719, and Z907 are widely used as reference dyes when comparing device
performance. The N3 dye, having two bipyridyl moieties connected to four carboxylate anchoring
groups, exhibited an efficiency of about 10 % owing to a long excited state lifetime and strong
electronic coupling between the LUMO level of the dye and the conduction band of the metal oxide
layer [57]
. The N719 dye, modified from N3 to have a double protonated structure, showed improved
JSC and VOC in devices [63]
due to changes in the metal oxide surface environment. The hydrophobic
dye Z907 showed increased molar extinction coefficients [64, 65]
compared to N3 and N719, and
extended absorption up to 750nm. Devices using Z907 exhibited efficiencies of 7% in liquid state [65]
and 4% in solid state [66]
. In this dissertation, Z907 was used as a reference dye to compare the device
performance of each batch and it generally exhibited efficiencies of 1.5 – 2.3% in solid-state DSCs.
The rather low efficiencies of these cells compared to those of other research groups are probably due
to different fabrication conditions and the materials used such as titania oxide layers and compact
titania layers.
The high efficiencies of these dyes reported in the literature are mainly attributed to slow
recombination of injected electrons with oxidized dye molecules and fast regeneration processes;
however, the devices still suffer from rather low photocurrents. To solve this problem, studies adding
coadsorbents [65]
, increasing ligand length by extension of the conjugated system [62, 67, 68]
,
cosensitization [23]
, and the use of a near-IR absorbing dye, known as black dye [69-72]
, were reported.
Some reports demonstrated higher power conversion efficiency by an increase of light absorption, but
overall efficiencies did not change significantly and still remained at around 7-10%.
2.4.3.2. Organic dyes
Ruthenium complex dye molecules are rare and expensive; therefore, despite their high efficiencies,
all organic alternatives were developed. Organic dyes have advantages such as high molecular
extinction coefficients, cost effectiveness, environmental cleanliness, relatively easy synthesis and the
possibility of molecular design of their chemical and physical properties. Generally, organic dye
molecules employ the Donor−π−Acceptor structure, so called 'push-pull' dyes. One can design a
variety of dye molecules, selectively change the absorption spectrum, and modify energy levels by
using this structure. Many dyes having different donor moieties such as coumarin [73]
, indoline [74-76]
,
carbazole [77-79]
, triarylamine [80-83]
and perylene [84, 85]
, one of the rylene family dyes, have been used in
this D-π-A arrangement. On illumination, the dye molecule absorbs the photons and the electron-rich
donor moiety transfers electron density through the π-conjugated segments to the acceptor.
Rylene related dyes

32
Rylene dyes show high molecular extinction coefficients, excellent thermal and photo-stability, and
strong absorption in the visible range. Devices using perylene dyes exhibit efficiencies of 3 – 6 % in
liquid-state [84, 86-89]
, and 2% in solid-state [84]
, largely owing to the long excited state lifetimes [90-92]
.
For core-enlarged rylene molecules, T. Edvinsson et al. measured energy levels of the TMIMA dye
experimentally and computationally. They found that delocalized orbitals in the HOMO and LUMO
levels showed no changes in their charge transfer properties, regardless of the conformation of the ring
opened anchoring group [93]
. Y. Geerts et al. reported that quaterrylene diimide (QDI) showed a low
quantum yield compared to perylene and terrylene diimide (PDI and TDI) due to increased
radiationless deactivation caused by vibrational torsion [92]
. To further enhance the electron injection of
these molecules, studies of alteration of energy levels [89]
, changes in the donating or conjugated π-
moiety [88, 94-96]
, prevention of dye aggregation [87]
, and UV radiation exposure to cause band shifts of
the conduction band [85]
were reported; however, the PCE of the devices are generally rather low, since
the rylene sensitizer has poor electron donating properties [97]
. In Chapter 4, the rylene dyes are
presented, which exhibited a rather low efficiency of 0.3 % due to unfavorable electron injection
properties, however, the novel perylene dye reported in Chapter 5 showed an efficiency of 4.5% in
solid-state DSC owing to high photocurrents.
Cyclopentadithiophene (CPDT) related dyes
Triarylamine moieties known as electron rich units were used in both metal complex dyes and organic
dyes. They were used in bipyridyl ligands in Ru(II) complex sensitizers to spatially retard
recombination between injected electrons and holes in a regeneration medium and as a result, they
ultimately increased efficiencies in both liquid- and solid-states DSCs [98-100]
.
In D-π-A type organic dyes, devices using triarylamine moieties as a donor and cyclopentadithiophene
(CPDT) moieties as a bridging unit have shown good efficiencies, up to 10 %, when they are used
with cobalt (II/III) as a redox electrolyte [101, 102]
and efficiencies of 3 % [103]
in solid-state DSCs were
reached. Wang et al., compared the kinetics of dye cation recombination and regeneration using
transient absorption spectroscopy in several D-π(CPDT)-A(Triarylamine) dye molecules. They used a
gamma function to derive the meantime for the excited state kinetics [94, 104]
, whereas other groups used
a monoexponential function [102]
or simply take the time at 50% of the signal decay [105]
. This gamma
function uses an exponent, β, and a lifetime, τ, obtained from a stretched exponential decay function to
determine the excited state lifetime components in various time dependent distribution functions.
In this dissertation, a stretched exponential decay function is generally used, especially for samples
using metal oxide layers, but the lifetime determined using a gamma function is also introduced in
Chapter 6 to compare the mean lifetime of four different dyes consisting of triarylamine-based donor
building blocks and cyclopentadithiophene (CPDT) moieties as a π-conjugated spacer.
33
2.4.4. Crucial factors affecting injection of electron
In this section, different type of dye molecules will be reviewed to understand several factors affecting
injection of electrons, such as electronic coupling via anchoring group, dipole moment, and surface
environment.
Anchoring group
More than one anchoring group on the sensitizer is necessary not only to adsorb to the surface of a
semiconducting oxide layer, but also to be a channel for electron injection from the dye molecule. In
addition, the anchoring group determines the electronic coupling properties and it has been found to be
an important factor in device performance, since the LUMO level of the dye is generally governed by
the acceptor and an anchoring moiety that substantially affects electron injection into the conduction
band.
Carboxylic acid anchor groups are most widely used because of their stability, easy synthesis, and
strong electronic coupling leading to efficient electron injection rates [54, 106, 107]
. As derivatives of
carboxylic acids, acid chlorides, esters, carboxylate salts, and maleic acid anhydrides have also been
used and their binding modes also affect the efficiency of devices [106]
.
Anhydrides can be used to form carboxylic acid anchoring groups [88, 108]
but when maleic anhydride
groups undergo ring opening, the absorption and emission is blue-shifted. V lker et al. studied the
slower adsorption rates of anhydride groups relative to other acid groups [109]
due to the ring opening
process and Johansson et al. reported that dyes with anhydride groups adsorb only to specific sites on
the metal oxide film [108]
. Therefore, depending on the kind of anchoring group, changes in adsorption
rate and intramolecular interaction can take place.
An indoline donor dye molecule has shown a very good efficiency of 9.5% in liquid-state DSCs [75]
due to its high open circuit voltage caused by chenodeoxycholic acid when it owns rhodanine-3-acetic
acid as the acceptor and anchoring moiety. However, another report showed rather low photocurrents
due to a localized electron density in the LUMO of the rhodanine unit, leading to unfavorable electron
injection [110]
. In Chapter 6, one of the CPDT building block dyes consisting of a rhodanine-3-acetic
acid anchoring group will be discussed in comparison to a carboxylate acid anchoring group that has a
different electron density.
Dipole moment and interfacial environment
The dipole moment of the dye can influence the device performance due to changes in dipole moment
between ground state and excited state. Generally, dyes showing big changes in dipole moment
between two states have excellent injection properties owing to the fairly localized electron density in
the HOMO and LUMO levels. Different magnitude of the dye‟s dipole moment can lead to different
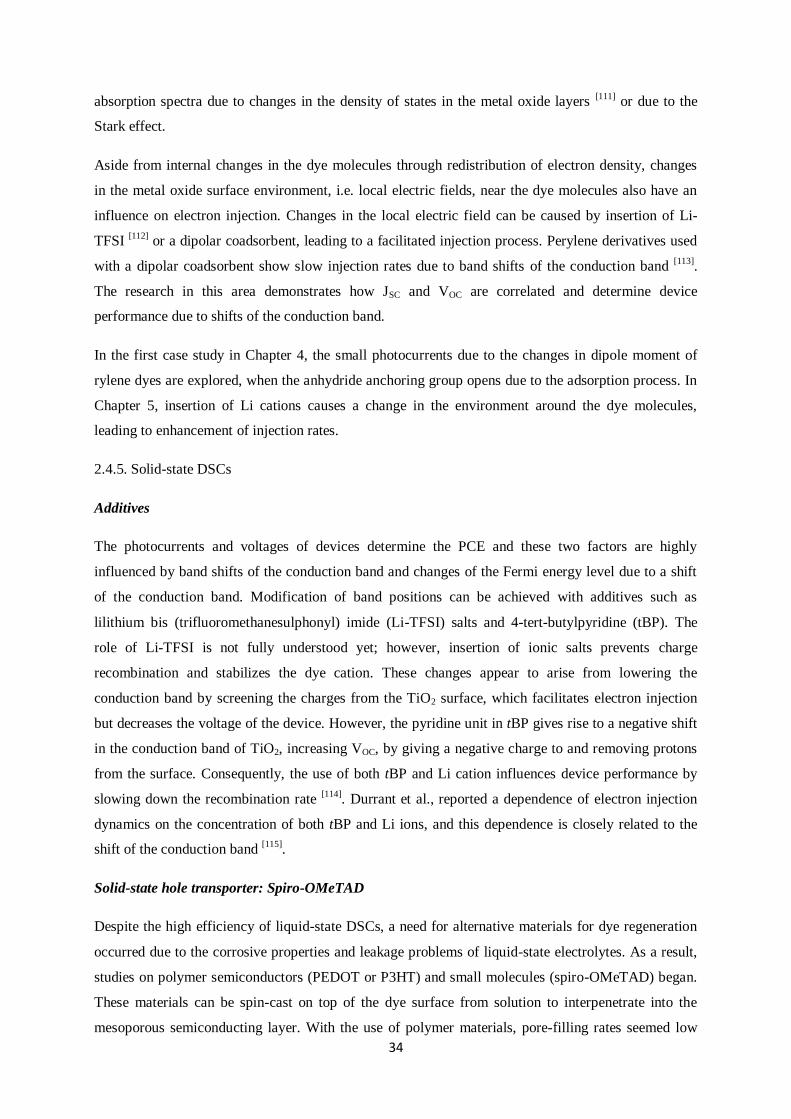
34
absorption spectra due to changes in the density of states in the metal oxide layers [111]
or due to the
Stark effect.
Aside from internal changes in the dye molecules through redistribution of electron density, changes
in the metal oxide surface environment, i.e. local electric fields, near the dye molecules also have an
influence on electron injection. Changes in the local electric field can be caused by insertion of Li-
TFSI [112]
or a dipolar coadsorbent, leading to a facilitated injection process. Perylene derivatives used
with a dipolar coadsorbent show slow injection rates due to band shifts of the conduction band [113]
.
The research in this area demonstrates how JSC and VOC are correlated and determine device
performance due to shifts of the conduction band.
In the first case study in Chapter 4, the small photocurrents due to the changes in dipole moment of
rylene dyes are explored, when the anhydride anchoring group opens due to the adsorption process. In
Chapter 5, insertion of Li cations causes a change in the environment around the dye molecules,
leading to enhancement of injection rates.
2.4.5. Solid-state DSCs
Additives
The photocurrents and voltages of devices determine the PCE and these two factors are highly
influenced by band shifts of the conduction band and changes of the Fermi energy level due to a shift
of the conduction band. Modification of band positions can be achieved with additives such as
lilithium bis (trifluoromethanesulphonyl) imide (Li-TFSI) salts and 4-tert-butylpyridine (tBP). The
role of Li-TFSI is not fully understood yet; however, insertion of ionic salts prevents charge
recombination and stabilizes the dye cation. These changes appear to arise from lowering the
conduction band by screening the charges from the TiO2 surface, which facilitates electron injection
but decreases the voltage of the device. However, the pyridine unit in tBP gives rise to a negative shift
in the conduction band of TiO2, increasing VOC, by giving a negative charge to and removing protons
from the surface. Consequently, the use of both tBP and Li cation influences device performance by
slowing down the recombination rate [114]
. Durrant et al., reported a dependence of electron injection
dynamics on the concentration of both tBP and Li ions, and this dependence is closely related to the
shift of the conduction band [115]
.
Solid-state hole transporter: Spiro-OMeTAD
Despite the high efficiency of liquid-state DSCs, a need for alternative materials for dye regeneration
occurred due to the corrosive properties and leakage problems of liquid-state electrolytes. As a result,
studies on polymer semiconductors (PEDOT or P3HT) and small molecules (spiro-OMeTAD) began.
These materials can be spin-cast on top of the dye surface from solution to interpenetrate into the
mesoporous semiconducting layer. With the use of polymer materials, pore-filling rates seemed low

35
due to the long polymer chains, leading to poor efficiency, despite their advantages such as additional
absorption and moderate charge mobilities. With the use of spiro-OMeTAD, devices exhibited
increasing efficiencies, up to 7 % [24]
, owing to fast hole-mobility [116]
, better infiltration, and geometric
structure of the hole transporter [117]
. This solid hole conductor accepts holes from the oxidized dye and
transports the holes to the counter electrodes, demonstrating that fast hole mobility is an important key
to solid-state DSCs. The HOMO level of hole conductors needs to be less negative than the HOMO
level of the dye to allow dye regeneration. The dye regeneration process takes place in sub-
nanoseconds, several orders of magnitude faster than the redox process in liquid-state DSCs [47]
. J.
Bisquert et al., reported that the energy gap between the HOMO level of spiro-OMeTAD and that of
the dye needs only to be 0.2 V at minimum for the dye regeneration [118]
. However, charge screening in
the solid-state DSCs is not as effective as that in liquid-state DSCs because the population of the holes
in the hole transporter layer is dense, causing fast recombination between injected electrons and holes
residing in the transporter. This process is in the range of few tens of milliseconds for the liquid state
[30, 31] and nano- to microseconds for the solid state devices
[32-34].
Despite the advantages of easy manufacturing and excellent stability in solid-state DSCs even in air,
devices still suffer from incomplete pore filling [119]
, leading to short diffusion lengths of holes and
therefore, lower efficiencies. Pore filling seems to be optimized at a titania thickness of 2 μm [120]
.
However, it causes lower IPCE in solid-state devices due to less light scattering and insufficient light
trapping, whereas liquid-state DSCs often achieve an IPCE of 100 % owing to 10 μm thick titania
layer.
Reductive quenching in solid-state DSCs
Aside from low photocurrents, there is one more distinguishing characteristic, only observed in solid-
state devices. This is another charge creation channel called reductive quenching or preceding hole
transfer. Normally, charges are injected from an excited state after photon absorption by the dye,
whereas reductive quenching contributes to charge generation by formation of a dye anion prior to
electron injection [121]
. This reductive quenching process is considered less efficient than the ordinary
generation channel [45]
. In Chapter 5, the possibility of reductive quenching will be discussed based on
transient absorption data and a multivariate curve resolution analysis is used to probe its existence.

36
2.5 Multivariate curve resolution (MCR)
Multivariate curve resolution (MCR) developed by a group in the Universitat de Barcelona [122]
is a
soft-modelling method for extracting undetermined species or chemical constituents qualitatively from
the experimental measurements showing species-associated profiles such as spectra and dynamics.
To begin with, one starts with an initial guess for the concentration profile based on a data matrix from
TAS measurements. This initial guess is generated by using evolving factor analysis (EFA) under a
supposition of how many species will be needed. Resolved spectra and concentration profiles are
obtained from a data optimization process using spectral and concentration constraints, such as non-
negativity of concentrations.
Initially UV-vis absorption spectra were employed in this modelling, but now transient absorption
spectroscopy has also been used to identify transient species [123]
. However, the data set used in
previous MCR analyses is all from measurements in solution and there has been no prior study
reporting MCR analysis on solid-state dye-sensitized solar cells to the best of our knowledge. In
Chapter 5, we used MCR analysis on a novel perylene monoimide dye to discover whether or not there
is a reductive quenching process. Detailed information will be given in Chapter 5.6.

37
3. EXPERIMENTAL TECHNIQUES
3.1 Sample preparation
3.1.1. Device fabrication
24×24×3.1 mm fluorinated tin oxide (FTO) coated glass substrates (Pilkington, TEC-15) were used to
fabricate solar cells. 11.2 mm-wide polyimide tape containing silicone adhesive (Kapton™) was used
to define the active layer in the middle of the substrate. Zinc powder and 4M hydrochloric acid (1:2
vl%, 37% HCl:H2O) solution were used to etch away the fluorine doped tin oxide (FTO) layer left
uncovered by the tape. The tape was detached from the substrate after etching. The substrates were
rinsed with distilled water and then treated in an ultrasonic bath with detergent (Hellmanex III,
Hellma), ethanol or 2-propanol, then acetone, in that order, for 15 minutes each. In order to remove all
organic contaminants, argon plasma cleaning was carried out under 0.2 mbar argon at 300 W for 15
minutes.
An insulating compact oxide layer was deposited by spray pyrolysis to prevent direct contact of
electrons in the metal oxide layer with holes in a hole conductor. The solution for the compact layer
consisted of a titania precursor of diisopropoxytitanium bis(acetylacetonate) (Sigma-Aldrich, CAS
17927-72-9) and ethanol in a ratio of 1:10 vl%. During spray pyrolysis, a hot plate was required to
keep the temperature at 450 ˚C, and each spray was pumped out using an atomizer (Glaskeller Art Nr.
12.159.603) every 10 seconds to give enough time to the samples to sinter the nanoparticles and to
recover the set temperature. The total thickness of this compact layer was about 80-100 nm. After the
samples were cooled down to room temperature, a 2 µm-thick mesoporous TiO2 layer was applied
using the doctor blade coating method with titania paste (Dyesol, DSL-18NR-T). The paste was
diluted with ethanol at a ratio of 1:1.3 wt%. 40 µL of the diluted paste was spread out on top of the
titania compact layer and doctor blade coating was carried out. For uniform thickness, the substrates
were temporarily stored in a petri dish for 60 seconds to evaporate the solvents and then placed on a
hot plate set to 70 ˚C. The sintering stage of the metal oxide nanoparticles is shown in Figure 3-1.
For better light collection and scattering the substrates were heated in a titanium (IV) chloride (Sigma-
Aldrich ReagentPlus®, 99.9%, trace metals basis, CAS 7550-45-0, 208566) solution at 70˚C for 1
hour after doctor blade coating. This solution consisted of a 1 mL hydrochloride solution, 200 g TiCl4,
and 350 mL distilled water. This solution was diluted further with additional distilled water at a ratio
of 1:10 vl%. About 7 – 8 samples were dipped in this solution and were placed on a hot plate set to 70
˚C for one hour. After the TiCl4 treatment the substrates were rinsed with distilled water and then
sintered at 500 ˚C for 45 minutes. The samples were finally dipped in the dye solution for the
sensitization. For dye staining in different dye solutions, see section 1.4.

38
Figure 3-1. Time-temperature profile of the sintering process for two layers. A mesoporous titania
layer after doctor blade coating in red, and an insulating metal oxide layer in blue.
To regenerate oxidized dyes spiro-OMeTAD (2,2‟7,7‟-tetrakis-(N,N-di-p-methoxyphenyl-amine)-9,9‟-
spirobifluorene, Merck, SHT-263 Livilux) was employed in this dissertation. 121.9 mM spiro-
OMeTAD solution in chlorobenzene was prepared and heated up to 60-80 ˚C to dissolve all material.
97 mM tBP (4-tert-butylpyridine, Aldrich, 3978-81-2) and 18.2 mM Li-TFSI solution (lithium bis
(trifluoromethanesulphonyl) imide salt, Aldrich, 900-76-65-6) were added into the dissolved spiro-
OMeTAD solution. The molecular structures of these three chemicals are shown in Figure 3-2. A Li
cation additive solution was prepared in advance at a concentration of 0.59 mM in acetonitrile and
stored under nitrogen. Approximately 65 µL of spiro-OMeTAD solution was used to spin coat each
sample. The spin-coating procedure was as follows: wait for the evaporation of solvents for pore
filling for 1 min and then spin-cast at a speed of 1000 rpm for 5 seconds followed by a speed of 1500
rpm for 30 seconds.
Figure 3-2. Molecular structure of spiro-OMeTAD (a), Li additive ion salt (b), and tert-butylpyridine
(tBP) (c).

39
Figure 3-3. Schematic structure of a solid-state dye-sensitized solar cell: FTO as an anode, compact
titania layer, mesoporous metal oxide layer as an electron acceptor, sensitized dye as a photon
harvesting system, hole conductor for dye regeneration, and silver as a cathode.
For the formation of counter electrodes, thermal evaporation deposition was carried out (Edwards
FL400, AUTO 306 CRYO). A tungsten boat was used to melt the silver and a shadow mask with the
exact dimensions of the active area of the cell was used for evaporation. The silver electrode showed
good confinement of the light and good electronic contact with a hole conductor material [120]
. The
deposition rate was controlled at a rate below 2.5 Å/s: 1 Å/s for the first 100 nm thickness and 2Å/s for
the next 100 nm, for a total thickness of 200 nm. The FTO area for electron extraction was covered by
the titania layer from the pyrolysis deposition and by the hole conductor, thus, to make a better contact,
those layers needed to be scratched. After scratching, silver paste was used on top of the anode and
cathode points. A simplified structure diagram of the solid-state dye-sensitized solar cells is given in
Figure 3-3.
3.1.2. Samples for spectroscopy
For time-resolved photoluminescence spectroscopy, photoinduced absorption spectroscopy, and
transient absorption spectroscopy measurements, both titania and alumina film substrates were used in
order to measure the excited state dynamics of the dyes.
For the alumina (Al2O3) samples, 300 mg terpineol, 1250 µL ethanol, and 50 mg ethyl cellulose
solution [124]
were added to 500 µL of an alumina dispersion (Sigma Aldrich, 702129, CAS 1344-28-1).
The ethyl cellulose solution was prepared with both 0.75 mg ethyl cellulose (Sigma-Aldrich, 9004-57-
3) of viscosity 46 cP and 0.75 mg ethyl cellulose of viscosity 10 cP in 15 mL ethanol. The alumina
solution was coated using the doctor blade coating method on quartz substrates and the samples were
sintered using the same sintering procedure as for sintering the mesoporous titania layer. The samples

40
using titania nanoparticles were prepared using the same procedure as the general device preparation
described above, except for the etching and evaporation process.
The samples were prepared under 3 different conditions on both titania and alumina layers to be able
to distinguish the absorption spectra of a variety of excited species: the dye alone, the dye with a Li
cation additive, and the complete device structure (dye plus spiro-OMeTAD, Li cation, and tBP).
3.2. Steady-state measurements
3.2.1. J-V characteristics
The power conversion efficiency of the solar cell devices was measured using a solar simulator (LOT-
Oriel, LSE 340/850.27B) with an incident illumination power density of 100 mW/cm2. The solar
simulator uses a xenon arc lamp calibrated by a silicon photodiode and it has a photon spectrum
similar to air mass (AM) 1.5 global solar conditions at room temperature and in the air. The AM 1.5G
solar spectrum shown in Figure 3-4 is used as a standard reference spectrum to compare the
performance of the devices since the spectrum of incident light depends on factors such as latitude and
cloud coverage. In our system, one solar cell device consists of 6 pixels with an active area of 0.1403
cm2 each and the performance of the devices discussed in this dissertation is obtained by taking the
average value of all 6 cells.
500 1000 1500 2000 2500 3000 3500 4000
0.0
0.2
0.4
0.6
0.8
1.0
1.2
1.4
1.6
1.8
Sp
ectr
al
Irra
dia
nce
W m
-2 n
m-1
Wavelength /nm
AM 1.5 G
Figure 3-4. Spectral irradiance at air mass (AM) 1.5 global solar conditions.

41
A Keithley 2400 digital source meter was used to apply the voltages and to measure the currents under
light. The parameters for the Keithly were set using a Labview software programme (National
Instruments). Figure 3-5 shows how the currents from the devices were obtained when the applied
voltage changes. Reverse bias set the voltage at the counter electrode (Ag) higher than that at the
electrode (FTO) as shown in Figure 3-5 (a), therefore, only slight leakage current will flow due to an
injection barrier. When the applied bias is 0 the work function of the two electrodes becomes the same
and here only the forward drift current is observed, as in Figure 3-4 (b). This is the short circuit current
density (JSC when Vapp=0) when the surface area of the cell is taken into account. There is no current
flow when the applied voltage and built-in potential (voltage) of the device are the same and this is
defined as the open circuit voltage (VOC). The J-V curve will be a square (like the blue box line)
between these two points (VOC and JSC) if there is no recombination of electrons and holes. If the built-
in potential becomes smaller than the applied voltage, forward bias is observed and it changes are
injected from the electrodes.
The performance of the device was assessed using the short circuit current density (JSC), the open
circuit voltage(VOC), the fill factor (FF), and incident light irradiance Pinc, according to:
.
As shown in Figure 3-5, JSC and VOC measurements were obtained by sweeping the devices with an
externally applied voltage. The FF is calculated according to the following formula:
( )
( )
where IMPP is the current at maximum power point, and VMPP is the voltage where the maximum power
point is reached.
Figure 3-5. Schematic diagram showing how the band positions shift according to the applied voltage.

42
3.2.2. External quantum efficiency
External quantum efficiency (EQE) is the number of electrons that contribute to the current divided by
the number of incident photons. The EQE measurement was carried out with a home-built instrument
and the EQE values were calculated by the equation
.
Therefore, the ratio of a sample cell‟s currents ( ) and the reference photodiode‟s current (
)
multiplied by the number of incident photons for each wavelength (EQEref) leads to the sample cell‟s
EQE. With the EQE values, the short circuit current (JSC) of the sample can be obtained from the
integral of the EQE values and the number of incident photons across the wavelength range measured:
∫ ( )
Where q is the elementary charge, ħ is Plank's constant, Pin is the light intensity at a certain wavelength,
and λ is the wavelength measured. However, the EQE does not take into account how many photons
are absorbed. This is taken into account by the internal quantum efficiency (IQE). IQE is defined as
the ratio of the number of electrons that contribute to the current over the number of absorbed photons
and can be expressed as follows:
( ) ( )
( )
3.2.3. UV-Vis absorption measurements
Absorption measurements were carried out using a Perkin Elmer Lambda 25 UV-Vis absorption
spectrometer and absorbance is measured based on changes in transmission (see the section 2.3.1.)
with and without an inserted sample.
Most samples with a titania or an alumina coating were dipped in 0.3 mM dye solution overnight. For
dye solution measurements, the concentration was kept at 0.1 mM to exclude aggregation,
intermolecular reactions and reabsorption of light.
To measure the absorption of cationic species, 5 mM anhydrous iron(III) chloride solution was mixed
with the dye solution, acting as a Lewis acid. For example, one of the cyclopentadithiophene dyes,
coded FPH303, investigated here and shown in Figure 3-6 (a), shows an additional dye cation
absorbance peak at 760 nm after the addition of FeCl3.
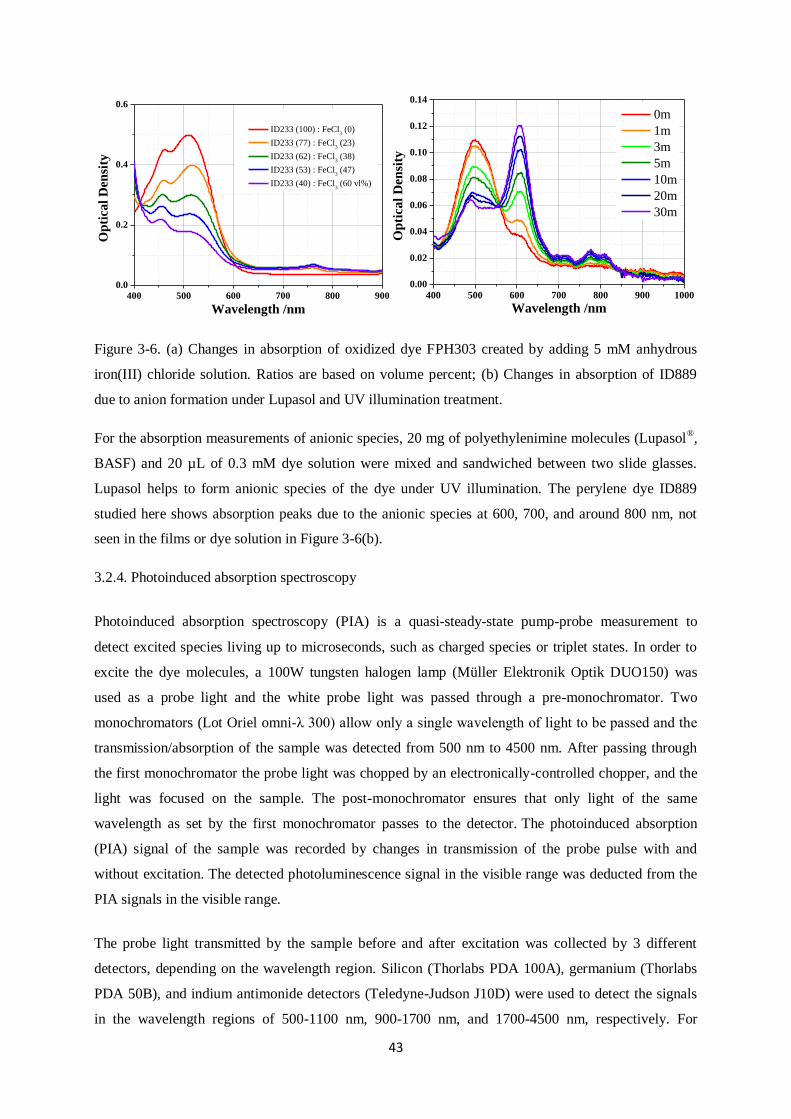
43
400 500 600 700 800 900
0.0
0.2
0.4
0.6O
pti
cal
Den
sity
Wavelength /nm
ID233 (100) : FeCl3 (0)
ID233 (77) : FeCl3 (23)
ID233 (62) : FeCl3 (38)
ID233 (53) : FeCl3 (47)
ID233 (40) : FeCl3 (60 vl%)
400 500 600 700 800 900 1000
0.00
0.02
0.04
0.06
0.08
0.10
0.12
0.14
Op
tica
l D
ensi
ty
Wavelength /nm
0m
1m
3m
5m
10m
20m
30m
Figure 3-6. (a) Changes in absorption of oxidized dye FPH303 created by adding 5 mM anhydrous
iron(III) chloride solution. Ratios are based on volume percent; (b) Changes in absorption of ID889
due to anion formation under Lupasol and UV illumination treatment.
For the absorption measurements of anionic species, 20 mg of polyethylenimine molecules (Lupasol®,
BASF) and 20 µL of 0.3 mM dye solution were mixed and sandwiched between two slide glasses.
Lupasol helps to form anionic species of the dye under UV illumination. The perylene dye ID889
studied here shows absorption peaks due to the anionic species at 600, 700, and around 800 nm, not
seen in the films or dye solution in Figure 3-6(b).
3.2.4. Photoinduced absorption spectroscopy
Photoinduced absorption spectroscopy (PIA) is a quasi-steady-state pump-probe measurement to
detect excited species living up to microseconds, such as charged species or triplet states. In order to
excite the dye molecules, a 100W tungsten halogen lamp (Müller Elektronik Optik DUO150) was
used as a probe light and the white probe light was passed through a pre-monochromator. Two
monochromators (Lot Oriel omni-λ 300) allow only a single wavelength of light to be passed and the
transmission/absorption of the sample was detected from 500 nm to 4500 nm. After passing through
the first monochromator the probe light was chopped by an electronically-controlled chopper, and the
light was focused on the sample. The post-monochromator ensures that only light of the same
wavelength as set by the first monochromator passes to the detector. The photoinduced absorption
(PIA) signal of the sample was recorded by changes in transmission of the probe pulse with and
without excitation. The detected photoluminescence signal in the visible range was deducted from the
PIA signals in the visible range.
The probe light transmitted by the sample before and after excitation was collected by 3 different
detectors, depending on the wavelength region. Silicon (Thorlabs PDA 100A), germanium (Thorlabs
PDA 50B), and indium antimonide detectors (Teledyne-Judson J10D) were used to detect the signals
in the wavelength regions of 500-1100 nm, 900-1700 nm, and 1700-4500 nm, respectively. For
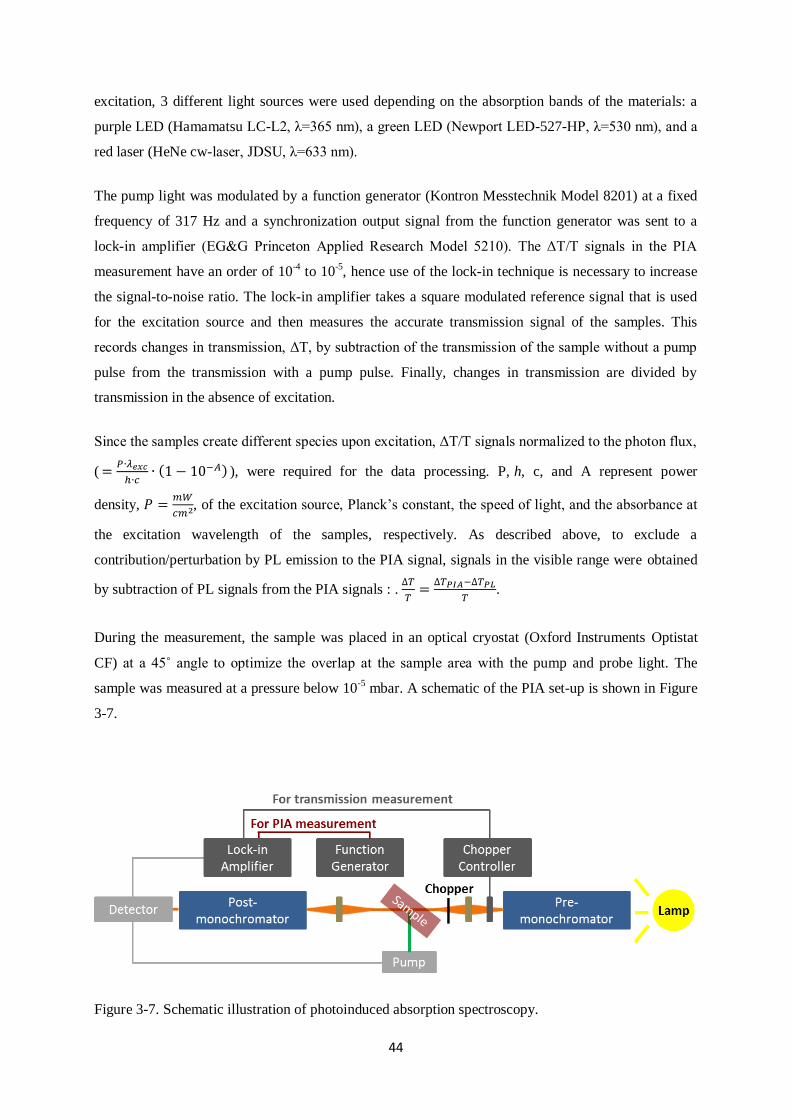
44
excitation, 3 different light sources were used depending on the absorption bands of the materials: a
purple LED (Hamamatsu LC-L2, λ=365 nm), a green LED (Newport LED-527-HP, λ=530 nm), and a
red laser (HeNe cw-laser, JDSU, λ=633 nm).
The pump light was modulated by a function generator (Kontron Messtechnik Model 8201) at a fixed
frequency of 317 Hz and a synchronization output signal from the function generator was sent to a
lock-in amplifier (EG&G Princeton Applied Research Model 5210). The ΔT/T signals in the PIA
measurement have an order of 10-4
to 10-5, hence use of the lock-in technique is necessary to increase
the signal-to-noise ratio. The lock-in amplifier takes a square modulated reference signal that is used
for the excitation source and then measures the accurate transmission signal of the samples. This
records changes in transmission, ΔT, by subtraction of the transmission of the sample without a pump
pulse from the transmission with a pump pulse. Finally, changes in transmission are divided by
transmission in the absence of excitation.
Since the samples create different species upon excitation, ΔT/T signals normalized to the photon flux,
(
( ) ), were required for the data processing. P, h, c, and A represent power
density,
, of the excitation source, Planck‟s constant, the speed of light, and the absorbance at
the excitation wavelength of the samples, respectively. As described above, to exclude a
contribution/perturbation by PL emission to the PIA signal, signals in the visible range were obtained
by subtraction of PL signals from the PIA signals : .
.
During the measurement, the sample was placed in an optical cryostat (Oxford Instruments Optistat
CF) at a 45˚ angle to optimize the overlap at the sample area with the pump and probe light. The
sample was measured at a pressure below 10-5
mbar. A schematic of the PIA set-up is shown in Figure
3-7.
Figure 3-7. Schematic illustration of photoinduced absorption spectroscopy.

45
3.3. Time-resolved measurements
3.3.1. Photoluminescence spectroscopy
Time-resolved photoluminescence (PL) spectroscopy using a streak camera system probes the
emission of excited states and the time-dependent radiative decay. Two modes for PL spectroscopy
were used depending on the excited species lifetime range: fast sweep (a couple of picoseconds to 2
nanoseconds) and slow sweep (hundreds of picoseconds to milliseconds).
For fast sweep measurements, the output from a Ti:Sapphire ultrafast laser system (Coherent Mira
900-Dual fs-ps-Oscillator) was used to excite the light absorbing system. The 800 nm centered pulsed
excitation has a repetition rate of 80 MHz with a pulse width of 200 fs. This excitation goes through a
BBO crystal to double the frequency and generates output at 370-430 nm (3.35-2.88 eV). For longer
excited state lifetimes, a supercontinuum fiber laser (Fianium, SC450-2, 450 nm < λ < 2200 nm) was
used. It has a repetition rate of 20 MHz and generates 200 mW of power.
The photons emitted from the samples were spectrally resolved by a spectrograph, and sequentially
converted into electrons at a photocathode. The released electrons were accelerated in a time-
dependent electric field in the y axis (Hamamatsu Streak Camera system), and swept by the applied
voltage time-synchronized with the incident pulsed excitation. Electrons multiplied by the
microchannel plate were converted back into photons on a phosphorescent screen at a different time
and space position. A two dimensional CCD camera was used to record the number of photons and to
obtain an image of the PL with both spectral (x-axis) and temporal (y-axis) distributions.
A schematic diagram of the streak camera is shown in Figure 3-8. All films were measured at a
pressure of 10-5
mbar.
Figure 3-8. Operating principle of a streak camera system.

46
3.3.2. Transient absorption spectroscopy
Analyzing the dynamics of excited state populations, such as exciton/charge generation and
recombination, gives insights into device performance constraints. Transient absorption spectroscopy
(TAS) is a useful method for observing excited state population changes over time. TAS is also known
as pump-probe spectroscopy. It uses a monochromatic pulsed excitation as a pump and a broad
supercontinuum white-light as a probe.
The Ti-Sapphire laser system (Coherent Libra-HE) generates laser pulses (800 nm centered, length of
100 fs) with a repetition rate of 1 kHz. The amplified laser output is split and sent into two optical
parametrical amplifiers, OPA, (Coherent OPerA Solo Topas System) by beam splitters. Topas 1
converts the laser pulse to a pump pulse ranging from 285 nm to 2600 nm. The excitation wavelength
can be obtained by different nonlinear process such as the sum frequency of signal (470-535 nm), of
idler (533-613 nm), second harmonic of signal (565-810 nm) or of idler (793-1130 nm). The pump
pulse is delayed by simply changing the laser propagation path with a translation stage (Newport, 600
mm travel range), allowing monitoring the time evolution of excited species on a femto- to
nanoseconds time scale. To obtain ΔT/T, the repetition rate of the pump pulse is reduced to 500 Hz
from 1 kHz by a rotating disk (chopper) to block every second excitation pulse corresponding to pump
on or pump off.
Topas 2 creates a seed wavelength that is focused to generate a white light supercontinuum probe
beam (450-2000 nm) in sapphire, yttrium-aluminium-garnet (YAG) or yttrium vanadate (YVO4). This
probe beam is superimposed on the pump beam on the sample, but the probe beam spot size has to be
smaller than the pump beam to maintain overlap. The probe beam is then detected by a CCD
spectrograph. Two configurations are available for long time delay (up to 1ms with a time resolution
of 600 ps) and for short time delay (up to 4 ns with a time resolution of 100 fs). In the long time delay
configuration, a Q-switched Nd:YVO4 laser (AOT Ltd. MOPA) is used as an excitation source
operated at 532 nm and triggered by an external trigger. The delay between the pump and probe beam
is controlled by an electronic delay generator (Stanford Research Systems DG535) rather than a delay
stage.
Figure 3-9. Schematic of the transient absorption spectroscopy setup. This panel is adapted from [125]
.
47
To maintain a homogeneous excitation density, the size of the pump spot was set to be larger than that
of the probe spot, as described above. After finding the overlap of the pump and probe pulse, a
polarizer was placed along the pump pulse to rotate the polarization to magic angle, 54.7˚, with respect
to the polarization of the probe light, to null effects from light polarization of the pump and probe
pulse.
ΔT signals were detected by a grating spectrometer (Princeton Instruments Acton SP2150) with a
photodiode array detector (silicon photodiode NMOS array with 256 and 512 pixels, a Hamamatsu
NMOS linear image sensor S3901-25/512 for the visible range and an InGaAs array detector with 512
pixels, Entwicklungsbuero Stresing, for the NIR/IR range). All signals shown in this dissertation were
averaged for better signal-to-noise ratio by one thousand shots of the pump on/off pulses and kinetics
were extracted at chosen wavelengths from the averaged data.
TA measurements were carried out at room temperature in high vacuum at 10-5
mbar.
3.4. Materials
In this dissertation, 3 different push-pull type dye groups were investigated. The first group consisted
of rylene family dyes, from perylene to quaterylene derivatives. In the second case study, the sensitizer
was a perylene derivative as π-conjugated system with fused dibenzothiophene as a bridge and
triphenylamine as donor. The third case study concerned a set of CPDT building units as π-conjugated
systems and varying donor structures.
Sensitization times varied depending on the different dye adsorption rates. Concentration of dye
solutions were kept at 0.3 mM for all dyes. For solution measurements, concentration was kept at 0.1
mM to prevent reabsorption of light and aggregation of dye molecules.
3.4.1. Naphthalene core-enlarged rylene family dyes (PMIMA, TMIMA, and QMIMA)
The materials studied in Chapter 4 belong to the family of rylene dyes. Three different dyes were
investigated, namely a perylene, terylene and quaterylene derivative (perylene mono-imid mono-
anhydride PMIMA, TMIMA, and QMIMA). All dyes are substituted at the bay-position of the rylene
core to improve the solubility and prevent aggregation and bear an imide and an anhydride group at
the terminal positions. The latter group functions as anchor group during the adsorption of the dye
molecules on the metal nanoparticle surface, as it undergoes hydrolyses in situ to the di-carboxylic-
acid, which in turn can attach to the metal oxide nanoparticle surface. Since the ryleneanhydride dyes
exhibit a change in molecular structure on adsorption to a semiconducting film, the dyes are treated
with potassium hydroxide (KOH) aqueous solution to study the ring opening. Figure 3-10 shows the
chemical structures of the investigated rylene dye molecules.

48
Figure 3-10. Chemical structures of PMIMA (n=0), TMIMA (n=1), and QMIMA (n=2) with
anhydride group (left) and as potassium salts of the dicarboxylic acids (right).
The samples were immersed in 0.3 mM toluene dye solution at 70 °C for 15 hours.
3.4.2. Perylene derivative dye (ID889)
The perylene derivative dye ID889 has the chemical structure of a donor-pi-acceptor type, consisting
of perylene monoimide as a π-conjugated system, with fused dibenzothiophene as bridge and
triphenylamine as donor. ID889 is very stable in air and shows a high molecular extinction coefficient
of 28,000 M-1
cm-1 at 512 nm in dichloromethane.
Dye-sensitization was carried out at 25˚C for 3-5 hours in toluene. The molecular structure of ID889 is
shown in Figure 3-11.
Figure 3-11. Chemical structure of the perylene dye ID889.

49
3.4.3. Cyclopentadithiophene building block dye (FPH224, 231, 233, and 303)
The materials studied in Chapter 6 are push-pull dyes using a cyclopentadithiophene (CPDT) building
block as a conjugated bridging unit. FPH224, 231, and 233 dyes have several novel donor blocks and
FH303 has a different acceptor moiety, compared to FPH224, but with the same bridge and donor
moiety.
FPH224, 231, and 233 comprise of the CPDT bridging moiety with 2-butyl-groups and a cyanoacrylic
acid as an anchoring group. FPH231 has a dendrimer-like electron donating group made of
triphenylamine units. FPH303 has shown red-shifted absorption when compared to FPH224 because
of its rhodanine-3-acetic acid group. The samples were left in 0.3 mM THF at 25˚C overnight. The
molecular structures are shown in Figure 3-12.
Figure 3-12. Molecular structures of the series of CPDT building block dyes, FH224 (a), FH231 (b),
FH233 (c), and FH303 (d).
3.4.4. Z907
One of the ruthenium complexes, Z907, is a standard dye for dye-sensitized solar cells and Z907 was
used here as a reference. A 0.3 mM dye solution was prepared in tert-butanol and acetonitrile with a
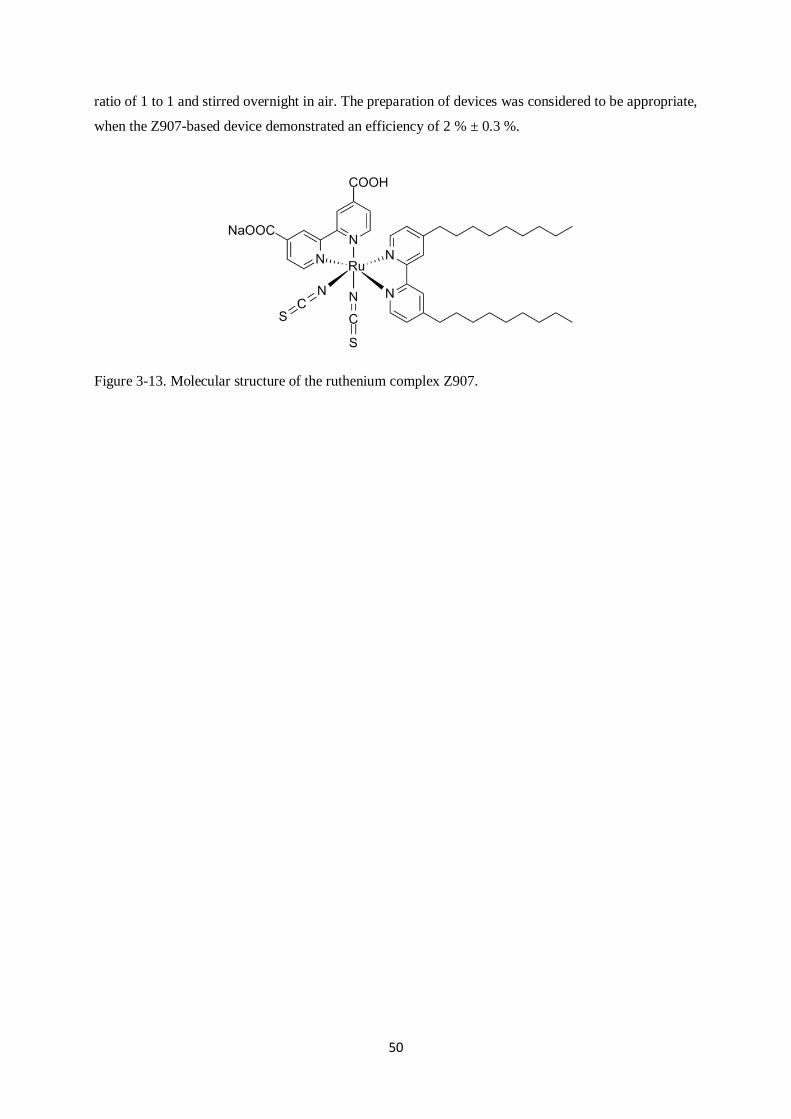
50
ratio of 1 to 1 and stirred overnight in air. The preparation of devices was considered to be appropriate,
when the Z907-based device demonstrated an efficiency of 2 % ± 0.3 %.
Figure 3-13. Molecular structure of the ruthenium complex Z907.
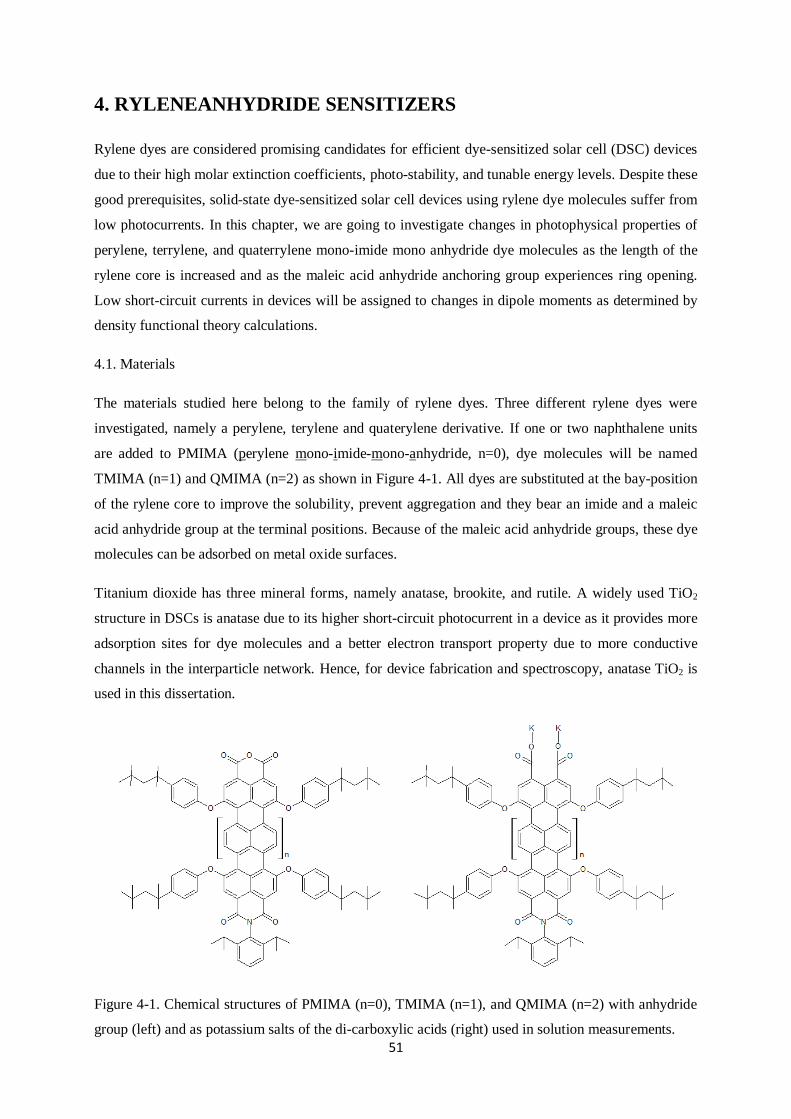
51
4. RYLENEANHYDRIDE SENSITIZERS
Rylene dyes are considered promising candidates for efficient dye-sensitized solar cell (DSC) devices
due to their high molar extinction coefficients, photo-stability, and tunable energy levels. Despite these
good prerequisites, solid-state dye-sensitized solar cell devices using rylene dye molecules suffer from
low photocurrents. In this chapter, we are going to investigate changes in photophysical properties of
perylene, terrylene, and quaterrylene mono-imide mono anhydride dye molecules as the length of the
rylene core is increased and as the maleic acid anhydride anchoring group experiences ring opening.
Low short-circuit currents in devices will be assigned to changes in dipole moments as determined by
density functional theory calculations.
4.1. Materials
The materials studied here belong to the family of rylene dyes. Three different rylene dyes were
investigated, namely a perylene, terylene and quaterylene derivative. If one or two naphthalene units
are added to PMIMA (perylene mono-imide-mono-anhydride, n=0), dye molecules will be named
TMIMA (n=1) and QMIMA (n=2) as shown in Figure 4-1. All dyes are substituted at the bay-position
of the rylene core to improve the solubility, prevent aggregation and they bear an imide and a maleic
acid anhydride group at the terminal positions. Because of the maleic acid anhydride groups, these dye
molecules can be adsorbed on metal oxide surfaces.
Titanium dioxide has three mineral forms, namely anatase, brookite, and rutile. A widely used TiO2
structure in DSCs is anatase due to its higher short-circuit photocurrent in a device as it provides more
adsorption sites for dye molecules and a better electron transport property due to more conductive
channels in the interparticle network. Hence, for device fabrication and spectroscopy, anatase TiO2 is
used in this dissertation.
Figure 4-1. Chemical structures of PMIMA (n=0), TMIMA (n=1), and QMIMA (n=2) with anhydride
group (left) and as potassium salts of the di-carboxylic acids (right) used in solution measurements.

52
The binding of a maleic acid anchoring group to a titanium dioxide surface has been investigated by
many research groups. Do et al. confirmed that maleic acid anhydride undergoes ring-opening during
adsorption on Al2O3 and TiO2 by IR spectroscopy [126]
and Wilson et al. found that maleic acid
anhydride binds with one oxygen to one Ti atom of the rutile (001) surface by formation of a
monodentate bridging configuration [127]
. Other research groups studied bidentate bridging modes on
titania: sodium formate tends to form dissociated bridging bidentate geometry on hydrated anatase
(101) TiO2 surfaces, which was calculated by DFT [128]
. In addition, the dissociative adsorption of
acetic anhydride took place on a (110) TiO2 surface and two acetate ions are bound with a bidentate
coordination with the 5-fold coordinated Ti sites [129]
. Johansson et al. reported that maleic acid
anhydride undergoes ring opening by adsorption at the (100) and (101) anatase surfaces due to a
dissociative binding mode forming bidentate fashion, but adsorption at (001) surface shows different
geometry by carboxylates involving one oxygen atom from a titania surface [108]
.
Therefore, maleic acid anhydride undergoes ring opening either through bidentated bridging as
suggested by Ashima and Johansson or through monodentate coordination due to –CO+ and –COO
¯
that are rather strongly bound to rylene core [130]
. Figure 4-2 shows two binding configurations of
maleic acid anhydride upon adsorption at a TiO2 surface.
Since the ryleneanhydride dyes are undergoing a change in molecular structure upon adsorption on a
semiconducting metal oxide film, the dyes are treated with potassium hydroxide (KOH) in aqueous
solution to study the ring-opened anhydride moiety as shown in the right panel of Figure 4-1.
Figure 4-2. Potential binding configurations of maleic acids on TiO surface: (a) bidentate bridging and
(b) monodentate mode. Atoms in blue originate from titanium dioxide surface and atoms in black
come from maleic acid anhydride.

53
The energy levels of the dye molecules are expected to change by increasing the rylene core lengths.
Figure 4-3 shows the HOMO/LUMO levels of the dye molecules that are obtained from density
functional theory (DFT) calculation. The HOMO and LUMO levels of PMIMA are changed from
-5.50 eV and -3.20 eV to -5.28 eV and -3.35 eV in TMIMA, and to -5.01 eV and -3.41 eV in QMIMA,
respectively. Significant changes in both the HOMO and LUMO levels are due to delocalized charge
densities across acceptor and donor moieties. These energy levels appear to be favorable enough to
inject electrons into the conduction band of the TiO2 layer and to regenerate the dye cation. The
HOMO and LUMO levels of the anhydride-rylene dyes (solid lines) shown in Figure 4-3 are obtained
from density functional theory (DFT) calculations.
The samples for device fabrication and for optical spectroscopy were prepared as described in the
experimental section, Chapter 3.1. For solution measurements, a 0.1 mM dye solution was prepared
with solvents of different polarity. The sensitization of metal oxide films was carried out at 25 – 30 ˚C
for 15 hours in toluene.
Figure 4-3. The HOMO and LUMO energy levels of anhydride-PMIMA (black solid), TMIMA (red
solid), and QMIMA (blue solid) and of di-carboxylic acids of the dye molecules (dotted) calculated by
density functional theory calculation

54
4.2. Dyes in solution
In this section, changes in absorption/emission spectra and in excited state lifetimes of the dyes in
solution are investigated. These observations give insight into the dynamics of excited states that play
an important role for electron injection. For detection of spectra and excited state lifetimes of dye
solutions, time-resolved photoluminescence (PL) measurements are carried out and the detailed
experimental setup is introduced in Chapter 3.3.1.
4.2.1. Absorption and emission spectra of dye solutions
In Figure 4-4, normalized absorption/emission spectra of each anhydride dye molecule in a 0.1 mM
solution in toluene (TLN) (a) are presented along with the absorption spectra of the potassium salts of
the di-carboxylic acids created by hydrolysis of the anhydride moieties (b).
In panel (a), the absorption/emission spectra of the P-, T-, Q-MIMA rylene dye solutions are
represented as solid/dotted black, red, and blue lines, respectively. Each dye solution shows distinct
vibronic progressions in the absorption spectra, peaking at 579 nm for the PMIMA, 673 nm for the
TMIMA and at 782 nm for the QMIMA. As expected, the absorption of the dye molecules clearly red-
shifts when going from a perylene to a terylene and a quarterylene core due to increased conjugation
[92, 131].
0.0
0.5
1.0
700643589548
782611
(b)
(a) 579 705673
0.0
0.5
1.0N
orm
. P
ho
tolu
min
esc
en
ce
500 600 700 800
0.0
0.5
1.0
PMIMA
TMIMA
QMIMA
Wavelength /nm
Norm
. A
bso
rb
an
ce
0.0
0.5
1.0
Figure 4-4. Normalized absorption/emission spectra of 0.1 mM PMIMA (black), TMIMA (red), and
QMIMA (blue) dyes in toluene solution as anhydrides (a) and after ring opening (b).

55
Table 4-1. Molar extinction coefficients of anhydride and di-carboxylic acid dye solutions.
Formation of
anhydride moiety
Molar extinction Coeff.
M-1cm
-1
PMIMA Open 12432 at 579 nm
Closed 51274 at 579 nm
TMIMA Open 34659 at 673 nm
Closed 87801 at 673 nm
QMIMA Open -
Closed 117279 at 785 nm
The emission spectra of these rylene dyes show to same extent mirror-image symmetry of the
absorption spectra with the vibronic features, peaking at 611 and 705 nm for PMIMA and TMIMA,
respectively. From the onset of absorption in solution, the LUMO levels of the PMIMA and TMIMA
can be calculated, resulting in -3.4 and -3.48 eV, respectively. These levels are lower than the LUMO
levels obtained from DFT calculation. This is because hydrogen atoms are used to open the rings in
DFT calculation since potassium shows very strong electron pulling properties in the molecule which
can cause significant changes in the HOMO (-4.46 – -4.63 eV) and LUMO (-2.07 – -2.65 eV) energy
levels.
In comparison to the anhydrides, the di-carboxylic acids of the dye molecules shown in panel (b)
exhibit a clear hypsochromic shift peaking from 579 nm to 548 nm for the PMIMA and from 673 nm
to 643 nm for the TMIMA due to ring opening. They show larger Stokes shifts than the anhydride
dyes shown in panel (a), due to considerable energy losses through structural relaxation. Increased
non-radiative decay is confirmed by highly reduced photoluminescence quantum efficiency (PLQE) in
di-carboxylic acid dyes. Unfortunately, we could not measure the emission spectra of the QMIMA,
since the emission spectrum lies outside the detection limit of our experimental setup. The energy
levels of di-carboxylic acids of the dye molecules are shown as dotted lines in Figure 4-3.
The absorption coefficient, i.e. the molar extinction coefficient, increases with increasing length of the
ryleneanhydride dye molecules as a consequence of the extended π-system as shown in Table 4-1. The
molecular extinction coefficients of the P-, T-, QMIMA are three, five, and ten times higher than that
of the Ru (II) complex dye Z907, showing only 13000 M-1cm
-1. The higher absorption of these rylene
dyes is expected to yield higher photocurrents in devices. Upon ring opening of the maleic acid
anhydride, the molar extinction coefficients are, however, significantly reduced which is in line with
the lower absorbance of the di-carboxylic acid dye solutions. Table 4-1 summarizes the molar
extinction coefficients of anhydrides and di-carboxylic acid dye solutions.

56
4.2.2. PL decay transients of dye solutions
Given the results shown above from the absorption/emission spectra and molar extinction coefficients,
we assumed that there will be a change in the excited state upon opening of the anhydride rings.
Figure 4-5 shows the nanosecond fluorescence decay transients of the anhydrides and potassium salts
of the dicarboxylic acids of the PMIMA and the TMIMA in solution. The decay transients of the
anhydrides PMIMA and TMIMA solution can be reasonably well fit with single exponentials,
exhibiting lifetimes of 8.3 ns for the anhydride PMIMA (black) and 3.5 ns for the anhydride TMIMA
(red). The decays of the PMIMA and TMIMA potassium salts follow single exponentials with a
lifetime of 6.9 ns (gray) and 1.2 ns (orange), respectively. The reduced fluorescence lifetimes of the
open ring dyes reflect enhanced non-radiative processes (confirmed by the decreased
photoluminescence quantum efficiency (PLQE)) compared to the parent molecules.
The fluorescence lifetimes of the solutions are still long enough to ensure efficient injection when the
dyes are attached on titania, as the injection is expected to occur on a femto- to picosecond timescale.
However, the fluorescence lifetime in films needs to be studied, since the direction of adsorption,
interaction between dye molecules, and aggregation can influence the lifetime of the excited states.
Unfortunately, the fluorescence lifetime of the QMIMA could not be determined for the same reason
as mentioned above.
For all dye solutions, the solid lines correspond to fits where amplitude and offsets are set to 1 and 0,
respectively.
0 5 10 15
0.01
0.1
1
1.2 ns 3.5 ns
6.9 ns
No
rm
. P
ho
tolu
min
esc
en
ce
Time /ns
8.3 ns
Figure 4-5. Normalized fluorescence decay of PMIMA (black) and TMIMA (red) in toluene solution.
Di-carboxylic acid PMIMA and TMIMA dye solutions are represented as gray and orange,

57
respectively. The decays (solid lines) of anhydride and di-carboxylic dye solutions follow a single
exponential.
4.3. Dipole moment of dyes in solution
Measurements in different polarity solvents give insight into changes in the dipole moment between
excited and ground state of the dye and allow us to analogize to the change of the surrounding of the
dye molecules in films, i.e. after addition of Li cations. Figure 4-6 (a) shows the steady-state
absorption and time-resolved PL spectra of 0.1 mM anhydride PMIMA solutions in toluene (TLN) and
dichlorobenzene (DCB). TLN and DCB were chosen due to their difference in polarity: 0.099 for TLN
and 0.188 for DCB when the relative polarity of water is set to 1.
When dye molecules are dissolved in solvents, the dipoles of dye and solvents interact with each other:
the dipoles of the solvent molecule orient around the excited state of dye molecules. The internal
relaxation of energetically high vibrational states generated upon excitation of the dye molecules
occurs on a fs timescale. Therefore, the Stokes shift in a non-polar solvent is determined by the energy
difference of the vibrational states involved in absorption and emission. In a more polar solvent, a
larger Stokes shift is observed due to the larger orientation polarizability of the solvent that consists of
both solvent reorientation and electronic redistribution of the solvent molecules. Electronic transitions
are much faster than the solvent orientation around dye molecules, which leads to spectral shifts in a
more polar solvent. Therefore, the dye showing a larger Stokes shift in more polar solvents is expected
to have a larger dipole moment in the excited state than in the ground state.
0.0
0.5
1.0
0.0
0.5
1.0
400 500 600 700 800 900
0.0
0.5
1.0
0.0
0.5
1.0
Norm
. Ph
oto
lum
inesc
en
ce
(b) 726 751673 687
627 641
Norm
. A
bso
rb
an
ce
578 588(a)
Wavelength /nm
Figure 4-6. Normalized absorption and emission spectra of 0.1 mM solutions of anhydride (a) PMIMA
and (b) TMIMA in toluene (TLN) and dichlorobenzene (DCB). Black and red lines represent
anhydride PMIMA and TMIMA in TLN and gray and orange lines show anhydride PMIMA and
TMIMA in DCB, respectively.
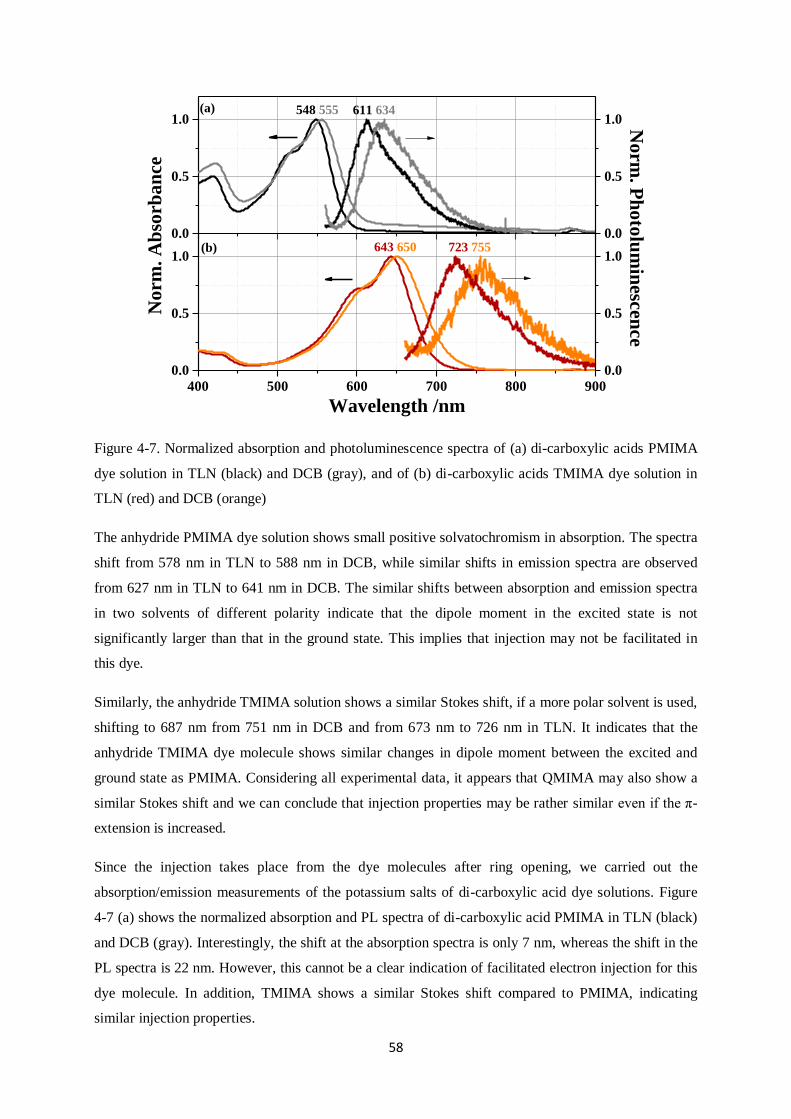
58
0.0
0.5
1.0
0.0
0.5
1.0
400 500 600 700 800 900
0.0
0.5
1.0
0.0
0.5
1.0
(b) 723 755643 650
611 634548 555(a)
Norm
. Ph
oto
lum
inesc
en
ce
Norm
. A
bso
rb
an
ce
Wavelength /nm
Figure 4-7. Normalized absorption and photoluminescence spectra of (a) di-carboxylic acids PMIMA
dye solution in TLN (black) and DCB (gray), and of (b) di-carboxylic acids TMIMA dye solution in
TLN (red) and DCB (orange)
The anhydride PMIMA dye solution shows small positive solvatochromism in absorption. The spectra
shift from 578 nm in TLN to 588 nm in DCB, while similar shifts in emission spectra are observed
from 627 nm in TLN to 641 nm in DCB. The similar shifts between absorption and emission spectra
in two solvents of different polarity indicate that the dipole moment in the excited state is not
significantly larger than that in the ground state. This implies that injection may not be facilitated in
this dye.
Similarly, the anhydride TMIMA solution shows a similar Stokes shift, if a more polar solvent is used,
shifting to 687 nm from 751 nm in DCB and from 673 nm to 726 nm in TLN. It indicates that the
anhydride TMIMA dye molecule shows similar changes in dipole moment between the excited and
ground state as PMIMA. Considering all experimental data, it appears that QMIMA may also show a
similar Stokes shift and we can conclude that injection properties may be rather similar even if the π-
extension is increased.
Since the injection takes place from the dye molecules after ring opening, we carried out the
absorption/emission measurements of the potassium salts of di-carboxylic acid dye solutions. Figure
4-7 (a) shows the normalized absorption and PL spectra of di-carboxylic acid PMIMA in TLN (black)
and DCB (gray). Interestingly, the shift at the absorption spectra is only 7 nm, whereas the shift in the
PL spectra is 22 nm. However, this cannot be a clear indication of facilitated electron injection for this
dye molecule. In addition, TMIMA shows a similar Stokes shift compared to PMIMA, indicating
similar injection properties.

59
0 5 10 15
0.1
1
0.6 ns
1.2 ns
4.9 nsN
orm
. P
ho
tolu
min
escen
ce
Time /ns
6.9 ns
Figure 4-8. Normalized photoluminescence decays of 0.1 mM di-carboxylic acid PMIMA in TLN
(black) and DCB (gray), and of 0.1 mM di-carboxylic acid TMIMA in TLN (red) and DCB (orange).
The solid lines correspond to mono-exponential fits.
Figure 4-8 shows the decay of the excited states of two dye solutions using solvents of different
polarity. The PL lifetime of the di-carboxylic acids dye solutions is further decreased compared to
those of the anhydride: from 8.3 ns to 6.9 ns in PMIMA TLN, from 8.1 ns to 4.9 ns in PMIMA DCB,
from 3.5 ns to 1.2 ns in TMIMA TLN, and from 1.4 ns to 0.6 ns in TMIMA DCB. This is likely due to
different excited states of the open forms.
Furthermore, the ring opening of the anhydride moiety seems to cause enhanced non-radiative decay
or a different interaction of dipole moments with the solvent shell. All lifetimes shown in Figure 4-8
are obtained from mono-exponential fits with an amplitude of 1 and an offset of 0.
4.4. Dye-sensitized metal oxide nanoparticle films
Upon ring opening of the maleic acid anhydride by hydrolyses a decreased molar extinction
coefficient, enhanced non-radiative decay, blue-shifted absorption/emission and shortened excited
state lifetimes were observed along with changes of the dipole moments. In this section, changes in
absorption/emission spectra and lifetimes after addition of Li cations will be investigated in dye
molecules adsorbed onto metal oxide nanoparticle layers.
Titania, a metal oxide semiconductor with a bandgap of about 3.2 eV [132]
, is widely used as an
electron acceptor in dye-sensitized solar cells. The dye molecules adsorb on the titania surface by an
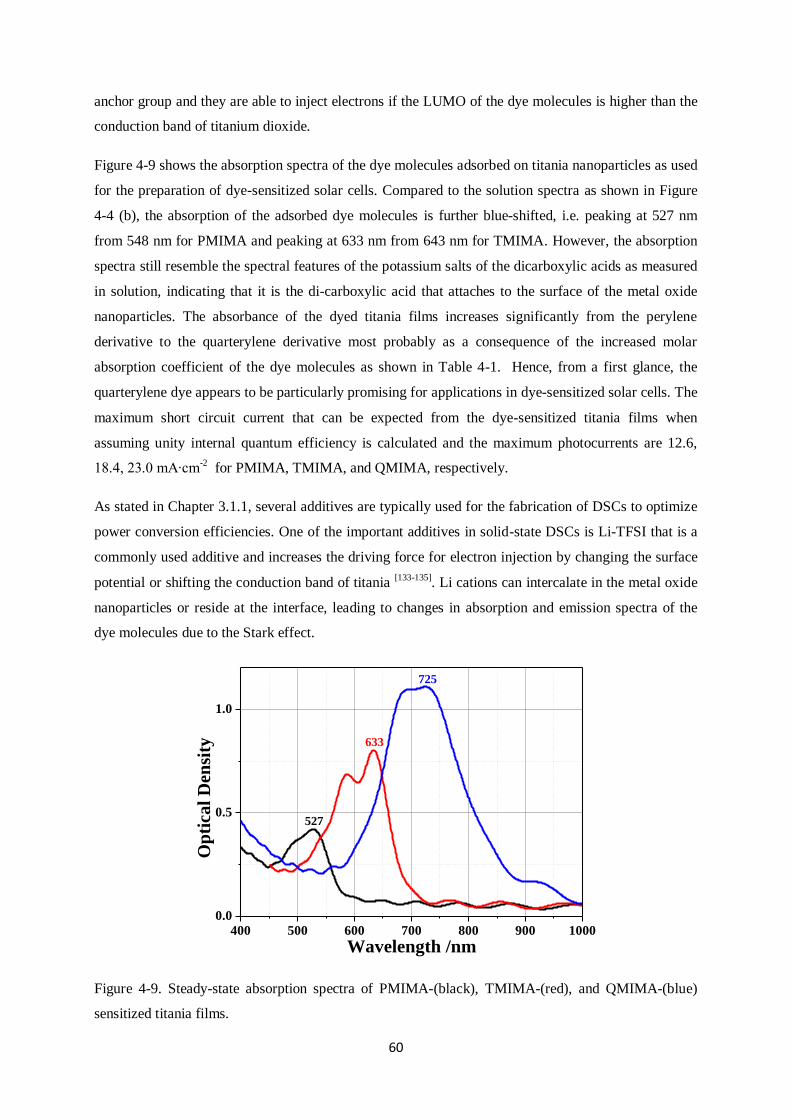
60
anchor group and they are able to inject electrons if the LUMO of the dye molecules is higher than the
conduction band of titanium dioxide.
Figure 4-9 shows the absorption spectra of the dye molecules adsorbed on titania nanoparticles as used
for the preparation of dye-sensitized solar cells. Compared to the solution spectra as shown in Figure
4-4 (b), the absorption of the adsorbed dye molecules is further blue-shifted, i.e. peaking at 527 nm
from 548 nm for PMIMA and peaking at 633 nm from 643 nm for TMIMA. However, the absorption
spectra still resemble the spectral features of the potassium salts of the dicarboxylic acids as measured
in solution, indicating that it is the di-carboxylic acid that attaches to the surface of the metal oxide
nanoparticles. The absorbance of the dyed titania films increases significantly from the perylene
derivative to the quarterylene derivative most probably as a consequence of the increased molar
absorption coefficient of the dye molecules as shown in Table 4-1. Hence, from a first glance, the
quarterylene dye appears to be particularly promising for applications in dye-sensitized solar cells. The
maximum short circuit current that can be expected from the dye-sensitized titania films when
assuming unity internal quantum efficiency is calculated and the maximum photocurrents are 12.6,
18.4, 23.0 mA∙cm-2
for PMIMA, TMIMA, and QMIMA, respectively.
As stated in Chapter 3.1.1, several additives are typically used for the fabrication of DSCs to optimize
power conversion efficiencies. One of the important additives in solid-state DSCs is Li-TFSI that is a
commonly used additive and increases the driving force for electron injection by changing the surface
potential or shifting the conduction band of titania [133-135]
. Li cations can intercalate in the metal oxide
nanoparticles or reside at the interface, leading to changes in absorption and emission spectra of the
dye molecules due to the Stark effect.
400 500 600 700 800 900 1000
0.0
0.5
1.0
725
633
Op
tica
l D
ensi
ty
Wavelength /nm
527
Figure 4-9. Steady-state absorption spectra of PMIMA-(black), TMIMA-(red), and QMIMA-(blue)
sensitized titania films.
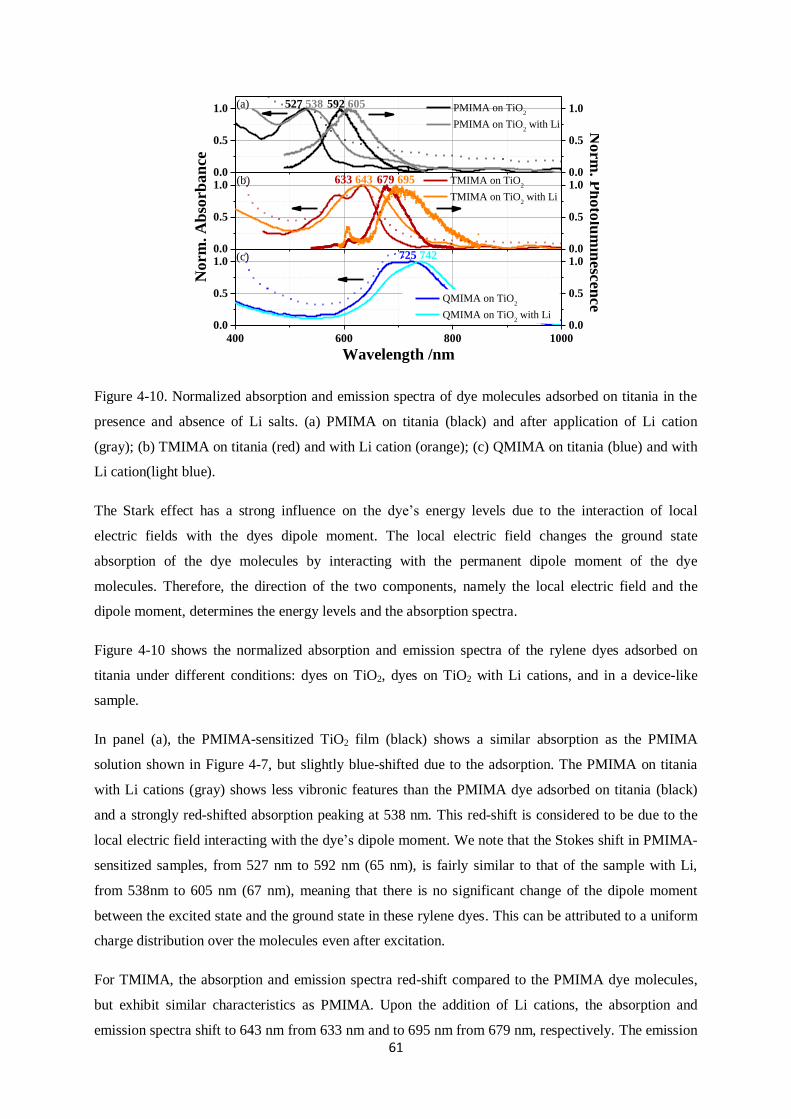
61
0.0
0.5
1.0
0.0
0.5
1.0
0.0
0.5
1.0
0.0
0.5
1.0
400 600 800 1000
0.0
0.5
1.0
0.0
0.5
1.0
725 742
592 605
(c)
(b)
PMIMA on TiO2
PMIMA on TiO2 with Li
(a) 527 538
633 643 679 695
Norm
. Ph
oto
lum
inesc
en
ce
Norm
. A
bso
rb
an
ce
TMIMA on TiO2
TMIMA on TiO2 with Li
Wavelength /nm
QMIMA on TiO2
QMIMA on TiO2 with Li
Figure 4-10. Normalized absorption and emission spectra of dye molecules adsorbed on titania in the
presence and absence of Li salts. (a) PMIMA on titania (black) and after application of Li cation
(gray); (b) TMIMA on titania (red) and with Li cation (orange); (c) QMIMA on titania (blue) and with
Li cation(light blue).
The Stark effect has a strong influence on the dye‟s energy levels due to the interaction of local
electric fields with the dyes dipole moment. The local electric field changes the ground state
absorption of the dye molecules by interacting with the permanent dipole moment of the dye
molecules. Therefore, the direction of the two components, namely the local electric field and the
dipole moment, determines the energy levels and the absorption spectra.
Figure 4-10 shows the normalized absorption and emission spectra of the rylene dyes adsorbed on
titania under different conditions: dyes on TiO2, dyes on TiO2 with Li cations, and in a device-like
sample.
In panel (a), the PMIMA-sensitized TiO2 film (black) shows a similar absorption as the PMIMA
solution shown in Figure 4-7, but slightly blue-shifted due to the adsorption. The PMIMA on titania
with Li cations (gray) shows less vibronic features than the PMIMA dye adsorbed on titania (black)
and a strongly red-shifted absorption peaking at 538 nm. This red-shift is considered to be due to the
local electric field interacting with the dye‟s dipole moment. We note that the Stokes shift in PMIMA-
sensitized samples, from 527 nm to 592 nm (65 nm), is fairly similar to that of the sample with Li,
from 538nm to 605 nm (67 nm), meaning that there is no significant change of the dipole moment
between the excited state and the ground state in these rylene dyes. This can be attributed to a uniform
charge distribution over the molecules even after excitation.
For TMIMA, the absorption and emission spectra red-shift compared to the PMIMA dye molecules,
but exhibit similar characteristics as PMIMA. Upon the addition of Li cations, the absorption and
emission spectra shift to 643 nm from 633 nm and to 695 nm from 679 nm, respectively. The emission

62
spectrum of the QMIMA is expected to show a similar trend as PMIMA and TMIMA, although it
could not be measured.
Figure 4-11 shows the fluorescence decay transients of PMIMA and TMIMA adsorbed on titania in
the presence and absence of Li cations. The fluorescence decays of these samples are observed on the
picosecond timescale, which is significantly faster than the nanosecond timescale in solution. The
lifetimes of PMIMA (black) and TMIMA (red) adsorbed on TiO2 are determined to be 149 ps and 80
ps, respectively, by using stretched-exponential fits with an amplitude of 1. This multi-exponential
fluorescence decay could originate from several possible decay channels of the dye molecules such as
differences in adsorption, aggregation and tilted binding modes.
As explained above, addition of Li-TFSI ions creates a local electric field due to intercalation of Li
cations. In addition, Li-TFSI is an electron-withdrawing agent, causing a surface potential build up at
the interface, which can attract electrons from the anchoring/acceptor groups close to the TiO2
nanoparticles. Theoretically, the injection yield can be increased by the use of Li cations and thus a
further reduced PL lifetime is observed from most dye molecules after addition of Li cations.
After application of Li cations, PMIMA and TMIMA show significantly decreased PL lifetimes from
149 ps to 39 ps and from 80 ps to 24 ps, respectively. These highly reduced PL lifetimes were also
observed in solutions of different polarity which gives insight into the properties of dye molecules in
polar environments.
0 200 400 600 800 1000
0.01
0.1
1
24 ps
80 ps
39 ps
No
rm. P
ho
tolu
min
esce
nce
Time /ps
149 ps
Figure 4-11. Normalized PL decays of PMIMA (black) and TMIMA (red) on titania, and the decays of
PMIMA (gray) and TMIMA (orange) after application of Li cations. Solid lines represent stretched-
exponential fits.
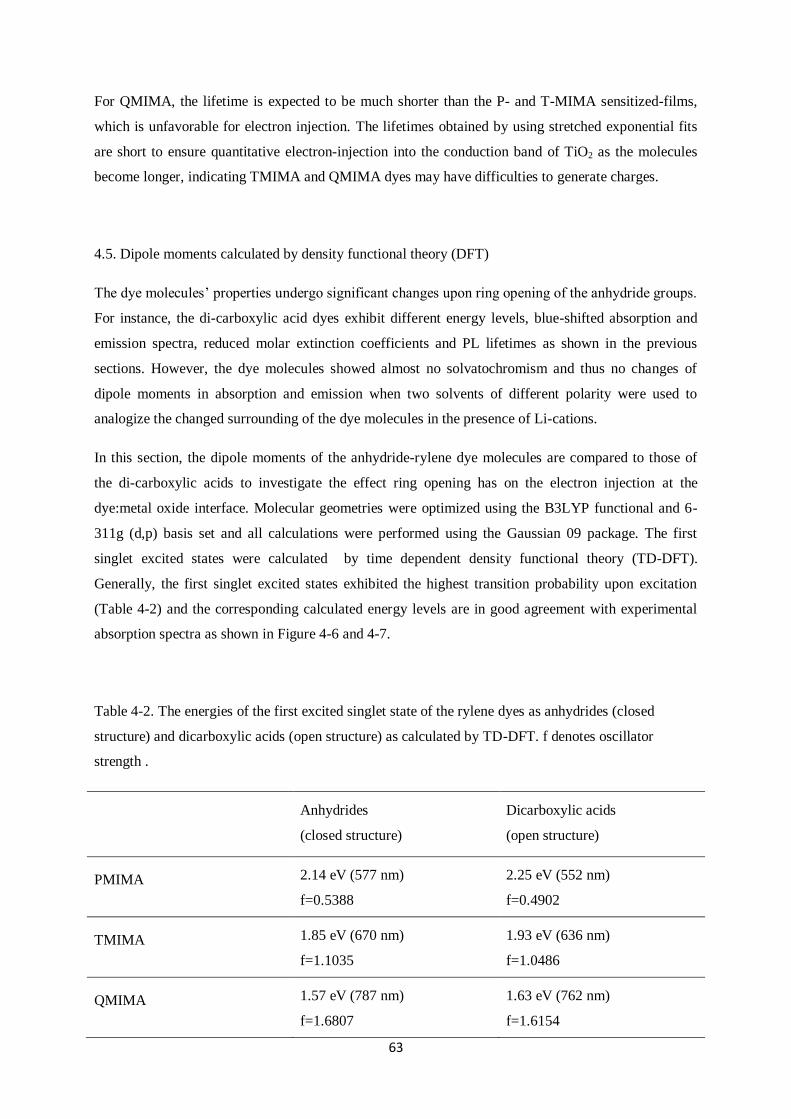
63
For QMIMA, the lifetime is expected to be much shorter than the P- and T-MIMA sensitized-films,
which is unfavorable for electron injection. The lifetimes obtained by using stretched exponential fits
are short to ensure quantitative electron-injection into the conduction band of TiO2 as the molecules
become longer, indicating TMIMA and QMIMA dyes may have difficulties to generate charges.
4.5. Dipole moments calculated by density functional theory (DFT)
The dye molecules‟ properties undergo significant changes upon ring opening of the anhydride groups.
For instance, the di-carboxylic acid dyes exhibit different energy levels, blue-shifted absorption and
emission spectra, reduced molar extinction coefficients and PL lifetimes as shown in the previous
sections. However, the dye molecules showed almost no solvatochromism and thus no changes of
dipole moments in absorption and emission when two solvents of different polarity were used to
analogize the changed surrounding of the dye molecules in the presence of Li-cations.
In this section, the dipole moments of the anhydride-rylene dye molecules are compared to those of
the di-carboxylic acids to investigate the effect ring opening has on the electron injection at the
dye:metal oxide interface. Molecular geometries were optimized using the B3LYP functional and 6-
311g (d,p) basis set and all calculations were performed using the Gaussian 09 package. The first
singlet excited states were calculated by time dependent density functional theory (TD-DFT).
Generally, the first singlet excited states exhibited the highest transition probability upon excitation
(Table 4-2) and the corresponding calculated energy levels are in good agreement with experimental
absorption spectra as shown in Figure 4-6 and 4-7.
Table 4-2. The energies of the first excited singlet state of the rylene dyes as anhydrides (closed
structure) and dicarboxylic acids (open structure) as calculated by TD-DFT. f denotes oscillator
strength .
Anhydrides
(closed structure)
Dicarboxylic acids
(open structure)
PMIMA
2.14 eV (577 nm)
f=0.5388
2.25 eV (552 nm)
f=0.4902
TMIMA
1.85 eV (670 nm)
f=1.1035
1.93 eV (636 nm)
f=1.0486
QMIMA
1.57 eV (787 nm)
f=1.6807
1.63 eV (762 nm)
f=1.6154

64
Table 4-3. Calculated dipole moments of the rylene dyes with closed and open ring.
Dipole moment (Debye)
Anhydrides
(closed structure)
Dicarboxylic acids
(open structure)
PMIMA
4.3 D
-3.1 D
TMIMA
4.6 D
-1.8 D
QMIMA
5.2 D
-2.1 D
Table 4-3 shows the calculated dipole moments of the rylene dyes as anhydrides (closed structure) and
dicarboxylic acids (openstructure). As expected from previous sections, anhydride-PMIMA and
TMIMA dye molecules show fairly similar dipole moments with 4.3 and 4.6 Debye, respectively,
indicating that electron density is localized at the anchoring group (acceptor moiety). Hence, the
dipole moment point to the terminal group, which is favorable for electron injection. This means that
the anchor group (acceptor moiety) shows electron withdrawing properties, whereas the imide group
exhibits weak electron donating properties.
On the contrary, the dipole moments of the dicarboxylic acids of P-, T-, Q-MIMA dyes are changed to
-3.1, -1.8, and -2.1 Debye, respectively. Hence, the direction and magnitude of the dipole moments are
significantly changed upon opening of the anhydride groups and adsorption at the metal oxide surface,
implying that the electron injection becomes unfavorable. In fact, the negative dipole moment values
indicate that the dipole moment of the dye molecules points to the anchor group rather than away from
it.
4.6. Detection of long-lived species
4.6.1. Detection of dye and hole conductor cations
The presence of long-lived charges is important for efficient dye-sensitized solar cells (DSCs) and was
investigated by quasi-steady-state photoinduced absorption (PIA) spectroscopy. The charges are
created as a consequence of injection and regeneration, and PIA signals in different spectral ranges
indicate charges. Prior to quasi-steady-state PIA measurements, the absorption of dye cations and hole
transporter cations was examined by the use of a Lewis acid, namely FeCl3, which can oxidize dye and
spiro-OMeTAD molecules to determine the absorption of dye cations and spiro cations.
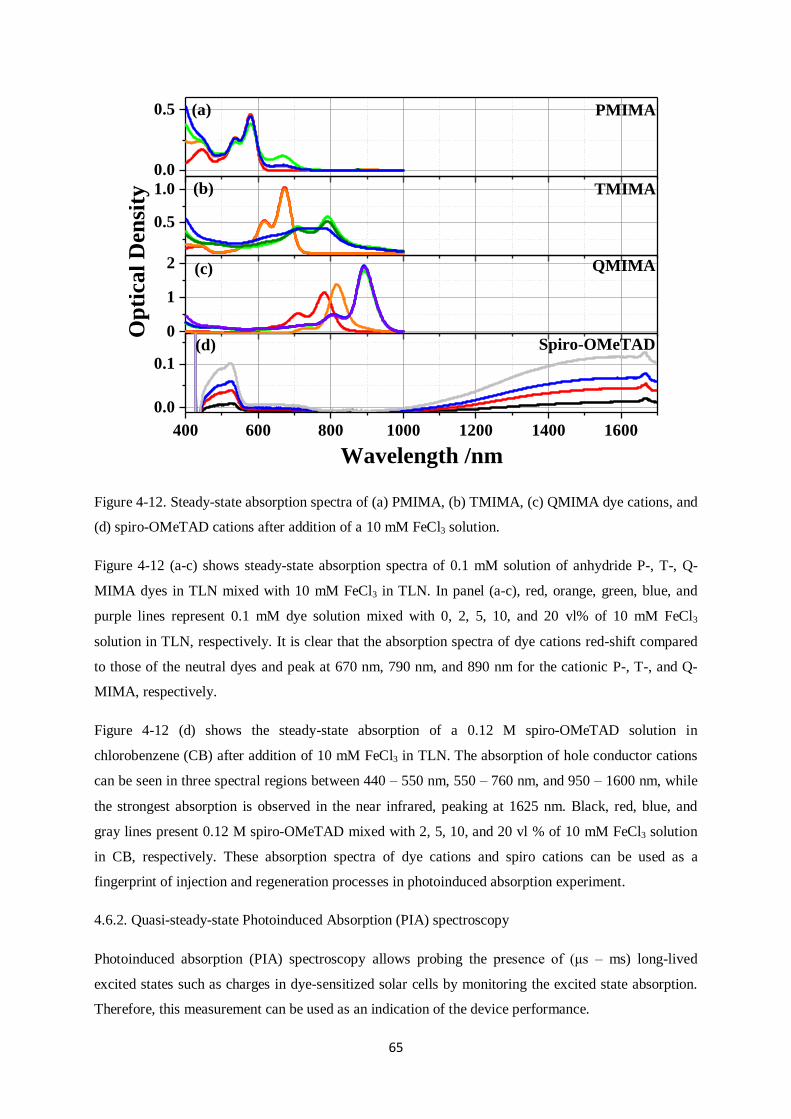
65
0.0
0.5
0.5
1.0
0
1
2
400 600 800 1000 1200 1400 1600
0.0
0.1
Spiro-OMeTAD
QMIMA
TMIMA
(d)
(c)
(b)
(a) PMIMA
Op
tica
l D
ensi
ty
Wavelength /nm
Figure 4-12. Steady-state absorption spectra of (a) PMIMA, (b) TMIMA, (c) QMIMA dye cations, and
(d) spiro-OMeTAD cations after addition of a 10 mM FeCl3 solution.
Figure 4-12 (a-c) shows steady-state absorption spectra of 0.1 mM solution of anhydride P-, T-, Q-
MIMA dyes in TLN mixed with 10 mM FeCl3 in TLN. In panel (a-c), red, orange, green, blue, and
purple lines represent 0.1 mM dye solution mixed with 0, 2, 5, 10, and 20 vl% of 10 mM FeCl3
solution in TLN, respectively. It is clear that the absorption spectra of dye cations red-shift compared
to those of the neutral dyes and peak at 670 nm, 790 nm, and 890 nm for the cationic P-, T-, and Q-
MIMA, respectively.
Figure 4-12 (d) shows the steady-state absorption of a 0.12 M spiro-OMeTAD solution in
chlorobenzene (CB) after addition of 10 mM FeCl3 in TLN. The absorption of hole conductor cations
can be seen in three spectral regions between 440 – 550 nm, 550 – 760 nm, and 950 – 1600 nm, while
the strongest absorption is observed in the near infrared, peaking at 1625 nm. Black, red, blue, and
gray lines present 0.12 M spiro-OMeTAD mixed with 2, 5, 10, and 20 vl % of 10 mM FeCl3 solution
in CB, respectively. These absorption spectra of dye cations and spiro cations can be used as a
fingerprint of injection and regeneration processes in photoinduced absorption experiment.
4.6.2. Quasi-steady-state Photoinduced Absorption (PIA) spectroscopy
Photoinduced absorption (PIA) spectroscopy allows probing the presence of (μs – ms) long-lived
excited states such as charges in dye-sensitized solar cells by monitoring the excited state absorption.
Therefore, this measurement can be used as an indication of the device performance.

66
Figure 4-13 shows the quasi-steady-state PIA spectra obtained for all dyes on titania (panel a), in the
presence of Li-ions (panel b) and in a device-like sample (with a structure of titania/dye/spiro-
OMeTAD + Li-TFSI + tBP, panel c). Here, the PMIMA, TMIMA, and QMIMA dyes were excited at
530 nm, 700 nm and 800 nm, respectively, and the data were normalized to the same excitation
density calculated from the photon flux and absorption cross-section at the respective excitation
wavelength.
In general, positive features correspond to bleaching of the ground state absorption, while negative
features can be assigned to the photoinduced absorption of cations created by electron transfer
processes. These features can be seen for all dyes on titania as presented in Figure 4-13 (a), however,
the spectral position and signal amplitude significantly differs between the various rylene dyes as
observed from Figure 4-12. The cation-induced absorption spectra are close to the ground state
bleaching of dye molecules as observed from Figure 4-12 (a-c) and peak at 598 nm for the PMIMA,
768 nm for the TMIMA and 931 nm for the QMIMA as shown in Figure 4-13 (a), respectively. The
difference between Figure 4-12 and 4-13 originates from whether or not the dye molecules are in the
open form. Clearly, the QMIMA shows the weakest bleaching and cation-induced absorption signal
among the series of rylene dyes, implying that there is only little electron injection from the excited
state of the dye into titania.
-5
0
52.48 1.24 0.83 0.62 0.50
-10
0
10
500 1000 1500 2000 2500
-5
0
(c) Device-like structure
(b) TiO2 with Li cations
(a) TiO2
T
/T /
10
4
Energy /eV
Wavelength /nm
1000 1500
-15
-10
-5
0
5
10
T
/T /
10
Wavelength /nm
Figure 4-13. Quasi-steady-state PIA absorption spectra (a) of the dyes adsorbed on titania, (b) of the
dyes on titania after application of Li-TFSI, and (c) of a device-like sample when PMIMA (black),
TMIMA (red), and QMIMA (blue) dyes are used. The inset: PIA spectra of a device-like sample using
Z907 (green) compared to the rylene dyes.
67
In the presence of Li cations, the amplitudes of the cation-induced absorption of the PMIMA and the
TMIMA dyes are increased as shown in panel (b) indicating that for both dyes Li-ions facilitate the
electron injection process. This observation is in good agreement with the fluorescence decay
dynamics presented above, which demonstrated faster fluorescence decay in the presence of Li-ions
for both dyes. On the other hand, virtually no effect is seen for the QMIMA indicating that the dye is
unable to inject electrons into the titania conduction band even in the presence of the Li cations. We
note, however, that a weak photoinduced absorption signal can be observed which may be attributed to
injection into low-lying sub-bandgap states of titania.
If the solid-state hole transporter Spiro-OMeTAD is used on the sensitized films, no PMIMA cation-
induced absorption can be seen anymore and instead a broad photoinduced absorption signal peaking
at around 1530 nm is observed. This signal has previously been assigned to the absorption of the hole
conductor-cations as shown in Figure 4-12 (d) exhibiting a peak at 1668 nm, and the difference of the
absorption spectral ranges originates from sample preparation, i.e. solution and film. This broad PIA
signal of the hole conductor demonstrates efficient regeneration of the dye‟s oxidized state. In case of
the PMIMA, the second and third higher energy absorptions of hole conductor-cations can be
observed between 500 – 638 and 620 – 780 nm, respectively. These features are also observed from
Figure 4-X (442 - 570 and 570 - 760 nm) and where reported elsewhere [136]
. In fact, the PMIMA-
sensitized device-like sample shows the strongest hole-transporting spiro-OMeTAD cation signal;
however, the amplitude of this signal is one order of magnitude lower than for Z907 as shown in the
inset, and this is directly related to the device performance as shown in the next section. The QMIMA
sample exhibits only a very weak spiro cation signal, which supports our previous statement that
electron injection from the QMIMA into titania is impeded and thus no dye regeneration occurs as
indicated by the absence of the photoinduced absorption from hole conductor cations.
We note that the Stark effect in these dye molecules is also observed in the visible range. Edvinsson et
al. described that a negative signal from TMIMA, looking like a PIA signal in the range between 580 -
700 nm (which is not observed from our data), cannot reliably be considered a dye-cation signal. We
consider this signal to originate from the Stark effect.
4.7. J-V curves and external quantum efficiency (EQE)
In the previous sections, changes in lifetimes and absorption/emission spectra upon adsorption of dye
molecules on titania and the charge generation were investigated. This section shows how these
photophysical characteristics ultimately affect the power conversion efficiency and external quantum
efficiencies (EQE) of the devices when the rylene dyes are used as sensitizers.

68
0.0 0.2 0.4 0.6-1.0
-0.5
0.0
0.5
1.0
1.5
400 500 600 700 800 9000
5
10
15
20
25(b)
Cu
rren
t D
ensi
ty /
mA
/cm
2
Voltage /V
PMIMA
TMIMA
QMIMA
(a)E
QE
/%
Wavelength /nm
PMIMA
TMIMA
QMIMA
0.0 0.5 1.0
-5
0
Cu
rren
t D
en
sity
/m
A/c
m2
Voltage /V
Figure 4-14. J-V curves of the dye-sensitized solar cells measured under AM1.5G solar illumination
(a) and corresponding EQE spectra (b) using PMIMA (black), TMIMA (red), and QMIMA (blue)
dyes.
Figure 4-14 shows the J-V curves of solid-state dye-sensitized solar cells under AM1.5G solar
illumination using the different rylene dyes and the ruthenium dye Z907 as sensitizer along with the
external quantum efficiency (EQE) of the respective devices.
Among the rylene dyes, PMIMA exhibits the highest power conversion efficiency in solid-state DSCs
with a total PCE of 0.3 % which is well in line with the longest lifetime of the dye‟s excited state and
the strongest spiro-OMeTAD cation signal. For the TMIMA, we obtained a PCE of 0.18 % whereas
QMIMA exhibited almost no meaningful photovoltaic performance in line with little cation-induced
absorption signals observed in PIA measurements.
Table 4-3. Photovoltaic parameters of the devices obtained from their J-V curves.
VOC/V
JSC/mA/cm2
FF
Eff./%
Expected.JSC/
mA/cm2
PMIMA
0.62
0.84
55.69
0.29
12.6
TMIMA
0.62
0.64
45.47
0.18
18.4
QMIMA
0.46
0.09
48.66
0.02
23.0
Z907
0.82
5.82
49.96
2.38
-

69
The low efficiencies of the rylene-sensitized solar cells are mainly due to the low short-circuit currents,
as indicated by the low charge generation signals of spiro cations. The reason for the low short-circuit
currents can be found in Figure 4-14(b) that shows the external quantum efficiency (EQE) as a
function of excitation wavelength for the rylene devices. The EQE levels of P-, T-, and Q-MIMA only
reach up to 20, 7, and 1 % at 550, 670, and 680 nm, respectively.
The current densities in the devices correspond to only 0.3 – 6 % of the maximum photocurrents that
can be calculated from the absorbance of the dye-sensitized solar cells under the assumption of unity
internal quantum efficiency. This large difference may mainly originate from poor charge generation
properties of rylene-sensitized films, which was expected from not only low ΔT/T signals in PIA
measurements, but also short lifetimes of the excited states.
The inset of Figure 4-14 (a) shows the J-V curves of the devices using PMIMA (black) and Z907
(green) dyes. Z907-sensitized solar cells exhibit an efficiency of 2.38 % with a short circuit current of
5.82 mA∙cm-2
, an open circuit voltage of 820 mV, and a fill factor of 0.49, whereas the PMIMA-
sensitized solar cell shows a power conversion efficiency of 0.3 %. The large difference in the PCE
between the two samples is mainly due to the low photocurrents that are a consequence of the
injection properties observed in PIA measurement. The PCEs of each device are averaged and
summarized in Table 4-3.
4.8. Ryleneanhydrides as sensitizers: Conclusions
The materials studied in this chapter belong to the family of rylene dyes, namely a perylene, terylene
and quaterylene derivative, bearing an imide and a maleic acid anhydride group at the terminal
positions. Each dye solution shows distinct vibronic progressions in the absorption and emission
spectra and clear red-shifts when going from a perylene to a terylene and a quaterlyene core due to
increased conjugation.
The di-carboxylic acids of the dye molecules exhibit altered spectroscopic properties due to a change
in the excited state energies upon opening of the anhydride rings. They exhibit a clear hypsochromic
shift and highly reduced photoluminescence quantum efficiency caused by an increased non-radiative
decay resulting also in reduced fluorescence lifetimes.
The anhydride rylene dye solutions show small positive solvatochromism in absorption and emission
spectra when toluene and dichlorobenzene were used to change the polarity of the dye solution,
indicating that the dipole moment in the excited state is not significantly larger than that in the ground
state. This implies that injection may not be facilitated in these dyes since the measurements in
different polarity solvents give insight into changes in the dipole moment between excited and ground

70
state of the dye and allow us to analogize these changes to those that occur in the surrounding of the
dye molecules in films upon treatment with Li cations.
The maximum short circuit currents that can be expected from the rylene dye-sensitized films when
assuming unity internal quantum efficiency are calculated and range between 12.6 and 23.0 mA∙cm-2,
since rylene dyes generally exhibit high molar extinction coefficients. However, solid-state P-, T-, Q-
MIMA-sensitized DSCs exhibit power conversion efficiencies of only 0.3, 0.2, and 0.02 %, with low
short circuit currents of 0.84, 0.64, and 0.09 mA∙cm-2, respectively. The low efficiencies of the rylene-
sensitized solar cells are mainly due to the low short-circuit currents. This is supported by result from
photoinduced absorption spectroscopy showing that the electron injection properties of these dye
molecules are very poor. Furthermore, the amplitude of the spiro cation signal of the PMIMA-
sensitized device-like sample is one order of magnitude lower than for the reference dye Z907 and this
appears to be directly related to the device performance. However, the PMIMA-sensitized device-like
sample showed the strongest spiro-OMeTAD cation signal of all rylene dyes in line with the best
device efficiency.
The unfavorable charge generation was found to be a result of changes in the dipole moment as
calculated by density functional theory. The anhydride-rylene dyes show small but favorable dipole
moment for electron injection, however, the dipole moment direction changes and points to the anchor
group, which is unfavorable for electron injection. upon ring opening of the anhydride moiety.
In summary, for efficient photovoltaic devices, high molar extinction coefficients are important to
absorb more photons as well as high energy levels to ensure injection and to generate more charges.
However, these are not the only prerequisites for a high power conversion efficiency of devices. In
fact, the influence of anchor groups and changes in dipole moments need to be thoroughly considered
when designing novel dye structures for dye-sensitized solar cells.

71
5. Perylene monoimide derivative dye, ID889
5.1. Materials and samples used
The material investigated in this chapter is a perylene monoimide derivative dye named ID889. It
consists of a carboxylic acid anchoring group, a perylene monoimide as an acceptor, and a fused
dibenzothiophene with a triarylamine as a π-conjugated bridge and donor moiety. The carboxlyic acid
anchoring group is used to increase adsorption on the semiconducting oxide layer in a device. The
dibenzothiophene moiety not only plays the role of a spacer, but also increases pi-conjugation to
absorb photons at lower energies. ID889 dye has been designed to have a localized electron
distribution in the HOMO and LUMO levels with the addition of the electron donating triarylamine
moiety in order to improve electron injection properties since perylene derivative dyes are known to be
poor electron donors. Alkyl groups on the triarylamine moiety are attached to increase the solubility of
the dye. The molecular structure of ID889 is shown in Figure 5-1.
The HOMO and LUMO levels shown in Figure 5-1 (b) are obtained from time-dependent density
functional theory (TD-DFT) calculations. The HOMO level of ID889 is lower than the HOMO level
of spiro-OMeTAD, thus, regeneration of the dye cation is energetically favorable. The LUMO level is
-3.5 eV by DFT calculation, but the LUMO level obtained from absorption/emission experiments is
-3.0 eV. These two values are high enough to inject electrons into the conduction band of the TiO2
layer. The energy levels of transparent conductive oxide (TCO), TiO2, spiro-OMeTAD, and the silver
electrode are adapted from elsewhere [137-142]
.
Figure 5-1. Molecular structure of the perylene monoimide derivative dye ID889 and the
HOMO/LUMO energy levels of the dye.

72
Table 5-1. List of investigated sample structures.
Number of sample Description
Sample 1 ID889 on alumina
Sample 2 ID889 on alumina with addition of Li-TFSI
Sample 3
(DSC structure on Al2O3)
ID889 on alumina with spiro-OMeTAD and all additives (Li-TFSI and
tBP)
Sample 4 ID889 on titania
Sample 5 ID889 on titania with addition of Li-TFSI
Sample 6
(DSC structure on TiO2)
ID889 on titania with spiro-OMeTAD and all additives (Li-TFSI and tBP)
Sample 7 ID889 on titania with spiro-OMeTAD and with tBP but without Li-TFSI
Sample 8 ID889 with spiro-OMeTAD on quartz
The samples for device fabrication and for optical spectroscopy were prepared as described in the
experimental section 3.1. For solution measurements, a 0.1 mM dye solution was prepared. The
sensitization of metal oxide films was carried out at 25˚C for 3-5 hours in toluene. Table 1 shows
seven sample structures that are studied in this chapter. The dyes in Samples 1-3 and in Samples 4-7
were adsorbed on alumina surfaces and on titania surfaces, respectively. Sample 8 was prepared by
spin-coating a blend of ID889 and a molecular hole conductor, namely spiro-OMeTAD.
5.2. Absorption/Emission spectra
5.2.1. Dye solutions
ID889 shows a molar extinction coefficient of 28,382 M-1cm
-1 at 512 nm in dichloromethane, which is
much higher than Z907, a Ru(II) complex dye, with 13,000 M-1
cm-1
at 520 nm [98]
. Figure 5-2 (a)
shows the steady-state absorption and emission spectra of a 0.1 mM ID889 dye solution in toluene.
The absorption spectrum does not show pronounced vibronic features but shows a gentle peak
between 495 nm and 520 nm. Excitation at 450 nm gives rise to a broad emission between 500 and
750 nm. The emission spectrum shows a Stokes shift of 50 nm and is peaking at 570 nm, with a
shoulder around 600 nm.
The LUMO level is determined to -3.0 eV, obtained from the onset of absorption in solution as shown
in Figure 5-2 (a). This energy level is located further up compared to the DFT calculated LUMO level
of 3.5 eV, and thus is energetically favorable for electron injection.
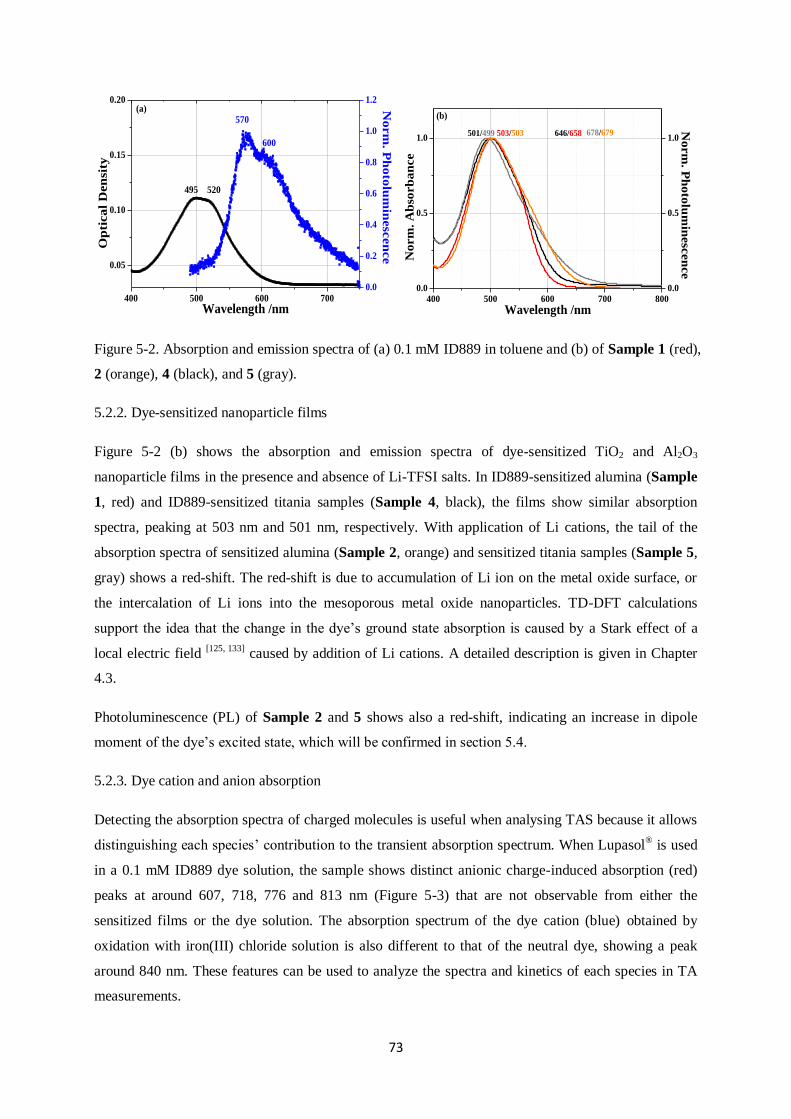
73
400 500 600 700
0.05
0.10
0.15
0.20
Norm
. Ph
oto
lum
inesc
en
ce
Wavelength /nm
Op
tica
l D
en
sity
0.0
0.2
0.4
0.6
0.8
1.0
1.2
600
570
520495
(a)
400 500 600 700 800
0.0
0.5
1.0
0.0
0.5
1.0
Norm
. Ph
oto
lum
inesc
en
ce
678/679646/658501/499 503/503
Norm
. A
bso
rb
an
ce
Wavelength /nm
(b)
Figure 5-2. Absorption and emission spectra of (a) 0.1 mM ID889 in toluene and (b) of Sample 1 (red),
2 (orange), 4 (black), and 5 (gray).
5.2.2. Dye-sensitized nanoparticle films
Figure 5-2 (b) shows the absorption and emission spectra of dye-sensitized TiO2 and Al2O3
nanoparticle films in the presence and absence of Li-TFSI salts. In ID889-sensitized alumina (Sample
1, red) and ID889-sensitized titania samples (Sample 4, black), the films show similar absorption
spectra, peaking at 503 nm and 501 nm, respectively. With application of Li cations, the tail of the
absorption spectra of sensitized alumina (Sample 2, orange) and sensitized titania samples (Sample 5,
gray) shows a red-shift. The red-shift is due to accumulation of Li ion on the metal oxide surface, or
the intercalation of Li ions into the mesoporous metal oxide nanoparticles. TD-DFT calculations
support the idea that the change in the dye‟s ground state absorption is caused by a Stark effect of a
local electric field [125, 133]
caused by addition of Li cations. A detailed description is given in Chapter
4.3.
Photoluminescence (PL) of Sample 2 and 5 shows also a red-shift, indicating an increase in dipole
moment of the dye‟s excited state, which will be confirmed in section 5.4.
5.2.3. Dye cation and anion absorption
Detecting the absorption spectra of charged molecules is useful when analysing TAS because it allows
distinguishing each species‟ contribution to the transient absorption spectrum. When Lupasol® is used
in a 0.1 mM ID889 dye solution, the sample shows distinct anionic charge-induced absorption (red)
peaks at around 607, 718, 776 and 813 nm (Figure 5-3) that are not observable from either the
sensitized films or the dye solution. The absorption spectrum of the dye cation (blue) obtained by
oxidation with iron(III) chloride solution is also different to that of the neutral dye, showing a peak
around 840 nm. These features can be used to analyze the spectra and kinetics of each species in TA
measurements.

74
400 600 800 1000 1200 1400 1600
0.0
0.5
1.0
776/813718
Ab
sorb
an
ce a
rb
.u.
Wavelength /nm
ID889 on TiO2
Anion absorption
Cation absorption
607
840
Figure 5-3. Absorbance spectrum of dye-sensitized titania film (black), dye anion (red), and dye cation
(blue) with an arbitrary offset.
For detailed sample preparation procedures, see Chapter 3.1.
5.3. Device characteristics and photoinduced absorption measurements
5.3.1. J-V characteristics
Figure 5-4 (a) shows the J-V characteristics of a solid-state dye-sensitized solar cell (DSC) using
ID889 under solar illumination of AM 1.5G. The best device exhibited a power conversion efficiency
of 4.5 % with a short circuit current of 7.47 mA∙cm-2
, an open circuit voltage of 860 mV, and a fill
factor of 69 %. The high efficiency of the ID889 device is mainly due to the high short circuit current,
as a consequence of the good charge separation and collection that will be demonstrated in section 5.5.
-0.2 0.0 0.2 0.4 0.6 0.8 1.0
-10
-5
0
5
10
Sh
ort
Cir
cu
it C
urren
t/m
A/c
m2
Voltage /V
Efficiency : 4.5 %
VOC
: 860 mV
JSC
: 7.47 mA/cm2
FF : 69 %
(a)
400 500 600 700 800
0
20
40
60
80
100
EQ
E /
%
Wavelength /nm
(b)
Figure 5-4. J-V characteristics of ID889-sensitized solid-state DSC measured under 100 mWcm-2
AM
1.5 G solar intensity and (b) corresponding EQE spectrum as a function of wavelength.

75
The maximum short circuit current can be predicted from the absorbance spectrum of the dye-
sensitized titania film under the condition of unity internal quantum efficiency and was calculated to
12.6 mA∙cm-2
for ID889. However, we obtained a short circuit current of 7.47 mA∙cm-2 only
corresponding to about 60 % of the total expected short circuit current, indicating significant losses -
presumably loss channels such as incomplete pore filling and recombination between injected
electrons and oxidized dye molecules/holes in the molecular hole transporter.
Figure 5-4(b) shows the external quantum efficiency (EQE) as a function of excitation wavelength for
the ID889 device. The EQE reaches up to 75% at 500 nm which is comparable to the 80 % EQE in
solid-state DSCs using spiro-OMeTAD exhibiting record efficiencies of 7.2 % [24]
. This high EQE
allows reasonable short-circuit currents in the device.
Although perylene dyes show very strong absorbance and long excited state lifetimes, the poor
injection properties of the perylene moiety limit the photocurrent, and the best reported efficiency
using perylene dyes in solid-state DSCs remains at 3.2% with a photocurrent of 8.7 mA/cm2 to dates
[86]. We note that the performance of devices using ID889 surpasses the efficiencies of previously
reported solid-state DSCs using perylene derivatives.
5.3.2. Quasi-steady-state photoinduced absorption (PIA) measurements
Tailored energy levels of the dye photosensitizer as shown in Figure 5-1 are important for high device
efficiency. The LUMO level of ID889 is high enough to inject electrons into the conduction band of
the metal oxide layer and the HOMO level of ID889 is lower than the HOMO level of the spiro-
OMeTAD, which allows dye regeneration.
Figure 5-5 shows quasi-steady-state photoinduced absorption (PIA) spectra obtained from ID889
(black, Sample 4), ID889 with Li cation additive (blue, Sample 5), and a complete device-like
structure using titania (orange, Sample 6). The samples were excited with a 530 nm LED to
investigate long-lived excited states such as charges.
As described in section 2.3.1, positive and negative features are assigned to ground-state bleaching
(GSB) and photoinduced absorption (PIA), respectively. All three samples show a GSB signal below
650 nm, where ID889 strongly absorbs photons, and PIA of the dye cation extending further into the
near-infrared spectral range.
Strongly modulated signals are observed below 590 nm as shown in Figure 5-5 caused by a Stark
effect. The Stark effect is observed due to the electric field between injected electrons and oxidized
dye molecules, and oxidized hole conductor molecules, and it interferes with the ground state
absorption of non-excited dyes that have already recombined or did not participate in charge
generation [143]
. Therefore, one should be careful to compare kinetics taken from the visible spectral
region, since they can be highly influenced by the Stark Effect.

76
1000 1500 2000 2500
-12
-10
-8
-6
-4
-2
0
2
41.24 0.83 0.62 0.50
831650
810
Energy /eV
/
10
-4
Wavelength /nm
ID889 on TiO2
ID889 on TiO2 plus Li-TFSI
ID889 device-like structure
Figure 5-5. Quasi-steady-state photoinduced absorption (PIA) spectra of ID889 on titania excited with
a 530 nm LED: ID889 on TiO2 (black, Sample 4), ID889 on TiO2 with Li salt (blue, Sample 5), and
ID889 on TiO2 with all additives and a hole conductor, having a complete device-like structure
(orange, Sample 6). Red-dotted line represents the absorption of dye cations obtained from steady-
state absorption measurements.
Sample 4 (black) shows broad PIA signals from the visible wavelength range to the NIR spectral
region even at room temperature, which implies that ID889 creates long-lived charge carriers without
the help of additives. However, it seems that not all dye molecules in Sample 4 contribute to the
injection process because Sample 5 (blue) which contains Li cation shows a slightly stronger signal
amplitude due to more efficient charge generation.
The stronger PIA signal of Sample 5 reveals more charge generation, perhaps owing to suppressed
recombination or facilitated injection originating from an increased driving force for electron injection.
In Sample 5, a positive signal up to 630 nm is followed by a broad PIA signal peaking at 810 nm. The
shape of the PIA is similar to the absorption spectrum of the dye cation (red dotted line in Figure 5-5,
taken from Figure 5-3) peaking at 650 and 831 nm. Despite a spectral mismatch between these two
spectra, presumably originating from the different environment (i.e. solution and film), it seems that
the broad PIA signal of Sample 5 can be assigned to dye cation absorption and thus is a direct
indication of injection from the dye molecule. Furthermore, the addition of Li cations appears to lead
to more efficient charge generation.
For a DSC device-like sample (orange, Sample 6), the strong absorption feature of the dye cation is no
longer observed and instead a broad PIA spectrum at lower energy is found. This broad PIA between
1000 and 2500 nm is assigned to the absorption of spiro-OMeTAD cations, due to efficient
regeneration of the dye cation, since this feature is the same as the absorption of oxidized spiro-
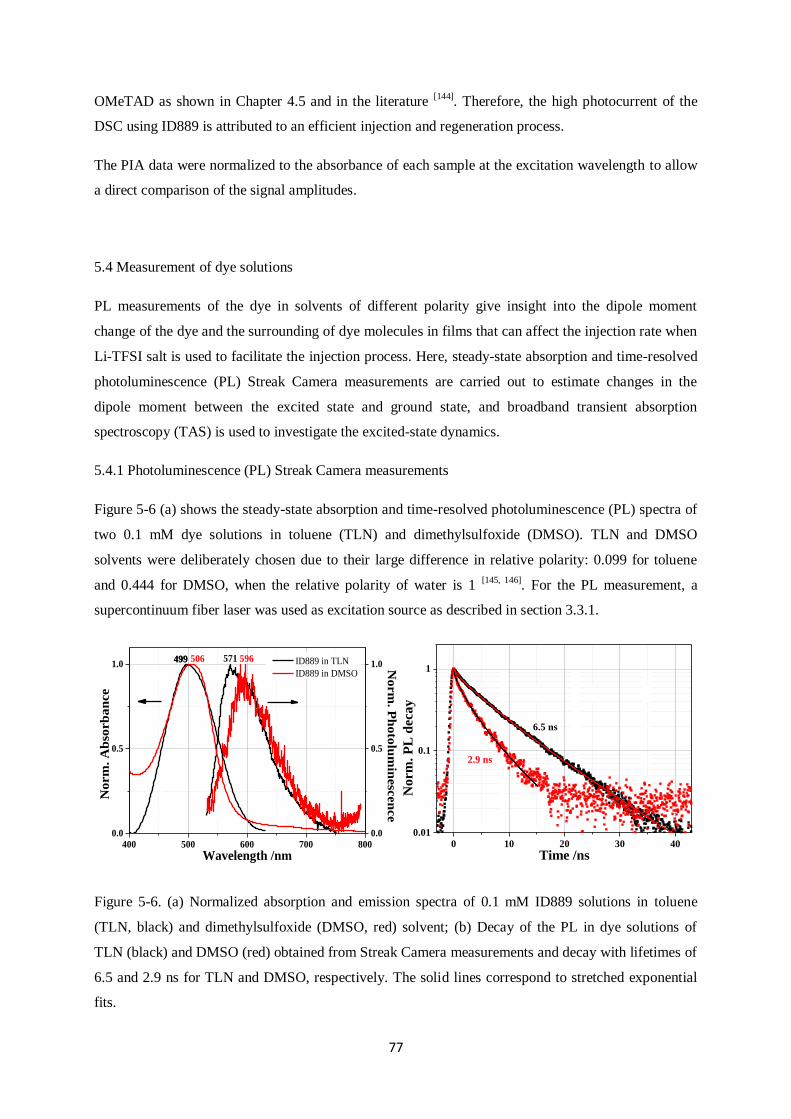
77
OMeTAD as shown in Chapter 4.5 and in the literature [144]
. Therefore, the high photocurrent of the
DSC using ID889 is attributed to an efficient injection and regeneration process.
The PIA data were normalized to the absorbance of each sample at the excitation wavelength to allow
a direct comparison of the signal amplitudes.
5.4 Measurement of dye solutions
PL measurements of the dye in solvents of different polarity give insight into the dipole moment
change of the dye and the surrounding of dye molecules in films that can affect the injection rate when
Li-TFSI salt is used to facilitate the injection process. Here, steady-state absorption and time-resolved
photoluminescence (PL) Streak Camera measurements are carried out to estimate changes in the
dipole moment between the excited state and ground state, and broadband transient absorption
spectroscopy (TAS) is used to investigate the excited-state dynamics.
5.4.1 Photoluminescence (PL) Streak Camera measurements
Figure 5-6 (a) shows the steady-state absorption and time-resolved photoluminescence (PL) spectra of
two 0.1 mM dye solutions in toluene (TLN) and dimethylsulfoxide (DMSO). TLN and DMSO
solvents were deliberately chosen due to their large difference in relative polarity: 0.099 for toluene
and 0.444 for DMSO, when the relative polarity of water is 1 [145, 146]
. For the PL measurement, a
supercontinuum fiber laser was used as excitation source as described in section 3.3.1.
400 500 600 700 800
0.0
0.5
1.0
0.0
0.5
1.0
N
orm
. Ph
oto
lum
inesc
en
ce
596571499 506
Norm
. A
bso
rb
an
ce
Wavelength /nm
ID889 in TLN
ID889 in DMSO
499
0 10 20 30 40
0.01
0.1
1
2.9 ns
No
rm
. P
L d
eca
y
Time /ns
6.5 ns
Figure 5-6. (a) Normalized absorption and emission spectra of 0.1 mM ID889 solutions in toluene
(TLN, black) and dimethylsulfoxide (DMSO, red) solvent; (b) Decay of the PL in dye solutions of
TLN (black) and DMSO (red) obtained from Streak Camera measurements and decay with lifetimes of
6.5 and 2.9 ns for TLN and DMSO, respectively. The solid lines correspond to stretched exponential
fits.

78
Table 5-2. Summarized fitting parameters of stretched exponential decay (I (t) = ( (
)
)
in the two different dye solutions.
A y0 β τ
ID889 in TLN 1 0 0.84 6.51
ID889 in DMSO 1 0 0.71 2.85
Upon illumination, rearrangement of the solvent shell surrounding the dye molecules is not as fast as
the dye molecules‟ electronic transition. The solvent shell will be arranged around the dye‟s excited
state after the electronic transition and then will create an additional field on the dye molecules.
Different magnitudes of electric field, depending on the kind of solvent, will shift the energy levels of
the dye molecules, leading to changes in absorption spectra, i.e. red-shifted absorption spectra in polar
solvents.
ID889 shows positive solvatochromism of the absorption and emission in more polar solvents due to a
larger dipole moment in the excited state that is favorable for electron injection: a smaller Stokes shift
from 499 nm to 571 nm in TLN, but a slightly larger shift from 506 nm to 596 nm in DMSO as shown
in Figure 5-6 (a). A larger Stokes shift in the more polar solvent DMSO can be assigned to a
significant change of the dipole moment of the dye between the excited state and the ground state. The
lower photoluminescence quantum efficiency in DMSO also supports the idea that ID889 exhibits
strong changes in dipole moment.
Turning to the decay of the PL shown in Figure 5-6 (b), stretched exponential fitting reveals lifetimes
of 6.5 and 2.9 ns for TLN (black) and DMSO (red) solvent, respectively. The shorter PL lifetime of
ID889 in the polar DMSO solvent can originate from enhanced non-radiative decay or a stronger
intramolecular CT state character caused by changes in the dipole moment due to the more polar
solvent shell. From the measurement in the polar solvent, we can analogize changes in the dye‟s
excited state when Li cations are used on films, since an addition of Li and the use of a polar solvent
cause effects by creating a local electric field. Detailed data fitting parameters are shown in Table 5-2.
This result is consistent with a calculation of dipole moments by TD-DFT as shown in Table 5-3. A
highly increased dipole moment in the excited state compared to the ground state can lead to favorable
injection into the conduction band of titania.
Table 5-3. Dipole moments of ID889‟s ground and first excited state.
Dipole moments μg μe
ID889 9.3 D 48.2 D

79
5.4.2. Transient Absorption (TA) measurements
Analysis of transient absorption (TA) data of the dye in solution is complicated due to the number of
photophysical processes which occur. This includes stimulated emission, (photo-) induced absorption,
and CT state generation. These processes, in solution, are strongly influenced by the solvent polarity;
therefore, PL spectra of dye solutions of different polarity solvents can be used to distinguish these
absorption features.
The early time (ps-ns) pump-probe spectra of two 0.1 mM dye solutions in TLN and DMSO can be
seen in Figure 5-7. In the less polar TLN solvent shown in Figure 5-7 (a), the exciton-induced
absorption is observed at early times (ps) and then the intramolecular CT states-induced absorption is
observed afterwards. The relaxation processes generally take place on a femto- to sub-one hundred
picosecond timescale and this is clearly observed from the less polar solvent due to the lower dielectric
constant of TLN. For the more polar DMSO solvent, the CT-induced absorption is mainly observed
and the exciton seems to decay on an ultrafast timescale. The faster decay at the CT-state is seen over
the whole wavelength range, which is consistent with the decay in the PL measurements.
Figure 5-8 shows the dynamics of excited states from the spectral region where they are free from PL
influence: 780-820 nm for an ID889 TLN solution and 800-840 nm for an ID889 DMSO solution.
ID889 in DMSO shows a signal rise up to 3 ps and fast decay afterwards, whereas ID889 in TLN rises
up to 200 ps followed by a moderately slow decay. This is attributed to different relaxation processes
leading to different formation rates of intramolecular CT states, in line with the polarity of the solvent.
Hence, the solvents having different dipole moments affect significantly the decay dynamics.
600 700 800 900
-14
-12
-10
-8
-6
-4
-2
0
2
4
Wavelength /nm
T
/T /
10
-3
Exciton
CT-state
(a)
-5
-4
-3
-2
-1
0
1
Norm
. P
L
600 700 800 900
-14
-12
-10
-8
-6
-4
-2
0
2
4
Wavelength /nm
T
/T /
10
-3
-5
-4
-3
-2
-1
0
1
No
rm. P
L
CT-state only
(b)
Figure 5-7. Short delay (ps-ns) broadband transient absorption spectra of ID889 solution (a) in TLN
and (b) in DMSO in the visible spectral region at delay times of 1 ps (red), 3ps (orange), 30 ps (green),
and 3000 ps (purple). The pump fluence is 37.56 μJ cm-2
at 510 nm for both measurements. Two blue
lines represent the PL spectra of each sample.
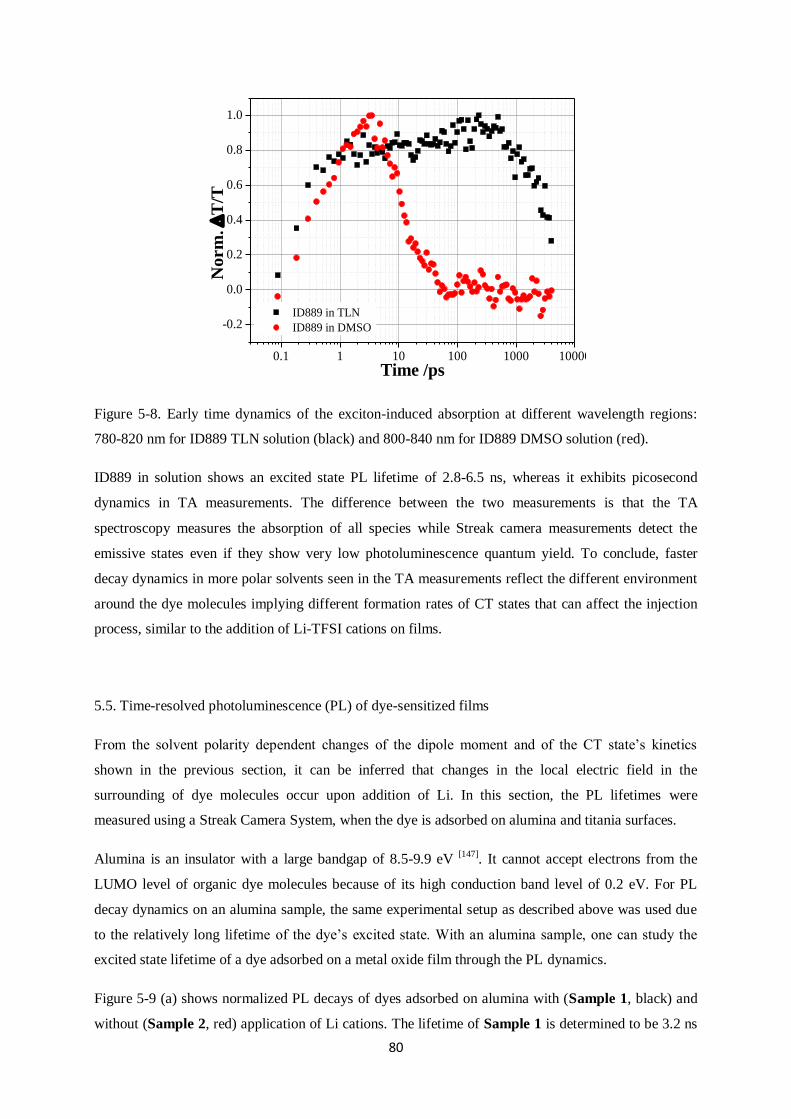
80
0.1 1 10 100 1000 10000
-0.2
0.0
0.2
0.4
0.6
0.8
1.0
ID889 in TLN
ID889 in DMSO
No
rm
.
T/T
Time /ps
Figure 5-8. Early time dynamics of the exciton-induced absorption at different wavelength regions:
780-820 nm for ID889 TLN solution (black) and 800-840 nm for ID889 DMSO solution (red).
ID889 in solution shows an excited state PL lifetime of 2.8-6.5 ns, whereas it exhibits picosecond
dynamics in TA measurements. The difference between the two measurements is that the TA
spectroscopy measures the absorption of all species while Streak camera measurements detect the
emissive states even if they show very low photoluminescence quantum yield. To conclude, faster
decay dynamics in more polar solvents seen in the TA measurements reflect the different environment
around the dye molecules implying different formation rates of CT states that can affect the injection
process, similar to the addition of Li-TFSI cations on films.
5.5. Time-resolved photoluminescence (PL) of dye-sensitized films
From the solvent polarity dependent changes of the dipole moment and of the CT state‟s kinetics
shown in the previous section, it can be inferred that changes in the local electric field in the
surrounding of dye molecules occur upon addition of Li. In this section, the PL lifetimes were
measured using a Streak Camera System, when the dye is adsorbed on alumina and titania surfaces.
Alumina is an insulator with a large bandgap of 8.5-9.9 eV [147]
. It cannot accept electrons from the
LUMO level of organic dye molecules because of its high conduction band level of 0.2 eV. For PL
decay dynamics on an alumina sample, the same experimental setup as described above was used due
to the relatively long lifetime of the dye‟s excited state. With an alumina sample, one can study the
excited state lifetime of a dye adsorbed on a metal oxide film through the PL dynamics.
Figure 5-9 (a) shows normalized PL decays of dyes adsorbed on alumina with (Sample 1, black) and
without (Sample 2, red) application of Li cations. The lifetime of Sample 1 is determined to be 3.2 ns
81
when the excited-state dynamics are fitted with a stretched exponential function (amplitude and offset
are set to 1 and 0, respectively). The decay mainly originates from singlet exciton quenching and/or
inter-/intra-molecular CT state formation. An intramolecular CT state can be formed by redistribution
of charge in ID889 upon excitation, whereas an intermolecular CT state may be created through a
charge hopping process when two dye molecules have the same energy and are close to each other.
Compared to the solution measurement, the lifetime of Sample 1 is shorter than that of ID889 in TLN
solution (6.5 ns), but it is still long enough for dye molecules to inject electrons.
With application of Li salts on the alumina surface (Sample 2, red), Sample 2 does not show the same
properties any longer. The Li cation is small enough to enter the mesoporous metal oxide
nanoparticles or to stay at the interface between the metal oxide layer and the dye molecules. Due to
the interaction of Li salts with dye molecules, the PL is further quenched and the lifetime is decreased
to 1.4 ns (the lifetime is 2.9 ns in ID889 solution in DMSO) when the fitting is done by a stretched
exponential decay. Faster PL decay of Sample 2 indicates an increased radiationless decay process
and/or due to an interaction of dye molecules with Li ions (changes in inter-/intra-molecular CT state).
The solid lines in Figure 5-9 (a) correspond to stretched exponential fits.
Titania is a metal oxide semiconductor with a bandgap of about 3.2 eV [132]
and dye molecules are able
to inject electrons due to the low-lying conduction band of TiO2. When ID889 is adsorbed onto the
TiO2 surface (Sample 4, black), the PL decay shown in Figure 5-9 (b) becomes significantly faster
than in solution or on an alumina surface. The decreased lifetime of the dye‟s excited state can be an
indication of injection. However, absolute comparison of the lifetimes between alumina and titania
may be somewhat difficult, since binding modes on the two nanoparticles can be different, as can be
the formation of a charge transfer state. The PL lifetime of Sample 4 was determined to be 54.8 ps by
time-resolved PL measurements. For detailed information see Chapter 3.3.
By the application of Li cations (Sample 5), the PL decay is not significantly changed from that of
Sample 4. The lifetime of Sample 5 was determined to be 52.2 ps with a stretched exponential
function. Here, we need to note that the PL measurement is not directly related to charge generation
(even after injection takes place in the sample) as only emissive species of the dye molecules‟ excited
state can be probed in PL measurements. Hence, the decay dynamics simply explain the status of dye
molecules in the excited state when they are exposed to Li cations. We can only tell that the lifetime of
52.2 ps appears to be long enough to inject electrons, if this is the lifetime of the dye‟s excited state
interacting with Li cations, considering that the injection process takes place on an ultrafast time scale
[25-28, 148]. Lifetimes of Sample 4 and 5 were obtained by stretched exponential decays with amplitude
of 1 and an offset of 0.
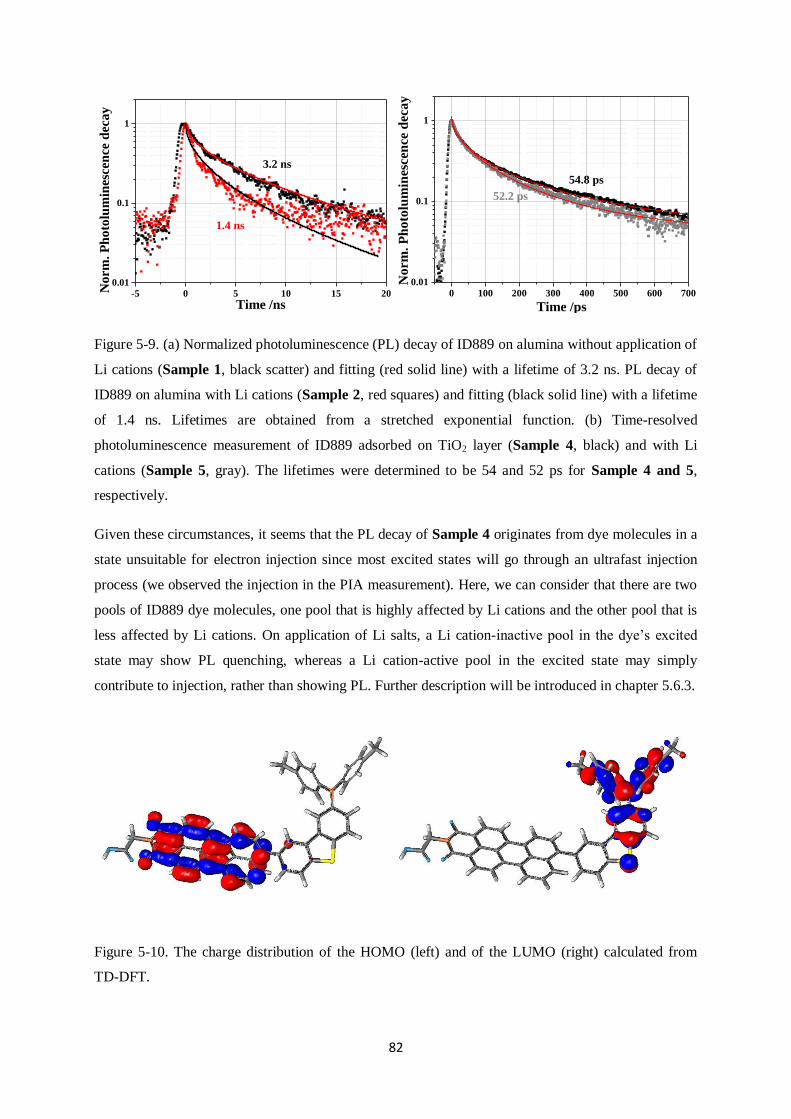
82
-5 0 5 10 15 20
0.01
0.1
1
1.4 ns
No
rm. P
ho
tolu
min
esce
nce
dec
ay
Time /ns
3.2 ns
0 100 200 300 400 500 600 700
0.01
0.1
1
52.2 ps
Norm
. P
ho
tolu
min
escen
ce d
eca
y
Time /ps
54.8 ps
Figure 5-9. (a) Normalized photoluminescence (PL) decay of ID889 on alumina without application of
Li cations (Sample 1, black scatter) and fitting (red solid line) with a lifetime of 3.2 ns. PL decay of
ID889 on alumina with Li cations (Sample 2, red squares) and fitting (black solid line) with a lifetime
of 1.4 ns. Lifetimes are obtained from a stretched exponential function. (b) Time-resolved
photoluminescence measurement of ID889 adsorbed on TiO2 layer (Sample 4, black) and with Li
cations (Sample 5, gray). The lifetimes were determined to be 54 and 52 ps for Sample 4 and 5,
respectively.
Given these circumstances, it seems that the PL decay of Sample 4 originates from dye molecules in a
state unsuitable for electron injection since most excited states will go through an ultrafast injection
process (we observed the injection in the PIA measurement). Here, we can consider that there are two
pools of ID889 dye molecules, one pool that is highly affected by Li cations and the other pool that is
less affected by Li cations. On application of Li salts, a Li cation-inactive pool in the dye‟s excited
state may show PL quenching, whereas a Li cation-active pool in the excited state may simply
contribute to injection, rather than showing PL. Further description will be introduced in chapter 5.6.3.
Figure 5-10. The charge distribution of the HOMO (left) and of the LUMO (right) calculated from
TD-DFT.

83
This hypothesis is supported by the observation of induced absorption of charges in the PIA
measurement shown in Figure 5-5. In PIA, the slightly increased signal strength of dye cation
absorption in Sample 5, compared to the absorption of dye cations without Li cation salts in Sample 4,
indicates that some Li cation-active pools become activated for injection and show increased charge
generation.
This can be additionally confirmed from the fairly localized electronic charge distribution of the
HOMO/LUMO levels in DFT calculations shown in Figure 5-10. Upon excitation, most electron
density is distributed in the proximity of the anchor group that is suitable for injection even without
application of Li salts. By addition of Li cations, some Li cation-inactive pools in an excited state will
become active, contributing to charge separation, and a Li cation-inactive pool exists, not participating
in injection but going through recombination or relaxation. This is why we observe an enhanced signal
strength of long-lived species in the PIA measurement in Sample 5, and a similar dye excited state
lifetime in Figure 5-9 (b).
5.6. Transient absorption spectroscopy on films
5.6.1. Main species observed
Transient absorption spectroscopy (TAS) allows detection of the excited state dynamics of different
transient species going through a relaxation, transition, or recombination process. In this section, the
charge generation and recombination process will be described by TA spectra and kinetics of each
species such as primary photoexcitation, dye cation, and hole-conductor (Spiro-OMeTAD) cation.
Primary photoexcitations are short-lived excitons, showing exciton-induced absorption and inter-
/intra-molecular charge-transfer (CT) states. The absorption of the latter (CT states) can be clearly
observed by TA measurements carried out on an alumina sample or a solution of the dye because there
the dye does not undergo a charge separation process. In the case of an efficient dye adsorbed on a
TiO2 surface (i.e. the dye injects electrons, sometimes without the aid of additives), it may be difficult
to observe the exciton-induced absorption from primary photoexcitations in our setup since the dye
injects electrons on an ultrafast timescale (fs-ps). In a sample treated with Li-TFSI salts, absorption of
primary excitations can be observed on a very early timescale, compared to a sample not treated with
Li cations, and TA spectra of primary excitations overlapped with absorption spectra of other species
on later timescales.
The observation of oxidized dye molecules is evidence of an electron-injection process from the dye‟s
excited state. Absorption spectra of oxidized dyes generally span across a broad wavelength range
from the visible to the near-infrared region and often overlap with absorption spectra of other species
such as excitons or oxidized hole-conductor molecules. This absorption feature, namely the dye cation

84
induced absorption, can be observed from dyes adsorbed on TiO2 treated with Li cations (i.e. Sample
5 and 6) due to enhanced electron injection, leading to a facilitated charge separation process.
The TA signal of oxidized hole-conductor molecules, namely spiro-OMeTAD cations, is a result of a
hole transfer process from the oxidized dye molecule to the hole-conductor. Once a dye cation is
generated, it can either recombine with electrons injected in the titania layer or transfer a hole to a
hole-conductor such as the spiro-OMeTAD. Hence, the charge-induced absorption of an oxidized
hole-conductor molecule indicates the regeneration of the dye‟s ground state or the formation of a dye
anion, if reductive quenching occurs [125]
.
5.6.2. Charge Transfer (CT) states on alumina
In this section, the generation of primary photoexcitations and charge transfer (CT) states is presented
from short-time (fs-ns) TA spectra of Sample 1 and 2. The CT state can be observed on alumina
surfaces after an addition of Li-TFSI that redistributes the charge densities across the dye molecules
and induces local electric fields at the interface. However, the CT state can be differentiated from the
dye cation (free charges) absorption by fluence series measurements, although the spectral range of the
two species often overlaps. For the short-delay TA measurement of ID889, an excitation at 510 nm is
used for all samples, since ID889 shows the strongest absorbance signal around 500 nm as shown in
Figure 5-2 (a) and all TA data are plotted at the lowest excitation fluence.
-4
-2
0
2
-2
-1
0
1(a)
500 600 700 800 900 1000 1100 1200 1300 1400 1500
-4
-2
0
2
4
6
3 ns
Wavelength /nm
T
/T /
10
-3
(b)
1ps
-2
-1
0
1
2
3
Norm
. P
L
Figure 5-11. Short delay (ps-ns) broadband TA spectra of Sample 1 (a) and of Sample 2 (b) at delay
times of 1 ps (red), 3 ps (orange), 30 ps (green), and 3000 ps (purple). The pump fluence at 510 nm is
6.4 μJ cm-2
for the visible and 25.8 μJ cm-2 for the near infrared measurements in Sample 1. For
Sample 2 fluence is 5.9 μJ cm-2
for the visible and 24.2 μJ cm-2
for the near infrared measurements.
Two blue lines represent the PL spectra of each sample.
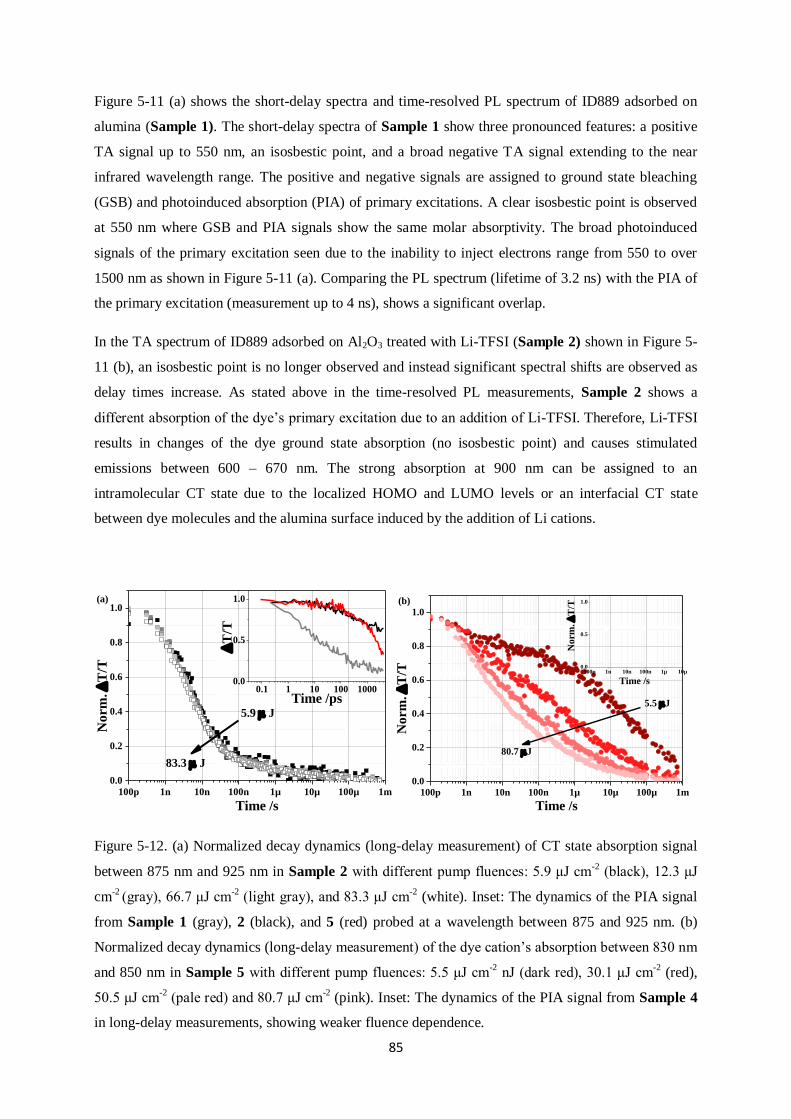
85
Figure 5-11 (a) shows the short-delay spectra and time-resolved PL spectrum of ID889 adsorbed on
alumina (Sample 1). The short-delay spectra of Sample 1 show three pronounced features: a positive
TA signal up to 550 nm, an isosbestic point, and a broad negative TA signal extending to the near
infrared wavelength range. The positive and negative signals are assigned to ground state bleaching
(GSB) and photoinduced absorption (PIA) of primary excitations. A clear isosbestic point is observed
at 550 nm where GSB and PIA signals show the same molar absorptivity. The broad photoinduced
signals of the primary excitation seen due to the inability to inject electrons range from 550 to over
1500 nm as shown in Figure 5-11 (a). Comparing the PL spectrum (lifetime of 3.2 ns) with the PIA of
the primary excitation (measurement up to 4 ns), shows a significant overlap.
In the TA spectrum of ID889 adsorbed on Al2O3 treated with Li-TFSI (Sample 2) shown in Figure 5-
11 (b), an isosbestic point is no longer observed and instead significant spectral shifts are observed as
delay times increase. As stated above in the time-resolved PL measurements, Sample 2 shows a
different absorption of the dye‟s primary excitation due to an addition of Li-TFSI. Therefore, Li-TFSI
results in changes of the dye ground state absorption (no isosbestic point) and causes stimulated
emissions between 600 – 670 nm. The strong absorption at 900 nm can be assigned to an
intramolecular CT state due to the localized HOMO and LUMO levels or an interfacial CT state
between dye molecules and the alumina surface induced by the addition of Li cations.
100p 1n 10n 100n 1µ 10µ 100µ 1m
0.0
0.2
0.4
0.6
0.8
1.0
83.3 J
No
rm
.
T/T
Time /s
5.9 J
0.1 1 10 100 10000.0
0.5
1.0
T
/T
Time /ps
(a)
100p 1n 10n 100n 1µ 10µ 100µ 1m
0.0
0.2
0.4
0.6
0.8
1.0
80.7 J
Norm
.
T/T
Time /s
(b)
5.5 J
100p 1n 10n 100n 1µ 10µ0.0
0.5
1.0
Norm
.
T/T
Time /s
Figure 5-12. (a) Normalized decay dynamics (long-delay measurement) of CT state absorption signal
between 875 nm and 925 nm in Sample 2 with different pump fluences: 5.9 μJ cm-2
(black), 12.3 μJ
cm-2 (gray), 66.7 μJ cm
-2 (light gray), and 83.3 μJ cm
-2 (white). Inset: The dynamics of the PIA signal
from Sample 1 (gray), 2 (black), and 5 (red) probed at a wavelength between 875 and 925 nm. (b)
Normalized decay dynamics (long-delay measurement) of the dye cation‟s absorption between 830 nm
and 850 nm in Sample 5 with different pump fluences: 5.5 μJ cm-2 nJ (dark red), 30.1 μJ cm
-2 (red),
50.5 μJ cm-2
(pale red) and 80.7 μJ cm-2 (pink). Inset: The dynamics of the PIA signal from Sample 4
in long-delay measurements, showing weaker fluence dependence.

86
The inset of Figure 5-12 (a) compares the dynamics of the PIA signal from Sample 1, 2, and 5 probed
at a wavelength between 875 and 925 nm. The decay of Sample 1 (gray) is significantly faster than
that of Sample 2 (black) due to the decay of primary excitations, namely excitons, whereas the PIA
decay dynamics of ID889 on titania with Li cation additive (Sample 5, red) looks fairly similar to that
of Sample 2. This means that Sample 1 shows mainly exciton decay, while the absorption of the CT
state at 900 nm from Sample 2 looks similar to the absorption features of the dye cation from Sample
5. However, we need to note that these two absorption features are basically generated through
different routes.
This fact is supported by long-delay TA measurements (ns-μs) that allow detection of the presence of
free charge carriers. Figure 5-12 (a) presents fluence dependent measurements of Sample 2 showing
decay dynamics of CT states at pump energies between 5.9 μJ cm-2 and 83.3 μJ cm
-2, whereas Sample
5 shows a strong fluence dependence as shown in Figure 5-12 (b). The kinetics of Sample 2 are not
fluence dependent in the wavelength range between 875 nm and 925 nm, where a strong absorption of
the CT state has been observed. This indicates that there is no free charge carrier generated in Sample
2 and the strong absorption feature is presumably attributed to an interfacial CT state, looking similar
to dye cation‟s decay dynamics.
Figure 5-12 (b) shows the decay dynamics of the oxidized dye ranging from 830 to 850 nm with
different fluence from 5.5 to 80.7 μJ/cm2 for Sample 5. Clearly, the higher the fluence, the faster the
decay observed. In comparison, the inset of Figure 5-12 (b) presents the fluence dependence of
Sample 4 in long-delay measurements, indicating weaker fluence dependence than in Sample 5 due to
a small amount of charge generation and mainly fast recombination. Detailed information is given in
the next section.
5.6.3. Generation of free charge carriers after addition of Li-TFSI on titania surface
As shown in the previous section, ID889 does not create free charge carriers on alumina, but evidence
of a local electric field (based on red-shifted PIA signals) and charge transfer states (based on the
strong absorption feature at 900 nm) are observed after addition of Li cations. In this section, the
generation of free charge carriers on titania is investigated by TA measurements.
ID889 injects electrons into TiO2 on an ultrafast timescale owing to its higher LUMO energy level
than the conduction band when it is adsorbed on the metal oxide semiconductor surface. Charge
generation via injection has already been proved by the observation of absorption of long-lived species
in PIA measurements, where signals indicate the presence of charges. Changes in PIA spectra in time
can be observed in the following TA measurements.

87
-6
-4
-2
0
2
T
/T /
10
-3
-8
-6
-4
-2
0
2
Norm
. P
L600 800 1000
0
1
Norm
.
T/T
Wavelength /nm
600 700 800 900 1000 1100 1200 1300 1400 1500
-4
-2
0
2
Wavelength /nm
-4
-2
0
2
600 800 1000
0
1
(b)
Norm
.
T/T
Wavelength /nm
(a)
Figure 5-13. TA spectra on the femto- to nano-second timescale and PL spectra of Sample 4 (a) and of
Sample 5 (b) at delay times of 1 ps (red), 3 ps (orange), 30 ps (green), and 3000 ps (purple). The
pump fluence at 510 nm is 18.5 μJ cm-2 in the visible and 36.0 μJ cm
-2 in the NIR for Sample 4 and
18.5 μJ cm-2
in the visible and 25.0 μJ cm-2
in the NIR for Sample 5. Two blue lines represent the PL
spectra of each sample. Insets: TA spectra of Sample 4 and Sample 5 in the visible normalized to the
minimum value of each spectrum.
Figure 5-13 (a) displays broadband visible and NIR pump-probe spectra of ID889-sensitized TiO2
(Sample 4). The broad PIA signals appear to be mainly originating from primary excitations, since the
PIA signal across a broad wavelength range from the visible to the near-infrared region looks similar
to that in ID889 on Al2O3 (Sample 1) which peaks at 620 nm, showing a red-shift due to presumably
different adsorption mode. However, the inset of Figure 5-13 (a), which shows the spectra in the
visible normalized to the PIA peak, provides evidence of injection. The PIA signals between 800 - 900
nm show almost no or a minor increase due to generation of oxidized dye molecules (as a consequence
of the injection process), whereas the PIA signals between 650 - 800 nm diminish due to a decrease in
absorption of the exciton. Thus, it can be stated that the dye cation is generated from the exciton
(injection from exciton); however, the dye cation signals seem to be very weak. Generation of the dye
cation is also supported by the spectrum at later time of Sample 4, which looks similar to that of the
earlier timescale of ID889 on TiO2 with Li cations, namely Sample 5, in turn indicating slower
injection in Sample 4 than in Sample 5. The PIA signals of Sample 4 between 620 - 640 nm are
likely influenced by PL, since the rather flat shape of the PIA signal looks like that of the PL spectrum
which has a lifetime of 54 ps as shown in Figure 5-9 (b).
After the application of Li-TFSI salts, the PIA signals red-shift about 20 nm as shown in Figure 5-13
(b), likely due to the ground state absorption being influenced by generation of a local electric field
(Stark Effect). Sample 5 shows a shoulder rising between 750 - 980 nm as the delay time increases as
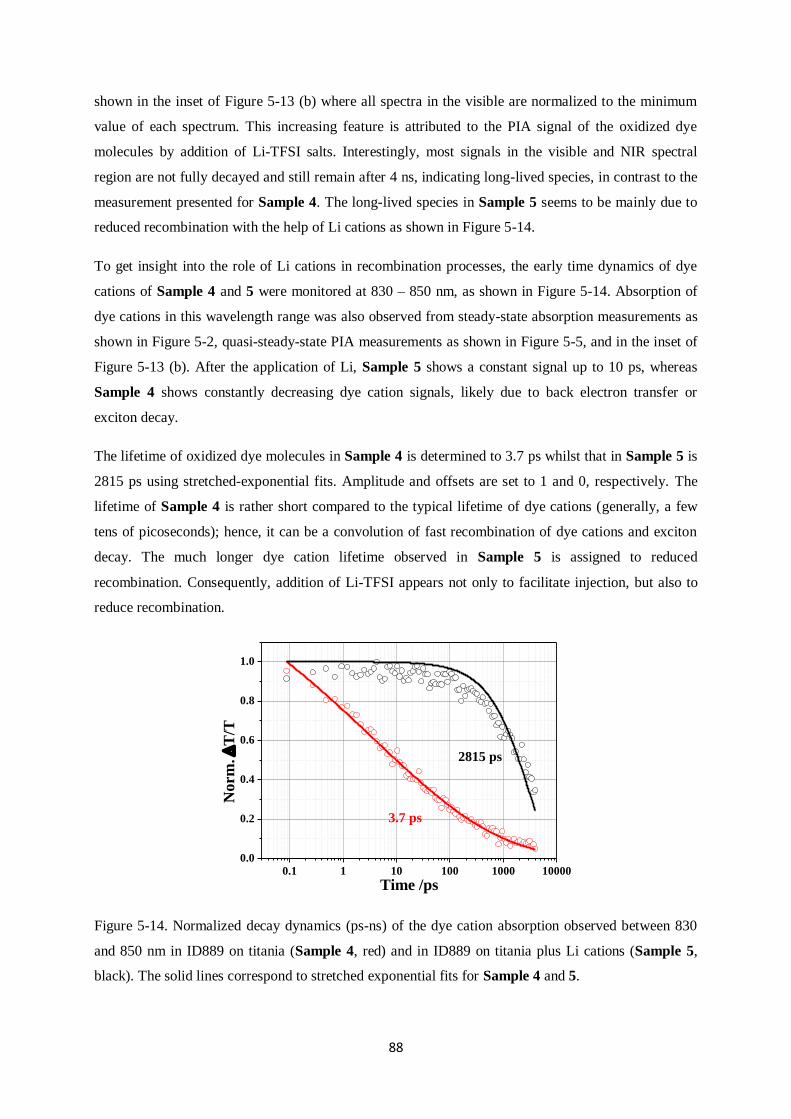
88
shown in the inset of Figure 5-13 (b) where all spectra in the visible are normalized to the minimum
value of each spectrum. This increasing feature is attributed to the PIA signal of the oxidized dye
molecules by addition of Li-TFSI salts. Interestingly, most signals in the visible and NIR spectral
region are not fully decayed and still remain after 4 ns, indicating long-lived species, in contrast to the
measurement presented for Sample 4. The long-lived species in Sample 5 seems to be mainly due to
reduced recombination with the help of Li cations as shown in Figure 5-14.
To get insight into the role of Li cations in recombination processes, the early time dynamics of dye
cations of Sample 4 and 5 were monitored at 830 – 850 nm, as shown in Figure 5-14. Absorption of
dye cations in this wavelength range was also observed from steady-state absorption measurements as
shown in Figure 5-2, quasi-steady-state PIA measurements as shown in Figure 5-5, and in the inset of
Figure 5-13 (b). After the application of Li, Sample 5 shows a constant signal up to 10 ps, whereas
Sample 4 shows constantly decreasing dye cation signals, likely due to back electron transfer or
exciton decay.
The lifetime of oxidized dye molecules in Sample 4 is determined to 3.7 ps whilst that in Sample 5 is
2815 ps using stretched-exponential fits. Amplitude and offsets are set to 1 and 0, respectively. The
lifetime of Sample 4 is rather short compared to the typical lifetime of dye cations (generally, a few
tens of picoseconds); hence, it can be a convolution of fast recombination of dye cations and exciton
decay. The much longer dye cation lifetime observed in Sample 5 is assigned to reduced
recombination. Consequently, addition of Li-TFSI appears not only to facilitate injection, but also to
reduce recombination.
0.1 1 10 100 1000 10000
0.0
0.2
0.4
0.6
0.8
1.0
2815 ps
No
rm
.
T/T
Time /ps
3.7 ps
Figure 5-14. Normalized decay dynamics (ps-ns) of the dye cation absorption observed between 830
and 850 nm in ID889 on titania (Sample 4, red) and in ID889 on titania plus Li cations (Sample 5,
black). The solid lines correspond to stretched exponential fits for Sample 4 and 5.

89
Enhanced charge generation of free charge carriers in Sample 5 is supported by long delay (1 ns –
0.1ms) TA measurements where detection of long-lived species such as charges is possible. A broad
negative PIA signal in the visible and NIR entirely originates from absorption of dye cations as shown
in Figure 5-15. Figure 5-15 (a) shows the result of long delay TA experiments on Sample 4 indicating
two absorption features as observed in the short delay TA measurements shown in Figure 5-13 (a): one
absorption feature around 620-640 nm and the other around 800-900 nm. The PIA signal peaking
around 620-640 nm is assigned to excitons and the distinct feature observed around 800-900 nm is due
to the PIA signal of dye cations.
On application of Li cations (Sample 5), the primary excitation is no longer observed due to fast
injection and instead a strong absorption of dye cation molecules is seen in the visible (600 – 900 nm)
and the near-infrared (1250 – 1400 nm) range as shown in Figure 5-15 (b). Also, the signal amplitude
is increased by 2-6 times, even though the excitation energies are the same, when compared to Sample
4, meaning that more long-lived species such as charges (via injection) are generated or that the cross-
sections of the dye cation become larger. In Sample 5, the GSB and isosbestic point red-shift by
approximately 30 nm, compared to Sample 4, due to a local electric field induced by Li ions. Here, it
confirms again that the strongest PIA signal of the dye cation is observed around 840 nm as described
in Figure 5-13 (b).
-1.0
-0.5
0.0
0.5
1.0
1.5
500 600 700 800 900 1000 1100 1200 1300 1400 1500
-4
-2
0
2
4
6
8
10 (b)
T
/T /
10
-3
1-3 ns
100-300 ns
1-3 s
100-300 s
(a)
Wavelength /nm
Figure 5-15. Long delay (ns - sub-ms) broadband TA spectra of Sample 4 (a) and of Sample 5 (b)
with delay times of 1 ns (red), 100 ns (orange), 1 μs (green), and 100 μs (purple). Excitation at 532 nm
and energy density of 4.9 μJ cm-2 in the visible and 6.2 μJ cm
-2 in the NIR for Sample 4 and of 4.9 μJ
cm-2 in the visible and 7.5 μJ cm
-2 in the NIR for Sample 5.

90
To conclude, the injection process of ID889 becomes faster after addition of Li cations, which
stabilizes the dye‟s CT states and suppresses back-electron transfer. Faster injection can be probed by
the oxidized dye molecule‟s absorption feature between 830 - 850 nm, while the suppressed
recombination is seen as an increase in lifetime to 2815 ps in Sample 5 from 3.7 ps in Sample 4.
5.6.4. Regeneration using Spiro-OMeTAD and the critical role of Li-TFSI
For photovoltaic performance, the oxidized dye molecules need to be reduced by a redox couple from
a liquid-state redox mediator or by hole transfer from a solid-state hole conductor. For a solid-state
DSC using ID889, an organic hole conductor, namely spiro-OMeTAD, is used to regenerate the dye
cation and to transport holes to the electrode. In this section, a sample having a device-like structure
(Sample 6) gives insight into the recombination and charge generation processes as in an actual device.
The sample preparation is described in Chapter 3.1.1.
-2
0
2
600 700 800 900 1000 1100 1200 1300 1400 1500
-10
-5
0
5(b)
(a)
600 800-2
-1
0
1
T
/T /
10
-3
Wavelength /nm
600 800
-2
0
Figure 5-16. Broadband TA spectra of (a) ID889 on TiO2 with Li-TFSI/tBP/spiro-OMeTAD (complete
device structure, Sample 6) and (b) ID889 on TiO2 with tBP/spiro-OMeTAD (Sample 7) on short-
delay time scale (ps - ns) at delay times of 1 ps (red), 3 ps (orange), 30 ps (green), and 3000 ps
(purple). The insets: The spectra in the visible normalized to the maximum value of each spectrum.
The pump fluence at 510 nm is 5.75 μJ cm-2
for the visible and 23.3 μJ cm-2
for the infrared
measurements in Sample 6 and 14.8 μJ cm-2 for the visible and 11.3 μJ cm
-2 for the infrared
measurements in Sample 7.

91
0.1 1 10 100 1000
0.2
0.4
0.6
0.8
1.0
ID889 with spiro/ on TiO2
ID889 with spiro/Li/tBP on TiO2
No
rm
.
T/T
Time /ps
Figure 5-17. Normalized decay dynamics (short-delay measurement) of the oxidized spiro-
OMeTAD‟s absorption between 1400 - 1430 nm in Sample 6 (closed) and 7 (open) with pump
fluences 23.3 μJ cm-2
for Sample 6 and 11.3 μJ cm-2
Sample 7.
Figure 5-16 (a) shows pump-probe spectra of a complete device-like sample (with a structure of
titania/dye/spiro-OMeTAD, Li-TFSI, and tBP, Sample 6). The most remarkable change, compared to
Sample 4 and 5, is a rise of a PIA signal in the NIR up to 4 ns, indicating generation of states that
have not been observed before. They may originate from the dye cation that is also observed in the
NIR; however, this increasing feature is attributed to the absorption of oxidized spiro-OMeTAD
molecules, since the spiro-OMeTAD cation absorption spectrum ranges from 1100 nm to 2100 nm,
peaking at 1600 – 1700 nm as shown in Chapter 4.4. [149]
. As another proof, the NIR at the early time
range of 1-1.5 ps shown in Figure 5-16 (a) looks very similar to the absorption spectrum of the dye
cation in the NIR on the later time range shown in Figure 5-13 (b). Therefore, the rise of the PIA
signals in the NIR region is attributed to spiro-OMeTAD taking holes from the oxidized dye
molecules thereby creating absorption of hole-conductor cations. An isosbestic point indicates a
transition between two species, namely dye cation and oxidized spiro-OMeTAD, with the same molar
absorptivity at 1110 nm.
Owing to the regeneration process, the oxidized dye molecule‟s absorption becomes less significant
not only in the NIR but also in the visible region between 800 - 850 nm, where the absorption of the
oxidized dye is observed. In Figure 5-16 (a), the rather strong absorption that is observed at the early
timescale between 800 – 850 nm disappears as the delay time increases as confirmed by the inset
showing spectra normalized to the maximum value in the visible range. However, remaining signals
may indicate that there are Li-inactive sites.

92
Figure 5-16 (b) shows the short-delay spectra of a device-like sample without Li-TFSI (with this
structure: titania/dye/spiro-OMeTAD/tBP, Sample 7). Interestingly, the primary excitation between
620 - 640 nm is still observed on the later timescale, implying an inefficient injection process. Based
on the observation of remaining primary excitations, it appears that only a small amount of dye cation
is generated and also regeneration of dye cations is not efficient. This is confirmed by both the visible
and NIR range. In the visible, the dye cation molecules‟ long-lived absorption is observed between
800 – 850 nm which should be reduced by the hole transfer process to the hole conductor, thereby
indicating an inefficient regeneration process if Li cations are not used in the device. This can be
clearly observed from the inset of Figure 5-16 (b). In the NIR, the signal strengths are very weak
compared to Sample 4 and 6, and this reflects inefficient regeneration by the hole conductor molecule.
The inefficient regeneration in Sample 7 is also supported from the decay dynamics of the oxidized
hole conductor signal taken between 1400 - 1430 nm when compared to that in Sample 6 as shown in
Figure 5-17. The PIA signal of Sample 7 increases up to 10 ps and afterwards starts decaying
continuously, whereas the generation of the oxidized spiro-OMeTAD molecule in Sample 6 continues
until 4 ns as reflected by the increasing signal. Thus, in Sample 7, we cannot exclude a possibility of
reductive quenching that also contributes to charge generation from an anionic dye molecule due to
preceding hole transfer to a hole conductor, since the absorption of primary excitation is still observed
and dye cation charge generation is not efficient. Therefore, the decay in Sample 7 after 10 ps shows
that the regeneration process is not as efficient as in Sample 6.
0
5
10
15
500 600 700 800 900 1000 1100 1200 1300 1400 1500
-4
-3
-2
-1
0
1(b)
T
/T /
10
3
1 - 3 ns
100 - 300 ns
1 - 3 s
100 - 300 s
(a)
Wavelength /nm
Figure 5-18. (a) Long delay (ns-sub-ms) broadband TA spectra of Sample 6 (a) and of Sample 7 (b)
with delay times of 1 ns (red), 100 ns (orange), 1 μs (green), and 100 μs (blue). Excitation at 532 nm
and energy density of 45.2 μJ cm-2
in the visible and 51.7 μJ cm-2
in the NIR for Sample 6 and of 52.7
μJ cm-2
in the visible and 70.0 μJ cm-2
in the NIR for Sample 7.

93
Long-time delay (ns – μs) TA spectra of Sample 6 and 7 are shown in Figure 5-18. From Sample 6
(Figure 5-18 (a)), the distinct absorption signals of the dye cation that were observed around 840 nm in
Figure 5-15 (a) are no longer seen due to the efficient regeneration process. The continuously
increasing signals in the short-time delay measurements shown in Figure 5-16 (a) finally start to
decrease after a rise of the signal up to 200 ns in the long-time delay measurements shown in Figure 5-
18 (a), indicating the end of charge transfer and beginning of recombination between the injected
electrons and the oxidized spiro-OMeTAD molecules.
This decay dynamics of Sample 6 is depicted as a black curve in Figure 5-19 (a), taken from the same
wavelength region between 1400 -1430 nm in Figure 5-16. The regeneration time in Sample 6 was
determined to be 335.6 μs at the weakest excitation fluence when a stretched exponential function is
used with an amplitude of 1 and an offset of 0. The kinetics are fluence dependent in this wavelength
range due to the presence of free charge carriers, leading to a non-geminate recombination process.
Turning to Sample 7, the absorption features of both the primary excitation and dye cation still exist in
the visible region as shown in Figure 5-18 (b), maybe showing evidence of reductive quenching, and
the absorption of the oxidized spiro-OMeTAD in the NIR decreases constantly, indicating a small
amount of charge generation. This is confirmed from the fluence dependence in Sample 7 as shown in
Figure 5-19 (b) showing similar decay dynamics.
0.0
0.5
1.0
10p 100p 1n 10n 100n 1µ 10µ 100µ 1m 10m
0.0
0.5
1.0
70.0 J cm2
135.4 J cm2
(b)
300nJ
900nJ
1260nJ
No
rm.
T/T
335.6 s
(a)
51.7 J cm2
300nJ
600nJ
900nJ
Time /s
135.4 J cm2
Figure 5-19. Normalized decay dynamics (long-delay measurement) of the oxidized hole conductor‟s
absorption between 1400 – 1430 nm in Sample 6 (a) and Sample 7 (b) at different pump fluence.

94
To summarize, the free charge carriers created by addition of Li-TFSI in the device-like structure, i.e.
Sample 6, show non-geminate recombination. Although we observed that ID889 injects electrons
without any additives, the role of Li-TFSI still appears to be critical in the device. Thus, the device-
like structure without Li cation additives in Sample 7 shows a weak fluence dependence due to its
inability to generate free charges or fast recombination. Furthermore, even if charges are generated,
most charges recombine on the early time scale. Therefore, the addition of Li cations helps generation
of free charge carriers and reduces recombination, and thus is very important to improve the
photocurrents in solid-state DSCs using ID889.
5.7. Reductive quenching
Reductive quenching, or preceding hole transfer, is another possible charge generation channel that is
observed only in solid-state DSCs. In this process, electrons are injected from an anionic dye molecule
created by a preceding hole transfer from the dye‟s exciton to the hole conductor material. This
process is considered less efficient than the ordinary generation channel [125]
.
In Figure 5-16 (a), the spectra show a shoulder between 800 – 850 nm where both dye anion and
cation molecules strongly absorb photons, as shown in Figure 5-2. Thus, there is a need to find out if
this is an indication of reductive quenching occurring in Sample 6. To explore if the pronounced
absorption feature between 800 – 850 nm originates from the dye cation or anion molecule, a blended
solution consisting of dye, spiro-OMeTAD, and chlorobenzene at a ratio of 1:40:400 wt% [133]
was
spin-cast on a quartz glass. This sample (Sample 8) enables the observation of a hole-transfer process
from the dye to the hole conductor in the absence of the titania layer.
Figure 5-20 (a) shows broadband TA spectra of Sample 8 on the fs - ns timescale and the inset the
normalized spectra of Sample 8 and 3 (black and red lines, respectively). The spectra of Sample 8
show a shoulder of an absorption peak around 800 nm where the dye anion molecule strongly absorbs
photons, as shown in Figure 5-2. In fact, there are three reasons to believe that this sample creates dye
anion molecules.
First, a rise of the signals observed beyond 1190 nm up to 15 ps (green in Figure 5-20 (a)) is attributed
to a hole transfer process from the dye to the hole conductor material, since the shape of the spectra is
fairly similar to that of the oxidized hole conductor‟s absorption spectra (compare Figure 5-16 (a)).
This implies that the dye has the possibility of reductive quenching due to the energy levels of the
HOMOs of ID889 and spiro-OMeTAD (changes in concentration gradient of free charge holes).

95
500 600 700 800 900 1000 1100 1200 1300 1400 1500
-2.5
-2.0
-1.5
-1.0
-0.5
0.0
T
/T /
10
-3
Wavelength /nm
600 800
0.0
0.5
1.0
1 ps
4.5 ns
1 ps
15 ps
4.5 ns
0.1 1 10 100 1000 10000
0.0
0.5
1.0
1.5
T
/T N
orm
. @
t =
0
Time /ps
Figure 5-20. (a) Short delay (ps-ns) broadband transient absorption spectra of an ID889:Spiro-
OMeTAD blend sample (Sample 8) at delay times of 1 ps (red), 15ps (green), 300 ps (blue), and 3000
ps (purple). The pump fluence at 510 nm is 33.8 μJ cm-2
in the visible and 45.4 μJ cm-2
in the NIR.
Inset: Normalized TA spectra of Sample 8 (black lines) and of Sample 3 (red lines) at delay times of
1 ps, 15 ps, and 4.5 ns as color becomes pale. (b) Decay dynamics between 1400 – 1430 nm of
Sample 3 (red) and 8 (black) normalized at the delay time of 0.
Second, the absorption of Sample 8 beyond 650 nm (black lines) decreases in 15 ps and then increases
up to 4 ns as shown in the inset of Figure 5-20 (a) when the spectra are normalized. This is because the
exciton decay leads to a rise of signals attributed to the generation of the dye anion up to 15 ps, since
Sample 8 cannot create the dye cation, but can create the dye anion via a hole transfer process. On the
contrary, a device-like sample built on Al2O3 (red lines, Sample 3) shows a rise of signals due to the
generation of CT states from primary excitations (showing the absorption characteristics similar to the
dye cation) formed by the use of Li-TFSI and spiro-OMeTAD as the delay time increases as shown in
the inset of Figure 5-20 (a). Theoretically, Sample 3 should show the absorption due to reductive
quenching; however, ID889 instead shows dye cation-like absorption characteristics due to the use of
Li-TFSI salts and spiro-OMeTAD, indicating that injection is more favorable than in Sample 8. This
is supported again by the spectral red-shift and weak signal of the primary excitation observed from
Sample 3 (red lines) shown in the inset of Figure 5-20 (a), whereas Sample 8 (black lines) shows
remaining primary excitations as the delay time increases. Furthermore, the difference in the decay
dynamics of Sample 3 and 8 shown in Figure 5-20 (b) helps to determine whether or not the charges
are generated by the hole conductor.
In order to determine the decay dynamics of the exciton and charge transfer (CT) state in Sample 8,
the TA data matrix was deconvoluted by multivariate curve resolution (MCR). MCR analysis
determines spectra and concentration profiles of each species based on physical constraints. Sample 1
exclusively shows exciton kinetics. Therefore, the TA spectrum of Sample 1 is used in the

96
deconvolution of Sample 8 to determine the concentration profiles of exciton and CT state in Sample
8. The parameters from a global fit of the concentration profiles are summarized in Table 5-4.
Table 5-4. Parameters extracted from the global fit of the exciton and CT state dynamics in Sample 8
when a two-exponential decay fit is used.
(
) (
)
Exciton
CT state
A1 0.22 ± 0.03 -0.29 ± 0.05
t1 1.34 (set) 1.34 ± 0.24
A2 0.10 ± 0.01 0.63 ± 0.01
t2 39.95 ± 7.79 508.51 ± 15.30
y0 0.01 ± 0.003 0.35 ± 0.01
The excited dye molecules enter the CT state (reductive quenching) very fast, showing an inverse rate
of 1.3 ps, and the CT states decay to the ground state with a rather slow inverse rate of 508 ps, which
is two orders of magnitude longer than the exciton lifetime. In addition, the largest amount of CT
states is generated on a subpicosecond timescale correlated to the initial fast drop in the exciton
population. However, this initial fast rise was not fitted since it is affected by the system response of
our TA setup. The exciton decay was then modeled with a biexponential function, in which one rate
was fixed to the 1.3 ps obtained from the CT rise. The second rate constant describes the exciton decay
to the ground state, yielding 39.95 ps.
0.1 1 10 100 1000
0.0
0.2
0.4
0.6
0.8
1.0
t1: 39.95 ps
t3: 508.51 ps
Exciton
CT
No
rm.
T/T
Time /ps
t2: 1.34 ps
Figure 5-21. (a) Decay kinetics of exciton and charge transfer state (CT formed by preceding hole
transfer process) from Sample 8 using bi-exponential fits represented as solid lines. (b) A schematic
diagram of the excited state and transfer processes in Sample 8.

97
The rise of the signal up to 15 ps in Sample 8 shown in Figure 5-20 (b) implies a hole transfer process
from the neutral dye (exciton) to the hole conductor spiro-OMeTAD. However, we note that these
fitting parameters should be only considered as a parameterization to quantify the processes. Figure 5-
21 shows the decay kinetics of the exciton and CT state with two exponential fits and a schematic
energy level diagram of Sample 8.
Thirdly, we can determine the origin of the absorption spectrum based on the shape/amplitude of the
spectrum. Figure 5-22 shows the steady-state absorption spectra of dye anion (dotted black) and cation
(dotted red) compared to the TA spectra of Sample 8 (solid black), Sample 3 (solid blue), and Sample
6 (solid greens). The dotted lines show the intrinsic absorption of each ionic dye molecule obtained
from subtraction of the absorption spectra from the dye‟s ground state absorption spectrum. For the
creation of dye cation and anion in the steady-state UV-vis absorption measurements, iron(III)chloride
and Lupasol are used, respectively. The detailed experimental preparation is explained in Chapter
3.2.3. The solid black (450 ps), red (30 ps), blue (10 ps), and greens (1 ps, 4 ns) lines represent the TA
spectra of Sample 8, 5, 3 and 6, respectively. Each graph shows the absorption features of the CT state
and the dye cation. Sample 8 seems to form the dye anion via a hole transfer as the TA spectrum of
Sample 8 is very alike the absorption spectrum obtained from the dye anion molecule, whereas the
other spectra look like the absorption spectra of the dye cation as shown in Figure 5-22. The
absorption spectrum of the dye anion (dotted black) from the steady-state absorption measurements
shows a small blue-shift, compared to the TA spectrum of Sample 8, and it is due to the presence of
iron(III)chloride.
600 700 800 900
0.0
0.2
0.4
0.6
0.8
1.0
4 ns
Norm
.
T/T
Wavelength /nm
1 ps
Figure 5-22. Normalized steady-state absorption of cationic (dotted red)/anionic (dotted black) dye
molecules and normalized TA spectra of Sample 8 (solid black), 5 (solid red), and 3 (solid blue).
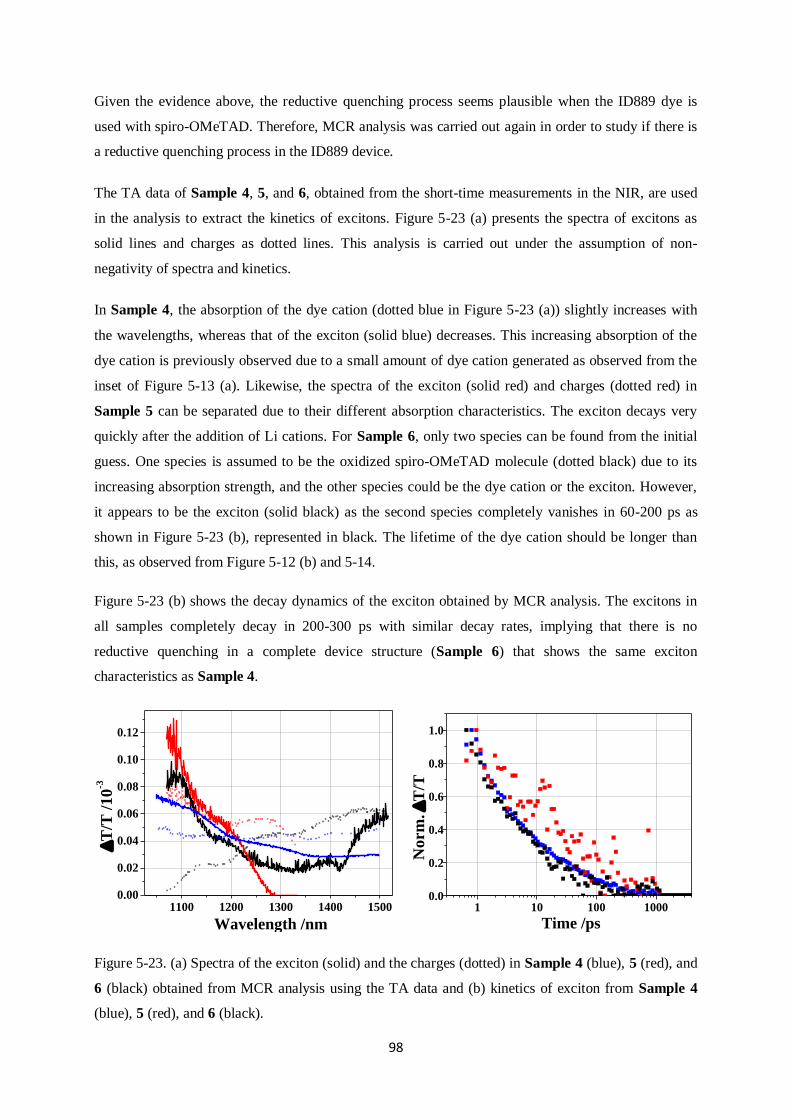
98
Given the evidence above, the reductive quenching process seems plausible when the ID889 dye is
used with spiro-OMeTAD. Therefore, MCR analysis was carried out again in order to study if there is
a reductive quenching process in the ID889 device.
The TA data of Sample 4, 5, and 6, obtained from the short-time measurements in the NIR, are used
in the analysis to extract the kinetics of excitons. Figure 5-23 (a) presents the spectra of excitons as
solid lines and charges as dotted lines. This analysis is carried out under the assumption of non-
negativity of spectra and kinetics.
In Sample 4, the absorption of the dye cation (dotted blue in Figure 5-23 (a)) slightly increases with
the wavelengths, whereas that of the exciton (solid blue) decreases. This increasing absorption of the
dye cation is previously observed due to a small amount of dye cation generated as observed from the
inset of Figure 5-13 (a). Likewise, the spectra of the exciton (solid red) and charges (dotted red) in
Sample 5 can be separated due to their different absorption characteristics. The exciton decays very
quickly after the addition of Li cations. For Sample 6, only two species can be found from the initial
guess. One species is assumed to be the oxidized spiro-OMeTAD molecule (dotted black) due to its
increasing absorption strength, and the other species could be the dye cation or the exciton. However,
it appears to be the exciton (solid black) as the second species completely vanishes in 60-200 ps as
shown in Figure 5-23 (b), represented in black. The lifetime of the dye cation should be longer than
this, as observed from Figure 5-12 (b) and 5-14.
Figure 5-23 (b) shows the decay dynamics of the exciton obtained by MCR analysis. The excitons in
all samples completely decay in 200-300 ps with similar decay rates, implying that there is no
reductive quenching in a complete device structure (Sample 6) that shows the same exciton
characteristics as Sample 4.
1100 1200 1300 1400 15000.00
0.02
0.04
0.06
0.08
0.10
0.12
Wavelength /nm
T
/T /
10
-3
1 10 100 10000.0
0.2
0.4
0.6
0.8
1.0
Time /ps
Norm
.
T/T
Figure 5-23. (a) Spectra of the exciton (solid) and the charges (dotted) in Sample 4 (blue), 5 (red), and
6 (black) obtained from MCR analysis using the TA data and (b) kinetics of exciton from Sample 4
(blue), 5 (red), and 6 (black).

99
This is consistent with the result of time-resolved PL measurements shown in Figure 5-9 (b), where
the lifetimes of the dye‟s excited states in Sample 4 and 5 are 54 and 52 ps, respectively, implying
similar exciton dynamics in Sample 4 and 5. In addition, absence of reductive quenching in ID889 is
strongly supported by the measurements on Sample 3 that did not show any evidence of hole transfer
when spiro-OMeTAD and Li cations are used, although it could show reductive quenching due to the
energy levels. Upon application of spiro-OMeTAD and Li cations, large changes in the dipole moment
of ID889 between the excited state and the ground state encourage an injection process on the ultrafast
time scale rather than reductive quenching. Furthermore, in Figure 5-22, the TA spectrum of the
device-like sample, Sample 6, follows the cationic dye molecules‟ absorption spectrum over the
whole range of short-delay times (light green: 1ps, dark green: 4 ns). This strongly implies that
Sample 6 injects electrons from presumably neutral dye molecules rather than from the anionic dye
molecules.
To conclude, although Sample 8 shows anion formation via hole transfer to a hole conductor, MCR
analysis shows that a device-like structure, Sample 6, seems to go through injection from the neutral
excited state based on the observation of the same decay kinetics of excitons in all samples, likely
owing to facilitated injection by the addition of Li cations.
5.8. ID889: Conclusions
The highly efficient push-pull type dye ID889 consists of a carboxylic acid anchoring group, a
perylene monoimide as an acceptor, and a fused dibenzothiophene with triarylamine as a π-conjugated
bridge and donor moiety. ID889 shows a high molar extinction coefficient of 28,382 M-1
cm-1
at 512
nm in dichloromethane and ID889-sensitized films also show high absorbance corresponding to an
optical density of about 1.5 - 2 around 500 nm.
To investigate the injection properties of ID889, sensitized alumina and titania films were used for
optical spectroscopy measurements. From the short-time (fs - ps) TA measurements of ID889
adsorbed on alumina (Sample 1), only two features, the ground state bleaching (GSB) and
photoinduced absorption were observed, separated by a clear isosbestic point at 550 nm. The lifetime
of the dye‟s excited state significantly changed from 3.2 ns to 1.4 ns when Li-TFSI was used on the
alumina film (Sample 2), since ID889 interacts strongly with the Li cation rather than showing
electronically inactive properties as in Sample 1. Therefore, we are able to observe the absorption of
an intramolecular/interfacial charge transfer state. Highly localized charge distribution and a larger
Stokes shift in polar solvents and Li-treated films originate from a larger dipole moment in the excited
state than in the ground state.

100
The short-delay TA measurements of ID889 adsorbed on titania (Sample 4) mainly show two distinct
features, i.e. GSB and photoinduced absorption (PIA) of the primary photoexcitation. The absorption
of the dye cation in Sample 4 was not clear from the short-delay measurement, but it emerges in the
long-delay TA measurements (ns – μs) and the quasi-steady-state PIA measurements (ns – μs) that
allowed monitoring of long-lived charges. For ID889 adsorbed on titania treated with Li cations
(Sample 5), the absorption feature of the dye cation molecule became prominent even on pico-second
timescales in short-delay TA measurements and the presence of the dye cation was supported by the
observation of non-geminate recombination of free charge carriers from fluence dependent long-delay
measurements. Hence, Li-TFSI salts not only facilitate electron injection, but also suppress a
recombination channel. This can be seen from the decay dynamics of the dye cation in Sample 4 and 5
showing lifetimes of 3 and 2800 ps, respectively.
The role of Li-TFSI in a device-like sample is critical. In a device-like sample (Sample 6), the
absorption of the primary excitation was no longer observed in the short-delay measurements owing to
ultrafast charge injection and the dye cation absorption disappeared in the long-delay measurements
owing to efficient regeneration by spiro-OMeTAD. A device-like sample without Li cation additive
(Sample 7) showed a rise of the oxidized hole conductor signal only up to 10 ps, whereas the signal
increased up to 200 ns in Sample 6. This is in line with the observation of the exciton and dye cation
signal from Sample 7 in the long-delay measurements due to inefficient injection. This implied that
only a small amount of free charge carriers was generated in Sample 7 and they were short-lived or
recombination outperformed regeneration.
For an ID889 blend with spiro-OMeTAD (Sample 8), a rise of a signal originating from a hole
transfer in the NIR TA measurements was observed. However, when Li-TFSI salt was used in ID889-
sensitized films, ID889 showed strong CT states on an alumina layer i.e. a device-like structure on
alumina (Sample 3) or promoted injection into a titania layer in Sample 5 and 6. The similar decay
dynamics of the exciton in Samples 4, 5, and 6, with lifetimes of 200-300 ps, indicated that ID889
injected electrons from the dye‟s excited state rather than by formation of dye anions after a preceding
hole transfer process to spiro-OMeTAD.
With the advantageous properties of ID889 described above, the best solid-state ID889 DSCs
exhibited an efficiency of 4.5 %, exceeding the best efficiency of 3.2 % in solid-state DSCs using
perylene derivatives, reported to date. Owing to the excellent injection properties of ID889, the device
showed a short circuit current of 7.5 mA∙cm-2
and the external quantum efficiency reached 75 %
around 500 nm. However, the absorption range is limited, unfortunately harvesting a relatively small
amount of solar photons.
In summary, for efficient photovoltaic devices, addition of Li-TFSI is crucial and important to
generate and stabilize free charge carriers, as well as to regenerate oxidized dye molecules, although

101
the dye can inject without the aid of Li cations. In addition, direct injection from the dye‟s excited
states rather than by a preceding hole transfer appears to make the ID889 devices efficient.

102
6. CYCLOPENTADITHIOPHENE (CPDT) BUILDING BLOCK DYES
D-π-A type organic dyes using cyclopentadithiophene (CPDT) moieties as bridging units have shown
excellent efficiencies, up to 10 %, when they are used with a cobalt (II/III) electrolyte as a redox
mediator and efficiencies of 3 % in solid-state DSCs using spiro-OMeTAD, respectively [101-103]
.
Here, the photophysical properties of novel D-π-A type organic dye molecules that consist of a CPDT
bridging unit with four different donor moieties are investigated. Changes in lifetimes of excited states
and injection efficiencies in the presence and absence of Li cations are studied to get insight into the
charge injection properties and results from quasi-steady-state photoinduced absorption and transient
absorption experiments are correlated to changes in the power conversion efficiency.
6.1. Materials and samples
Four novel CPDT dye molecules are investigated, namely FPH224, 231, 233, and 303. FPH224, 231,
and 233 consist of cyanoacrylic acid as an acceptor (anchor) unit, a cyclopentadithiophene (CPDT)
moiety as a bridging unit, and triphenylamine-based moieties as a donor unit. FPH303 has the same
molecular structure as FPH224 but with a different anchor group, namely rhodanine-3-acetic acid. The
cyanoacrylic acid is used to withdraw electrons from the donor building block and triphenylamine is
used as donor as it is electron-rich. The π-conjugated CPDT bridging-unit not only plays a role in the
charge transfer from the donor to the acceptor, but also contributes to photon harvesting. The
molecular structures of the four CPDT dye molecules are shown in Figure 6-1 (a).
Figure 6-1. Molecular structures of FPH 224, 231, 233, and 303 (a), and the HOMO levels measured
by cyclic voltammetry (b).

103
Table 6-1. Calculated orbital surfaces and HOMO/LUMO energies of the FPH series of dye molecules.
HOMO LUMO
FPH224
- 5.35 eV
-2.63 eV
FPH231
-4.62 eV
-2.55 eV
FPH233
-4.95 eV
-2.63 eV
FPH303
-5.18 eV
-2.69 eV
In Figure 6-1 (b), the highest occupied molecular orbital (HOMO) levels of the 4 dye molecules are
also presented, which were obtained by cyclic voltammetry (CV) on dye solutions in which platinum
electrodes were used and the field was scanned at a rate of 100 mV/s. The HOMO levels of the FPH
dye series appear to be lower than the HOMO level of spiro-OMeTAD, allowing regeneration.
However, these energy levels may not be suitable for a redox process in a liquid-state dye-sensitized
solar cell using a cobalt electrolyte which has a potential energy of 5.2-5.4 eV. Unfortunately,
pronounced peaks (representing LUMO levels) in the reduction wave of the CV measurements were
not observed, but we could approximate the LUMO levels from the onset of absorption in solution and
films. The LUMO levels of the dye molecules are much higher than the conduction band of titanium
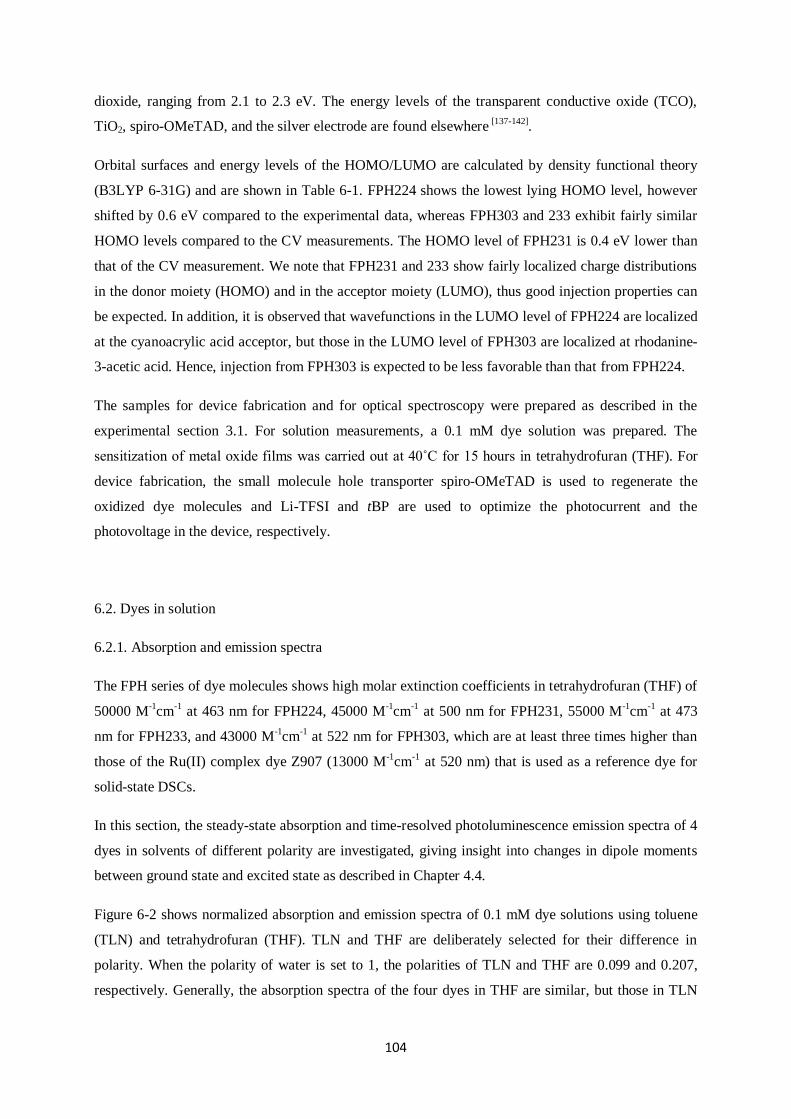
104
dioxide, ranging from 2.1 to 2.3 eV. The energy levels of the transparent conductive oxide (TCO),
TiO2, spiro-OMeTAD, and the silver electrode are found elsewhere [137-142]
.
Orbital surfaces and energy levels of the HOMO/LUMO are calculated by density functional theory
(B3LYP 6-31G) and are shown in Table 6-1. FPH224 shows the lowest lying HOMO level, however
shifted by 0.6 eV compared to the experimental data, whereas FPH303 and 233 exhibit fairly similar
HOMO levels compared to the CV measurements. The HOMO level of FPH231 is 0.4 eV lower than
that of the CV measurement. We note that FPH231 and 233 show fairly localized charge distributions
in the donor moiety (HOMO) and in the acceptor moiety (LUMO), thus good injection properties can
be expected. In addition, it is observed that wavefunctions in the LUMO level of FPH224 are localized
at the cyanoacrylic acid acceptor, but those in the LUMO level of FPH303 are localized at rhodanine-
3-acetic acid. Hence, injection from FPH303 is expected to be less favorable than that from FPH224.
The samples for device fabrication and for optical spectroscopy were prepared as described in the
experimental section 3.1. For solution measurements, a 0.1 mM dye solution was prepared. The
sensitization of metal oxide films was carried out at 40˚C for 15 hours in tetrahydrofuran (THF). For
device fabrication, the small molecule hole transporter spiro-OMeTAD is used to regenerate the
oxidized dye molecules and Li-TFSI and tBP are used to optimize the photocurrent and the
photovoltage in the device, respectively.
6.2. Dyes in solution
6.2.1. Absorption and emission spectra
The FPH series of dye molecules shows high molar extinction coefficients in tetrahydrofuran (THF) of
50000 M-1
cm-1
at 463 nm for FPH224, 45000 M-1cm
-1 at 500 nm for FPH231, 55000 M
-1cm
-1 at 473
nm for FPH233, and 43000 M-1
cm-1 at 522 nm for FPH303, which are at least three times higher than
those of the Ru(II) complex dye Z907 (13000 M-1
cm-1
at 520 nm) that is used as a reference dye for
solid-state DSCs.
In this section, the steady-state absorption and time-resolved photoluminescence emission spectra of 4
dyes in solvents of different polarity are investigated, giving insight into changes in dipole moments
between ground state and excited state as described in Chapter 4.4.
Figure 6-2 shows normalized absorption and emission spectra of 0.1 mM dye solutions using toluene
(TLN) and tetrahydrofuran (THF). TLN and THF are deliberately selected for their difference in
polarity. When the polarity of water is set to 1, the polarities of TLN and THF are 0.099 and 0.207,
respectively. Generally, the absorption spectra of the four dyes in THF are similar, but those in TLN

105
significantly differ depending on the dyes. In each panel, the darker and paler lines represent the less
polar solvent TLN and the more polar solvent THF, respectively.
When dye molecules are dissolved in solvents, the dipoles of dye and solvent molecules interact with
each other: the dipoles of the solvent molecules orient around the photoexcited state of dye molecules.
The internal relaxation of energetically high vibrational states generated upon excitation of the dye
molecules occurs on a fs timescale. Therefore, the Stokes shift in a non-polar solvent is determined by
the energy difference of the vibrational states involved in absorption and emission. In a more polar
solvent, a larger Stokes shift is observed due to the larger orientation polarizability of the solvent that
consists of both solvent reorientation and electronic redistribution (electronic transition) of the solvent
molecules. Electronic transitions are much faster than the solvent reorientation around excited dye
molecules, which leads to shifts of emission spectra in more polar solvents.
The absorption/emission spectra of FPH224 and FPH233 exhibit similar changes as shown in panel (a)
and (c). FPH224 in TLN peaks at 422 nm in the absorption spectrum and at 537 nm in the emission
spectrum, showing a Stokes shift of 115 nm, while FPH233 peaks at 406 nm in the absorption and at
547 nm in the emission spectrum, exhibiting a Stokes shift of 146 nm. The Stokes shift becomes
slightly larger in the more polar solvent, i.e. 130 nm for FPH224 in THF and 157 nm for FPH233 in
THF.
0.0
0.5
1.0
0.0
0.5
1.0
0.0
0.5
1.0
0.0
0.5
1.0
0.0
0.5
1.0
0.0
0.5
1.0
400 500 600 700 800
0.0
0.5
1.0
0.0
0.5
1.0
(d)
(c)
(b)
567 610510 522
406 473 547 630
612 654500 506
537 593 FPH224 in TLN
FPH224 in THF
422 463(a)
Norm
. Ph
oto
lum
inescen
ceNo
rm. A
bso
rba
nce
FPH231 in TLN
FPH231 in THF
FPH233 in TLN
FPH233 in THF
Wavelength /nm
FPH303 in TLN
FPH303 in THF
Figure 6-2. Normalized absorption and emission spectra of 0.1 mM FPH224 (panel a, black), 231
(panel b, red), 233 (panel c, blue), and 303 (panel d, green) in the less polar solvent TLN (dark) and in
more polar solvent THF (pale).
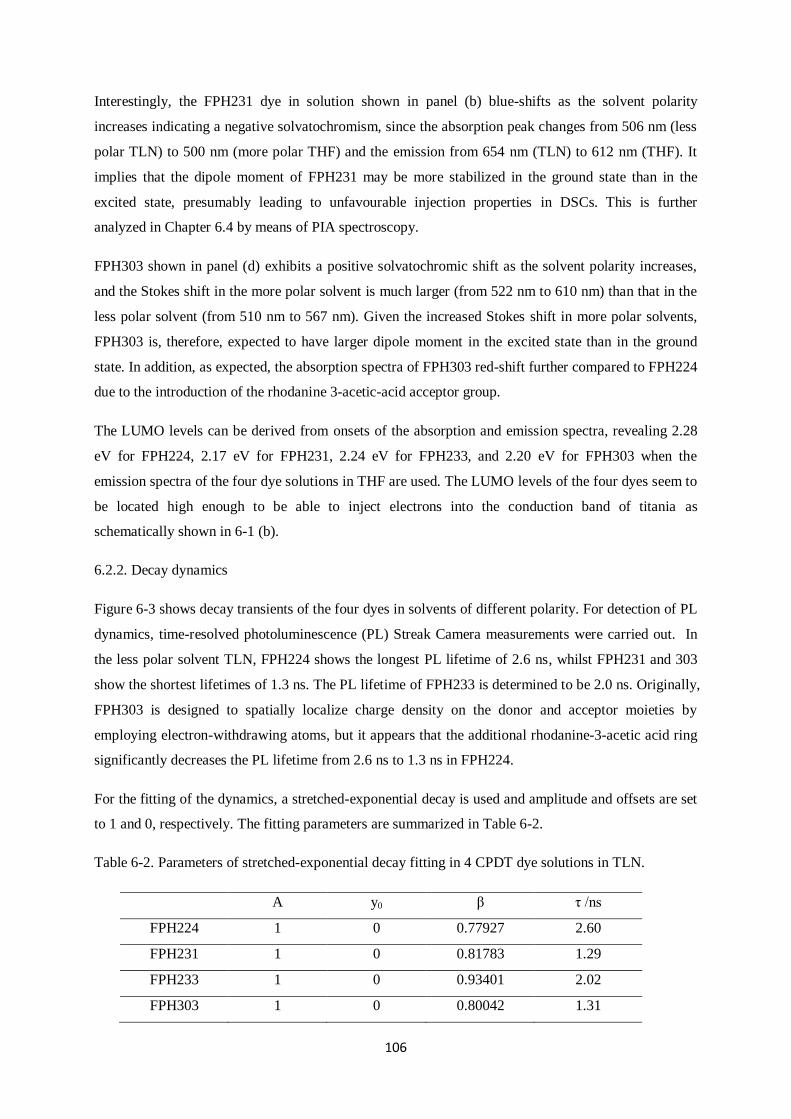
106
Interestingly, the FPH231 dye in solution shown in panel (b) blue-shifts as the solvent polarity
increases indicating a negative solvatochromism, since the absorption peak changes from 506 nm (less
polar TLN) to 500 nm (more polar THF) and the emission from 654 nm (TLN) to 612 nm (THF). It
implies that the dipole moment of FPH231 may be more stabilized in the ground state than in the
excited state, presumably leading to unfavourable injection properties in DSCs. This is further
analyzed in Chapter 6.4 by means of PIA spectroscopy.
FPH303 shown in panel (d) exhibits a positive solvatochromic shift as the solvent polarity increases,
and the Stokes shift in the more polar solvent is much larger (from 522 nm to 610 nm) than that in the
less polar solvent (from 510 nm to 567 nm). Given the increased Stokes shift in more polar solvents,
FPH303 is, therefore, expected to have larger dipole moment in the excited state than in the ground
state. In addition, as expected, the absorption spectra of FPH303 red-shift further compared to FPH224
due to the introduction of the rhodanine 3-acetic-acid acceptor group.
The LUMO levels can be derived from onsets of the absorption and emission spectra, revealing 2.28
eV for FPH224, 2.17 eV for FPH231, 2.24 eV for FPH233, and 2.20 eV for FPH303 when the
emission spectra of the four dye solutions in THF are used. The LUMO levels of the four dyes seem to
be located high enough to be able to inject electrons into the conduction band of titania as
schematically shown in 6-1 (b).
6.2.2. Decay dynamics
Figure 6-3 shows decay transients of the four dyes in solvents of different polarity. For detection of PL
dynamics, time-resolved photoluminescence (PL) Streak Camera measurements were carried out. In
the less polar solvent TLN, FPH224 shows the longest PL lifetime of 2.6 ns, whilst FPH231 and 303
show the shortest lifetimes of 1.3 ns. The PL lifetime of FPH233 is determined to be 2.0 ns. Originally,
FPH303 is designed to spatially localize charge density on the donor and acceptor moieties by
employing electron-withdrawing atoms, but it appears that the additional rhodanine-3-acetic acid ring
significantly decreases the PL lifetime from 2.6 ns to 1.3 ns in FPH224.
For the fitting of the dynamics, a stretched-exponential decay is used and amplitude and offsets are set
to 1 and 0, respectively. The fitting parameters are summarized in Table 6-2.
Table 6-2. Parameters of stretched-exponential decay fitting in 4 CPDT dye solutions in TLN.
A y0 β τ /ns
FPH224 1 0 0.77927 2.60
FPH231 1 0 0.81783 1.29
FPH233 1 0 0.93401 2.02
FPH303 1 0 0.80042 1.31
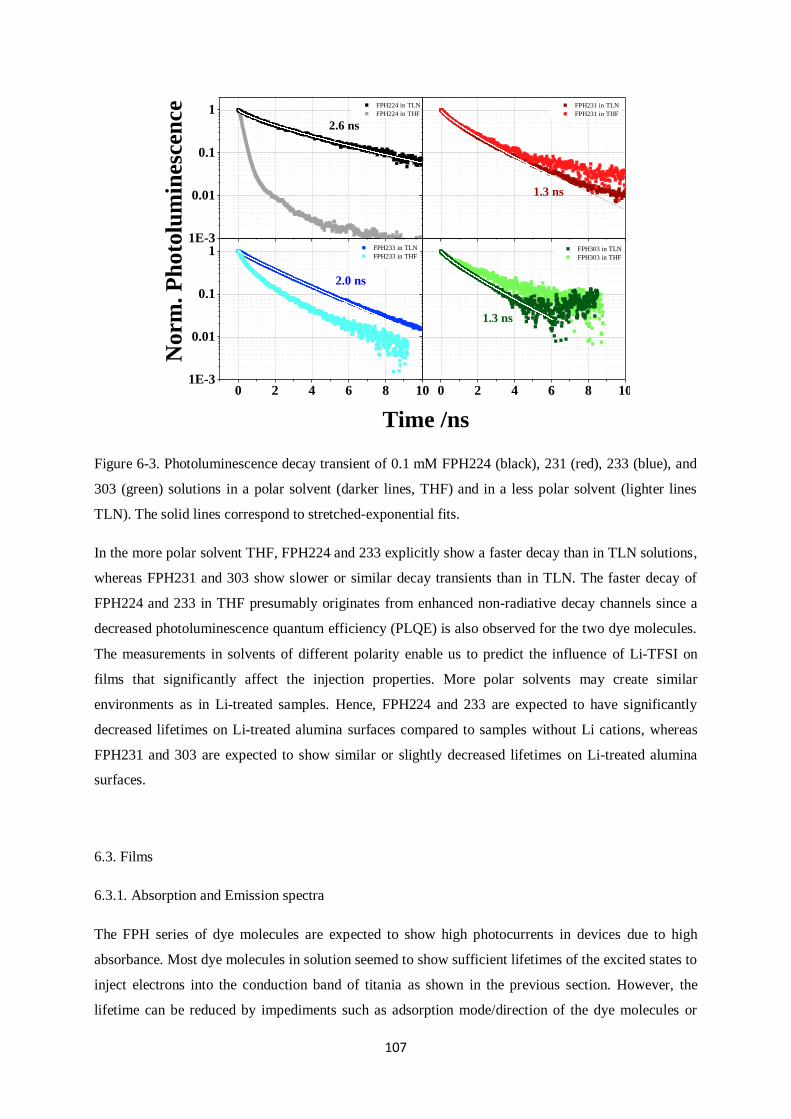
107
1E-3
0.01
0.1
1
0 2 4 6 8 101E-3
0.01
0.1
1
0 2 4 6 8 10
2.6 ns
FPH224 in TLN
FPH224 in THF
1.3 ns
FPH231 in TLN
FPH231 in THF
2.0 ns
FPH233 in TLN
FPH233 in THF
Norm
. P
hoto
lum
ines
cen
ce
Time /ns
1.3 ns
FPH303 in TLN
FPH303 in THF
Figure 6-3. Photoluminescence decay transient of 0.1 mM FPH224 (black), 231 (red), 233 (blue), and
303 (green) solutions in a polar solvent (darker lines, THF) and in a less polar solvent (lighter lines
TLN). The solid lines correspond to stretched-exponential fits.
In the more polar solvent THF, FPH224 and 233 explicitly show a faster decay than in TLN solutions,
whereas FPH231 and 303 show slower or similar decay transients than in TLN. The faster decay of
FPH224 and 233 in THF presumably originates from enhanced non-radiative decay channels since a
decreased photoluminescence quantum efficiency (PLQE) is also observed for the two dye molecules.
The measurements in solvents of different polarity enable us to predict the influence of Li-TFSI on
films that significantly affect the injection properties. More polar solvents may create similar
environments as in Li-treated samples. Hence, FPH224 and 233 are expected to have significantly
decreased lifetimes on Li-treated alumina surfaces compared to samples without Li cations, whereas
FPH231 and 303 are expected to show similar or slightly decreased lifetimes on Li-treated alumina
surfaces.
6.3. Films
6.3.1. Absorption and Emission spectra
The FPH series of dye molecules are expected to show high photocurrents in devices due to high
absorbance. Most dye molecules in solution seemed to show sufficient lifetimes of the excited states to
inject electrons into the conduction band of titania as shown in the previous section. However, the
lifetime can be reduced by impediments such as adsorption mode/direction of the dye molecules or
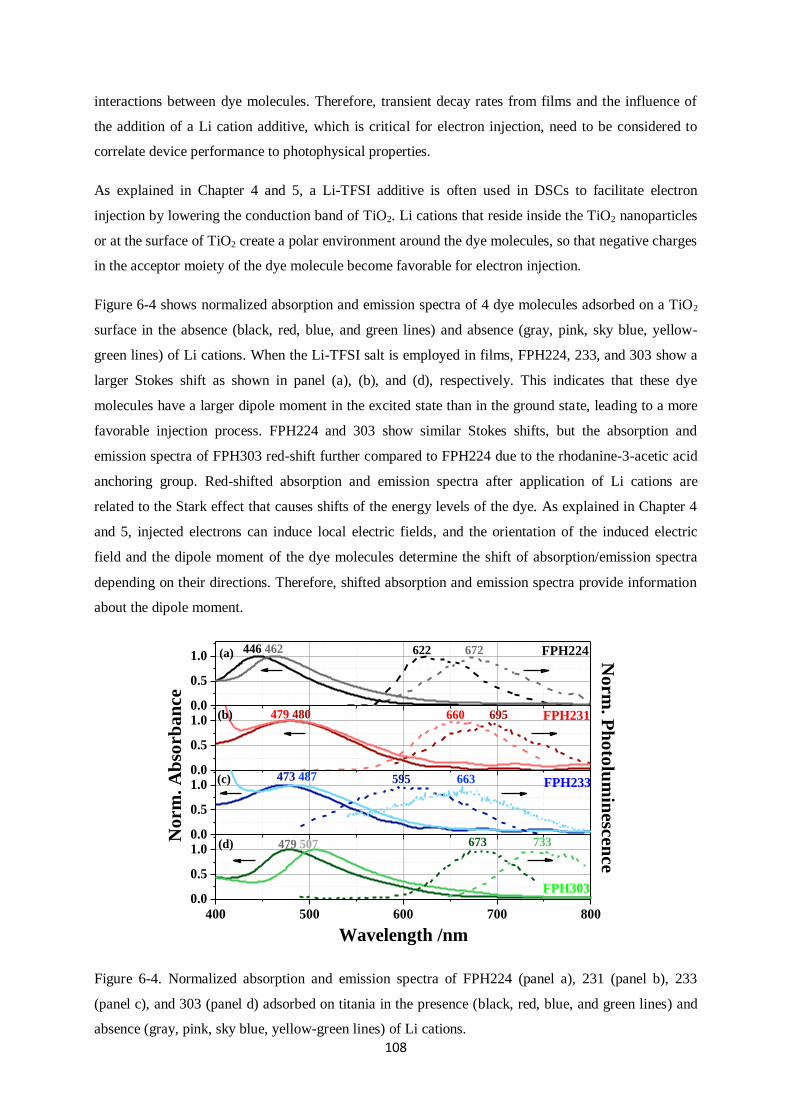
108
interactions between dye molecules. Therefore, transient decay rates from films and the influence of
the addition of a Li cation additive, which is critical for electron injection, need to be considered to
correlate device performance to photophysical properties.
As explained in Chapter 4 and 5, a Li-TFSI additive is often used in DSCs to facilitate electron
injection by lowering the conduction band of TiO2. Li cations that reside inside the TiO2 nanoparticles
or at the surface of TiO2 create a polar environment around the dye molecules, so that negative charges
in the acceptor moiety of the dye molecule become favorable for electron injection.
Figure 6-4 shows normalized absorption and emission spectra of 4 dye molecules adsorbed on a TiO2
surface in the absence (black, red, blue, and green lines) and absence (gray, pink, sky blue, yellow-
green lines) of Li cations. When the Li-TFSI salt is employed in films, FPH224, 233, and 303 show a
larger Stokes shift as shown in panel (a), (b), and (d), respectively. This indicates that these dye
molecules have a larger dipole moment in the excited state than in the ground state, leading to a more
favorable injection process. FPH224 and 303 show similar Stokes shifts, but the absorption and
emission spectra of FPH303 red-shift further compared to FPH224 due to the rhodanine-3-acetic acid
anchoring group. Red-shifted absorption and emission spectra after application of Li cations are
related to the Stark effect that causes shifts of the energy levels of the dye. As explained in Chapter 4
and 5, injected electrons can induce local electric fields, and the orientation of the induced electric
field and the dipole moment of the dye molecules determine the shift of absorption/emission spectra
depending on their directions. Therefore, shifted absorption and emission spectra provide information
about the dipole moment.
0.0
0.5
1.0
0.0
0.5
1.0
0.0
0.5
1.0
400 500 600 700 800
0.0
0.5
1.0
FPH303
FPH233
FPH231
(d)
(c)
(b)
622 672446 462(a) FPH224 No
rm
. Ph
oto
lum
inesc
en
ce
660 695479 480
No
rm
. A
bso
rb
an
ce
473 487 595 663
673 733479 507
Wavelength /nm
Figure 6-4. Normalized absorption and emission spectra of FPH224 (panel a), 231 (panel b), 233
(panel c), and 303 (panel d) adsorbed on titania in the presence (black, red, blue, and green lines) and
absence (gray, pink, sky blue, yellow-green lines) of Li cations.
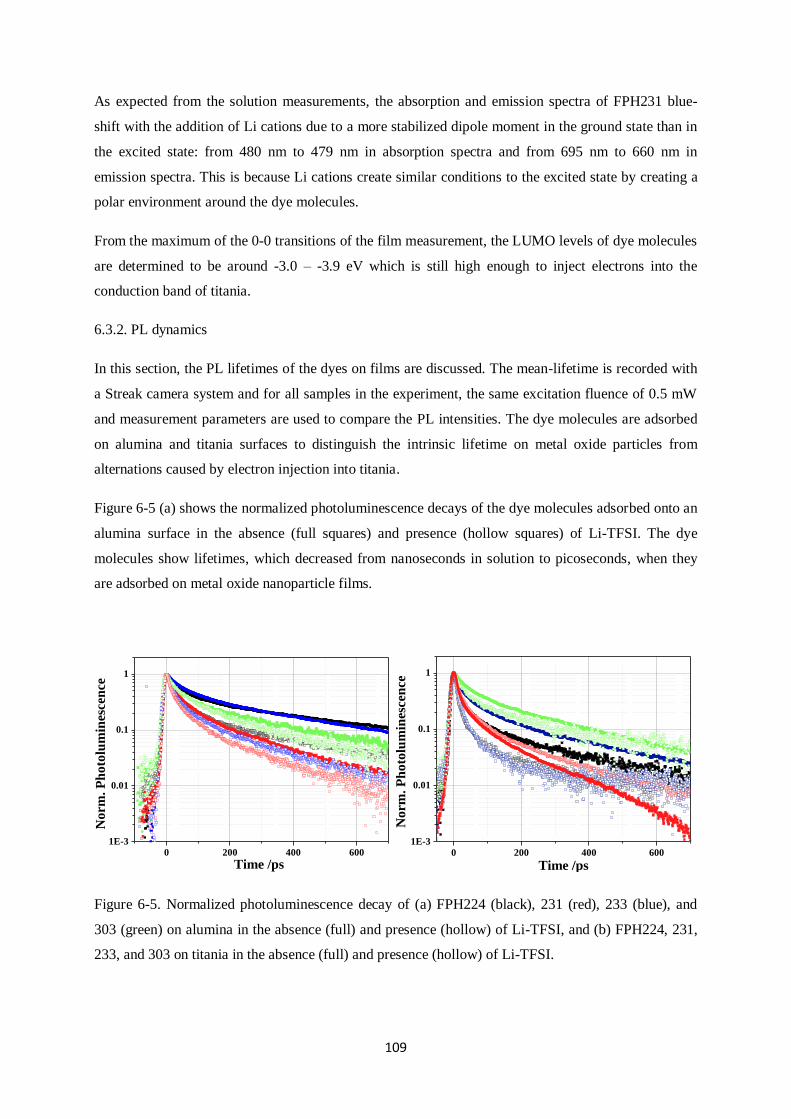
109
As expected from the solution measurements, the absorption and emission spectra of FPH231 blue-
shift with the addition of Li cations due to a more stabilized dipole moment in the ground state than in
the excited state: from 480 nm to 479 nm in absorption spectra and from 695 nm to 660 nm in
emission spectra. This is because Li cations create similar conditions to the excited state by creating a
polar environment around the dye molecules.
From the maximum of the 0-0 transitions of the film measurement, the LUMO levels of dye molecules
are determined to be around -3.0 – -3.9 eV which is still high enough to inject electrons into the
conduction band of titania.
6.3.2. PL dynamics
In this section, the PL lifetimes of the dyes on films are discussed. The mean-lifetime is recorded with
a Streak camera system and for all samples in the experiment, the same excitation fluence of 0.5 mW
and measurement parameters are used to compare the PL intensities. The dye molecules are adsorbed
on alumina and titania surfaces to distinguish the intrinsic lifetime on metal oxide particles from
alternations caused by electron injection into titania.
Figure 6-5 (a) shows the normalized photoluminescence decays of the dye molecules adsorbed onto an
alumina surface in the absence (full squares) and presence (hollow squares) of Li-TFSI. The dye
molecules show lifetimes, which decreased from nanoseconds in solution to picoseconds, when they
are adsorbed on metal oxide nanoparticle films.
0 200 400 600
1E-3
0.01
0.1
1
No
rm. P
ho
tolu
min
esce
nce
Time /ps 0 200 400 600
1E-3
0.01
0.1
1
No
rm
. P
ho
tolu
min
escen
ce
Time /ps
Figure 6-5. Normalized photoluminescence decay of (a) FPH224 (black), 231 (red), 233 (blue), and
303 (green) on alumina in the absence (full) and presence (hollow) of Li-TFSI, and (b) FPH224, 231,
233, and 303 on titania in the absence (full) and presence (hollow) of Li-TFSI.
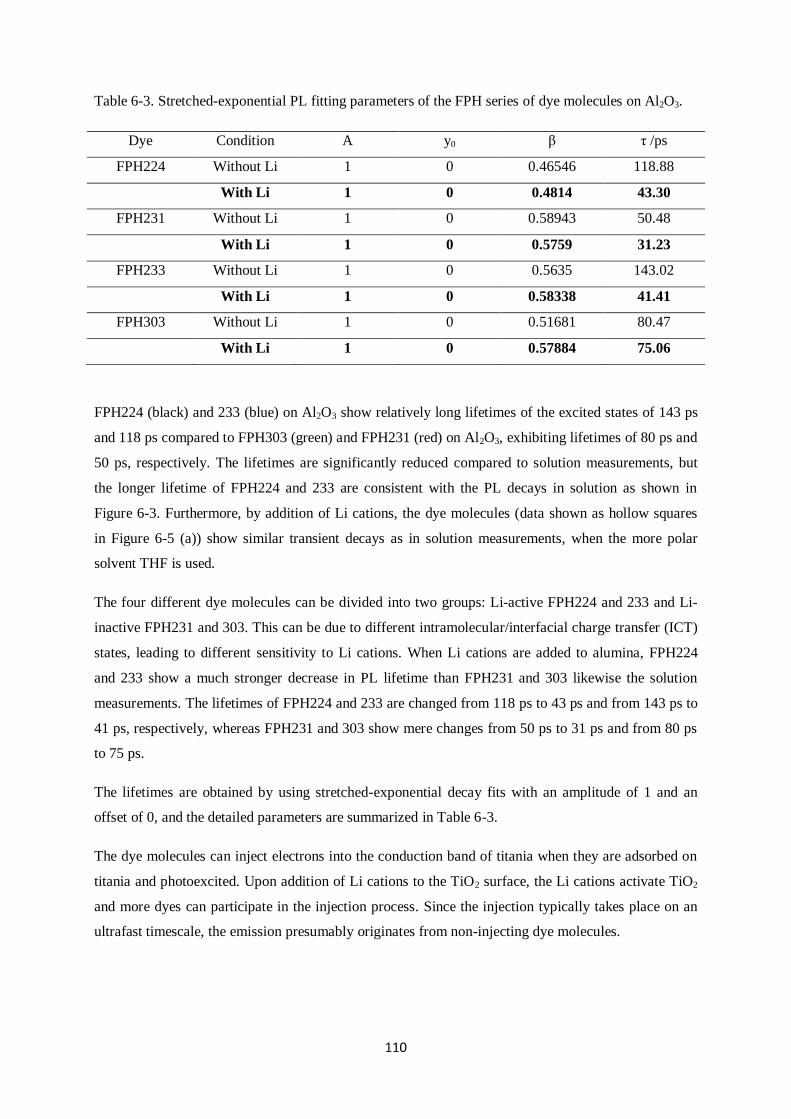
110
Table 6-3. Stretched-exponential PL fitting parameters of the FPH series of dye molecules on Al2O3.
Dye Condition A y0 β τ /ps
FPH224 Without Li 1 0 0.46546 118.88
With Li 1 0 0.4814 43.30
FPH231 Without Li 1 0 0.58943 50.48
With Li 1 0 0.5759 31.23
FPH233 Without Li 1 0 0.5635 143.02
With Li 1 0 0.58338 41.41
FPH303 Without Li 1 0 0.51681 80.47
With Li 1 0 0.57884 75.06
FPH224 (black) and 233 (blue) on Al2O3 show relatively long lifetimes of the excited states of 143 ps
and 118 ps compared to FPH303 (green) and FPH231 (red) on Al2O3, exhibiting lifetimes of 80 ps and
50 ps, respectively. The lifetimes are significantly reduced compared to solution measurements, but
the longer lifetime of FPH224 and 233 are consistent with the PL decays in solution as shown in
Figure 6-3. Furthermore, by addition of Li cations, the dye molecules (data shown as hollow squares
in Figure 6-5 (a)) show similar transient decays as in solution measurements, when the more polar
solvent THF is used.
The four different dye molecules can be divided into two groups: Li-active FPH224 and 233 and Li-
inactive FPH231 and 303. This can be due to different intramolecular/interfacial charge transfer (ICT)
states, leading to different sensitivity to Li cations. When Li cations are added to alumina, FPH224
and 233 show a much stronger decrease in PL lifetime than FPH231 and 303 likewise the solution
measurements. The lifetimes of FPH224 and 233 are changed from 118 ps to 43 ps and from 143 ps to
41 ps, respectively, whereas FPH231 and 303 show mere changes from 50 ps to 31 ps and from 80 ps
to 75 ps.
The lifetimes are obtained by using stretched-exponential decay fits with an amplitude of 1 and an
offset of 0, and the detailed parameters are summarized in Table 6-3.
The dye molecules can inject electrons into the conduction band of titania when they are adsorbed on
titania and photoexcited. Upon addition of Li cations to the TiO2 surface, the Li cations activate TiO2
and more dyes can participate in the injection process. Since the injection typically takes place on an
ultrafast timescale, the emission presumably originates from non-injecting dye molecules.

111
The normalized PL decays of the four dyes adsorbed onto titania in the absence (closed squares) and
presence (open squares) of Li cations are shown in Figure 6-5 (b). Interestingly, FPH224 (black) and
233 (blue) show relatively significant changes in PL lifetimes when a gamma function is used [94, 104]
,
i.e. for FPH224 from 44 ps to 18 ps and for FPH233 from 86 ps to 19 ps, however, FPH231 and 303
hardly show any change in the decay rates after addition of Li cations, i.e. for FPH231 from 35 ps to
42 ps and for FPH303 from 143 ps to 115 ps. Unlike the stretched-exponential fitting, varying
exponents (β) are considered in a gamma function to derive the PL lifetimes of each dye and to
compare the dyes. The lifetimes obtained from the gamma function show a clearer effect of the
addition of Li cations than stretched-exponentials fits. The stretched-exponential fitting parameters
and PL lifetimes are summarized in Table 6-3.
This implies that a large amount of Li cation-active sites is present in FPH224 and 233, whereas
FPH303 exhibits a smaller amount of Li cation-active sites. As another possibility, FPH303 may
already inject electrons on an ultrafast timescale in the absence of Li and thus has only few Li cation-
active sites. If the dye injects electrons on an ultrafast timescale even without Li cations then, the
amplitude should not change; however, small change after the use of Li cations is observed compared
to the sample without Li cations as shown in Figure 6-8. Furthermore, transient absorption spectra of
FPH303 on TiO2 without Li cations are rather similar to those of FPH303 on Al2O3 without Li cations
(that mainly shows the absorption of the exciton) as shown in Figure 6-18 (a and b), indicating that the
injection does not take place in FPH303 on TiO2. Further results will be discussed in chapter 6.5.3. It
is thus more likely that the injection from FPH303 is not favorable, as FPH303 shows a relatively long
lifetime even after Li cation application as shown in Figure 6-5. For FPH231, the lifetime of the
excited state slightly increases after the use of Li cations, which is due to a less stabilized dipole in the
excited state.
Table 6-4. Stretched-exponential fitting parameters of FPH series dye molecules on TiO2.
A y0 β τ τ (gamma F)
FPH224 Without Li 1 0 0.47659 22.13 44.83
With Li 1 0 0.66293 13.91 18.60
FPH231 Without Li 1 0 0.65493 25.92 35.12
With Li 1 0 0.58075 27.09 42.59
FPH233 Without Li 1 0 0.53597 49.05 86.98
With Li 1 0 0.79912 17.44 19.77
FPH303 Without Li 1 0 0.61528 98.41 143.40
With Li 1 0 0.51125 65.92 115.11
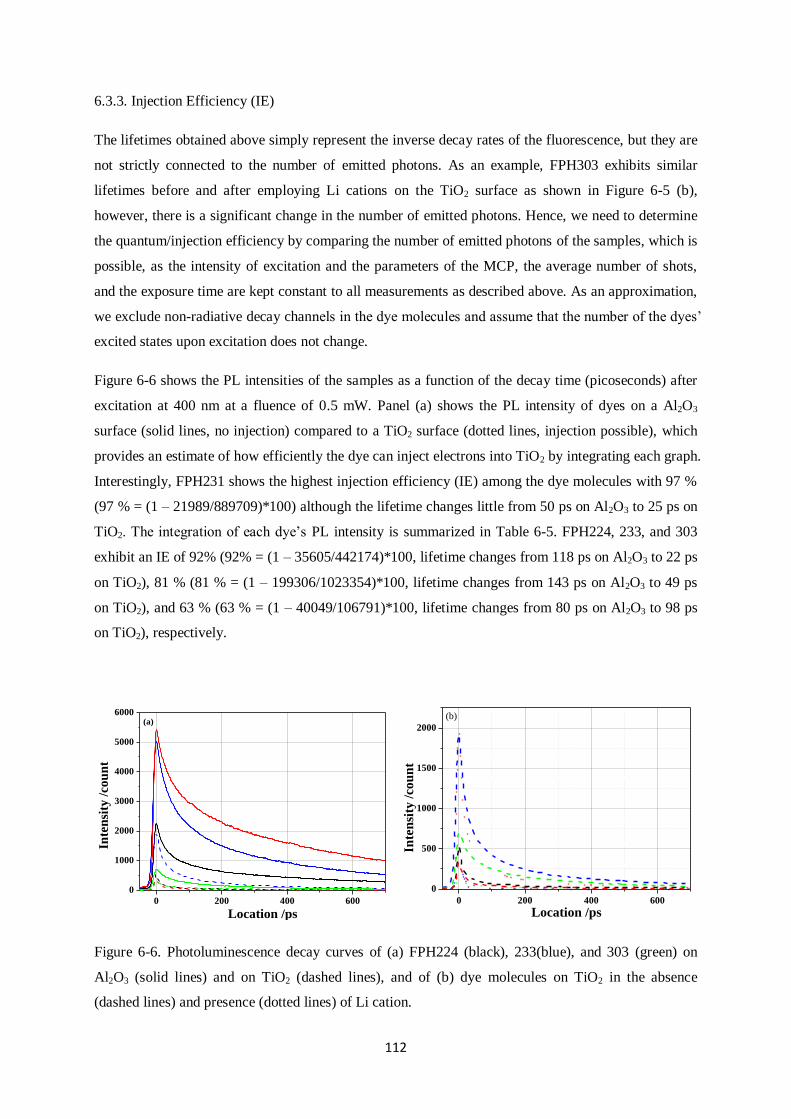
112
6.3.3. Injection Efficiency (IE)
The lifetimes obtained above simply represent the inverse decay rates of the fluorescence, but they are
not strictly connected to the number of emitted photons. As an example, FPH303 exhibits similar
lifetimes before and after employing Li cations on the TiO2 surface as shown in Figure 6-5 (b),
however, there is a significant change in the number of emitted photons. Hence, we need to determine
the quantum/injection efficiency by comparing the number of emitted photons of the samples, which is
possible, as the intensity of excitation and the parameters of the MCP, the average number of shots,
and the exposure time are kept constant to all measurements as described above. As an approximation,
we exclude non-radiative decay channels in the dye molecules and assume that the number of the dyes‟
excited states upon excitation does not change.
Figure 6-6 shows the PL intensities of the samples as a function of the decay time (picoseconds) after
excitation at 400 nm at a fluence of 0.5 mW. Panel (a) shows the PL intensity of dyes on a Al2O3
surface (solid lines, no injection) compared to a TiO2 surface (dotted lines, injection possible), which
provides an estimate of how efficiently the dye can inject electrons into TiO2 by integrating each graph.
Interestingly, FPH231 shows the highest injection efficiency (IE) among the dye molecules with 97 %
(97 % = (1 – 21989/889709)*100) although the lifetime changes little from 50 ps on Al2O3 to 25 ps on
TiO2. The integration of each dye‟s PL intensity is summarized in Table 6-5. FPH224, 233, and 303
exhibit an IE of 92% (92% = (1 – 35605/442174)*100, lifetime changes from 118 ps on Al2O3 to 22 ps
on TiO2), 81 % (81 % = (1 – 199306/1023354)*100, lifetime changes from 143 ps on Al2O3 to 49 ps
on TiO2), and 63 % (63 % = (1 – 40049/106791)*100, lifetime changes from 80 ps on Al2O3 to 98 ps
on TiO2), respectively.
0 200 400 600
0
1000
2000
3000
4000
5000
6000
Inte
nsi
ty /
cou
nt
Location /ps
(a)
0 200 400 600
0
500
1000
1500
2000
Inte
nsi
ty /
cou
nt
Location /ps
(b)
Figure 6-6. Photoluminescence decay curves of (a) FPH224 (black), 233(blue), and 303 (green) on
Al2O3 (solid lines) and on TiO2 (dashed lines), and of (b) dye molecules on TiO2 in the absence
(dashed lines) and presence (dotted lines) of Li cation.

113
Table 6-5. The integrated number of photons emitted from dyes on film surfaces.
PL Intensity FPH224 FPH231 FPH233 FPH303
On Al2O3 442174 889709 1023354 106791
On TiO2 35605 21989 199306 40049
Li treated TiO2 5934 117371 10688 14075
By application of Li cations as shown in panel (b) in Figure 6-6, the dye molecules reveal some
interesting details of the injection process. As pointed out above, we observe PL mainly from the dye
molecules that do not take part in the injection process, therefore, the IEs in Figure 6-6 (b) depend on
the Li cation-active states of the dye molecules. FPH233 shows the highest IE of 95 % (95 % = (1 –
10688/199306)*100), followed by FPH224 with an IE of 84 % (84 % = (1 – 5934/35605)*100)
whereas FPH303 shows a low IE of 65 % (65 % = (1 – 14075/40049)*100). Surprisingly, when the Li
cation additive is used, more photons are emitted in case of FPH231 on TiO2, leading to a reduced
injection efficiency of approximately 11 %. This is due to different Li cation-active states compared to
the other dye molecules, causing unfavorable injection. To simply compare the PL from Li-cation-
treated-TiO2 surfaces with those of Al2O3 surfaces, FPH224 and 233 show injection efficiencies close
to unity (For 224: 98.6 % = (1-5934/442174)*100, For 233: 99 % = (1-10688/1023354)*100)), whilst
FPH231 and 303 show an injection efficiency of 87 % (For FPH231: 87 % = (1-117371/889709)*100,
For FPH303: 87 % = (1-14075/106791)*100). In this sense, FPH224 and 233 are considered to inject
electrons into TiO2 nanoparticles more efficiently and furthermore to possess more Li cation-active
states; however, it seems that some of the states in FPH231 and 303 do not contribute to injection even
after the addition of Li cations. Therefore, the devices using FPH224 and 233 are expected to achieve
higher photocurrents than the devices using FPH231 and 303.
6.4. Device Characteristics and Photoinduced Absorption (PIA) experiments
In this chapter, the device performance is reported and photocurrents of devices are set into relation to
the previously explained changes of the dipole moments and the enhanced injection efficiency (IE)
after application of Li cations. Furthermore, the role of long-lived charges observed by photoinduced
absorption (PIA) spectroscopy is investigated.
6.4.1. J-V curves and EQE
Solid-state dye-sensitized solar cells (DSCs) were fabricated as described in Chapter 3.1.1. Figure 6-7
(a) shows the J-V curves of solid-state DSCs containing FPH224 (black), 231 (red), 233 (blue), 303
(green), and Z907 (purple) measured under solar illumination of AM 1.5 G. For comparison, devices

114
were all fabricated in the same batch. A reference device using the ruthenium complex Z907 exhibits
the best power conversion efficiency of 1.8 % with a short circuit current of 3.31 mA∙cm-2
, an open
circuit voltage of 860 mV, and a high fill factor of 63 %. Among the CPDT dyes, FPH233 shows the
best efficiency of 1.67 % followed by FPH224 with 1.56 %, and FPH233 and 224 exhibit higher short
circuit currents than the photocurrent in the reference device, of 3.93 and 3.75 mA/cm2, respectively.
Good injection properties of FPH224 and 233 are expected due to enhanced ICT properties, long
excited state lifetimes, and higher IE than FPH231 and 303 as reported in the previous chapter. The
photophysical properties of FPH231 such as the negative solvatochromism, which is unfavorable for
electron injection, appear to play a critical role for the photocurrents of devices. Furthermore, FPH303
showing a large fraction of Li cation-inactive sites in turn shows a reduced short circuit current in
devices. The detailed photovoltaic parameters of the devices obtained from their J-V curves are
summarized in Table 6-6.
Figure 6-7 (b) shows the external quantum efficiencies of 4 different devices and in the inset the
internal quantum efficiencies are shown. Both FPH224 and 233 reach about 30% EQE and IQE,
whereas FPH231 and 303 reach only 10 - 13 % EQE and 11 - 17% IQE, respectively. These numbers
are comparable to the ratio of the photocurrents measured in the devices and the maximum obtainable
photocurrent calculated from the absorption of the sensitized films assuming 100% IQE.
The maximum obtainable short circuit currents are 12.6 mA/cm2 for FPH224, 12.2 mA/cm
2 for
FPH231, 13.5 mA/cm2 for FPH233, and 14.8 mA/cm
2 for FPH303 when the internal quantum
efficiency is considered to be unity. However, only 30%, 20%, 29%, and 10% of the expected short
circuit currents are measured in devices with FPH224, 231, 233, and 303, respectively. Likely reasons
for this reduction are loss channels such as incomplete pore filling and recombination between injected
electrons and oxidized dye/hole conductor molecules in the device.
0.0 0.2 0.4 0.6 0.8
-4
-3
-2
-1
0
1
2
Cu
rren
t D
ensi
ty /
mA
/cm
2
Voltage /V
FPH224
FPH231
FPH233
FPH303
Z907
(a)
400 500 600 700 800
0
5
10
15
20
25
30
35
400 500 600 7000
10
20
30
EQ
E /
%
Wavelength /nm
(b)
IQE
/%
Wavelength /nm
Figure 6-7. (a) J-V curves of solid-state DSC using FPH224 (black), 231 (red), 233 (blue), 303 (green),
and Z907 (purple) measured under 100 mWcm-2
AM 1.5 G solar intensity and (b) external quantum
efficiency of each device.
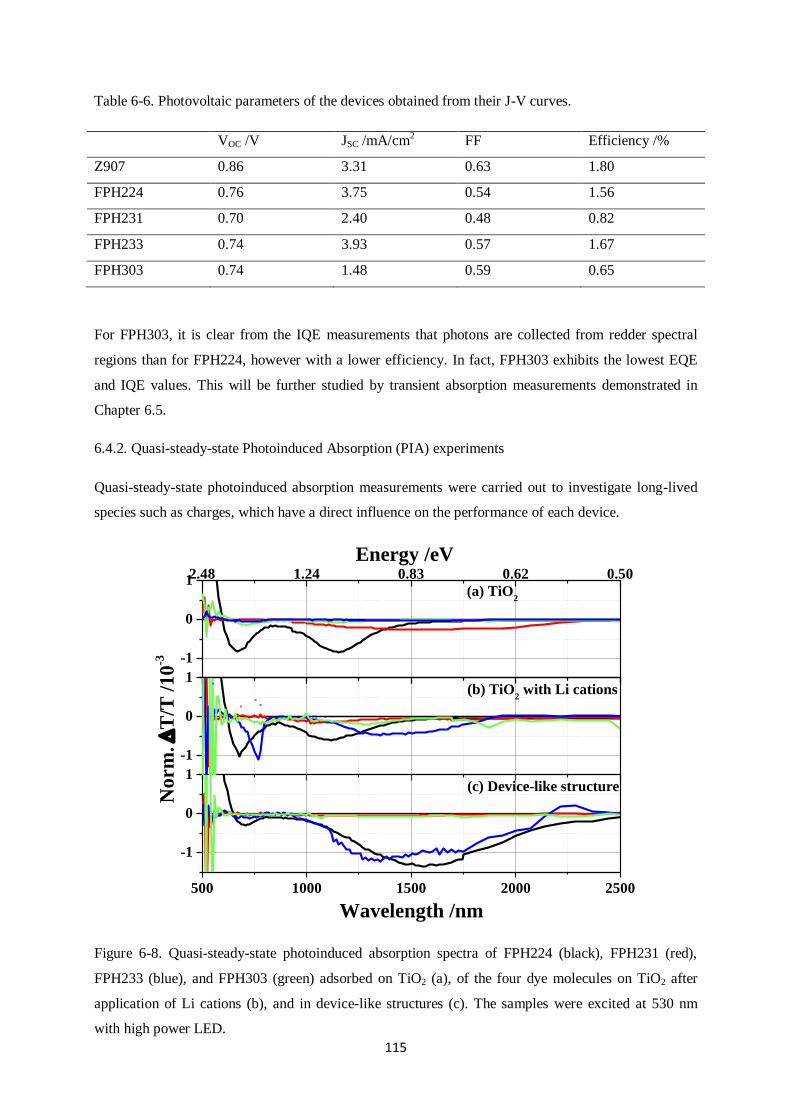
115
Table 6-6. Photovoltaic parameters of the devices obtained from their J-V curves.
VOC /V JSC /mA/cm2 FF Efficiency /%
Z907 0.86 3.31 0.63 1.80
FPH224 0.76 3.75 0.54 1.56
FPH231 0.70 2.40 0.48 0.82
FPH233 0.74 3.93 0.57 1.67
FPH303 0.74 1.48 0.59 0.65
For FPH303, it is clear from the IQE measurements that photons are collected from redder spectral
regions than for FPH224, however with a lower efficiency. In fact, FPH303 exhibits the lowest EQE
and IQE values. This will be further studied by transient absorption measurements demonstrated in
Chapter 6.5.
6.4.2. Quasi-steady-state Photoinduced Absorption (PIA) experiments
Quasi-steady-state photoinduced absorption measurements were carried out to investigate long-lived
species such as charges, which have a direct influence on the performance of each device.
-1
0
12.48 1.24 0.83 0.62 0.50
-1
0
1
500 1000 1500 2000 2500
-1
0
1(c) Device-like structure
(b) TiO2 with Li cations
(a) TiO2
Norm
.
T/T
/1
0-3
Energy /eV
Wavelength /nm
Figure 6-8. Quasi-steady-state photoinduced absorption spectra of FPH224 (black), FPH231 (red),
FPH233 (blue), and FPH303 (green) adsorbed on TiO2 (a), of the four dye molecules on TiO2 after
application of Li cations (b), and in device-like structures (c). The samples were excited at 530 nm
with high power LED.
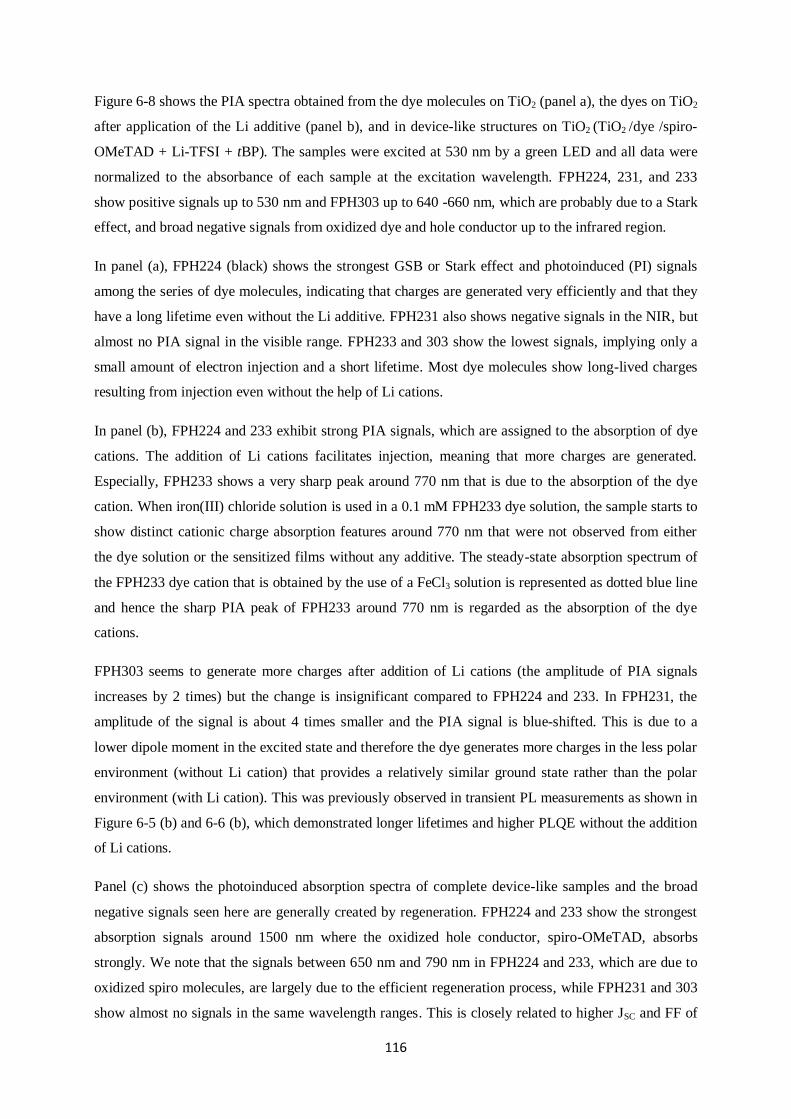
116
Figure 6-8 shows the PIA spectra obtained from the dye molecules on TiO2 (panel a), the dyes on TiO2
after application of the Li additive (panel b), and in device-like structures on TiO2 (TiO2 /dye /spiro-
OMeTAD + Li-TFSI + tBP). The samples were excited at 530 nm by a green LED and all data were
normalized to the absorbance of each sample at the excitation wavelength. FPH224, 231, and 233
show positive signals up to 530 nm and FPH303 up to 640 -660 nm, which are probably due to a Stark
effect, and broad negative signals from oxidized dye and hole conductor up to the infrared region.
In panel (a), FPH224 (black) shows the strongest GSB or Stark effect and photoinduced (PI) signals
among the series of dye molecules, indicating that charges are generated very efficiently and that they
have a long lifetime even without the Li additive. FPH231 also shows negative signals in the NIR, but
almost no PIA signal in the visible range. FPH233 and 303 show the lowest signals, implying only a
small amount of electron injection and a short lifetime. Most dye molecules show long-lived charges
resulting from injection even without the help of Li cations.
In panel (b), FPH224 and 233 exhibit strong PIA signals, which are assigned to the absorption of dye
cations. The addition of Li cations facilitates injection, meaning that more charges are generated.
Especially, FPH233 shows a very sharp peak around 770 nm that is due to the absorption of the dye
cation. When iron(III) chloride solution is used in a 0.1 mM FPH233 dye solution, the sample starts to
show distinct cationic charge absorption features around 770 nm that were not observed from either
the dye solution or the sensitized films without any additive. The steady-state absorption spectrum of
the FPH233 dye cation that is obtained by the use of a FeCl3 solution is represented as dotted blue line
and hence the sharp PIA peak of FPH233 around 770 nm is regarded as the absorption of the dye
cations.
FPH303 seems to generate more charges after addition of Li cations (the amplitude of PIA signals
increases by 2 times) but the change is insignificant compared to FPH224 and 233. In FPH231, the
amplitude of the signal is about 4 times smaller and the PIA signal is blue-shifted. This is due to a
lower dipole moment in the excited state and therefore the dye generates more charges in the less polar
environment (without Li cation) that provides a relatively similar ground state rather than the polar
environment (with Li cation). This was previously observed in transient PL measurements as shown in
Figure 6-5 (b) and 6-6 (b), which demonstrated longer lifetimes and higher PLQE without the addition
of Li cations.
Panel (c) shows the photoinduced absorption spectra of complete device-like samples and the broad
negative signals seen here are generally created by regeneration. FPH224 and 233 show the strongest
absorption signals around 1500 nm where the oxidized hole conductor, spiro-OMeTAD, absorbs
strongly. We note that the signals between 650 nm and 790 nm in FPH224 and 233, which are due to
oxidized spiro molecules, are largely due to the efficient regeneration process, while FPH231 and 303
show almost no signals in the same wavelength ranges. This is closely related to higher JSC and FF of

117
devices using FPH224 and 233 than devices using FPH231 and 303. Furthermore, in the near infrared
region, FPH231 and 303 show almost no absorption signal of the oxidized spiro-OMeTAD in good
agreement with the poor efficiency of devices using these dyes. However, we note that the signal
heights in PIA experiments cannot be used as an absolute comparison of the amount of charge
generation, since PIA signals are always a combination of the number of species and their lifetimes.
We therefore also performed transient absorption experiments on the samples.
6.5. Transient Absorption Spectroscopy
From the PIA measurements presented above, we could detect long-lived charges on a micro- to milli-
second timescale which already provided a qualitative assessment explaining the difference in power
conversion efficiency of the four different dye molecules. However, getting information about the
injection, charge generation, and recombination processes, taking place on a picosecond to nanosecond
timescale, is not possible from PIA measurements. In this section, we present further reasons for the
difference in device efficiency by using transient absorption spectroscopy (TAS).
6.5.1. FPH224
Figure 6-9 compares the time-resolved absorption spectra of FPH224 with different additives in the
time range from 3 ps to 3 ns. In panel (a), the transient pump-probe spectra of FPH224 adsorbed on
TiO2 show two distinct features: positive TA signals up to 585 nm and negative TA signals extending
to the near-infrared wavelength range. The positive and negative signals are assigned to ground state
bleach (GSB) and photoinduced absorption (PIA) of excitons and dye cations. The long-lived negative
PIA around 900 nm is not influenced by either the Stark effect or the PL spectrum; therefore, this
wavelength region is assigned solely to dye cation absorption. Furthermore, these long-lived signals in
the visible and NIR are not observed from FPH224 adsorbed on Al2O3, where we can observe only
excitons including intra, inter, and interfacial charge transfer states. Therefore, the absorption of
excitons and dye cations are observed in between 650-700 nm and between 800-1000 nm, respectively,
and detection of long-lived dye cations implies that FPH224 is able to inject electrons without the help
of Li additives.
In panel (b), the transient absorption spectra of FPH224 after addition of Li cations are shown. They
show clear evidence of long-lived charge generation. The amplitude of the charge absorption signal is
stronger and most of the signal between 800-1000 and between 1150-1200 nm remains even after 3 ns.
This is explained by enhanced absorption resulting from increased charge generation and decreased
back electron transfer due to fast injection by the aid of Li cations. However, the spectrum at later
times in panel (b) reflects the existence of dye cations as well as the decay of electrons in TiO2
nanoparticles because the strong peak between 650 – 750 nm looks still similar to the transient

118
absorption spectrum in panel (a). These peaks red-shift due to a Stark effect that interferes with the
ground state bleach of the dye molecules after insertion of Li cations.
600 700 800 900 1000 1100 1200 1300 1400 1500
-5
0
-5
0
-2
-1
0
1
(c) Device-like structure
(b) TiO2 with Li cations
(a) TiO2
-5
0
T
/T /
10
-3
-2
-1
0
1
No
rm
. P
L
Wavelength /nm
Figure 6-9. Short delay (ps-ns) broadband TA spectra of FPH224 on TiO2 (a), of FPH224 TiO2 after
application of Li cations (b), and of FPH224 on TiO2 with Li-TFSI/tBP/spiro-OMeTAD (complete
device structure) at delay times of 3 ps (red), 30 ps (orange), 300 ps (green), and 3 ns (purple). The
pump fluence at 520 nm is 5.5 μJ cm-2 for the visible and 7.0 μJ cm
-2 for the near infrared
measurements. The two blue lines represent the PL spectra of each sample.
The complete device-like structure shown in panel (c) shows four interesting features: blue-shifted
PIA spectra in the visible, constantly decreasing signals around 900 nm, a clear isosbestic point at
1350 nm, and increasing signals beyond 1350 nm. First, the blue-shifted PIA in the visible range is
caused by an interaction of the local electric field with the dipole moment of the excited state. In panel
(b), the direction of the dipole moment in the excited state is the same as the local electric field
induced by the Li cations, leading to lower energy levels of the dye. However, a large electric field
pointing towards the TiO2 surface is created when spiro-OMeTAD is added, resulting in blue-shifted
PIA spectra compared to the spectra in panel (b). Secondly, the signal around 900 nm where the
absorption of dye cations is expected decays constantly. Hence, efficient regeneration seems to be
active due to the hole conductor, namely spiro-OMeTAD, reducing the dye cations absorption. Thirdly,
an isosbestic point at 1350 nm provides clear evidence of hole transfer from the cationic dye
molecules to spiro-OMeTAD. Last, the increasing signal beyond 1350 nm is mainly caused by the dye
regeneration that continues even after 3 ns. For comparison of the absorption spectra of the oxidized
spiro, see Chapter 4.6. Therefore, the large photocurrent of the FPH224 device appears to be due to an

119
efficient regeneration process and the creation of long-lived charges. For determining the kinetics, the
wavelength regions of the exciton, dye cation, and oxidized spiro signals are selected as 650 – 700 nm,
870 – 920 nm, and 1450 – 1500 nm, respectively.
In the short-delay TA spectra, most signals are long-lived and hardly decay on the first 3 ns. In order
to observe the kinetics of charges, long time delay TA measurements were carried out that detect
photophyscial events from 1 ns – 0.1 ms. Figure 6-10 compares the long delay (ns – μs) broadband
transient TA spectra of FPH224 on TiO2 (panel a), of FPH224 on TiO2 with the Li-TFSI additive
(panel b), and of FPH224 device-like structures (panel c). Interestingly, all panels in Figure 6-10 show
isosbestic points in the visible range where probably only two TA features, GSB and PIA of the dye
cations, are observed with the same molar absorptivity indicating that excitons are only observed in
short-time delay TA measurements.
In panel (a), the TA spectrum after 1ns looks similar to that at the later time in the short-delay TA
measurement shown in Figure 6-9 (a). Most of the observed broad, negative PIA signals in the visible
and NIR decay in 1 – 2 μs, indicating that the charges recombine with a moderate rate due to
presumably back electron transfer from TiO2 to dye cations.
-5
0
5
-5
0
5
600 700 800 900 1000 1100 1200 1300 1400 1500
-5
0
5(c) Device-like structure
(b) TiO2 with Li cations
(a) TiO2
T
/T /
10
-3
Wavelength /nm
Figure 6-10. Long delay (ns – μs) broadband transient absorption spectra of (a) FPH224 on TiO2, and
(b) FPH224 on TiO2 after addition of Li-TFSI, and (c) FPH224 device-like structure in the visible and
the NIR spectral region at delay times of 1 ns (red), 100 ns (orange), 10 μs (green), and 100 μs
(purple). The samples were excited at 532 nm with a pump fluence of 7.2 μJ cm-2
for the visible and
8.0 μJ cm-2
for the NIR measurements.
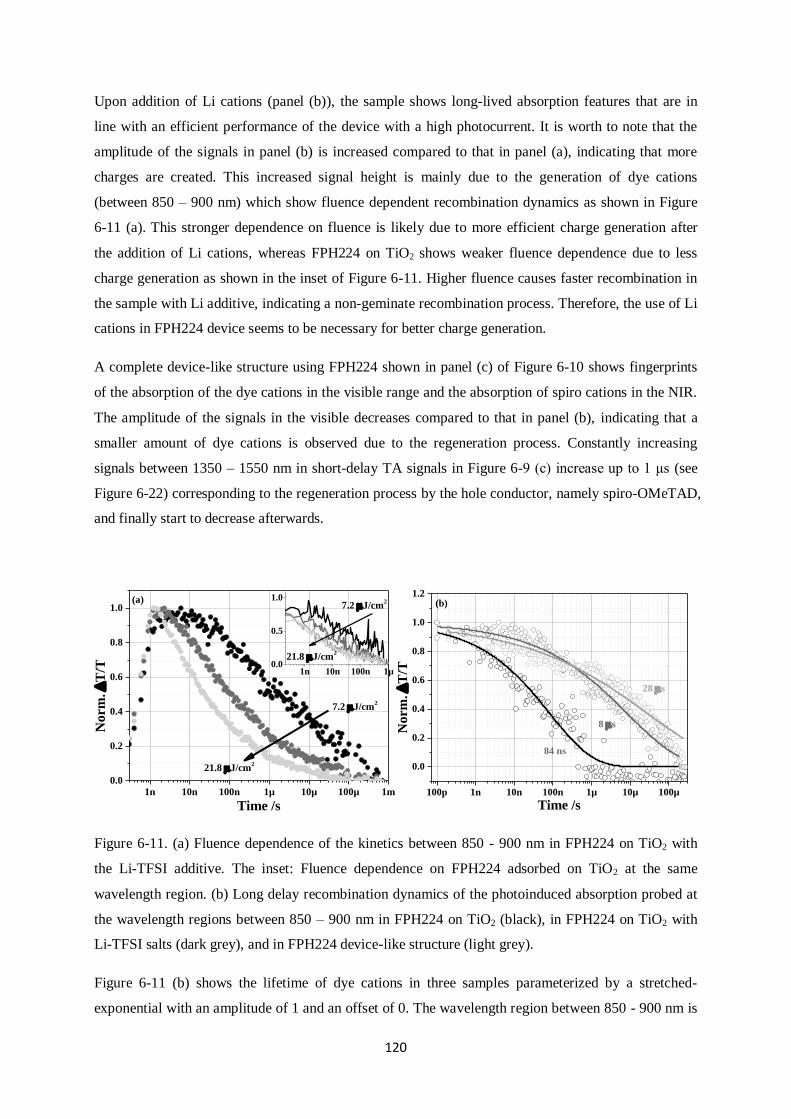
120
Upon addition of Li cations (panel (b)), the sample shows long-lived absorption features that are in
line with an efficient performance of the device with a high photocurrent. It is worth to note that the
amplitude of the signals in panel (b) is increased compared to that in panel (a), indicating that more
charges are created. This increased signal height is mainly due to the generation of dye cations
(between 850 – 900 nm) which show fluence dependent recombination dynamics as shown in Figure
6-11 (a). This stronger dependence on fluence is likely due to more efficient charge generation after
the addition of Li cations, whereas FPH224 on TiO2 shows weaker fluence dependence due to less
charge generation as shown in the inset of Figure 6-11. Higher fluence causes faster recombination in
the sample with Li additive, indicating a non-geminate recombination process. Therefore, the use of Li
cations in FPH224 device seems to be necessary for better charge generation.
A complete device-like structure using FPH224 shown in panel (c) of Figure 6-10 shows fingerprints
of the absorption of the dye cations in the visible range and the absorption of spiro cations in the NIR.
The amplitude of the signals in the visible decreases compared to that in panel (b), indicating that a
smaller amount of dye cations is observed due to the regeneration process. Constantly increasing
signals between 1350 – 1550 nm in short-delay TA signals in Figure 6-9 (c) increase up to 1 μs (see
Figure 6-22) corresponding to the regeneration process by the hole conductor, namely spiro-OMeTAD,
and finally start to decrease afterwards.
1n 10n 100n 1µ 10µ 100µ 1m
0.0
0.2
0.4
0.6
0.8
1.0
21.8 J/cm2
7.2 J/cm2
No
rm
.
T/T
Time /s
7.2 J/cm2
21.8 J/cm2
(a)
1n 10n 100n 1µ0.0
0.5
1.0
100p 1n 10n 100n 1µ 10µ 100µ
0.0
0.2
0.4
0.6
0.8
1.0
1.2
84 ns
28 s
Norm
.
T/T
Time /s
8 s
(b)
Figure 6-11. (a) Fluence dependence of the kinetics between 850 - 900 nm in FPH224 on TiO2 with
the Li-TFSI additive. The inset: Fluence dependence on FPH224 adsorbed on TiO2 at the same
wavelength region. (b) Long delay recombination dynamics of the photoinduced absorption probed at
the wavelength regions between 850 – 900 nm in FPH224 on TiO2 (black), in FPH224 on TiO2 with
Li-TFSI salts (dark grey), and in FPH224 device-like structure (light grey).
Figure 6-11 (b) shows the lifetime of dye cations in three samples parameterized by a stretched-
exponential with an amplitude of 1 and an offset of 0. The wavelength region between 850 - 900 nm is

121
selected to track the kinetics of dye cations in order to exclude the possibility of interference caused by
the Stark effect. FPH224 on TiO2 shows a carrier lifetime of 84 ns, whereas the addition of Li-TFSI
increases the lifetime up to 8 μs. Therefore, the use of Li cations helps to facilitate injection as well as
to suppress a recombination channel. Interestingly, the dynamics of dye cations in the complete
device-like sample shows a faster decrease of 200 ns than that in Li treated samples. This is due to an
efficient regeneration process, but the dye cations still seem to remain until later times, showing a
lifetime of 28 μs.
6.5.2. FPH233
As shown in previous sections, FPH233 achieved the highest power conversion efficiency in devices
using the FPH series of dye molecules owing to presumably a significant change in the dipole moment,
high injection efficiency, and long-lived charges.
Figure 6-12 compares the visible and NIR pump-probe spectra between 3 ps and 3 ns of FPH233
adsorbed on TiO2 with different additives, and shows the PL spectra. Panel (a) shows the TA spectra
of FPH233 adsorbed on TiO2 without any additive. The GSB signal extends to 600 nm and the broad
negative PIA signals extend to the NIR. Most signals decay within 3 ns in the visible and NIR spectral
range and there is no clear evidence that injection takes place in this sample. The reason can be found
from the spectral shape and the fluence dependent measurements. When the spectral shape of panel (a)
is compared to that of FPH233 on Al2O3 (panel b) and FPH233 on TiO2 with Li cations (panel c), it
appears more like the spectral shape of FPH233 on Al2O3 showing mainly exciton absorption. Hence,
FPH233 on TiO2 seems to show the absorption of excitons, rather than the absorption of dye cations.
The fluence measurements that can detect the existence of long-lived species show no fluence
dependence. This will be further revealed in the inset of Figure 6-14.
Upon addition of Li cations as shown in panel (c), the TA spectra of FPH233 show two pronounced
absorption features: a strong absorption around 780 nm and an increasing absorption peak in the NIR.
These two features are assigned to the generation of dye cations by electron injection with the aid of Li
cations. This was confirmed by quasi-steady-state PIA measurements on the same sample that showed
a similar PIA spectrum as the TAS at 3 ps. Therefore, the injection seems to take place on an ultrafast
timescale. Hence, exciton-induced absorption is likely absent due to fast injection in that the spectral
shape of panel (c) looks quite different from the spectra in panel (a) and (b). Interestingly, the signals
are fairly long-lived even beyond 3 - 4 ns, which supports a favorable injection process in FPH233
with the use of Li cations as is expected from the transient PL measurements, showing a big change in
lifetimes upon the addition of Li cations. In order to compare the kinetics of dye cations in different
samples the signals in the wavelength region between 850 - 900 nm are chosen where the signals are
not affected by the Stark effect in the visible range. The spectral range of the dye cation in the NIR is
deliberately not selected because it is very similar to the absorption spectra of spiro-cations.

122
The early time absorption feature of the dye cations peaking at 780 nm in a complete device-like
sample is very similar to that in panel (c), but disappears as the delay time increases due to efficient
regeneration by the hole conductor, as shown in panel (d). Strong absorption signals constantly
increasing up to 3 - 4 ns in the NIR are considered to be due to the oxidized hole conductor, created by
hole transfer, rather than the absorption of the dye cation. Unlike FPH224, a clear isosbestic point is
not observed because the NIR absorption of dye cations is fairly similar to that of spiro cations in the
NIR. However, the amplitude of the late signal (purple, 3 ns) from the visible (dye cation) and NIR
(hole conductor) supports the effective hole transfer in the device using FPH233.
It is worth to note the changes in amplitude of the absorption spectra of the dye cations in Figure 6-12.
The amplitude of the absorption spectra of the dye cations increases to 2.26 at 775 nm in panel (c)
from 1.18 at 720 nm in panel (a) and decreases to 1.79 at 775 nm due to the regeneration of dye
cations in panel (d). Changes in the amplitude can point to charge generation by Li-TFSI and to
regeneration by a hole conductor. The constantly increasing signal of FPH233 in the NIR in the short-
time delay TA measurement will be further investigated in the long-time delay TA measurement to
determine the lifetime of the spiro/dye cations.
-10
0
10
600 700 800 900 1000 1100 1200 1300 1400 1500
-5
0
5
-1
0
1
(d) Device-like sturcture
(c) TiO2 with Li cations
(b) Al2O
3
T
/T /
10
-3
(a) TiO2
-1
0
1
Norm
. P
LN
orm
. P
L
-4-2024
-1
0
1
Wavelength /nm
Figure 6-12. TA spectra on the femto- to nano-second timescale and PL spectra of FPH233 on TiO2
(a), of FPH233 on Al2O3 (b), of FPH233 on TiO2 after addition of Li cations (c), and of a FPH233
device-like sample (d) at delay time of 3 ps (red), 30 ps (orange), 300 ps (green), and 3000 ps (purple).
The pump fluence at 510 nm is 5.5 μJ cm-2 in the visible and 7.0 μJ cm
-2 in the NIR.

123
-1
0
1
-20
-10
0
600 700 800 900 1000 1100 1200 1300 1400 1500
-5
0
5
(c) Device-like structure
(b) TiO2 with Li cations
(a) TiO2
T
/T /
10
-3
Wavelength /nm
ID23 with spiro on TiO2300 nJ -5.000E-7 to -5.000E-8
ID23 with spiro on TiO2300 nJ 3.000E-9 to 4.000E-9
ID23 with spiro on TiO2300 nJ 1.000E-8 to 2.000E-8
ID23 with spiro on TiO2300 nJ 1.000E-7 to 2.000E-7
ID23 with spiro on TiO2300 nJ 1.000E-6 to 2.000E-6
ID23 with spiro on TiO2300 nJ 1.000E-5 to 2.000E-5
ID23 with spiro on TiO2300 nJ 1.000E-4 to 2.000E-4
ID23 with spiro on TiO2300 nJ 7.000E-4 to 8.000E-4
Figure 6-13. Long delay (ns – μs) broadband transient absorption spectra of (a) FPH233 on TiO2, and
(b) FPH233 on TiO2 after addition of Li-TFSI, and (c) FPH233 device-like structure in the visible and
the NIR spectral region at delay times of 1 ns (red), 100 ns (orange), 10 μs (green), and 100 μs
(purple). The samples were excited at 532 nm with a pump fluence of 7.2 μJ cm-2
for the visible and
8.0 μJ cm-2
for the NIR measurements.
Figure 6-13 shows long time delay TA measurements of the same samples that enable us to detect
long-lived species like dye cations and spiro-cations. All three spectra show clear isosbestic points in
the visible due to existence of only two species, namely the GSB and PIA of the charges.
FPH233 on TiO2 shown in panel (a) demonstrates very weak transient absorption spectra that are
assigned to mostly PIA signals of excitons. As stated above, FPH233 appears not to inject electrons
into the conduction band of TiO2 without any additive which is supported by fluence dependent
measurements. As shown in the inset of Figure 6-14 (a), the dynamics of dye cations are tracked
between 850 – 900 nm, where the absorption of dye cations is mainly observed. The dynamics are
independent of pump fluence implying that no free charges are generated.
By the addition of Li cations as shown in Figure 6-13 (b), the amplitude of the PIA signal increases
especially in the NIR due to the large amount of free charge carriers that are generated after the
addition of Li cations. The generation of dye cations is supported by fluence dependent measurements
as shown in Figure 6-14 (a) showing a non-geminate recombination process. Strong, sharp peaks
between 750 – 800 nm that represent the absorption spectra of the dye cations remain up to 0.1 - 0.2
ms, and most signals are fairly long-lived. The kinetics of the dye cations in the NIR start to decrease
from 10 ps onwards in the short-time delay measurement and constantly decrease with big changes in
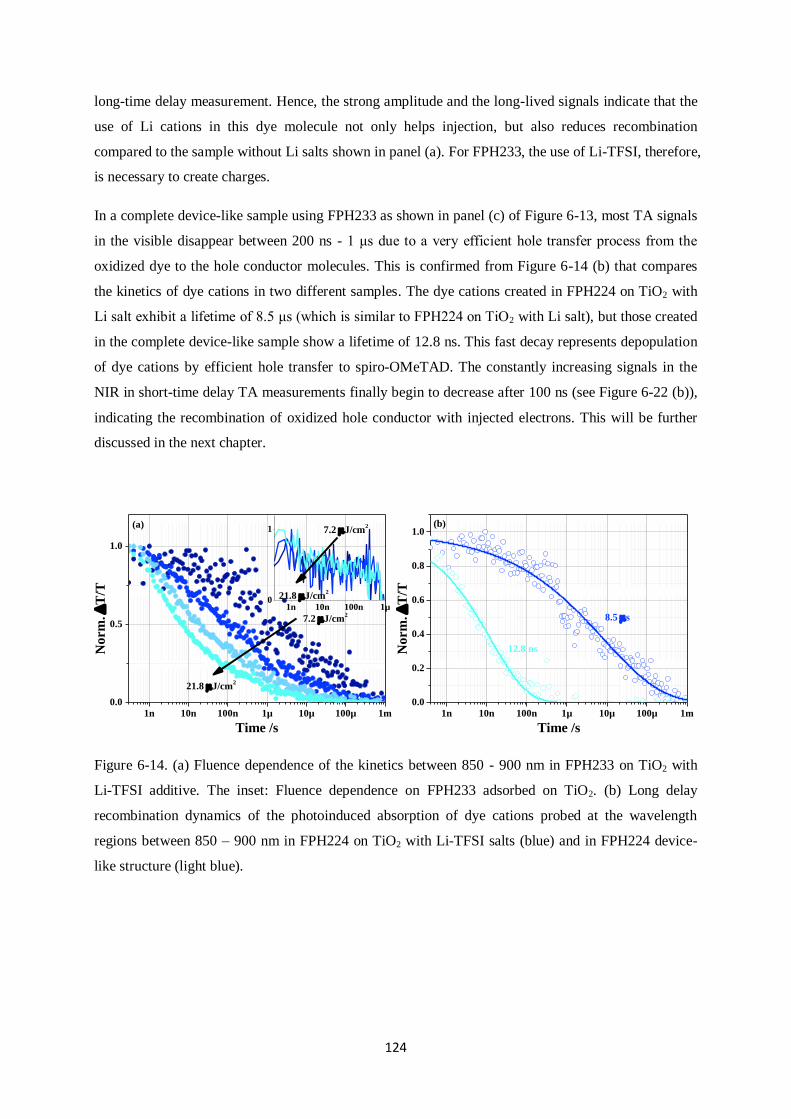
124
long-time delay measurement. Hence, the strong amplitude and the long-lived signals indicate that the
use of Li cations in this dye molecule not only helps injection, but also reduces recombination
compared to the sample without Li salts shown in panel (a). For FPH233, the use of Li-TFSI, therefore,
is necessary to create charges.
In a complete device-like sample using FPH233 as shown in panel (c) of Figure 6-13, most TA signals
in the visible disappear between 200 ns - 1 μs due to a very efficient hole transfer process from the
oxidized dye to the hole conductor molecules. This is confirmed from Figure 6-14 (b) that compares
the kinetics of dye cations in two different samples. The dye cations created in FPH224 on TiO2 with
Li salt exhibit a lifetime of 8.5 μs (which is similar to FPH224 on TiO2 with Li salt), but those created
in the complete device-like sample show a lifetime of 12.8 ns. This fast decay represents depopulation
of dye cations by efficient hole transfer to spiro-OMeTAD. The constantly increasing signals in the
NIR in short-time delay TA measurements finally begin to decrease after 100 ns (see Figure 6-22 (b)),
indicating the recombination of oxidized hole conductor with injected electrons. This will be further
discussed in the next chapter.
1n 10n 100n 1µ 10µ 100µ 1m
0.0
0.5
1.0
7.2 J/cm2
21.8 J/cm2
21.8 J/cm2
Norm
.
T/T
Time /s
7.2 J/cm2
(a)
1n 10n 100n 1µ0
1
1n 10n 100n 1µ 10µ 100µ 1m
0.0
0.2
0.4
0.6
0.8
1.0
12.8 nsNorm
.
T/T
Time /s
8.5 s
(b)
Figure 6-14. (a) Fluence dependence of the kinetics between 850 - 900 nm in FPH233 on TiO2 with
Li-TFSI additive. The inset: Fluence dependence on FPH233 adsorbed on TiO2. (b) Long delay
recombination dynamics of the photoinduced absorption of dye cations probed at the wavelength
regions between 850 – 900 nm in FPH224 on TiO2 with Li-TFSI salts (blue) and in FPH224 device-
like structure (light blue).

125
6.5.3. FPH231
FPH231 shows negative solvatochromism; therefore, the dye exhibits unfavorable injection properties
as shown by the PL decay measurements and by the calculation of the injection efficiency after the
addition of Li cations that causes a more polar environment around the dye molecules.
-30-20-10
010
600 700 800 900 1000 1100 1200 1300 1400 1500
-4
-2
0
2
-4
-2
0
2
(c) TiO2 plus Li
(d) Device
(b) Al2O
3
T
/T /
10
-3
(a) TiO2
-4
-2
0
2
Wavelength /nm
Figure 6-15. TA spectra on the femto- to nano-second timescale of FPH231 on TiO2 (a), of FPH231 on
Al2O3 (b), of FPH231 on TiO2 with Li cations (c), and of the FPH231 device-like structure sample (d)
at delay times of 3 ps (red), 30 ps (orange), 300 ps (green), and 3000 ps (purple). The pump fluence at
510 nm is 5.5 μJ cm-2
in the visible and 7.0 μJ cm-2 in the NIR.
Figure 6-15 (a) shows the transient absorption spectra of FPH231 adsorbed on TiO2 excited at 510 nm
with a fluence of 5.6 μJ/cm2. The positive GSB signals end at around 580 nm and the negative PIA
signals start to show up extending up to 1500 nm. The broad negative PIA signals are assigned to the
dye cations formed due to electron injection even without the help of Li cations, since the spectral
shape, especially in the NIR, is fairly similar to that in FPH231 on TiO2 with Li cations in panel (c)
rather than that in FPH231 on Al2O3 in panel (b). Panel (b) shows the short-time delay TA spectra of
FPH231 on Al2O3, where we can mainly observe the absorption of the exciton and intramolecular
charge transfer state when the dye molecule is adsorbed on the film. In panel (b), strong absorption
peaks are observed between 650 – 700 nm and most signals decay in 300 - 1200 ps over the whole
spectral range, whereas 30 % of the signal remains in panel (a) due to long-lived species. The
assignment of the long-lived signals to charges in FPH231 on TiO2 is confirmed by the fluence

126
dependence of long-time delay measurements shown in the inset of Figure 6-17 (a). On a TiO2 surface,
FPH224 showed a very weak intensity dependence as shown in the inset of Figure 6-11, whereas
FPH233 exhibited no charge generation as shown in the inset of Figure 6-14. However, FPH231
adsorbed onto TiO2 nanoparticles displays a strong intensity dependence pointing to charge generation.
In panel (c), the transient absorption spectra of FPH231 after addition of Li salt are shown. Unlike
FPH224 and 233, the amplitude of the TA spectra decreases upon the use of Li cations, indicating less
charge generation in line with the injection efficiency found in FPH231 on TiO2 without Li cations. It
is difficult to determine if there is charge generation in the short-delay spectra of this sample; however,
the decay kinetics in the short delay measurements shown in Figure 6-16 (b) and in the long-delay
measurements shown in Figure 6-17 (a) provide evidence for generation of charges in FPH231 on
TiO2 after application of Li cations.
100m 1 10 100 1k 10k
0.0
0.2
0.4
0.6
0.8
1.0
FPH224 w/o Li
FPH224 w Li
FPH233 w/o Li
FPH233 w Li
No
rm.
T/T
Time /ps
(a)
100m 1 10 100 1k 10k
0.6
0.8
1.0
FPH231 w/o Li
FPH231 w Li
Norm
.
T/T
Time /ps
(b)
Figure 6-16. (a) Kinetics of the dye cations in FPH224 and 233 with (darker)/ without (paler) Li
cations in the short-time delay TA measurements. The kinetics are averaged for FPH224 (black) and
233 (blue) between 850 – 900 nm and between 850 – 900 nm, and those for FPH224 (grey) and 233
(sky blue) with Li cations are taken from 900 – 950 nm and 900 – 950 nm, respectively. (b) Kinetics
of the dye cations in FPH231 on TiO2 (red, 1150 – 1170 nm) and in FPH231 on TiO2 with Li (dark red,
1120 – 1150 nm).
Figure 6-16 compares the kinetics of the dye cations in three different samples with and without Li
cations. In panel (a), FPH224 shows 80% of the signal remaining and slowly decaying when Li cations
are used on TiO2 (gray), compared to the sample without Li salt (black). This is the same for FPH233
showing the same amplitude of the signal after 10 ps (light blue) due to long-lived charges generated
with the help of Li cations, whereas the signal of the sample without Li cations constantly decreases
due to back electron transfer. Panel (b) shows the changes in the kinetics of FPH231 with (darker red)
and without (lighter red) Li cations. The two samples exhibit rather similar decay kinetics indicating
that Li cations do not significantly facilitate the charge generation like in FPH224 and 233.
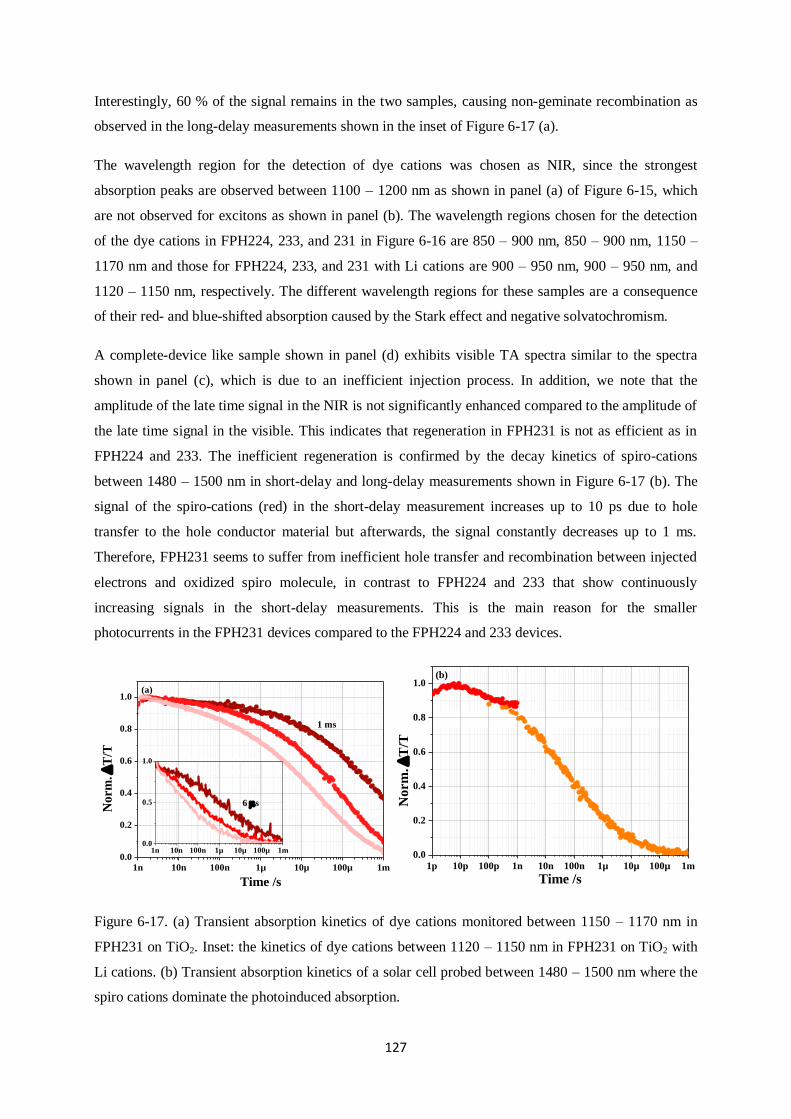
127
Interestingly, 60 % of the signal remains in the two samples, causing non-geminate recombination as
observed in the long-delay measurements shown in the inset of Figure 6-17 (a).
The wavelength region for the detection of dye cations was chosen as NIR, since the strongest
absorption peaks are observed between 1100 – 1200 nm as shown in panel (a) of Figure 6-15, which
are not observed for excitons as shown in panel (b). The wavelength regions chosen for the detection
of the dye cations in FPH224, 233, and 231 in Figure 6-16 are 850 – 900 nm, 850 – 900 nm, 1150 –
1170 nm and those for FPH224, 233, and 231 with Li cations are 900 – 950 nm, 900 – 950 nm, and
1120 – 1150 nm, respectively. The different wavelength regions for these samples are a consequence
of their red- and blue-shifted absorption caused by the Stark effect and negative solvatochromism.
A complete-device like sample shown in panel (d) exhibits visible TA spectra similar to the spectra
shown in panel (c), which is due to an inefficient injection process. In addition, we note that the
amplitude of the late time signal in the NIR is not significantly enhanced compared to the amplitude of
the late time signal in the visible. This indicates that regeneration in FPH231 is not as efficient as in
FPH224 and 233. The inefficient regeneration is confirmed by the decay kinetics of spiro-cations
between 1480 – 1500 nm in short-delay and long-delay measurements shown in Figure 6-17 (b). The
signal of the spiro-cations (red) in the short-delay measurement increases up to 10 ps due to hole
transfer to the hole conductor material but afterwards, the signal constantly decreases up to 1 ms.
Therefore, FPH231 seems to suffer from inefficient hole transfer and recombination between injected
electrons and oxidized spiro molecule, in contrast to FPH224 and 233 that show continuously
increasing signals in the short-delay measurements. This is the main reason for the smaller
photocurrents in the FPH231 devices compared to the FPH224 and 233 devices.
1n 10n 100n 1µ 10µ 100µ 1m
0.0
0.2
0.4
0.6
0.8
1.0
6 s
Norm
.
T/T
Time /s
1 ms
(a)
1n 10n 100n 1µ 10µ 100µ 1m0.0
0.5
1.0
1p 10p 100p 1n 10n 100n 1µ 10µ 100µ 1m
0.0
0.2
0.4
0.6
0.8
1.0
Norm
.
T/T
Time /s
(b)
Figure 6-17. (a) Transient absorption kinetics of dye cations monitored between 1150 – 1170 nm in
FPH231 on TiO2. Inset: the kinetics of dye cations between 1120 – 1150 nm in FPH231 on TiO2 with
Li cations. (b) Transient absorption kinetics of a solar cell probed between 1480 – 1500 nm where the
spiro cations dominate the photoinduced absorption.
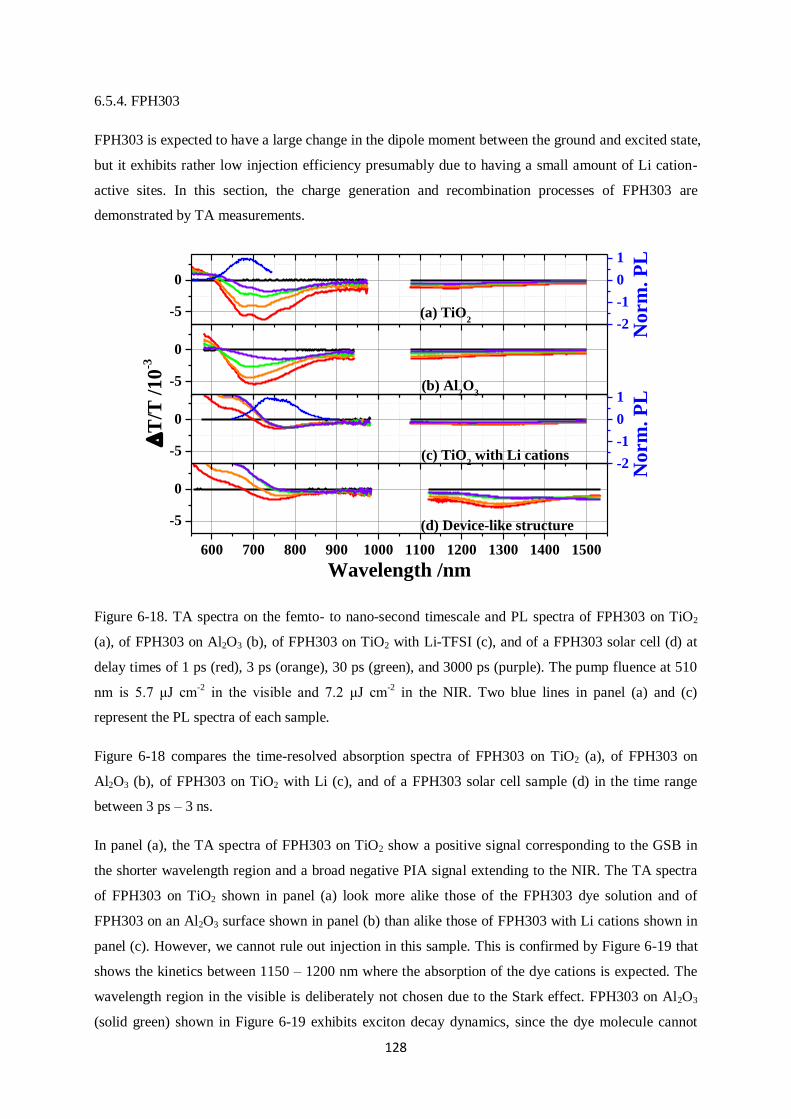
128
6.5.4. FPH303
FPH303 is expected to have a large change in the dipole moment between the ground and excited state,
but it exhibits rather low injection efficiency presumably due to having a small amount of Li cation-
active sites. In this section, the charge generation and recombination processes of FPH303 are
demonstrated by TA measurements.
-5
0
600 700 800 900 1000 1100 1200 1300 1400 1500
-5
0
-5
0
(d) Device-like structure
(c) TiO2 with Li cations
(b) Al2O
3
T
/T /
10
-3
(a) TiO2 -2
-1
0
1
No
rm
. P
L
-5
0
-2
-1
0
1
No
rm
. P
L
Wavelength /nm
Figure 6-18. TA spectra on the femto- to nano-second timescale and PL spectra of FPH303 on TiO2
(a), of FPH303 on Al2O3 (b), of FPH303 on TiO2 with Li-TFSI (c), and of a FPH303 solar cell (d) at
delay times of 1 ps (red), 3 ps (orange), 30 ps (green), and 3000 ps (purple). The pump fluence at 510
nm is 5.7 μJ cm-2
in the visible and 7.2 μJ cm-2
in the NIR. Two blue lines in panel (a) and (c)
represent the PL spectra of each sample.
Figure 6-18 compares the time-resolved absorption spectra of FPH303 on TiO2 (a), of FPH303 on
Al2O3 (b), of FPH303 on TiO2 with Li (c), and of a FPH303 solar cell sample (d) in the time range
between 3 ps – 3 ns.
In panel (a), the TA spectra of FPH303 on TiO2 show a positive signal corresponding to the GSB in
the shorter wavelength region and a broad negative PIA signal extending to the NIR. The TA spectra
of FPH303 on TiO2 shown in panel (a) look more alike those of the FPH303 dye solution and of
FPH303 on an Al2O3 surface shown in panel (b) than alike those of FPH303 with Li cations shown in
panel (c). However, we cannot rule out injection in this sample. This is confirmed by Figure 6-19 that
shows the kinetics between 1150 – 1200 nm where the absorption of the dye cations is expected. The
wavelength region in the visible is deliberately not chosen due to the Stark effect. FPH303 on Al2O3
(solid green) shown in Figure 6-19 exhibits exciton decay dynamics, since the dye molecule cannot
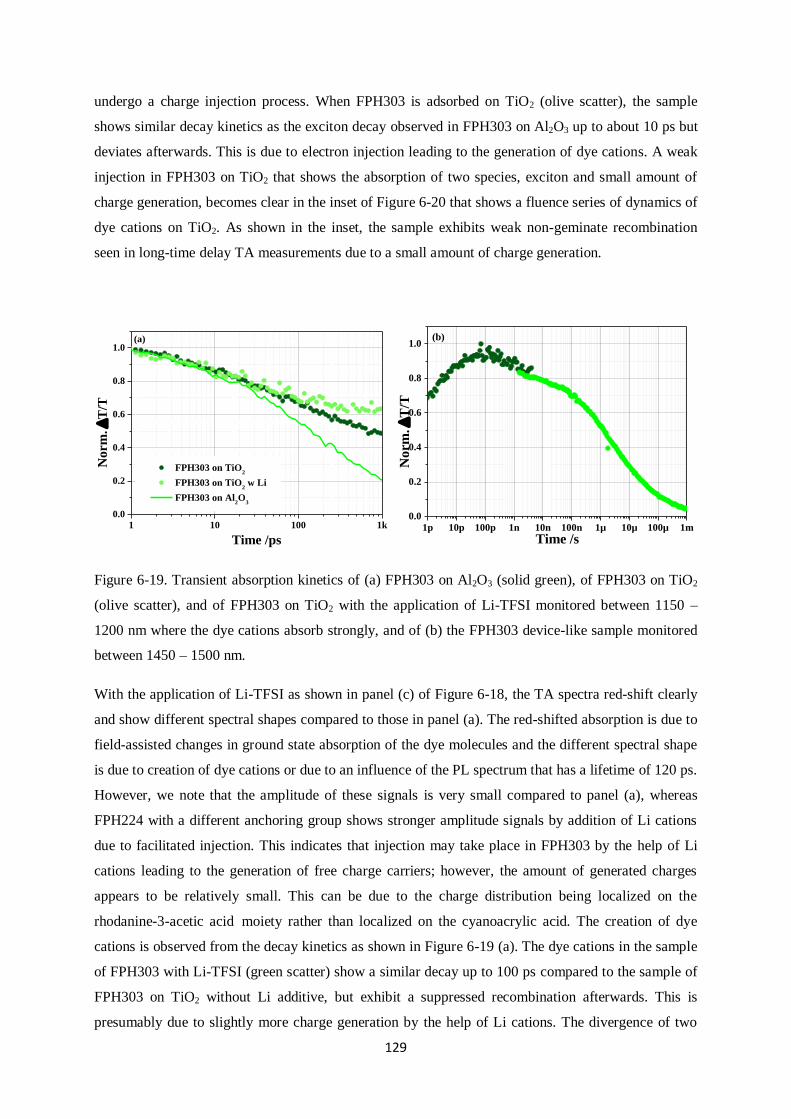
129
undergo a charge injection process. When FPH303 is adsorbed on TiO2 (olive scatter), the sample
shows similar decay kinetics as the exciton decay observed in FPH303 on Al2O3 up to about 10 ps but
deviates afterwards. This is due to electron injection leading to the generation of dye cations. A weak
injection in FPH303 on TiO2 that shows the absorption of two species, exciton and small amount of
charge generation, becomes clear in the inset of Figure 6-20 that shows a fluence series of dynamics of
dye cations on TiO2. As shown in the inset, the sample exhibits weak non-geminate recombination
seen in long-time delay TA measurements due to a small amount of charge generation.
1 10 100 1k
0.0
0.2
0.4
0.6
0.8
1.0
FPH303 on TiO2
FPH303 on TiO2 w Li
FPH303 on Al2O
3
Norm
.
T/T
Time /ps
(a)
1p 10p 100p 1n 10n 100n 1µ 10µ 100µ 1m
0.0
0.2
0.4
0.6
0.8
1.0
Norm
.
T/T
Time /s
(b)
Figure 6-19. Transient absorption kinetics of (a) FPH303 on Al2O3 (solid green), of FPH303 on TiO2
(olive scatter), and of FPH303 on TiO2 with the application of Li-TFSI monitored between 1150 –
1200 nm where the dye cations absorb strongly, and of (b) the FPH303 device-like sample monitored
between 1450 – 1500 nm.
With the application of Li-TFSI as shown in panel (c) of Figure 6-18, the TA spectra red-shift clearly
and show different spectral shapes compared to those in panel (a). The red-shifted absorption is due to
field-assisted changes in ground state absorption of the dye molecules and the different spectral shape
is due to creation of dye cations or due to an influence of the PL spectrum that has a lifetime of 120 ps.
However, we note that the amplitude of these signals is very small compared to panel (a), whereas
FPH224 with a different anchoring group shows stronger amplitude signals by addition of Li cations
due to facilitated injection. This indicates that injection may take place in FPH303 by the help of Li
cations leading to the generation of free charge carriers; however, the amount of generated charges
appears to be relatively small. This can be due to the charge distribution being localized on the
rhodanine-3-acetic acid moiety rather than localized on the cyanoacrylic acid. The creation of dye
cations is observed from the decay kinetics as shown in Figure 6-19 (a). The dye cations in the sample
of FPH303 with Li-TFSI (green scatter) show a similar decay up to 100 ps compared to the sample of
FPH303 on TiO2 without Li additive, but exhibit a suppressed recombination afterwards. This is
presumably due to slightly more charge generation by the help of Li cations. The divergence of two
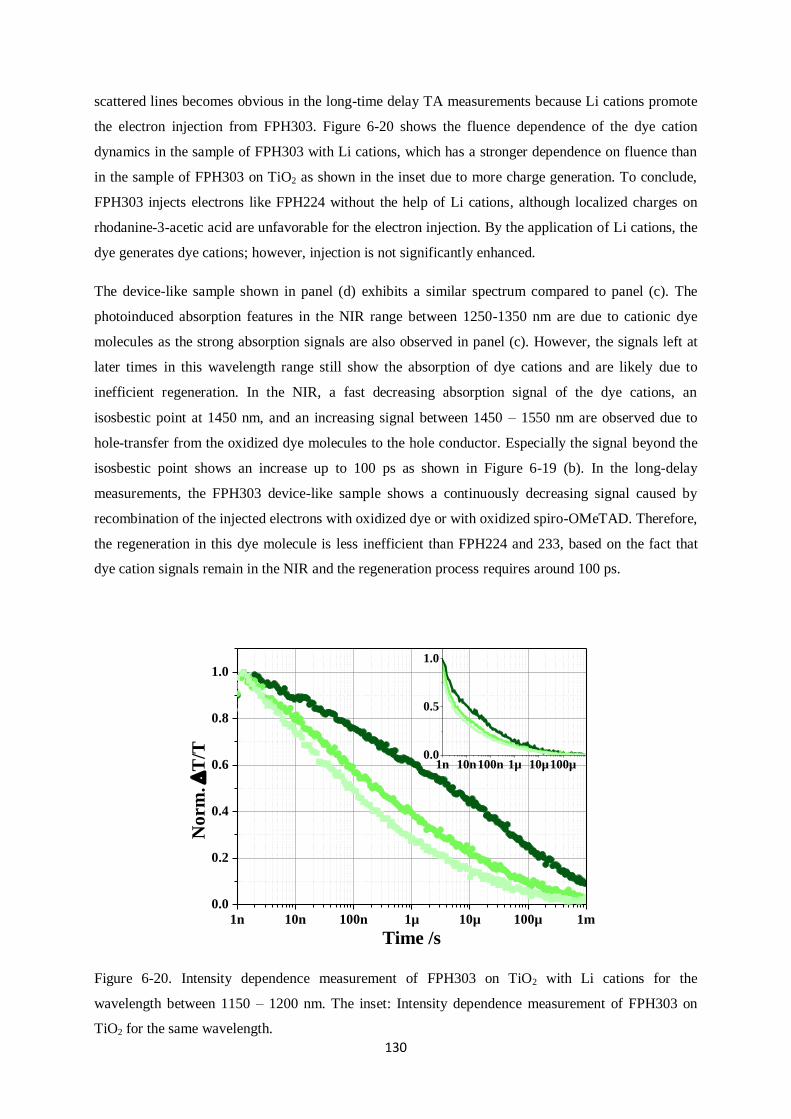
130
scattered lines becomes obvious in the long-time delay TA measurements because Li cations promote
the electron injection from FPH303. Figure 6-20 shows the fluence dependence of the dye cation
dynamics in the sample of FPH303 with Li cations, which has a stronger dependence on fluence than
in the sample of FPH303 on TiO2 as shown in the inset due to more charge generation. To conclude,
FPH303 injects electrons like FPH224 without the help of Li cations, although localized charges on
rhodanine-3-acetic acid are unfavorable for the electron injection. By the application of Li cations, the
dye generates dye cations; however, injection is not significantly enhanced.
The device-like sample shown in panel (d) exhibits a similar spectrum compared to panel (c). The
photoinduced absorption features in the NIR range between 1250-1350 nm are due to cationic dye
molecules as the strong absorption signals are also observed in panel (c). However, the signals left at
later times in this wavelength range still show the absorption of dye cations and are likely due to
inefficient regeneration. In the NIR, a fast decreasing absorption signal of the dye cations, an
isosbestic point at 1450 nm, and an increasing signal between 1450 – 1550 nm are observed due to
hole-transfer from the oxidized dye molecules to the hole conductor. Especially the signal beyond the
isosbestic point shows an increase up to 100 ps as shown in Figure 6-19 (b). In the long-delay
measurements, the FPH303 device-like sample shows a continuously decreasing signal caused by
recombination of the injected electrons with oxidized dye or with oxidized spiro-OMeTAD. Therefore,
the regeneration in this dye molecule is less inefficient than FPH224 and 233, based on the fact that
dye cation signals remain in the NIR and the regeneration process requires around 100 ps.
1n 10n 100n 1µ 10µ 100µ 1m
0.0
0.2
0.4
0.6
0.8
1.0
No
rm
.
T/T
Time /s
1n 10n100n 1µ 10µ100µ0.0
0.5
1.0
Figure 6-20. Intensity dependence measurement of FPH303 on TiO2 with Li cations for the
wavelength between 1150 – 1200 nm. The inset: Intensity dependence measurement of FPH303 on
TiO2 for the same wavelength.
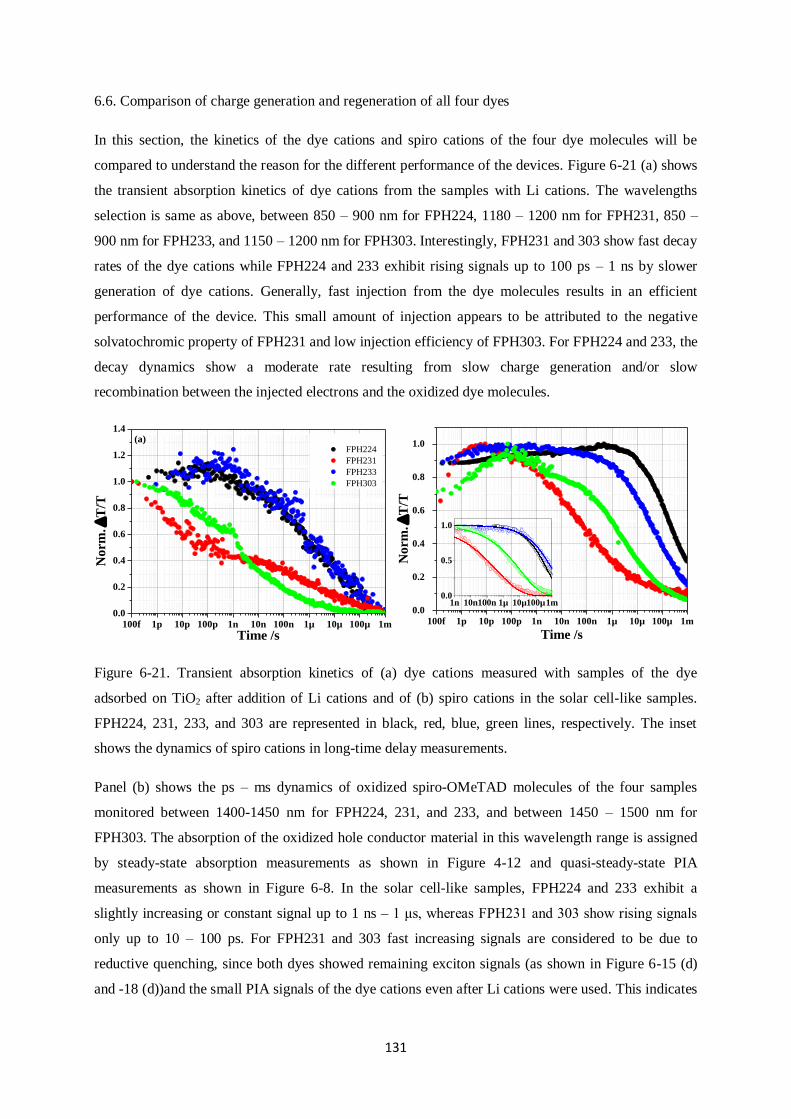
131
6.6. Comparison of charge generation and regeneration of all four dyes
In this section, the kinetics of the dye cations and spiro cations of the four dye molecules will be
compared to understand the reason for the different performance of the devices. Figure 6-21 (a) shows
the transient absorption kinetics of dye cations from the samples with Li cations. The wavelengths
selection is same as above, between 850 – 900 nm for FPH224, 1180 – 1200 nm for FPH231, 850 –
900 nm for FPH233, and 1150 – 1200 nm for FPH303. Interestingly, FPH231 and 303 show fast decay
rates of the dye cations while FPH224 and 233 exhibit rising signals up to 100 ps – 1 ns by slower
generation of dye cations. Generally, fast injection from the dye molecules results in an efficient
performance of the device. This small amount of injection appears to be attributed to the negative
solvatochromic property of FPH231 and low injection efficiency of FPH303. For FPH224 and 233, the
decay dynamics show a moderate rate resulting from slow charge generation and/or slow
recombination between the injected electrons and the oxidized dye molecules.
100f 1p 10p 100p 1n 10n 100n 1µ 10µ 100µ 1m
0.0
0.2
0.4
0.6
0.8
1.0
1.2
1.4
FPH224
FPH231
FPH233
FPH303
No
rm.
T/T
Time /s
(a)
100f 1p 10p 100p 1n 10n 100n 1µ 10µ 100µ 1m
0.0
0.2
0.4
0.6
0.8
1.0
Norm
.
T/T
Time /s
1n 10n100n 1µ 10µ100µ1m0.0
0.5
1.0
Figure 6-21. Transient absorption kinetics of (a) dye cations measured with samples of the dye
adsorbed on TiO2 after addition of Li cations and of (b) spiro cations in the solar cell-like samples.
FPH224, 231, 233, and 303 are represented in black, red, blue, green lines, respectively. The inset
shows the dynamics of spiro cations in long-time delay measurements.
Panel (b) shows the ps – ms dynamics of oxidized spiro-OMeTAD molecules of the four samples
monitored between 1400-1450 nm for FPH224, 231, and 233, and between 1450 – 1500 nm for
FPH303. The absorption of the oxidized hole conductor material in this wavelength range is assigned
by steady-state absorption measurements as shown in Figure 4-12 and quasi-steady-state PIA
measurements as shown in Figure 6-8. In the solar cell-like samples, FPH224 and 233 exhibit a
slightly increasing or constant signal up to 1 ns – 1 μs, whereas FPH231 and 303 show rising signals
only up to 10 – 100 ps. For FPH231 and 303 fast increasing signals are considered to be due to
reductive quenching, since both dyes showed remaining exciton signals (as shown in Figure 6-15 (d)
and -18 (d))and the small PIA signals of the dye cations even after Li cations were used. This indicates
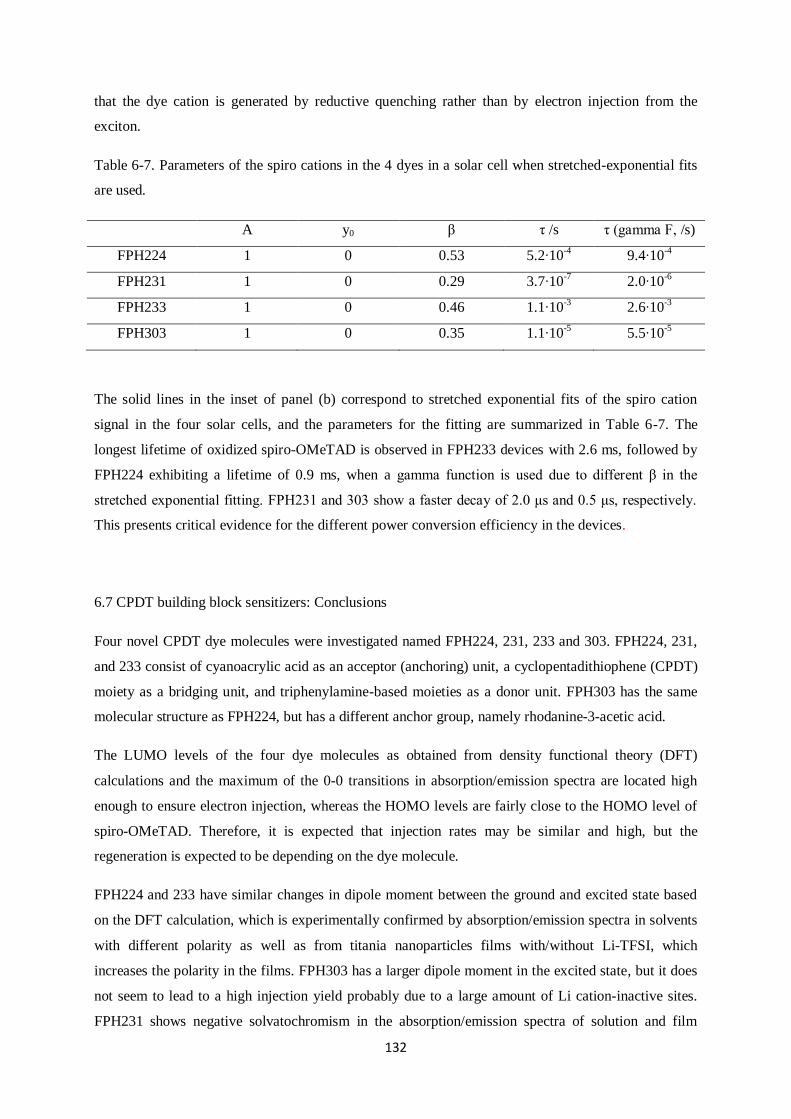
132
that the dye cation is generated by reductive quenching rather than by electron injection from the
exciton.
Table 6-7. Parameters of the spiro cations in the 4 dyes in a solar cell when stretched-exponential fits
are used.
A y0 β τ /s τ (gamma F, /s)
FPH224 1 0 0.53 5.2∙10-4
9.4∙10-4
FPH231 1 0 0.29 3.7∙10-7
2.0∙10-6
FPH233 1 0 0.46 1.1∙10-3
2.6∙10-3
FPH303 1 0 0.35 1.1∙10-5
5.5∙10-5
The solid lines in the inset of panel (b) correspond to stretched exponential fits of the spiro cation
signal in the four solar cells, and the parameters for the fitting are summarized in Table 6-7. The
longest lifetime of oxidized spiro-OMeTAD is observed in FPH233 devices with 2.6 ms, followed by
FPH224 exhibiting a lifetime of 0.9 ms, when a gamma function is used due to different β in the
stretched exponential fitting. FPH231 and 303 show a faster decay of 2.0 μs and 0.5 μs, respectively.
This presents critical evidence for the different power conversion efficiency in the devices.
6.7 CPDT building block sensitizers: Conclusions
Four novel CPDT dye molecules were investigated named FPH224, 231, 233 and 303. FPH224, 231,
and 233 consist of cyanoacrylic acid as an acceptor (anchoring) unit, a cyclopentadithiophene (CPDT)
moiety as a bridging unit, and triphenylamine-based moieties as a donor unit. FPH303 has the same
molecular structure as FPH224, but has a different anchor group, namely rhodanine-3-acetic acid.
The LUMO levels of the four dye molecules as obtained from density functional theory (DFT)
calculations and the maximum of the 0-0 transitions in absorption/emission spectra are located high
enough to ensure electron injection, whereas the HOMO levels are fairly close to the HOMO level of
spiro-OMeTAD. Therefore, it is expected that injection rates may be similar and high, but the
regeneration is expected to be depending on the dye molecule.
FPH224 and 233 have similar changes in dipole moment between the ground and excited state based
on the DFT calculation, which is experimentally confirmed by absorption/emission spectra in solvents
with different polarity as well as from titania nanoparticles films with/without Li-TFSI, which
increases the polarity in the films. FPH303 has a larger dipole moment in the excited state, but it does
not seem to lead to a high injection yield probably due to a large amount of Li cation-inactive sites.
FPH231 shows negative solvatochromism in the absorption/emission spectra of solution and film

133
samples, and this is considered to create an unfavorable environment for the electron injection in the
presence of Li salts when a normal device structure is used.
Time-resolved Streak camera measurements allow investigating injection properties of dye molecules
by measuring the PL intensity. The injection efficiency is calculated from the titania films
with/without Li cations and FPH231 and 303 are found to exhibit a low injection efficiency of 87 %,
while FPH224 and 233 show an injection efficiency of 99% under the assumption that non-radiative
deactivation is excluded. This fairly well correlates with the photocurrents and the J-V characteristics
of the devices, where FPH224 and 233 show higher photocurrents than FPH231 and 303.
The higher photocurrents of FPH224 and 233 devices are also confirmed by quasi-steady-state
photoinduced absorption (PIA) measurements that detect long-lived species such as dye cations or
spiro cations as a result of injection and hole transfer. In general, FPH224 and 233 exhibit strong PIA
signals of dye cations and spiro cations after the addition of Li-TFSI and spiro-OMeTAD, indicating
efficient charge generation and regeneration. FPH231 and 303 show absorption of dye cations in the
sample without any additive; however, the amplitude of the dye cation signal in FPH231 becomes
weaker after the addition of Li salt and the PIA signals of the spiro cations in the FPH231 and 303
device-like structure are significantly weaker compared to the FPH224 and 233 devices.
Transient absorption (TA) measurements on FPH224 provide evidence of charge generation on TiO2
even without Li-TFSI and of increased lifetime of dye cations by the use of Li additives due to
reduced back electron transfer. FPH303 has the same donor but different acceptor moiety as compared
to FPH224 and also injects electrons without the Li additive, but the kinetics in short delay
measurements reveal that FPH303 has only a small Li cation-active pool, causing inefficient charge
generation. By the addition of Li cations, FPH233 shows very strong and sharp signals at 780 nm
where the oxidized dye molecule strongly absorbs photons, and prolonged decay transients of the dye
cations. However, it does not show any proof of injection on TiO2 surfaces without Li-TFSI as
observed from the PIA measurements. The decay kinetics of FPH231 on titania (1 ms) is much slower
than that of FPH231 on titania with Li cations (6 μs), which is consistent with the long-lived signals in
short-delay TA spectra of FPH231 on TiO2 in the NIR.
An efficient regeneration process of the dye cations is observed for FPH224 and 233 solar cells that
show continuously increasing, long-lived signals in the short-time TA delay measurements, whereas
the FPH231 device shows decaying signals after 10 ps, and the hole transfer in the FPH303 device
seems to be finished after around 100 ps. These increasing signals appear to originate from reductive
quenching, since both dyes showed residual exciton signals and small PIA signals of the cations even
after Li cations were used. Furthermore, the difference in the decay of the four dye‟s spiro cations
strongly determines the photocurrents in the devices.

134
In conclusion the combination of dipole moments, reactivity of the molecules toward Li cation, and
the generation of long-lived dye/spiro cations are closely correlated to the power conversion efficiency
of the devices.
135
7. DISCUSSION
The photophysical properties of solid-state dye-sensitized solar cells using a series of rylene dye
molecules, perylene monoimide derivative dyes, and cyclopentadithiophene dyes as sensitizers were
investigated in this thesis. In this section, four factors affecting the power conversion efficiency of
solar cell devices are further discussed separately: energy levels, anchoring groups, dipole moments,
and dynamics of long-lived charges.
7.1 The importance of energy levels
The HOMO and LUMO energy levels of dye molecules are critical factors determining the device
performance. The LUMO level of a dye molecule should be higher than the conduction band of titania
to ensure an efficient injection process and the HOMO level should be lower than the HOMO level of
the hole transporter (such as spiro-OMeTAD) for fast and quantitative regeneration of oxidized dye
molecules.
In the series of rylene dye molecules, the di-carboxylic acids of the perylene molecules, PMIMA, has a
HOMO level of -5.33 eV and a LUMO level of –2.80 eV. When additional naphthalene units are
added, the energy bandgaps of the di-carboxylic acids of the terylene molecules (TMIMA) and the di-
carboxylic acids of the quaterylene molecules (QMIMA) are decreased and the HOMO/LUMO levels
shift to -5.17/-3.09 and -4.88/-3.19, respectively. These energy levels appear to be suitable for efficient
devices, as the conduction band of titania and the HOMO level of the hole conductor are between -4.0
– -4.3 eV and -4.7 – -4.9 eV (vs vacuum level), respectively. Hence, in quasi-steady-state
photoinduced absorption (PIA) spectroscopy, TMIMA and QMIMA showed lower injection and
regeneration than PMIMA. This led to reduced external quantum efficiencies (EQE) and poor power
conversion efficiencies in devices.
The perylene monoimide derivative dye, namely ID889, provides adequate energy levels, a HOMO of
-3.5 eV and a LUMO of -5.15 eV, which are suitable for efficient injection and regeneration. In
addition, fairly localized electronic charge distribution in the molecule indicated that the LUMO and
HOMO levels were mainly determined by the acceptor moiety and the donor moiety, a π-conjugated
bridge fused dibenzothiophene with triarylamine, respectively. The energy levels allowed a high
efficiency of 4.5% to be obtained with the EQE reaching 75% in a solid-state dye-sensitized solar cell.
Most of the FPH series of dye molecules showed similar LUMO levels due to the same cyanoacrylic
acid moieties that act as electron acceptors in the push-pull type dye. However, the HOMO levels
varied due to different triarylamine-based donor moieties, confirmed by DFT calculated orbital
surfaces. FPH224 and 233 showed better power conversion efficiencies in devices with HOMO levels

136
of -5.35 – 5.95 eV and -4.95 – -5.06 eV, respectively, which were suitable for regeneration of oxidized
dye molecules. The HOMO level of FPH231 (-4.62 – -5.10 eV) was similar to or higher than the
HOMO level of spiro-OMeTAD; it was, therefore, expected to suffer from poor regeneration, which
was confirmed by PIA measurements. FPH303 exhibited good energy levels with a HOMO of -5.18 –
-5.21 eV and a LUMO of -2.69 – -2.15 eV, however, injection and regeneration signals were
significantly weaker compared to FPH224 and 233 in PIA measurements.
The FPH dyes did not show good power conversion efficiencies in liquid-state dye-sensitized solar
cells, since the redox potential of redox mediators such as cobalt complexes (-5.06 eV) or iodide redox
(-4.8 eV) shuttles are located much lower than the HOMO levels of the FPH series dye molecules.
Therefore, these dye molecules are more suitable for solid-state DSCs.
7.2 The effect of anchoring groups
Anchor groups aid adsorption onto mesoporous metal oxide nanoparticles as well as acting as channels
for electron injection. In this report, four types of anchoring groups (carboxylic, cyanoacrylic,
rhodanine-3-acetic, and anhydride acid) were used and they were found to exhibit different
photophysical characteristics.
Generally, carboxylic acid anchoring groups are widely used due to easy synthesis, stability, and
because they offer more adsorption sites. Carboxylic acid groups can be combined with strong
electron withdrawing acceptor moieties such as cyanoacrylic acid or rhodanine-3-acetic acid in order
to obtain enhanced efficiency of electron injection [150]
. Carboxylic and cyanoacrylic acid anchor
groups were found to inject electrons well into titania as shown in chapter 5 and 6, whereas anhydride
and rhodanine-3-acetic acid anchoring groups showed unfavorable electron injection as demonstrated
in chapter 4 and 6.
The reason could be that carboxylic and cyanoacrylic acids showed fairly localized electron densities
in the acceptor blocks in the LUMO levels: ID889 with carboxylic acid, and FPH224 and FPH233
with cyanoacrylic acid, exhibited strong charge distribution in the anchor groups, which could be
significantly influenced by the use of Li cations.
Dye molecules with an anhydride acid anchor group (P-, T-, and Q-MIMA) undergo ring opening to
adsorb onto the titania surface. This changed the direction of the dipole moment, which negatively
affects electron injection. This was supported by DFT calculations showing that charge distributions
are localized in the π-conjugated bridge building block, far away from the titania surface/acceptor.
Furthermore, when potassium salts of the di-carboxylic acids in solution (ring opened form) were used
in photoluminescence measurements, reduced excited state lifetimes indicated enhanced non-radiative
deactivation.
137
Dye molecules with rhodanine-3-acetic acid anchor groups (FPH303) also suffer from poor injection
due to charges localized on the acceptor group, rather than spreading over the carboxylic acid. This
result is consistent with the literature [110, 151-154]
. However, we cannot simply state that the poor
injection properties of a dye molecule with rhodanine-3-acetic acid solely originate from the anchoring
group, since intramolecular charge transfer states could also play a crucial role in injection.
We note that improper anchoring groups do not show significantly improved injection efficiency even
after the use of Li cations. As stated above, this could be due to either a poor injection property of the
anchoring group or a dipole moment that was not large enough to drive the injection.
7.3 The role of dipole moments
Push-pull dye molecules have a strong dipole moment in the ground and excited state. In this section,
the role of the dipole moment of a dye molecule on the photophysical processes in a device, especially
the electron injection process, will be revealed.
First, dipole moments are the origin of the solvatochromism of dye molecules when solvents of
different polarity are used. In this thesis, most dye molecules showed positive solvatochromic
properties indicating to a stabilization of the excited state; however, FPH231 discussed in chapter 6
exhibited negative solvatochromism, indicating that the excited state was destabilized in polar solvents.
Hence, the use of Li cations, which similarly creates a polar environment at the metal oxide
nanoparticles/dye interface may lead to unfavorable electron injection.
Secondly, strong dipole moments can enhance electron injection yields when a dye molecule shows a
larger dipole moment in the excited state and/or when a dye molecule is inactivated by Li-cations. In
chapter 5, ID889 exhibited an excited state dipole moment of 48.2 Debye that is five times higher than
its dipole moment in the ground state of 9.3 Debye. The larger dipole moment in the excited state is in
line with red-shifted emission spectra in polar solvents and the formation of charge transfer states on
an alumina surface when Li additives are used. ID889 showed the highest photocurrents among all
organic dye molecules investigated in this dissertation and this is to a large extend due to the larger
dipole moment in the excited state leading to facilitated injection. In the cyclopentadithiophene series
of dye molecules, FPH224 and 233 were found to have similar dipole moments, based on their similar
absorption/emission spectra and Stokes shifts in solvents of different polarity, and these two molecules
exhibited similar efficiencies with similar photocurrents in devices, indicating injection properties are
not very different.
Thirdly, the direction of the dipole moment can indicate if an injection process from a dye molecule is
favorable or not. The orientation of dipole moments points from negative charges to positive charges
and then a dipole moment pointing away from the titania surface indicates favourable injection. As
138
shown in chapter 4, when anhydride anchoring groups (P-, T-, and Q-MIMA) undergo ring opening
during adsorption, the dipole moment direction changes pointing towards the interface, leading to poor
injection. Although these molecules showed slightly enhanced charge generation after the use of Li-
TFSI as shown by photoinduced absorption measurements, the dipole moment pointing towards the
titania surface overruled the effect on device performance compared to the use of Li cations.
Last, a strong dipole moment causes a significant Stark effect by interacting with the local electric
field at the interface, thus, all dynamics of dye cations were taken at wavelength regions above 800 nm
in order to avoid interference by the Stark effect.
However, there was one exception among the dye molecules studied here: FPH303 has a larger dipole
moment in the excited state; however, this did not cause efficient injection as shown by transient
absorption measurements. The reason why FPH303 did not show efficient injection despite having a
larger dipole moment in the excited state is its sensitivity to Li cations. For instance, in
photoluminescence decay measurements on the CPDT series of dyes in solutions or on films, FPH224
and 233 showed a significant decrease in lifetime in polar solvents or after addition of Li cations,
whereas FPH303 showed a rather similar or only slightly decreased lifetime regardless of Li cation use.
Furthermore, FPH303 exhibited the lowest injection rate of 87% , as did FPH231, whereas FPH224
and 233 showed an injection-efficiency close to unity (99%), when the PL intensities of Li-treated
titania samples were compared to those from alumina surfaces.
Dipole moment and sensitivity to Li cations appear to be closely related to efficient injection, since Li-
TFSI draws more electron density towards the interface. For instance, ID889, which injected electrons
even without the help of Li cations, showed improved electron injection after the use of Li cations,
because the existence of Li-active sites in ID889 samples increased the injection-efficiency although
the electron densities were mostly localized at the acceptor moiety rather than at the anchoring group.
For rylene dyes, as pointed out above, it seemed that they had Li-active sites, since we could observe
larger signals by quasi-steady-state photoinduced absorption spectroscopy, but the dipole moment
pointing towards the titania surface overcompensated the effect of Li-active sites. FPH224 and 233
clearly exhibited a larger amount of charge generation after the use of Li cations in long-delay
measurements as they have favorable dipole moments. However, as stated above, FPH303 seems to
have a larger dipole moment in the excited state, but is not activated by Li-cations, thus only leading to
short-lived charges.

139
7.4 Recombination of charges
In solid-state dye-sensitized solar cells, two types of charged molecules can be detected: dye cations
and spiro cations. The yield and dynamics of these cations on μs – ms timescale is directly related to
the power conversion efficiency of a device.
As shown in chapter 4, rylene dyes exhibited poor efficiencies ranging from 0.02% to 0.29%. Among
the series of rylene dye molecules, PMIMA showed the strongest signals of dye cations and spiro
cations in PIA measurements, but still suffered from low photovoltages and photocurrents compared to
a ruthenium complex dye-sensitized solar cell. TMIMA and QMIMA exhibited almost no meaningful
signals from spiro cations, leading to not only low photocurrents but also to poor photovoltages and
fill factors due to recombination.
ID889 shown in chapter 5 exhibited the best performance of 4.5% among the organic dye molecules
investigated in this dissertation and this seemed to originate from very efficient charge generation and
regeneration. Furthermore, by using soft-modelling multivariate curve resolution (MCR), we found
that ID889 showed no reductive quenching, a process that is known to be a less efficient charge
generation mechanism than the ordinary charge generation path, due to a preceding hole transfer from
oxidized dye molecules to the hole transporter. In MCR analysis, exciton dynamics from a device-like
sample were very similar to the exciton decay from a dye adsorbed on titania or adsorbed on Li-treated
titania. Therefore, long-lived charge generation in ID889 is mainly from the dye‟s excited state rather
than from anionic dye molecules, in turn leading to efficient charge generation.
In the CPDT series of dye molecules shown in chapter 6, FPH224 and 233 showed better efficiencies
of 1.56 – 1.67 % when compared with FPH231 and 303, which showed a PCE of 0.65 – 0.82 %. The
difference between the efficiencies mainly originated from enhanced photocurrents in the devices. In
PIA measurements, FPH233 and 224 showed strong charge generation and regeneration signals after
the use of Li cations and spiro-OMeTAD as hole conductor, respectively. FPH233 exhibited no
remaining dye cation signals, leading to the best performance.
7.5 Conclusion
In order to achieve high power conversion efficiency in solid-state dye-sensitized solar cell, several
factors need to be considered. First of all, the HOMO level of the dye molecule needs to be lower than
the HOMO of the hole transporter for efficient regeneration and the LUMO level of the dye molecule
needs to be higher than the conduction band of the metal oxide nanoparticles for electron injection.
Secondly, the anchoring group should not interfere or affect electron injection after adsorption onto
nanoparticles and electron density localized near anchoring and acceptor moieties is desirable for an
efficient injection process. Thirdly, the dipole moment and sensitivity to Li-cation of a dye molecule

140
are important for high photocurrents in a device. For efficient injection, the dipole moment needs to
point away from the metal oxide surface, and injection is facilitated when the magnitude of the dipole
moment in the excited state is larger than in the ground state. If the metal oxide-dye interface has a
significant amount of Li-active sites then the injection efficiency and charge generation can be
improved by addition of Li-TFSI. Last, observation of long-lived charges after addition of Li-TFSI or
a hole conductor such as spiro-OMeTAD is directly related to a high power conversion efficiency.
Figure 7-1 shows a summary consisting of factors that significantly affect the device efficiency, and
the dye molecules investigated in this dissertation. ID889, FPH224 and 233 have Li cation-active sites,
favourable dipole moments, and create long-lived charges, ultimately resulting in high performing
devices.
Figure 7-1. Schematic diagram representing factors that affect the power conversion efficiency.

141
8. REFERENCES
1. Administration, U.S.E.I. International energy outlook 2013. 2013; Available from:
http://www.eia.gov/forecasts/ieo/index.cfm.
2. Lee, M.M., et al., Efficient Hybrid Solar Cells Based on Meso-Superstructured Organometal
Halide Perovskites. Science, 2012. 338(6107): p. 643-647.
3. Burschka, J., et al., Sequential deposition as a route to high-performance perovskite-sensitized
solar cells. Nature, 2013. 499(7458): p. 316-+.
4. Liu, M., M.B. Johnston, and H.J. Snaith, Efficient planar heterojunction perovskite solar cells
by vapour deposition. Nature, 2013. 501(7467): p. 395-+.
5. Yu, G., et al., POLYMER PHOTOVOLTAIC CELLS - ENHANCED EFFICIENCIES VIA A
NETWORK OF INTERNAL DONOR-ACCEPTOR HETEROJUNCTIONS. Science, 1995.
270(5243): p. 1789-1791.
6. Tang, C.W., 2-LAYER ORGANIC PHOTOVOLTAIC CELL. Applied Physics Letters, 1986.
48(2): p. 183-185.
7. Koster, L.J.A., S.E. Shaheen, and J.C. Hummelen, Pathways to a New Efficiency Regime for
Organic Solar Cells. Advanced Energy Materials, 2012. 2(10): p. 1246-1253.
8. Gruber, M., et al., Thermodynamic Efficiency Limit of Molecular Donor-Acceptor Solar Cells
and its Application to Diindenoperylene/C60-Based Planar Heterojunction Devices.
Advanced Energy Materials, 2012. 2(9): p. 1100-1108.
9. Giebink, N.C., et al., Thermodynamic efficiency limit of excitonic solar cells. Physical Review
B, 2011. 83(19).
10. Kirchartz, T., K. Taretto, and U. Rau, Efficiency Limits of Organic Bulk Heterojunction Solar
Cells. Journal of Physical Chemistry C, 2009. 113(41): p. 17958-17966.
11. Lunt, R.R., et al., Practical Roadmap and Limits to Nanostructured Photovoltaics. Adv Mater,
2011. 23(48): p. 5712-5727.
12. Shockley, W. and H.J. Queisser, DETAILED BALANCE LIMIT OF EFFICIENCY OF P-N
JUNCTION SOLAR CELLS. Journal of Applied Physics, 1961. 32(3): p. 510-&.
13. He, Z., et al., Enhanced power-conversion efficiency in polymer solar cells using an inverted
device structure. Nature Photonics, 2012. 6(9): p. 591-595.
14. Vogel, R., K. Pohl, and H. Weller, SENSITIZATION OF HIGHLY POROUS,
POLYCRYSTALLINE TIO2 ELECTRODES BY QUANTUM SIZED CDS. Chemical Physics
Letters, 1990. 174(3-4): p. 241-246.
15. Vogel, R., P. Hoyer, and H. Weller, QUANTUM-SIZED PBS, CDS, AG2S, SB2S3, AND BI2S3
PARTICLES AS SENSITIZERS FOR VARIOUS NANOPOROUS WIDE-BANDGAP
SEMICONDUCTORS. Journal of Physical Chemistry, 1994. 98(12): p. 3183-3188.
16. Plass, R., et al., Quantum dot sensitization of organic-inorganic hybrid solar cells. Journal of
Physical Chemistry B, 2002. 106(31): p. 7578-7580.
17. Santra, P.K. and P.V. Kamat, Mn-Doped Quantum Dot Sensitized Solar Cells: A Strategy to
Boost Efficiency over 5%. J Am Chem Soc, 2012. 134(5): p. 2508-2511.
18. Service, R.F., ENERGY TECHNOLOGY Perovskite Solar Cells Keep On Surging. Science,
2014. 344(6183): p. 458-458.
19. Kojima, A., et al., Organometal Halide Perovskites as Visible-Light Sensitizers for
Photovoltaic Cells. J Am Chem Soc, 2009. 131(17): p. 6050-+.
20. Xing, G., et al., Long-Range Balanced Electron- and Hole-Transport Lengths in Organic-
Inorganic CH3NH3PbI3. Science, 2013. 342(6156): p. 344-347.
21. Stranks, S.D., et al., Electron-Hole Diffusion Lengths Exceeding 1 Micrometer in an
Organometal Trihalide Perovskite Absorber. Science, 2013. 342(6156): p. 341-344.

142
22. Oregan, B. and M. Gratzel, A LOW-COST, HIGH-EFFICIENCY SOLAR-CELL BASED ON
DYE-SENSITIZED COLLOIDAL TIO2 FILMS. Nature, 1991. 353(6346): p. 737-740.
23. Yella, A., et al., Porphyrin-Sensitized Solar Cells with Cobalt (II/III)-Based Redox Electrolyte
Exceed 12 Percent Efficiency. Science, 2011. 334(6056): p. 629-634.
24. Dualeh, A., et al., Influence of Donor Groups of Organic D-pi-A Dyes on Open-Circuit
Voltage in Solid-State Dye-Sensitized Solar Cells. Journal of Physical Chemistry C, 2012.
116(1): p. 1572-1578.
25. Asbury, J.B., et al., Femtosecond IR study of excited-state relaxation and electron-injection
dynamics of Ru(dcbpy)(2)(NCS)(2) in solution and on nanocrystalline TiO2 and Al2O3 thin
films. Journal of Physical Chemistry B, 1999. 103(16): p. 3110-3119.
26. Ramakrishna, G., et al., Strongly coupled ruthenium-polypyridyl complexes for efficient
electron injection in dye-sensitized semiconductor nanoparticles. Journal of Physical
Chemistry B, 2005. 109(32): p. 15445-15453.
27. Kuang, D.B., et al., High molar extinction coefficient heteroleptic ruthenium complexes for
thin film dye-sensitized solar cells. J Am Chem Soc, 2006. 128(12): p. 4146-4154.
28. Benko, G., et al., Photoinduced ultrafast dye-to-semiconductor electron injection from
nonthermalized and thermalized donor states. J Am Chem Soc, 2002. 124(3): p. 489-493.
29. Wenger, B., M. Gratzel, and J.E. Moser, Rationale for kinetic heterogeneity of ultrafast light-
induced electron transfer from Ru(II) complex sensitizers to nanocrystalline TiO2. J Am
Chem Soc, 2005. 127(35): p. 12150-12151.
30. van de Lagemaat, J., N.G. Park, and A.J. Frank, Influence of electrical potential distribution,
charge transport, and recombination on the photopotential and photocurrent conversion
efficiency of dye-sensitized nanocrystalline TiO2 solar cells: A study by electrical impedance
and optical modulation techniques. Journal of Physical Chemistry B, 2000. 104(9): p. 2044-
2052.
31. O'Regan, B.C., et al., Measuring charge transport from transient photovoltage rise times. A
new tool to investigate electron transport in nanoparticle films. Journal of Physical Chemistry
B, 2006. 110(34): p. 17155-17160.
32. Fabregat-Santiago, F., et al., Electron Transport and Recombination in Solid-State Dye Solar
Cell with Spiro-OMeTAD as Hole Conductor. J Am Chem Soc, 2009. 131(2): p. 558-562.
33. Jennings, J.R. and L.M. Peter, A reappraisal of the electron diffusion length in solid-state dye-
sensitized solar cells. Journal of Physical Chemistry C, 2007. 111(44): p. 16100-16104.
34. Kruger, J., et al., Charge transport and back reaction in solid-state dye-sensitized solar cells:
A study using intensity-modulated photovoltage and photocurrent spectroscopy. Journal of
Physical Chemistry B, 2003. 107(31): p. 7536-7539.
35. Jonathan Clayden, N.G., Stuart Warren, Organic Chemistry. 2, illustrated ed. 2012, Mar 15,
2012: OUP Oxford. 1264.
36. Evans, R.C., Douglas, Peter, Burrow, Hugh D. , Applied Photochemistry. 2013, Springer.
37. Ceroni, P., The Exploration of Supramolecular Systems and Nanostructures by Photochemical
Techniques. Vol. 78. 2012: Springer. 123.
38. Boxer, S.G., Stark Realities. Journal of Physical Chemistry B, 2009. 113(10): p. 2972-2983.
39. Johannes G. Vos, R.J.F., Tia E. Keyes, Interfacial Supramolecular Assemblies. 2003: Wiley.
40. Keller, U., Recent developments in compact ultrafast lasers. Nature, 2003. 424(6950): p. 831-
838.
41. Menzel, R., Photonics (Linear and Nonlinear Interactions of Laser Light and Matter). 2007:
Springer.
42. Markus Schwoerer, H.C.W., Organic Molecular Solids. 2007: Wiley-VCH Verlag GmbH &
Co. KGaA.
143
43. Wannier, G.H., The structure of electronic excitation levels in insulating crystals. Physical
Review, 1937. 52(3): p. 0191-0197.
44. Hagfeldt, A. and M. Gratzel, Molecular photovoltaics. Accounts of Chemical Research, 2000.
33(5): p. 269-277.
45. Howard, I.A., et al., Two Channels of Charge Generation in Perylene Monoimide Solid-State
Dye-Sensitized Solar Cells. Advanced Energy Materials, 2014. 4(2).
46. Kallioinen, J., et al., Electron transfer from the singlet and triplet excited states of
Ru(dcbpy)(2)(NCS)(2) into nanocrystalline TiO2 thin films. Journal of Physical Chemistry B,
2002. 106(17): p. 4396-4404.
47. Bach, U., et al., Charge separation in solid-state dye-sensitized heterojunction solar cells.
Journal of the American Chemical Society, 1999. 121(32): p. 7445-7446.
48. Clifford, J.N., et al., Dye dependent regeneration dynamics in dye sensitized nanocrystalline
solar cells: Evidence for the formation of a ruthenium bipyridyl cation/iodide intermediate.
Journal of Physical Chemistry C, 2007. 111(17): p. 6561-6567.
49. Kelly, C.A., et al., Cation-controlled interfacial charge injection in sensitized nanocrystalline
TiO2. Langmuir, 1999. 15(20): p. 7047-7054.
50. Haque, S.A., et al., Charge recombination kinetics in dye-sensitized nanocrystalline titanium
dioxide films under externally applied bias. Journal of Physical Chemistry B, 1998. 102(10): p.
1745-1749.
51. Hasselmann, G.M. and G.J. Meyer, Diffusion-limited interfacial electron transfer with large
apparent driving forces. Journal of Physical Chemistry B, 1999. 103(36): p. 7671-7675.
52. Trachibana, Y., et al., Electron injection and recombination in dye sensitized nanocrystalline
titanium dioxide films: A comparison of ruthenium bipyridyl and porphyrin sensitizer dyes.
Journal of Physical Chemistry B, 2000. 104(6): p. 1198-1205.
53. Kuciauskas, D., et al., Electron transfer dynamics in nanocrystalline titanium dioxide solar
cells sensitized with ruthenium or osmium polypyridyl complexes. Journal of Physical
Chemistry B, 2001. 105(2): p. 392-403.
54. Clifford, J.N., et al., Molecular control of recombination dynamics in dye-sensitized
nanocrystalline TiO2 films: Free energy vs distance dependence. Journal of the American
Chemical Society, 2004. 126(16): p. 5225-5233.
55. Haque, S.A., et al., Parameters influencing charge recombination kinetics in dye-sensitized
nanocrystalline titanium dioxide films. Journal of Physical Chemistry B, 2000. 104(3): p. 538-
547.
56. Tachibana, Y., et al., Subpicosecond interfacial charge separation in dye-sensitized
nanocrystalline titanium dioxide films. Journal of Physical Chemistry, 1996. 100(51): p.
20056-20062.
57. Nazeeruddin, M.K., et al., CONVERSION OF LIGHT TO ELECTRICITY BY CIS-X2BIS(2,2'-
BIPYRIDYL-4,4'-DICARBOXYLATE)RUTHENIUM(II) CHARGE-TRANSFER SENSITIZERS
(X = CL-, BR-, I-, CN-, AND SCN-) ON NANOCRYSTALLINE TIO2 ELECTRODES. J Am
Chem Soc, 1993. 115(14): p. 6382-6390.
58. Haque, S.A., et al., Charge separation versus recombination in dye-sensitized nanocrystalline
solar cells: the minimization of kinetic redundancy. Journal of the American Chemical Society,
2005. 127(10): p. 3456-3462.
59. Chen, C.-Y., et al., Highly Efficient Light-Harvesting Ruthenium Sensitizer for Thin-Film Dye-
Sensitized Solar Cells. Acs Nano, 2009. 3(10): p. 3103-3109.
60. Zakeeruddin, S.M., et al., Design, synthesis, and application of amphiphilic ruthenium
polypyridyl photosensitizers in solar cells based on nanocrystalline TiO2 films. Langmuir,
2002. 18(3): p. 952-954.

144
61. Wang, P., et al., A stable quasi-solid-state dye-sensitized solar cell with an amphiphilic
ruthenium sensitizer and polymer gel electrolyte. Nat Mater, 2003. 2(6): p. 402-407.
62. Wang, P., et al., Stable new sensitizer with improved light harvesting for nanocrystalline dye-
sensitized solar cells. Adv Mater, 2004. 16(20): p. 1806-+.
63. Nazeeruddin, M.K., et al., Acid-base equilibria of (2,2 '-bipyridyl-4,4 '-dicarboxylic
acid)ruthenium(II) complexes and the effect of protonation on charge-transfer sensitization of
nanocrystalline titania. Inorganic Chemistry, 1999. 38(26): p. 6298-6305.
64. Wang, P., et al., High efficiency dye-sensitized nanocrystalline solar cells based on ionic
liquid polymer gel electrolyte. Chem Commun (Camb), 2002(24): p. 2972-2973.
65. Wang, P., et al., Molecular-scale interface engineering of TiO2 nanocrystals: Improving the
efficiency and stability of dye-sensitized solar cells. Adv Mater, 2003. 15(24): p. 2101-+.
66. Schmidt-Mende, L., S.M. Zakeeruddin, and M. Gratzel, Efficiency improvement in solid-state-
dye-sensitized photovoltaics with an amphiphilic Ruthenium-dye. Applied Physics Letters,
2005. 86(1).
67. Snaith, H.J., et al., High extinction coefficient "Antenna" dye in solid-state dye-sensitized solar
cells: A photophysical and electronic study. Journal of Physical Chemistry C, 2008. 112(20): p.
7562-7566.
68. Karthikeyan, C.S., et al., Highly efficient solid-state dye-sensitized TiO2 solar cells via control
of retardation of recombination using novel donor-antenna dyes. Solar Energy Materials and
Solar Cells, 2007. 91(5): p. 432-439.
69. Nazeeruddin, M.K., P. Pechy, and M. Gratzel, Efficient panchromatic sensitization of
nanocrystalline TiO2 films by a black dye based on a trithiocyanato-ruthenium complex.
Chem Commun (Camb), 1997(18): p. 1705-1706.
70. Maeda, T., et al., Near-infrared Absorbing Squarylium Dyes with Linearly Extended pi-
Conjugated Structure for Dye-sensitized Solar Cell Applications. Organic Letters, 2011.
13(22): p. 5994-5997.
71. Macor, L., et al., Near-IR sensitization of wide band gap oxide semiconductor by axially
anchored Si-naphthalocyanines. Energy & Environmental Science, 2009. 2(5): p. 529-534.
72. Ono, T., T. Yamaguchi, and H. Arakawa, Study on dye-sensitized solar cell using novel
infrared dye. Solar Energy Materials and Solar Cells, 2009. 93(6-7): p. 831-835.
73. Hara, K., et al., Oligothiophene-containing coumarin dyes for efficient dye-sensitized solar
cells. Journal of Physical Chemistry B, 2005. 109(32): p. 15476-15482.
74. Horiuchi, T., et al., High efficiency of dye-sensitized solar cells based on metal-free indoline
dyes. J Am Chem Soc, 2004. 126(39): p. 12218-12219.
75. Ito, S., et al., High-conversion-efficiency organic dye-sensitized solar cells with a novel
indoline dye. Chem Commun (Camb), 2008(41): p. 5194-5196.
76. Ito, S., et al., High-efficiency organic-dye-sensitized solar cells controlled by nanocrystalline-
TiO2 electrode thickness. Adv Mater, 2006. 18(9): p. 1202-+.
77. Koumura, N., et al., Alkyl-functionalized organic dyes for efficient molecular photovoltaics.
Journal of the American Chemical Society, 2006. 128(44): p. 14256-14257.
78. Wang, Z.-S., et al., Hexylthiophene-functionalized carbazole dyes for efficient molecular
photovoltaics: Tuning of solar-cell performance by structural modification. Chemistry of
Materials, 2008. 20(12): p. 3993-4003.
79. Ooyama, Y., et al., Photovoltaic performance of dye-sensitized solar cells based on a series of
new-type donor-acceptor-pi-conjugated sensitizer, benzofuro 2,3-c oxazolo 4,5-a carbazole
fluorescent dyes. Journal of Photochemistry and Photobiology a-Chemistry, 2009. 203(2-3): p.
177-185.

145
80. Yang, C.-H., et al., Characteristics of triphenylamine-based dyes with multiple acceptors in
application of dye-sensitized solar cells. Journal of Power Sources, 2009. 188(2): p. 627-634.
81. Zhang, G., et al., High efficiency and stable dye-sensitized solar cells with an organic
chromophore featuring a binary pi-conjugated spacer. Chemical Communications, 2009(16):
p. 2198-2200.
82. Marinado, T., et al., Rhodanine dyes for dye-sensitized solar cells: spectroscopy, energy levels
and photovoltaic performance. Physical Chemistry Chemical Physics, 2009. 11(1): p. 133-141.
83. Zhang, F., et al., Triphenylamine-based dyes for dye-sensitized solar cells. Dyes and Pigments,
2009. 81(3): p. 224-230.
84. Li, C., et al., An Improved Perylene Sensitizer for Solar Cell Applications. Chemsuschem,
2008. 1(7): p. 615-618.
85. Ferrere, S. and B.A. Gregg, Large increases in photocurrents and solar conversion
efficiencies by UV illumination of dye sensitized solar cells. Journal of Physical Chemistry B,
2001. 105(32): p. 7602-7605.
86. Cappel, U.B., et al., A Broadly Absorbing Perylene Dye for Solid-State Dye-Sensitized Solar
Cells. Journal of Physical Chemistry C, 2009. 113(33): p. 14595-14597.
87. Shibano, Y., et al., Electron-donating perylene tetracarboxylic acids for dye-sensitized solar
cells. Organic Letters, 2007. 9(10): p. 1971-1974.
88. Edvinsson, T., et al., Intramolecular charge-transfer tuning of perylenes: Spectroscopic
features and performance in Dye-sensitized solar cells. Journal of Physical Chemistry C, 2007.
111(42): p. 15137-15140.
89. Ferrere, S. and B.A. Gregg, New perylenes for dye sensitization of TiO2. New Journal of
Chemistry, 2002. 26(9): p. 1155-1160.
90. Bullock, J.E., et al., Photophysics and Redox Properties of Rylene Imide and Diimide Dyes
Alkylated Ortho to the Imide Groups. Journal of Physical Chemistry B, 2010. 114(5): p. 1794-
1802.
91. Kamm, V., et al., Polythiophene:Perylene Diimide Solar Cells - the Impact of Alkyl-
Substitution on the Photovoltaic Performance. Advanced Energy Materials, 2011. 1(2): p.
297-302.
92. Geerts, Y., et al., Quaterrylenebis(dicarboximide)s: near infrared absorbing and emitting dyes.
Journal of Materials Chemistry, 1998. 8(11): p. 2357-2369.
93. Edvinsson, T., et al., Photoinduced electron transfer from a terrylene dye to TiO2:
Quantification of band edge shift effects. Chemical Physics, 2009. 357(1-3): p. 124-131.
94. Xu, M., et al., Electrical and photophysical analyses on the impacts of arylamine electron
donors in cyclopentadithiophene dye-sensitized solar cells. Energy & Environmental Science,
2011. 4(11): p. 4735-4742.
95. Cai, N., et al., Engineering of Push-Pull Thiophene Dyes to Enhance Light Absorption and
Modulate Charge Recombination in Mesoscopic Solar Cells. Advanced Functional Materials,
2013. 23(14): p. 1846-1854.
96. Liu, J., et al., Joint Photophysical and Electrical Analyses on the Influence of Conjugation
Order in D-pi-A Photosensitizers of Mesoscopic Titania Solar Cells. Journal of Physical
Chemistry C, 2011. 115(29): p. 14425-14430.
97. Imahori, H., T. Umeyama, and S. Ito, Large pi-Aromatic Molecules as Potential Sensitizers
for Highly Efficient Dye-Sensitized Solar Cells. Accounts of Chemical Research, 2009. 42(11):
p. 1809-1818.
98. Karthikeyan, C.S., H. Wietasch, and M. Thelakkat, Highly efficient solid-state dye-sensitized
TiO2 solar cells using donor-antenna dyes capable of multistep charge-transfer cascades.
Advanced Materials, 2007. 19(8): p. 1091-1095.

146
99. Handa, S., et al., Reducing charge recombination losses in solid state dye sensitized solar cells:
the use of donor-acceptor sensitizer dyes. Chemical Communications, 2007(17): p. 1725-1727.
100. Haque, S.A., et al., Supermolecular control of charge transfer in dye-sensitized
nanocrystalline TiO2 films: Towards a quantitative structure-function relationship.
Angewandte Chemie-International Edition, 2005. 44(35): p. 5740-5744.
101. Zhang, M., et al., Design of high-efficiency organic dyes for titania solar cells based on the
chromophoric core of cyclopentadithiophene-benzothiadiazole. Energy & Environmental
Science, 2013. 6(10): p. 2944-2949.
102. Yella, A., et al., Molecular Engineering of a Fluorene Donor for Dye-Sensitized Solar Cells.
Chemistry of Materials, 2013. 25(13): p. 2733-2739.
103. Dualeh, A., et al., Near-infrared sensitization of solid-state dye-sensitized solar cells with a
squaraine dye. Applied Physics Letters, 2012. 100(17).
104. Anderson, A.Y., et al., Quantifying Regeneration in Dye-Sensitized Solar Cells. Journal of
Physical Chemistry C, 2011. 115(5): p. 2439-2447.
105. Cabau, L., et al., Light soaking effects on charge recombination and device performance in
dye sensitized solar cells based on indoline-cyclopentadithiophene chromophores. Journal of
Materials Chemistry A, 2013. 1(31): p. 8994-9000.
106. Murakoshi, K., et al., IMPORTANCE OF BINDING STATES BETWEEN
PHOTOSENSITIZING MOLECULES AND THE TIO2 SURFACE FOR EFFICIENCY IN A
DYE-SENSITIZED SOLAR-CELL. Journal of Electroanalytical Chemistry, 1995. 396(1-2): p.
27-34.
107. Chen, X. and S.S. Mao, Titanium dioxide nanomaterials: Synthesis, properties, modifications,
and applications. Chemical Reviews, 2007. 107(7): p. 2891-2959.
108. Johansson, E.M.J., et al., Comparing Surface Binding of the Maleic Anhydride Anchor Group
on Single Crystalline Anatase TiO2 (101), (100), and (001) Surfaces. Journal of Physical
Chemistry C, 2010. 114(35): p. 15015-15020.
109. Voelker, B., et al., Dye Bonding to TiO2: In Situ Attenuated Total Reflection Infrared
Spectroscopy Study, Simulations, and Correlation with Dye-Sensitized Solar Cell
Characteristics. Langmuir, 2012. 28(31): p. 11354-11363.
110. Tian, H., et al., Phenothiazine derivatives for efficient organic dye-sensitized solar cells.
Chemical Communications, 2007(36): p. 3741-3743.
111. Neubauer, A., et al., Photophysical Study of Perylene/TiO2 and Perylene/ZnO Varying
Interfacial Couplings and the Chemical Environment. Journal of Physical Chemistry C, 2011.
115(13): p. 5683-5691.
112. Abrusci, A., et al., Influence of Ion Induced Local Coulomb Field and Polarity on Charge
Generation and Efficiency in Poly(3-Hexylthiophene)-Based Solid-State Dye-Sensitized Solar
Cells. Advanced Functional Materials, 2011. 21(13): p. 2571-2579.
113. Bartelt, A.F., et al., Influence of TiO2/Perylene Interface Modifications on Electron Injection
and Recombination Dynamics. Journal of Physical Chemistry C, 2009. 113(50): p. 21233-
21241.
114. Kruger, J., et al., High efficiency solid-state photovoltaic device due to inhibition of interface
charge recombination. Applied Physics Letters, 2001. 79(13): p. 2085-2087.
115. Koops, S.E., et al., Parameters Influencing the Efficiency of Electron Injection in Dye-
Sensitized Solar Cells. Journal of the American Chemical Society, 2009. 131(13): p. 4808-
4818.
116. Poplavskyy, D. and J. Nelson, Nondispersive hole transport in amorphous films of methoxy-
spirofluorene-arylamine organic compound. Journal of Applied Physics, 2003. 93(1): p. 341-
346.
147
117. Bach, U., et al., Solid-state dye-sensitized mesoporous TiO2 solar cells with high photon-to-
electron conversion efficiencies. Nature, 1998. 395(6702): p. 583-585.
118. Garcia-Canadas, J., et al., Determination of electron and hole energy levels in mesoporous
nanocrystalline TiO2 solid-state dye solar cell. Synthetic Metals, 2006. 156(14-15): p. 944-
948.
119. Schmidt-Mende, L. and M. Gratzel, TiO2 pore-filling and its effect on the efficiency of solid-
state dye-sensitized solar cells. Thin Solid Films, 2006. 500(1-2): p. 296-301.
120. Snaith, H.J., et al., Efficiency enhancements in solid-state hybrid solar cells via reduced
charge recombination and increased light capture. Nano Letters, 2007. 7(11): p. 3372-3376.
121. Snaith, H.J., et al., Charge Generation and Photovoltaic Operation of Solid-State Dye-
Sensitized Solar Cells Incorporating a High Extinction Coefficient Indolene-Based Sensitizer.
Advanced Functional Materials, 2009. 19(11): p. 1810-1818.
122. Multivariate Curve Resolution. Available from:
http://www.cid.csic.es/homes/rtaqam/tmp/WEB_MCR/welcome.htm.
123. von Frese, J., S.A. Kovalenko, and N.P. Ernsting, Interactive curve resolution by using latent
projections in polar coordinates. Journal of Chemometrics, 2007. 21(1-2): p. 2-9.
124. Ito, S., et al., Fabrication of screen-printing pastes from TiO2 powders for dye-sensitised
solar cells. Progress in Photovoltaics, 2007. 15(7): p. 603-612.
125. Meister, M., Charge Generation and Recombination in Hybrid Organic/Inorganic Solar Cells,
in Chemistry Department. 2013, Johannes Gutenberg-Universität Mainz.
126. Do, N.T. and M. Baerns, EFFECT OF SUPPORT MATERIAL ON THE ADSORPTION
STRUCTURES OF FURAN AND MALEIC-ANHYDRIDE ON THE SURFACE OF
V2O5/P2O5 CATALYSTS .2. RESULTS OF INSITU INFRARED SPECTROSCOPIC
STUDIES. Applied Catalysis, 1988. 45(1): p. 9-26.
127. Wilson, J.N., et al., Reactions of maleic anhydride over TiO2 (001) single crystal surfaces.
Journal of Vacuum Science & Technology a-Vacuum Surfaces and Films, 2000. 18(4): p.
1887-1892.
128. Vittadini, A., et al., Formic acid adsorption on dry and hydrated TiO2 anatase (101) surfaces
by DFT calculations. Journal of Physical Chemistry B, 2000. 104(6): p. 1300-1306.
129. Ashima, H., W.-J. Chun, and K. Asakura, Room-temperature-adsorption behavior of acetic
anhydride on a TiO2(110) surface. Surface Science, 2007. 601(8): p. 1822-1830.
130. Chérubin, N.S., Dye-sensitized solar cells based on perylene derivatives, in Faculty of Science.
2009, University of Kassel.
131. Nolde, F., et al., Synthesis and modification of terrylenediimides as high-performance
fluorescent dyes. Chemistry-a European Journal, 2005. 11(13): p. 3959-3967.
132. Gratzel, M., Photoelectrochemical cells. Nature, 2001. 414(6861): p. 338-344.
133. Cappel, U.B., et al., Characterization of the Interface Properties and Processes in Solid State
Dye-Sensitized Solar Cells Employing a Perylene Sensitizer. Journal of Physical Chemistry C,
2011. 115(10): p. 4345-4358.
134. Abrusci, A., et al., Influence of Ion Induced Local Coulomb Field and Polarity on Charge
Generation and Efficiency in Poly(3-Hexylthiophene)-Based Solid-State Dye-Sensitized Solar
Cells. Advanced Functional Materials, 2011. 21(13): p. 2571-2579.
135. Liu, Y., et al., Investigation of influence of redox species on the interfacial energetics of a dye-
sensitized nanoporous TiO2 solar cell. Solar Energy Materials and Solar Cells, 1998. 55(3): p.
267-281.
136. Olson, C., et al., Characterization of the Pore Filling of Solid State Dye Sensitized Solar Cells
with Photoinduced Absorption Spectroscopy. International Journal of Photoenergy, 2011.
2011: p. 1-11.
148
137. Sugiyama, K., et al., Dependence of indium-tin-oxide work function on surface cleaning
method as studied by ultraviolet and x-ray photoemission spectroscopies. Journal of Applied
Physics, 2000. 87(1): p. 295-298.
138. Peter, K., et al., Dual-functional materials for interface modifications in solid-state dye-
sensitised TiO2 solar cells. Applied Physics a-Materials Science & Processing, 2004. 79(1): p.
65-71.
139. Leijtens, T., et al., Hole Transport Materials with Low Glass Transition Temperatures and
High Solubility for Application in Solid-State Dye-Sensitized Solar Cells. Acs Nano, 2012.
6(2): p. 1455-1462.
140. Chen, Q., et al., Thick benzocyclobutene etching using high density SF6/O-2 plasmas. Journal
of Vacuum Science & Technology B, 2011. 29(1).
141. Snook, J.H., et al., Ultraviolet photoelectron spectroscopy of nanocrystalline TiO2 films
sensitized with (2,2 '-bipyridyl)ruthenium(II) dyes for photovoltaic applications. Organic
Electronics, 2005. 6(2): p. 55-64.
142. Michaelson, H.B., WORK FUNCTION OF ELEMENTS AND ITS PERIODICITY. Journal of
Applied Physics, 1977. 48(11): p. 4729-4733.
143. Cappel, U.B., et al., The Influence of Local Electric Fields on Photoinduced Absorption in
Dye-Sensitized Solar Cells. Journal of the American Chemical Society, 2010. 132(26): p.
9096-9101.
144. Cappel, U.B., et al., Dye Regeneration by Spiro-MeOTAD in Solid State Dye-Sensitized Solar
Cells Studied by Photoinduced Absorption Spectroscopy and Spectroelectrochemistry. Journal
of Physical Chemistry C, 2009. 113(15): p. 6275-6281.
145. Welton, C.R.a.T., Solvents and Solvent Effects in Organic Chemistry. 2010: Wiley-VCH
Verlag GmbH & Co. KGaA.
146. ; Available from: http://webbook.nist.gov/chemistry/.
147. Palomares, E., et al., Control of charge recombination dynamics in dye sensitized solar cells
by the use of conformally deposited metal oxide blocking layers. Journal of the American
Chemical Society, 2003. 125(2): p. 475-482.
148. Wenger, B., M. Gratzel, and J.E. Moser, Rationale for kinetic heterogeneity of ultrafast light-
induced electron transfer from Ru(II) complex sensitizers to nanocrystalline TiO2. Journal of
the American Chemical Society, 2005. 127(35): p. 12150-12151.
149. Olson, C., et al., Characterization of the Pore Filling of Solid State Dye Sensitized Solar Cells
with Photoinduced Absorption Spectroscopy. International Journal of Photoenergy, 2011.
150. Mishra, A., M.K.R. Fischer, and P. Baeuerle, Metal-Free Organic Dyes for Dye-Sensitized
Solar Cells: From Structure: Property Relationships to Design Rules. Angewandte Chemie-
International Edition, 2009. 48(14): p. 2474-2499.
151. Hara, K., et al., A coumarin-derivative dye sensitized nanocrystalline TiO2 solar cell having a
high solar-energy conversion efficiency up to 5.6%. Chemical Communications, 2001(6): p.
569-570.
152. Hara, K., et al., Design of new coumarin dyes having thiophene moieties for highly efficient
organic-dye-sensitized solar cells. New Journal of Chemistry, 2003. 27(5): p. 783-785.
153. Hara, K., et al., Molecular design of coumarin dyes for efficient dye-sensitized solar cells.
Journal of Physical Chemistry B, 2003. 107(2): p. 597-606.
154. Kitamura, T., et al., Phenyl-conjugated oligoene sensitizers for TiO2 solar cells. Chemistry of
Materials, 2004. 16(9): p. 1806-1812.

149
9. LIST OF ACRONYMS
Btu British thermal units/joule
BHJ bulk heterojunction
HJ heterojunction
FTO fluorinated tin oxide
DSCs dye-sensitized solar cells
TCO transparent conductive oxide
PCE power conversion efficiency
CPDT cyclopentadithiophene
TD-DFT time-dependent-density functional theory
MCR multivariate curve resolution
TA transient absorption
TiO2 titanium dioxide/titania
spiro-OMeTAD 2,2‟7,7‟-tetrakis-(N,N-di-p-methoxyphenyl-amine)-9,9‟-spirobifluorene
tBP 4-tert-butylpyridine
Li-TFSI lilithium bis (trifluoromethanesulphonyl) imide salt
Al2O3 aluminium oxide/alumina
AM 1.5 G air mass 1.5 global
Ag silver
JSC short circuit current density
Vapp applied voltage
VOC open circuit voltage
FF fill factor
Pinc incident light irradiance
150
IMPP current at maximum power point
VMPP voltage at maximum power point
EQE external quantum efficiency
q elementary charge
ħ Plank's constant
Pin light intensity
IQE internal quantum efficiency
UV-Vis ultraviolet to visible wavelength range
FeCl3 iron(III) chloride
Lupasol®
polyethylenimines; adhesion promoter
BASF chemical company
PIA photoinduced absorption spectroscopy
LED light-emitting diode
P power density
c the speed of light
A absorbance
PL photoluminescence
BBO Barium Borate
CCD charge-coupled device
TAS transient absorption spectroscopy
OPA optical parametical amplifiers
YAG yttrium-aluminium-garnet
YVO4 yttrium vanadate
NIR near-infrared
PMIMA perylene mono-imid mono-anhydride

151
TMIMA terylene mono-imid mono-anhydride
QMIMA quaterylene mono-imid mono-anhydride
KOH potassium hydroxide
Z907 Acronym for a Ru based dye: cis-Bis(isothiocyanato)(2,2‟-bipyridyl-4,4‟-
dicarboxylato)(4,4‟-di-nonyl-2‟-bipyridyl)ruthenium(II)
Ru ruthenium
IC internal conversion
ISC intersystem crossing
vr vibrational relaxation
HOMO highest occupied molecular orbital
LUMO lowest occupied molecular orbital
EMR electromagnetic radiation
BO Born-Oppenheimer
MC metal-centered transition
LC ligand-centered transition
LMCT ligand-to-metal charge transfer
MLCT metal-to-ligand charge transfer
FRET Förster resonance energy transfer
GSB ground state bleaching
SE stimulated emission
PIA photoinduced absorption
KLM Kerr lens mode-locking
CPA chirped pulse amplification
Ti:Sa titanium-sapphire
ZnO zinc oxide

152
HTM hole transporter material
TCO transparent conductive oxide layer
D-π-A donor- π bridge-acceptor
PDI perylene diimide
TDI terrylene diimide
QDI quaterrylene diimide
PEDOT Poly(3,4-ethylenedioxythiophene) poly(styrenesulfonate)
P3HT Poly(3-hexylthiophene-2,5-diyl)
EFA evolving factor analysis
153
10. LIST OF FIGURES
Figure 1-1. A variety of applications of dye-sensitized solar cells in electronics and building:
tablet manufactured by G24 Innovation and Logitech (top left), flexible dye-sensitized
solar cells by G24 innovation (top right), and building-integrated photovoltaics by
Fraunhofer (bottom).
Figure 2- 1. σ and π bonds in a benzene ring.
Figure 2- 2. Jablonski diagram illustrating electronic states of a molecule (singlet excited states Sn
or triplet states Tn) and transitions between those states.
Figure 2- 3. Electronic transition represented as vertical line between two potential energy
diagrams of ground (ψ) and excited state (*ψ) as a function of the internuclear
separation distance (Q). The Franck-Condon principle states that an electronic
transition is faster than a nuclear transition due to the difference in mass of electron
and nuclei.
Figure 2- 4. Transition in a two discrete energy level system, namely induced absorption,
spontaneous emission, and stimulated (induced) emission.
Figure 2- 5. The Stark effect on different energy levels by relation of dipole moment with external
electric field.
Figure 2- 6. Marcus theory: the potential energy curves of an electron transfer reaction are
represented as harmonic oscillators as a function of nuclear coordinate. i and f stand
for initial state and final state, respectively. A small electronic coupling value of
|VDA|2 compared to the reorganization energy in non-adiabatic electron transfer
reactions (a), and different electronic situation depending on the relation between the
energy barrier and activation energy, ΔG≠ (b).
Figure 2- 7. Schematic diagram of (a) electron transfer, (b) Dexter and (c) Förster energy transfer.
Figure 2- 15. A schematic diagram of signals obtained from transient absorption spectroscopy.
Figure 2- 9. A schematic diagram of generation of mode-locked pulses having different
frequencies (a) and a laser resonator using gain and loss medium in a cavity mode (b).
Figure 2- 10. Passive mode-locking using a Kerr lens to allow only focused light to pass through.
Figure 2- 11. Process of chirped pulse amplification of a femtosecond laser pulse.

154
Figure 2- 12. A schematic diagram of supercontinuum white light generation.
Figure 2- 13. Different exciton radii of Wannier and Frekel excitons due to the different dielectric
permittivity of the material.
Figure 2- 14. Working principle of solid-state dye-sensitized solar cells. A: absorption of a photon,
B: a dye‟s excited state decay, C: Injection of electrons, D: recombination between
injected electrons with oxidized dye molecule, E: reduction process of a dyes‟
oxidized state, and F: D: recombination between injected electrons with a oxidized
hole conductor
Figure 3-1. Time-temperature profile of the sintering process for two layers. A mesoporous titania
layer after doctor blade coating in blue, and an insulating metal oxide layer in red.
Figure 3-2. Molecular structure of spiro-OMeTAD (a), Li additive ion salt (b), and tert-
butylpyridine (tBP) (c).
Figure 3-3. Schematic structure of a solid-state dye-sensitized solar cell: FTO as an anode,
compact titania layer, mesoporous metal oxide layer as an electron acceptor,
sensitized dye as a photon harvesting system, hole conductor for dye regeneration, and
silver as a cathode.
Figure 3-4. Spectral irradiance at air mass (AM) 1.5 global solar conditions.
Figure 3-5. Schematic diagram showing how the band positions shift according to the applied
voltage.
Figure 3-6. (a) Changes in absorption of oxidized dye FH303 created by adding 5 mM anhydrous
iron(III) chloride solution. Ratios are based on volume percent; (b) Changes in
absorption of ID889 due to anion formation under Lupasol and UV illumination
treatment.
Figure 3-7. Schematic illustration of photoinduced absorption spectroscopy.
Figure 3-8. Working rinciple of a streak camera system.
Figure 3-9. Schematic of the transient absorption spectroscopy setup.
Figure 3-10. Chemical structures of PMIMA (n=0), TMIMA (n=1), and QMIMA (n=2) with
anhydride group (left) and as potassium salts of the dicarboxylic acids (right).
Figure 3-11. Chemical structure of the perylene dye ID889.

155
Figure 3-12. Molecular structures of the series of CPDT building block dyes, FH224 (a), FH231 (b),
FH233 (c), and FH303 (d).
Figure 3-13. Molecular structure of the ruthenium complex Z907.
Figure 4-1. Chemical structures of PMIMA (n=0), TMIMA (n=1), and QMIMA (n=2) with
anhydride group (left) and as potassium salts of the di-carboxylic acids (right) used in
solution measurements.
Figure 4-2. Potential binding configurations of maleic acids on TiO2 surface: (a) bidentate
bridging and (b) monodentate mode. Atoms in blue originate from titanium dioxide
surface and atoms in black come from maleic acid anhydride.
Figure 4-3. The HOMO and LUMO energy levels of anhydride-PMIMA (black solid), TMIMA
(red solid), and QMIMA (blue solid) and of di-carboxylic acids of the dye molecules
(dotted) calculated by density functional theory calculation
Figure 4-4. Normalized absorption/emission spectra of 0.1 mM PMIMA (black), TMIMA (red),
and QMIMA (blue) dyes in toluene solution as anhydrides (a) and after ring opening
(b).
Figure 4-5. Normalized fluorescence decay of PMIMA (black) and TMIMA (red) in toluene
solution. Di-carboxylic acid PMIMA and TMIMA dye solutions are represented as
gray and orange, respectively. The decays (solid lines) of anhydride and di-carboxylic
dye solutions follow a single exponential.
Figure 4-6. Normalized absorption and emission spectra of 0.1 mM solutions of anhydride (a)
PMIMA and (b) TMIMA in toluene (TLN) and dichlorobenzene (DCB). Black and
red lines represent anhydride PMIMA and TMIMA in TLN and gray and orange lines
show anhydride PMIMA and TMIMA in DCB, respectively.
Figure 4-7. Normalized absorption and photoluminescence spectra of (a) di-carboxylic acids
PMIMA dye solution in TLN (black) and DCB (gray), and of (b) di-carboxylic acids
TMIMA dye solution in TLN (red) and DCB (orange)
Figure 4-8. Normalized photoluminescence decays of 0.1 mM di-carboxylic acid PMIMA in TLN
(black) and DCB (gray), and of 0.1 mM di-carboxylic acid TMIMA in TLN (red) and
DCB (orange). The solid lines correspond to mono-exponential fits.
156
Figure 4-9. Steady-state absorption spectra of PMIMA-(black), TMIMA-(red), and QMIMA-(blue)
sensitized titania films.
Figure 4-10. Normalized absorption and emission spectra of dye molecules adsorbed on titania in
the presence and absence of Li salts. (a) PMIMA on titania (black) and after
application of Li cation (gray); (b) TMIMA on titania (red) and with Li cation
(orange); (c) QMIMA on titania (blue) and with Li cation(light blue).
Figure 4-11. Normalized PL decays of PMIMA (black) and TMIMA (red) on titania, and the
decays of PMIMA (gray) and TMIMA (orange) after application of Li cations. Solid
lines represent stretched-exponential fits.
Figure 4-12. Steady-state absorption spectra of (a) PMIMA, (b) TMIMA, (c) QMIMA dye cations,
and (d) spiro-OMeTAD cations after addition of a 10 mM FeCl3 solution.
Figure 4-13. Quasi-steady-state PIA absorption spectra (a) of the dyes adsorbed on titania, (b) of
the dyes on titania after application of Li-TFSI, and (c) of a device-like sample when
PMIMA (black), TMIMA (red), and QMIMA (blue) dyes are used. The inset: PIA
spectra of a device-like sample using Z907 (green) compared to the rylene dyes.
Figure 4-14. J-V curves of the dye-sensitized solar cells measured under AM1.5G solar
illumination (a) and corresponding EQE spectra (b) using PMIMA (black), TMIMA
(red), and QMIMA (blue) dyes.
Figure 5-1. Molecular structure of the perylene monoimide derivative dye ID889 and the
HOMO/LUMO energy levels of the dye.
Figure 5-2. Absorption and emission spectra of (a) 0.1 mM ID889 in toluene and (b) of Sample 1
(red), 2 (orange), 4 (black), and 5 (gray).
Figure 5-3. Absorbance spectrum of dye-sensitized titania film (black), dye anion (red), and dye
cation (blue) with an arbitrary offset.
Figure 5-4. J-V characteristics of ID889-sensitized solid-state DSC measured under 100 mWcm-2
AM 1.5 G solar intensity and (b) corresponding EQE spectra as a function of
wavelength.
Figure 5-5. Quasi-steady-state photoinduced absorption (PIA) spectra of ID889 dye excited with a
530 nm LED: ID889 on TiO2 (black, Sample 4), ID889 on TiO2 with Li salt (gray,
Sample 5), and ID889 on TiO2 with all additives and a hole conductor, having a

157
complete-device structure (light gray, Sample 6). Red-dotted line represents the
absorption of dye cations obtained from steady-state absorption measurement.
Figure 5-6. (a) Normalized absorption and emission spectra of 0.1 mM ID889 solutions in toluene
(TLN, black) and dimethylsulfoxide (DMSO, red) solvent; (b) Decay of the PL in dye
solutions of TLN (black) and DMSO (red) obtained from Streak Camera
measurements and decay with lifetimes of 6.5 and 2.9 ns for TLN and DMSO,
respectively. The solid lines correspond to stretched exponential fits.
Figure 5-7. Short delay (ps-ns) broadband transient absorption spectra of ID889 solution (a) in
TLN and (b) in DMSO in the visible spectral region at delay time of 1 ps (red), 3ps
(orange), 30 ps (green), and 3000 ps (purple). The pump fluence are 37.56 μJ cm-2
at
510 nm for both measurements. Two blue lines represent the PL spectra of each
sample.
Figure 5-8. Early time dynamics of the exciton-induced absorption at different wavelength
regions: 780-820 nm for ID889 TLN solution (black) and 800-840 nm for ID889
DMSO solution (red).
Figure 5-9. (a) Normalized photoluminescence (PL) decay of ID889 on alumina without
application of Li cations (Sample 1, black scatter) and fitting (red solid line) with a
lifetime of 3.2 ns. PL decay of ID889 on alumina with Li cations (Sample 2, red
squares) and fitting (black solid line) with a lifetime of 1.4 ns. Lifetimes are obtained
from a stretched exponential function. (b) Time-resolved photoluminescence
measurement of ID889 adsorbed on TiO2 layer (Sample 4, black) and with Li cations
(Sample 5, gray). The lifetimes were determined to be 54 and 52 ps for Sample 4 and
5, respectively.
Figure 5-10. The charge distribution of the HOMO (left) and of the LUMO (right) calculated from
TD-DFT.
Figure 5-11. Short delay (ps-ns) broadband TA spectra of Sample 1 (a) and of Sample 2 (b) at
delay times of 1 ps (red), 3 ps (orange), 30 ps (green), and 3000 ps (purple). The pump
fluence at 510 nm is 6.4 μJ cm-2
for the visible and 25.8 μJ cm-2
for the near infrared
measurements in Sample 1. For Sample 2 fluence is 5.9 μJ cm-2
for the visible and
24.2 μJ cm-2
for the near infrared measurements. Two blue lines represent the PL
spectra of each sample.
Figure 5-12. (a) Normalized decay dynamics (long-delay measurement) of CT state absorption
signal between 875 nm and 925 nm in Sample 2 with different pump fluences: 5.9 μJ
cm-2
(black), 12.3 μJ cm-2
(gray), 66.7 μJ cm-2 (light gray), and 83.3 μJ cm
-2 (white).

158
Inset: The dynamics of the PIA signal from Sample 1, 2, and 5 probed at a wavelength
between 875 and 925 nm. (b) Normalized decay dynamics (long-delay measurement)
of the dye cation‟s absorption between 830 nm and 850 nm in Sample 5 with different
pump fluences: 5.5 μJ cm-2
nJ (dark red), 30.1 μJ cm-2
(red), 50.5 μJ cm-2
(pale red)
and 80.7 μJ cm-2
(pink). Inset: The dynamics of the PIA signal from Sample 4 in long-
delay measurements, showing weaker fluence dependence.
Figure 5-13. TA spectra on the femto- to nano-second timescale and PL spectra of Sample 4 (a)
and of Sample 5 (b) at delay times of 1 ps (red), 3 ps (orange), 30 ps (green), and 3000
ps (purple). The pump fluence at 510 nm is 18.5 μJ cm-2
in the visible and 36.0 μJ cm-
2 in the NIR for Sample 4 and 18.5 μJ cm
-2 in the visible and 25.0 μJ cm
-2 in the NIR
for Sample 5. Two blue lines represent the PL spectra of each sample. Insets: TA
spectra of Sample 4 and Sample 5 in the visible normalized to a minimum value of
each spectrum.
Figure 5-14. Normalized decay dynamics (ps-ns) of the dye cation absorption observed between
830 and 850 nm in ID889 on titania (Sample 4, red) and in ID889 on titania plus Li
cations (Sample 5, black). The solid lines correspond to stretched exponential fits for
Sample 4 and 5.
Figure 5-15. Long delay (ns - sub-ms) broadband TA spectra of Sample 4 (a) and of Sample 5 (b)
with delay times of 1 ns (red), 100 ns (orange), 1 μs (green), and 100 μs (purple).
Excitation at 532 nm and energy density of 4.9 μJ cm-2
in the visible and 6.2 μJ cm-2
in the NIR for Sample 4 and of 4.9 μJ cm-2
in the visible and 7.5 μJ cm-2
in the NIR
for Sample 5.
Figure 5-16. Broadband TA spectra of (a) ID889 on TiO2 with Li-TFSI/tBP/spiro-OMeTAD
(complete device structure, Sample 6) and (b) ID889 on TiO2 with tBP/spiro-
OMeTAD (Sample 7) on short-delay time scale (ps - ns) at delay times of 1 ps (red), 3
ps (orange), 30 ps (green), and 3000 ps (purple). The insets: The spectra in the visible
normalized to the maximum value of each spectrum. The pump fluence at 510 nm is
5.75 μJ cm-2
for the visible and 23.3 μJ cm-2
for the infrared measurements in Sample
6 and 14.8 μJ cm-2
for the visible and 11.3 μJ cm-2
for the infrared measurements in
Sample 7.
Figure 5-17. Normalized decay dynamics (short-delay measurement) of the oxidized spiro-
OMeTAD‟s absorption between 1400 - 1430 nm in Sample 6 (closed triangle) and 7
(open triangle) with pump fluences 23.3 μJ cm-2
for Sample 6 and 11.3 μJ cm-2
Sample 7.

159
Figure 5-18. (a) Long delay (ns-sub-ms) broadband TA spectra of Sample 6 (a) and of Sample 7 (b)
with delay times of 1 ns (red), 100 ns (orange), 1 μs (green), and 100 μs (blue).
Excitation at 532 nm and energy density of 45.2 μJ cm-2
in the visible and 51.7 μJ cm-
2 in the NIR for Sample 6 and of 52.7 μJ cm
-2 in the visible and 70.0 μJ cm
-2 in the
NIR for Sample 7.
Figure 5-19. Normalized decay dynamics (long-delay measurement) of the oxidized hole
conductor‟s absorption between 1400 – 1430 nm in Sample 6 (a) and Sample 7 (b)
with different pump fluences.
Figure 5-20. (a) Short delay (ps-ns) broadband transient absorption spectra of ID889 blend sample
(Sample 8) at delay times of 1 ps (red), 15ps (green), 300 ps (blue), and 3000 ps
(purple). The pump fluence at 510 nm is 33.8 μJ cm-2
in the visible and 45.4 μJ cm-2
in
the NIR. The inset: Normalized TA spectra of Sample 8 (black gradients) and of
Sample 3 (red gradients) at delay times of 1 ps, 15 ps, and 4.5 ns as color becomes
pale. (b) Decay dynamics between 1400 – 1430 nm of Sample 3 (red) and 8 (black)
normalized at the delay time of 0.
Figure 5-21. Normalized steady-state absorption of cationic (dotted red)/anionic (dotted black) dye
molecules and normalized TA spectra of Sample 8 (solid black), 5 (solid red), and 3
(solid blue).
Figure 5-22. (a) Spectra of the exciton (solid) and the charges (dotted) in Sample 4 (blue), 5 (red),
and 6 (black) obtained from MCR analysis using the TA data and (b) kinetics of
exciton from Sample 4 (blue), 5 (red), and 6 (black).
Figure 6-1. Molecular structures of FPH 224, 231, 233, and 303 (a), and the HOMO levels
measured by cyclic voltammetry (b).
Figure 6-2. Normalized absorption and emission spectra of 0.1 mM FPH224 (panel a, black), 231
(panel b, red), 233 (panel c, blue), and 303 (panel d, green) in the less polar solvent
TLN (dark) and in more polar solvent THF (pale).
Figure 6-3. Photoluminescence decay transient of 0.1 mM FPH224 (black), 231 (red), 233 (blue),
and 303 (green) solutions in a polar solvent (darker lines, THF) and in a less polar
solvent (lighter lines TLN). The solid lines correspond to stretched-exponential fits.
Figure 6-4. Normalized absorption and emission spectra of FPH224 (panel a), 231 (panel b), 233
(panel c), and 303 (panel d) adsorbed on titania in the presence (black, red, blue, and
green lines) and absence (gray, pink, sky blue, yellow-green lines) of Li cations.
160
Figure 6-5. Normalized photoluminescence decay of (a) FPH224 (black), 231 (red), 233 (blue),
and 303 (green) on alumina in the absence (full) and presence (hollow) of Li-TFSI,
and (b) FPH224, 231, 233, and 303 on titania in the absence (full) and presence
(hollow) of Li-TFSI.
Figure 6-6. Photoluminescence decay curves of (a) FPH224 (black), 233(blue), and 303 (green)
on Al2O3 (solid lines) and on TiO2 (dashed lines), and of (b) dye molecules on TiO2
in the absence (dashed lines) and presence (dotted lines) of Li cation.
Figure 6-7. (a) J-V curves of solid-state DSC using FPH224 (black), 231 (red), 233 (blue), 303
(green), and Z907 (purple) measured under 100 mWcm-2 AM 1.5 G solar intensity
and (b) external quantum efficiency of each device.
Figure 6-8. Quasi-steady-state photoinduced absorption spectra of FPH224 (black), FPH231 (red),
FPH233 (blue), and FPH303 (green) adsorbed on TiO2 (a), of the four dye molecules
on TiO2 after application of Li cations (b), and in device-like structures (c). The
samples were excited at 530 nm with high power LED.
Figure 6-9. Short delay (ps-ns) broadband TA spectra of FPH224 on TiO2 (a), of FPH224 TiO2
after application of Li cations (b), and of FPH224 on TiO2 with Li-TFSI/tBP/spiro-
OMeTAD (complete device structure) at delay times of 3 ps (red), 30 ps (orange),
300 ps (green), and 3 ns (purple). The pump fluence at 520 nm is 5.5 μJ cm-2 for the
visible and 7.0 μJ cm-2
for the near infrared measurements. The two blue lines
represent the PL spectra of each sample.
Figure 6-10. Long delay (ns – μs) broadband transient absorption spectra of (a) FPH224 on TiO2,
and (b) FPH224 on TiO2 after addition of Li-TFSI, and (c) FPH224 device-like
structure in the visible and the NIR spectral region at delay times of 1 ns (red), 100 ns
(orange), 10 μs (green), and 100 μs (purple). The samples were excited at 532 nm with
a pump fluence of 7.2 μJ cm-2
for the visible and 8.0 μJ cm-2
for the NIR
measurements.
Figure 6-11. (a) Fluence dependence of the kinetics between 850 - 900 nm in FPH224 on TiO2
with the Li-TFSI additive. The inset: Fluence dependence on FPH224 adsorbed on
TiO2 at the same wavelength region. (b) Long delay recombination dynamics of the
photoinduced absorption probed at the wavelength regions between 850 – 900 nm in
FPH224 on TiO2 (black), in FPH224 on TiO2 with Li-TFSI salts (dark grey), and in
FPH224 device-like structure (light grey).
Figure 6-12. TA spectra on the femto- to nano-second timescale and PL spectra of FPH233 on
TiO2 (a), of FPH233 on Al2O3 (b), of FPH233 on TiO2 after addition of Li cations (c),

161
and of a FPH233 device-like sample (d) at delay time of 3 ps (red), 30 ps (orange),
300 ps (green), and 3000 ps (purple). The pump fluence at 510 nm is 5.5 μJ cm-2 in
the visible and 7.0 μJ cm-2
in the NIR.
Figure 6-13. Long delay (ns – μs) broadband transient absorption spectra of (a) FPH233 on TiO2,
and (b) FPH233 on TiO2 after addition of Li-TFSI, and (c) FPH233 device-like
structure in the visible and the NIR spectral region at delay times of 1 ns (red), 100 ns
(orange), 10 μs (green), and 100 μs (purple). The samples were excited at 532 nm with
a pump fluence of 7.2 μJ cm-2
for the visible and 8.0 μJ cm-2
for the NIR
measurements.
Figure 6-14. (a) Fluence dependence of the kinetics between 850 - 900 nm in FPH233 on TiO2 with
Li-TFSI additive. The inset: Fluence dependence on FPH233 adsorbed on TiO2. (b)
Long delay recombination dynamics of the photoinduced absorption of dye cations
probed at the wavelength regions between 850 – 900 nm in FPH224 on TiO2 with Li-
TFSI salts (blue) and in FPH224 device-like structure (light blue).
Figure 6-15. TA spectra on the femto- to nano-second timescale of FPH231 on TiO2 (a), of
FPH231 on Al2O3 (b), of FPH231 on TiO2 with Li cations (c), and of the FPH231
device-like structure sample (d) at delay times of 3 ps (red), 30 ps (orange), 300 ps
(green), and 3000 ps (purple). The pump fluence at 510 nm is 5.5 μJ cm-2
in the
visible and 7.0 μJ cm-2
in the NIR.
Figure 6-16. (a) Kinetics of the dye cations in FPH224 and 233 with (darker)/ without (paler) Li
cations in the short-time delay TA measurements. The kinetics are averaged for
FPH224 (black) and 233 (blue) between 850 – 900 nm and between 850 – 900 nm,
and those for FPH224 (grey) and 233 (sky blue) with Li cations are taken from 900 –
950 nm and 900 – 950 nm, respectively. (b) Kinetics of the dye cations in FPH231 on
TiO2 (red, 1150 – 1170 nm), in FPH231 on TiO2 with Li (dark red, 1120 – 1150 nm),
and kinetics of spiro-cations (purple, 1480 – 1500 nm).
Figure 6-17. (a) Transient absorption kinetics of dye cations monitored between 1150 – 1170 nm in
FPH231 on TiO2. Inset: the kinetics of dye cations between 1120 – 1150 nm in
FPH231 on TiO2 with Li cations. (b) Transient absorption kinetics of a solar cell
probed between 1480 – 1500 nm where the spiro cations dominate the photoinduced
absorption.
Figure 6-18. TA spectra on the femto- to nano-second timescale and PL spectra of FPH303 on
TiO2 (a), of FPH303 on Al2O3 (b), of FPH303 on TiO2 with Li-TFSI (c), and of a
FPH303 solar cell (d) at delay times of 1 ps (red), 3 ps (orange), 30 ps (green), and
162
3000 ps (purple). The pump fluence at 510 nm is 5.7 μJ cm-2
in the visible and 7.2 μJ
cm-2
in the NIR. Two blue lines in panel (a) and (c) represent the PL spectra of each
sample.
Figure 6-19. Transient absorption kinetics of (a) FPH303 on Al2O3 (solid green), of FPH303 on
TiO2 (olive scatter), and of FPH303 on TiO2 with the application of Li-TFSI
monitored between 1150 – 1200 nm where the dye cations absorb strongly, and of (b)
the FPH303 device-like sample monitored between 1450 – 1500 nm.
Figure 6-20. Intensity dependence measurement of FPH303 on TiO2 with Li cations for the
wavelength between 1150 – 1200 nm. The inset: Intensity dependence measurement
of FPH303 on TiO2 for the same wavelength.
Figure 6-21. Transient absorption kinetics of (a) dye cations measured with samples of the dye
adsorbed on TiO2 after addition of Li cations and of (b) spiro cations in the solar cell-
like samples. FPH224, 231, 233, and 303 are represented in black, red, blue, green
lines, respectively. The inset shows the dynamics of spiro cations in long-time delay
measurements.
Figure 7-1. Schematic diagram representing factors that affect the power conversion efficiency.