Embed Size (px)
Citation preview
PHOTOBIOMODULATION PROTECTS THE RETINA FROM LIGHT-INDUCED PHOTORECEPTOR DEGENERATION
Rizalyn Albarracin1,2 Janis Eells4 and Krisztina Valter1,2,3
From the 1Research School of Biology, 2ARC Centre of Excellence in Vision Science,
3Medical School, The Australian National University, Canberra, Australia, 4Department of
Biomedical Sciences University of Wisconsin, Milwaukee, USA
Corresponding Author: Krisztina Valter Division of Biomedical Sciences & Biochemistry Research School of Biology The Australian National University GPO Box 475 Canberra ACT 2601 [email protected]
Word Count: 9875
Grant Support: This research was supported by the Australian Research Council
through the ARC Centre of Excellence in Vision Science (CE0561903) and the Foundation
for Fighting Blindness (FFB TA-NP-1107-0435-UWI).
p p
2
ABSTRACT
PURPOSE. We tested the hypothesis that near-infrared (NIR) light treatment
(photobiomodulation) would attenuate bright light damage in the albino rat retina.
METHODS. Young adult Sprague-Dawley (SD) albino rats were raised in dim (5lx) cyclic
light then exposed to bright (1000lx) continuous light for 24h. Animals were treated with
670nm light (9J/cm2) using an LED array before, during or after light exposure. Retinas
were examined for function, structural changes, cell loss, and markers of stress and
inflammation at 1week and 1month after exposure to damaging white light. RESULTS.
Bright light caused photoreceptor-specific cell death in control retinas. Significant up-
regulation of stress and neuroprotective factors, and the presence of activated microglia
was also noted following light damage. Photobiomodulation profoundly attenuated
histopathological alterations in all three treatment groups. NIR treatment also abolished
microglial invasion of the retina and significantly reduced the presence of stress and
neuroprotectant molecules. Bright light-induced reductions in photoreceptor function were
significantly ameliorated by photobiomodulation in animals treated before and during light
damage. Photoreceptor function was initially reduced in animals treated following bright
light damage but recovered by one-month post exposure. CONCLUSIONS. NIR
photobiomodulation is protective against bright light-induced retinal degeneration even
when NIR treatment is applied after light exposure. This protective effect appears to
involve a reduction of cell death and inflammation. Photobiomodulation has the potential to
become an important treatment modality to prevent or treat light-induced stress in the
retina. More generally, it could be beneficial in the prevention and treatment of retinal
conditions involving inflammatory mechanisms.
3
INTRODUCTION
It has been known since the 1960’s that exposure to excessive light causes
photoreceptor damage and death1, 2. The severity of damage depends on multiple factors,
including the intensity or the spectral distribution of the light, the duration of exposure, the
retina’s history of previous light experience3, 4. Lesions produced by light damage (LD) are
characterized by the damage or death of photoreceptors, the disorganisation or loss of
RPE cells, Muller cell gliosis, the disruption of the outer limiting membrane (OLM), and the
obstruction of the underlying choroidal vessels. These structural changes are
accompanied by the accumulation of microglia and lymphocytes in the retinal and
choroidal vessels, typically in areas with the most severe damage. Once the blood-retina
barrier (BRB) is disrupted, the invasion of the outer retina by activated microglia becomes
apparent5-9.
Photobiomodulation is the process, by which specific wavelengths of light are
absorbed by cellular photo-acceptor molecules resulting in the activation of signalling
pathways culminating in biological changes in the cell. A typical example would be the
absorption of light by chlorophyll in plants, initiating photosynthesis. In animals, light
absorbed by opsins, initiates phototransduction in photoreceptors. Apart from these
specialised photoreceptor molecules, there are more than 50 non-specialised photo-
acceptor molecules in mammalian cells. Water, haemoglobin, oxyhaemoglobin and
melanin all absorb light at a wide range of wavelengths. Between 600-1000nm
wavelengths however, their absorption curve is at the minimum, providing a ‘window’ for
other photosensitive molecules to be activated by light10. Cytochrome c oxidase, the
terminal electron-acceptor in the mitochondrial electron transport chain, is a key
photoacceptor molecule which has been shown to be activated by far-red to NIR light
leading to biological changes11, 12.
4
The cellular responses to light in the range of far-red to near-infrared photon therapy
include an increase in metabolic rate, cell migration and proliferation and the production
and secretion of proteins. Zhang and colleagues have demonstrated changes in gene
expression profiles in human fibroblasts following exposure to 628nm light for 3 days,
describing up-regulation in mitochondrial respiratory chain and antioxidant genes, and
down-regulation in some apoptosis and stress response genes13. Among the proteins,
some neuro-protective factors, including basic fibroblast growth factor (FGF2) and nerve
growth factor (NGF) have been shown to be up-regulated14. The use of 670nm light has
also been demonstrated to protect neuronal cells after cyanide or TTX poisoning12.
In vivo experiments showed improved quality of wound healing in rat skin when
treated with low-energy ruby laser15 or with Gallium laser at 685 or 830nm light16.
Following spinal cord injury, the use of 810nm light resulted in increased regeneration and
functional recovery in the rat17. Eells and colleagues showed that 670nm LED light was
protective to photoreceptors in the methanol-induced degeneration rat model18, others
demonstrated that NIR light promoted healing after laser lesions in primate retina19.
Clinically, the use of NIR light has been shown to be beneficial in the treatment of
gingival incisions20, post-transplantational oral mucositis21, radiation ulcers of the skin22,
acne vulgaris dermatitis23. It promoted wound healing24, peripheral nerve repair following
trauma25-27 and in carpal tunnel syndrome28, 29. NIR treatment is also used in sport
medicine and rehabilitation to treat acute soft tissue injuries30. It is worth noting that the
presence of inflammation is common to these conditions.
Inflammatory events are present in the light-stressed retina5, 6, 9. Moreover, anti-
inflammatory measures such as the administration of microglial inhibitor Naloxone, have
been shown to reduce light-induced damage in the retina31, 32, indicating that inflammation
is a critical factor in this model. The purpose of this investigation was to test the hypothesis
5
that 670nm photobiomodulation will ameliorate light-induced retinal damage and modulate
cellular immune response in the rat retina.
MATERIALS AND METHODS
Animals
All procedures were in accordance with the ARVO Statement for the Use of Animals
in Ophthalmic and Vision Research, and with the requirements of The Australian National
University Animal Experimentation Ethics Committee. Albino Sprague-Dawley (SD) rats
were born and raised in low (5lx) light levels with a 12h light, 12h dark cycle. Food and
water were available ad libitum. Once animals reached P100-P120, they were divided into
6 groups. Three groups were designed to serve as baseline comparisons. In the first group
animals were not exposed to either NIR or damaging white light (CONTROL group, n=16).
In the second group, animals were exposed to damaging white light only (LD group, n=16)
and in the third group they were exposed to NIR light only (NIR CONTROL group, n=16).
In the remaining groups animals were exposed to damaging bright white light (BL) as well
as treated with NIR following one of three paradigms described below.
Light Damage
Animals (n=19) were transferred to individual transparent cages with food placed on
the cage floor and water was provided in transparent bottles to avoid shading of the light
entering the cage. Fluorescent light tubes (18W, Cool White) were placed 200mm above
the bottom of the cage, so that the light intensity reached 1000lx at the cage floor. Prior to
light exposure animals were dark adapted overnight. Light exposure started at 9:00AM in
all experimental paradigms. Animals were exposed to bright light for 24 hours and then
returned to low light level environment (5lux) to recover for 1 week or 1 month.
6
NIR Treatment Paradigms
Animals were wrapped in a cloth to aid manual handling, and placed under the
670nm LED array (Quantum Devices, WI, USA). Animals were positioned so that their eye
level was approximately 2.5cm away from the light source and were exposed to the light
for 3 minutes at 60mW/cm2. This treatment protocol produced an energy fluence of 9J/cm2
at eye level. The first group of animals were treated with NIR 1x daily on 5 consecutive
days prior to BL (Pre-conditioned group, n=16). The second group was treated
immediately after the cessation of BL once a day for 5 days (Post-conditioned group,
n=16). The third group was treated 1 day prior to BL, then 2x daily during and immediately
after BL (Mid-conditioned group, n=16). In the NIR Control group animals were treated
with NIR light once daily for 5 days but were not exposed to BL (NIR Control group, n=16).
Some animals (n=3) were sham-treated prior to exposure to bright light. They were
wrapped in towel and kept under an unswitched LED array box for 3 minutes.
Electroretinography
The function of photoreceptors was assessed by full-field flash-evoked
electroretinogram (ERG). Animals were dark-adapted overnight and prepared for recording
in dim red illumination as described previously33-35.
A series of single flashes of sufficient intensity to elicit saturated a-wave and b-wave
responses (44.5cds/m2) was used to record ‘mixed’ responses to assess both rod and
cone photoreceptor function. As previously reported, the a-wave represents rod function in
these ‘mixed’ responses36, 37. All animals were recorded prior to the commencement of
experimental procedures (Baseline recording) and then 1week (n=8/group) or 1 month
(n=8/group) after BL exposure, regardless of NIR treatment paradigm.
7
Tissue Collection
Tissue was collected 1 week or 1 month following BL exposure for histological and
immunohistochemical evaluation. Animals were euthanized with an overdose of sodium
pentobarbital (>60 mg/kg, intraperitoneal). Eyes were marked at the superior aspect of the
limbus for orientation, enucleated and immersion-fixed in 4% paraformaldehyde in 0.1 M
phosphate-buffered saline (PBS) at pH 7.4 for 2 h.
To prepare for cryosectioning, eyes were rinsed thrice in 0.1 M PBS and left in a 15%
sucrose solution overnight for cryoprotection. The next day, eyes were embedded in
Tissue-Tek OCT Compound (Sakura Finetek, Tokyo, Japan), and snap frozen in liquid
nitrogen. They were cryosectioned in the sagittal plane, to allow a dorsal to ventral
observation of the retina at 16μm or 60μm using Leica CM1850 cryostat (Leica
Microsystems, Nossloch, Germany). Sections were mounted on gelatin and poly-L-lysine-
coated slides and dried overnight at 50ºC before being stored at -20ºC.
Histology and Structural Measurements
Toluidine Blue Staining
To evaluate structural changes in the retina, Toluidine Blue staining was performed.
Sections were immersed in 70% ethanol for 5 min for dehydration. The slides were then
washed with H2O for 5 min before 2 drops of 1% Toluidine Blue were added and left to
stain the sections for 5 min. Once the sections had taken a purple blue colour, the sections
were immediately washed with H2O. The stained sections were cover slipped in glycerol-
gelatin medium (Sigma Chemical Co., St. Louis, MO, USA).
Retinal Thickness Measurements
To assess retinal thickness, cryosections were labelled with the DNA-specific dye
bisbenzamide (Hoechst). Sections were thawed at room temperature before washing in
8
70% ethanol for 15 min, followed by a 5 min wash in distilled H2O and two 5 min washes in
0.1 M PBS. The sections were then incubated for 2 min with bisbenzamide (1:10 000),
washed in 0.1 M PBS, and cover slipped with a glycerol/gelatin medium. Retinal thickness
measurements were made on digital images of stained cryosections. At each location, we
recorded the thickness of the outer nuclear layer (ONL), as well as the thickness of the
retina, from inner to outer limiting membrane (ILM-OLM). The ratio of ONL and ILM-OLM
was used for analysis to account for obliquely-cut sections. In at least 4 sections per
animal, we took 10 measurements from each section, approximately 100μm apart along
the retina, (a total of 40 measurements per animal). Results from 8 animals from each
group were averaged and analysed by the statistical method described below.
OS lengths measurement
Quantitative analysis of the length of the OS (outer segments) was performed in
tissues cryosectioned at 60μm labelled with Toluidine Blue. Sections were examined and
measured using LM-Zeiss Axioskop (Jena, Germany) with Spot CCD camera (MI, USA)
with a calibrated 40X objective. Images were taken from both superior and inferior retina
(n=4). Spot CCD software was used to trace the length of the OS with a mean 3 equi-
spaced measurements taken from each area. The average OS length from 4 animals was
used for statistical analysis.
Immunohistochemistry of Retinal Sections
Cryosections were labelled with antibodies against glial fibrillary acidic protein
(GFAP, rabbit polyclonal) (1:700, DAKO, CA, USA), basic fibroblast growth factor (FGF-2,
mouse monoclonal) (1:200, Upstate Biotechnology, USA), ciliary neurotrophic factor
(CNTF, goat polyclonal) (1:200, R&D Systems, MN, USA), ionized calcium binding adaptor
molecule 1, (IBA1, mouse monoclonal) (1:500, Abcam, MA, USA) and CD68, also known
9
as ED-1, (mouse anti-rat monoclonal, 1:200, Millipore, CA, USA) using a protocol
previously described35. Briefly, sections were blocked with 10% normal goat serum for 1 h
before being incubated with primary antibody for 24 h at 4ºC. Sections were treated with
an antibody to either rabbit IgG conjugated with Alexa Fluor 594 or mouse IgG conjugated
with Alexa Fluor 488 (1:1000, Molecular Probes, OR, USA) for 24 h at 4ºC before
incubation with the DNA-specific dye bisbenzamide (1:10 000) for 2 min.
RNA Isolation and cDNA Synthesis
Retinas were collected and stored in RNAlater® (Ambion, Applied Biosystems,
Foster City, CA) overnight at 4ºC. RNA isolation was then performed using TRIzol
Reagent (Invitrogen, Carlsbad, CA). The retinas were homogenised in 1.5ml tube with
200μl of Trizol on ice, followed by further addition of 660μl Trizol and 160μl chloroform.
The tube was vortexed for 20s, allowed to stand for 7 minutes at room temperature and
then centrifuged at 13,000x g for 10 minutes at 4ºC. The resulting supernatant was
subsequently removed and transferred into a clean 1.5ml tube with half of its volume of
100% absolute ethanol. The tube with its content was vortexed briefly prior to performing
purification and DNAse treatment steps, as outlined in the RNAqueous-micro kit protocol
(Ambion, Applied Biosystems Foster City, CA). The purified and DNAse-treated RNA was
quantified on a spectrophotometer (ND-1000; Nanodrop Technologies, Wilmington, DE)
followed by analysis of its integrity using a bioanalyser (2100 Bioanalyzer; Agilent
Technologies, Santa Clara, CA). The synthesis of cDNA was achieved by reverse
transcribing 1μg of total RNA using the Superscript® III Reverse Transcriptase First Strand
Synthesis kit following the prescribed manufacturer’s protocol (Invitrogen Life
Technologies, Carlsbad, CA).
10
Real Time Quantitative Polymerase Chain Reaction (RT-qPCR)
Validation of the changes in expression of stress-related Gfap and protective Fgf-2
genes were determined by RT-qPCR using Taqman® probe IDs Rn00566603_m1 for Gfap
and Rn00570809_m1 for Fgf-2, combined with the Gene Expression Master-Mix (Applied
Biosystems, Foster City, CA) with the use of StepOne Plus qPCR machine with the
StepOne software v2.1 (Applied Biosystems). Glyceraldehyde 3-phosphate
dehydrogenase (Gapdh) was used as a reference gene. To account for variability, Taqman
amplification assay was performed in duplicates (individual sample variability) with
triplicate biological samples to account for individual animal differences. The fold changes
were determined using comparative cycle threshold (Ct; delta-delta ct).
Microscopy
Images of the immuno-labelled retinal sections were obtained using Carl Zeiss
confocal microscope (Germany) and LM Zeiss Apotome (Germany). Only samples that
were processed and imaged concurrently were used for analysis. During image collection,
the photomultiplier settings were kept constant to allow more accurate comparison of
protein levels.
Statistical Analyses
Data were analyzed using a two-tailed Student’s t-test with P<0.05 considered to
represent a statistically significant difference. All data are presented as the mean ±1 SEM.
11
RESULTS
NIR photobiomodulation preserved retinal structure in all 3 treatment
paradigms
Figure 1A depicts retinas of animals not exposed to BL nor treated with NIR (control),
animals exposed to BL (LD), animals not exposed to BL, but treated with NIR (NIR
treated), and animals exposed to BL and treated with NIR following one of the three
treatment paradigms (Precon, Midcon, Postcon). Histological labelling of cryosections with
Toluidine blue showed that exposure to BL led to structural damage in the outer retina (Fig
1A, B). The severity of the damage was uneven along the retina. One week after light
exposure, an area of high-density cell death was detectable 1-2mm supero-temporal to the
optic disc (depicted in Figure 1A, C) that exhibited significant thinning of the ONL in BL-
exposed, non-treated retinas. In this area both inner (IS) and outer segments (OS) were
lost and only a few rows of photoreceptors remained. The retina was severely distorted,
the outer limiting membrane and the retinal pigment epithelial cell row were disrupted and
the BRB appeared to be compromised (Fig 1A & B ‘LD’). Similar pattern and severity of
structural damage was observed in LD-exposed retinas with sham NIR treatment.
Quantitative analyses indicate that there were no significant differences in the OS lengths
and ONL thickness between the non-treated and sham NIR-treated retinas with LD
exposure. In areas, outside this “hot spot”, the retinal changes were minor, limited to the
shortening and distortion of the photoreceptor outer segments (not shown). These images
demonstrate that NIR treatment alone did not cause any structural alterations in the retina.
In light-exposed retinas treated with NIR, the preservation of the ONL was evident,
whereas the IS/OS were only slightly shortened and mildly disrupted in all three treatment
paradigms.

12
The cumulative effect of photoreceptor cell death was assessed by the measurement
of the outer nuclear layer (ONL) thickness (Fig 1C). Toluidine blue staining was used to
detect surviving cells 1 week after BL exposure (Fig 1A). The panel depicting a BL
exposed non-treated retina shows a severe disruption and reduction of the photoreceptor
population in the hot spot area (Fig 1A, B ‘LD’). NIR treatment of BL-exposed retinas
profoundly attenuated photoreceptor cell loss in all treatment paradigms. Figure 1C shows
the average ONL thickness along the retina in 8 animals in each treatment group. BL
exposed, non-treated retinas showed a significant thinning of the ONL in all areas of the
retina; in the inferior retina, there was a 25% loss, while in the superior retina there was a
50% reduction of thickness, and in the hot spot area ONL thickness was reduced by 75%
compared to controls. NIR-treated BL exposed animals exhibited a small decrease in ONL
thickness. However, ONL thickness in NIR-treated BL-exposed animals was not
statistically different from values measured in Control animals.
Figure 1D shows the average OS length values along the retina for 8 animals in each
group 1 week after BL exposure. In BL exposed animals, OS length was close to 60%
shorter in the inferior retina when compared to corresponding areas of control retinas, and
70-75% shorter in the penumbra of the hot spot in the superior retina compared to
controls, with a complete loss of the IS/OS in the hot spot area. NIR treatment ameliorated
OS damage in BL exposed animals. In the pre-conditioned group OS lengths were not
significantly different from control animals not exposed to BL. Retinas in the mid-
conditioned group exhibited an approximately 25% decrease in OS length compared to
control. In the post-conditioned group, OS length was reduced to 50% of non-BL control
values. In the hotspot region, the length of OS dropped by around 60%, however there
was no complete loss of OS at any of the retinas in this group.
13
NIR photobiomodulation attenuated LD-induced retinal functional loss
Figure 2 summarises the changes in photoreceptor function 1 week after exposure to BL.
Panel A shows typical recordings of selected animals from each group. Dotted lines show
baseline recording and solid lines show post-BL recordings of the same animals. Grey
lines represent non-treated BL-exposed animals, black lines represent NIR treated light-
stressed retinas 1 week post-exposure. The figure also demonstrates that there was a
significant loss of retinal function following BL exposure in preconditioned and
midconditioned animals, however, the NIR treated animal exhibited a more moderate loss
compared to the non-treated animal, showing significantly better photoreceptor function
when compared to LD group. In the post-conditioned group, at 1 week after BL,
photoreceptor function of NIR treated animals was indistinguishable from that of non-
treated LD animals.
Figure 2B shows the average a-wave amplitudes assessed by the dark-adapted full-field
flash ERG in 8 animals in all experimental groups. Changes were expressed as the ratio of
amplitudes measured 1 week after BL exposure and amplitudes measured pre-exposure
on the same animal, thus a value of 1 represent no change. NIR treatment alone did not
have a significant effect on photoreceptor function. Retinas, exposed to BL but not treated
with NIR showed a significant loss of photoreceptor function, decreasing to less than 20%
of baseline value 1 week after BL exposure. In the NIR treated groups the effect of BL on
photoreceptor function varied. In the pre-conditioned group, the amplitude of a-wave
decreased to 56% of baseline values 1 week after BL. Although the decrease from
baseline was significant, the post LD values of the a-waves in the NIR pre-conditioned
group were significantly greater than that measured in the LD group. In the NIR mid-
conditioned group, photoreceptor function was reduced to 60% of baseline values
indicative of photoreceptor protection compared to the LD group. The NIR post-
14
conditioned group exhibited significant photoreceptor dysfunction relative to baseline
recordings. In this group, there was a 70% reduction in the a-wave amplitude at 7 days
post LD. The relative a-wave amplitudes of the NIR post-conditioned group were not
significantly different from those measured in the non-treated BL group, thus NIR post-
conditioning did not offer functional protection for photoreceptors at this early stage.
The effects of NIR treatment on the functional response downstream from the
photoreceptors was also assessed by measuring the b-wave amplitudes in NIR-treated
retinas 7d after LD exposure. The relative b-wave amplitude was analysed and presented
in the same manner as the relative a-wave values were assessed (please refer to previous
section). As shown in Figure 2C, b-wave response in the non-treated LD retinas was
reduced by 73% from the baseline value. There was a slight variation observed in
responses in b-wave amplitudes from the retinas in NIR-treated groups. The reduction of
b-wave response in the Midconditioned retina was only 20% while the Precon group
showed 30% loss of b-wave amplitude. Conversely, the Postcon retinas showed the most
severe reduction, b-wave response reaching 30% of control values, a level similar to the
non-treated LD retina. There was no change observed in the NIR-treated only control.
NIR photobiomodulation mitigated retinal stress and modulated
neuroprotectant regulation
We observed the levels of two known retino-protectant proteins, ciliary neurotrophic
factor (CNTF) and basic fibroblast growth factor (FGF-2) and the glial fibrillary acidic
protein (GFAP), a known stress marker, following light exposure and assessed the effects
of NIR on these protein levels. Ciliary neurotrophic factor was not detectable in the normal
retina. Treatment with NIR alone did not change the pattern of protein expression and did
not increase its concentration. Following light exposure, there was an up-regulation of
protein levels in astrocytes, and Muller cells, exhibiting a strong, punctate labelling along
15
the Muller cell processes. In the penumbra of the hot spot, CNTF labelling in the retinal
tissue was limited to the OS’s of photoreceptors. In animals exposed to BL and treated
with NIR, CNTF protein up-regulation varied. The least up-regulation was found in the
preconditioned group where CNTF was barely detectable in the retinal tissue. Retinas of
the mid-conditioned group showed stronger presence of the protein, localised in the OS’s.
Retinas of the postconditioned group demonstrated the strongest up-regulation in the
photoreceptor OS layer and the astrocytes, where the labelling showed similar pattern and
intensity found in the penumbra region of the control retina (Fig 3D).
GFAP labelling was limited to astrocytes, in the innermost layer of the retina in
healthy retinas. In control animals and in animals treated with NIR alone, GFAP labelling
showed normal pattern as demonstrated in Fig 3C in red. In light-stressed retinas, labelling
of Muller cell processes became apparent. In non-treated, BL-exposed retinas a strong up-
regulation of GFAP was detectable in astrocytes and in Muller cells 1 week after light
exposure. Labelling was most prominent in the hot spot, where the entire Muller cell
became GFAP+ from the inner limiting membrane to the outer retina and the subretinal
space, where activated Muller cells started to form glial scar (Fig 3C, red). In regions
outside the hot spot, labelling was present in the Muller cells but was more muted (not
shown).
In the NIR treated animals, in all three treatment paradigms, GFAP labelling was up-
regulated and was present in the Muller cells, but localised to the inner layers of the retina
predominantly, not reaching the outer processes of Muller cells. However, there was a
noticeable gradient between treatment paradigms, with a more moderate change in the
pre-conditioned and mid-conditioned animals, and a more significant up-regulation in the
post-conditioned animals, though even here, the levels of GFAP regulation did not reach
the levels found in non-treated BL-exposed animals.
16
FGF-2 is normally present in retinal macroglia (Muller cells and astrocytes), ganglion
cells and RPE, but not in photoreceptors38-40. In control retinas, FGF-2 labelling was
prominent in the Muller cell bodies, in the INL (Fig 3C, green). Following exposure to
damaging light, FGF-2 protein was up-regulated in the ONL. This up-regulation was noted
along the retina, but was most prominent in the hot spot.
NIR treatment alone did not cause a change in FGF-2 protein expression. In animals
from the pre-conditioned group, FGF-2 up-regulation was not detected in the ONL. In the
mid-conditioned group only a moderate increase in FGF-2 labelling was detectable in the
INL and ONL of the hot spot region, but not outside this area. There was a significant up-
regulation of FGF-2 protein in the ONL. In the post-conditioned group, similar to the one
seen in control light-exposed retinas.
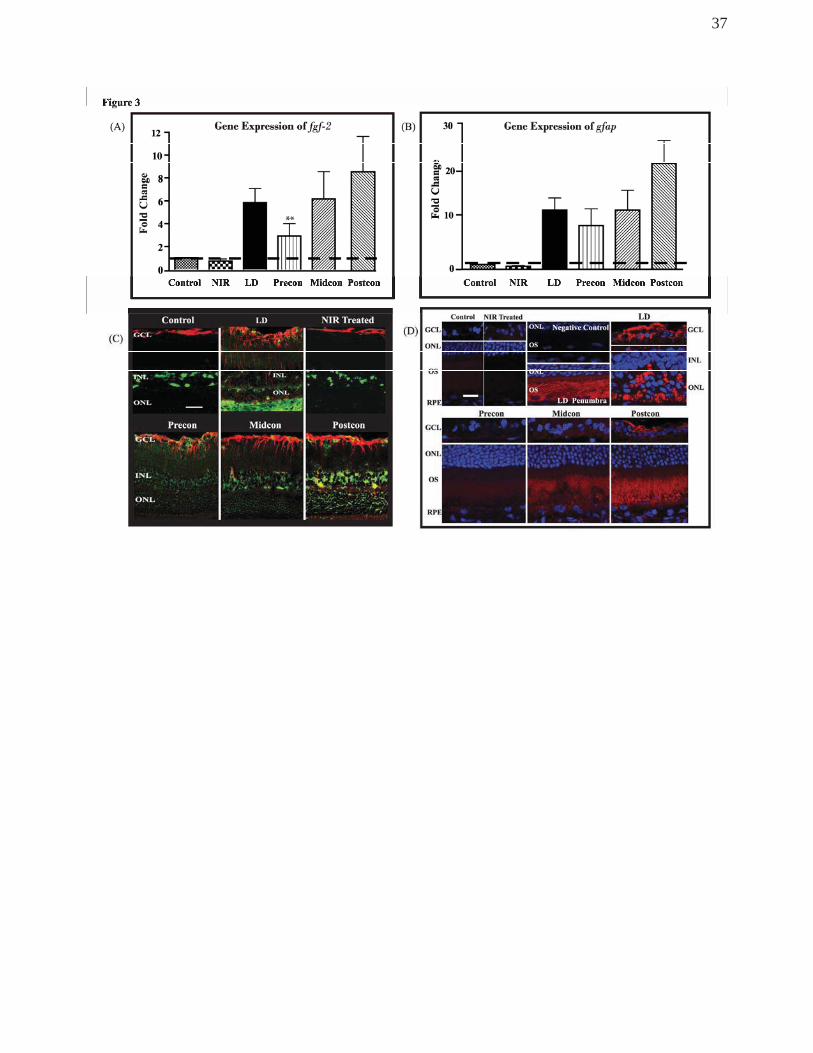
To validate the expression of the FGF-2 and GFAP proteins described in the
previous sections, the regulatory effects of NIR treatment in Gfap and Fgf-2 genes were
assessed quantitatively 1 week post BL exposure using RT-qPCR. We observed an
increase in gene expression of both Fgf-2 and Gfap of both light exposure and NIR treated
retinae. Figure 3A shows that in the non-treated LD retina, there was a 5.8-fold increase in
the expression of Fgf-2 gene. However, the NIR-treated groups exhibited varied levels of
upregulation. There was a 3-fold increase in the Precon, 6.2-fold in Midcon and Postcon
groups generated an 8.7-fold upregulation. When compared to the non-treated LD retina,
Precon group showed a significant difference. There was no change observed in the level
of expression of Fgf-2 gene in the NIR-treated control. Similar pattern of gene expression
was observed in the stress-related Gfap gene following LD exposure and NIR treatment
(Figure 3B). An increase of 12.2-fold was seen in the non-treated, light-stressed retina
(LD) while the upregulation in Precon was slightly down to 8.9-fold, and a more modest
17
increase of 12-fold in the Midcon-treated retinas and 21.8-fold in the Postcon group
(Figure 3B). No fold change was observed in the NIR-treated control group.
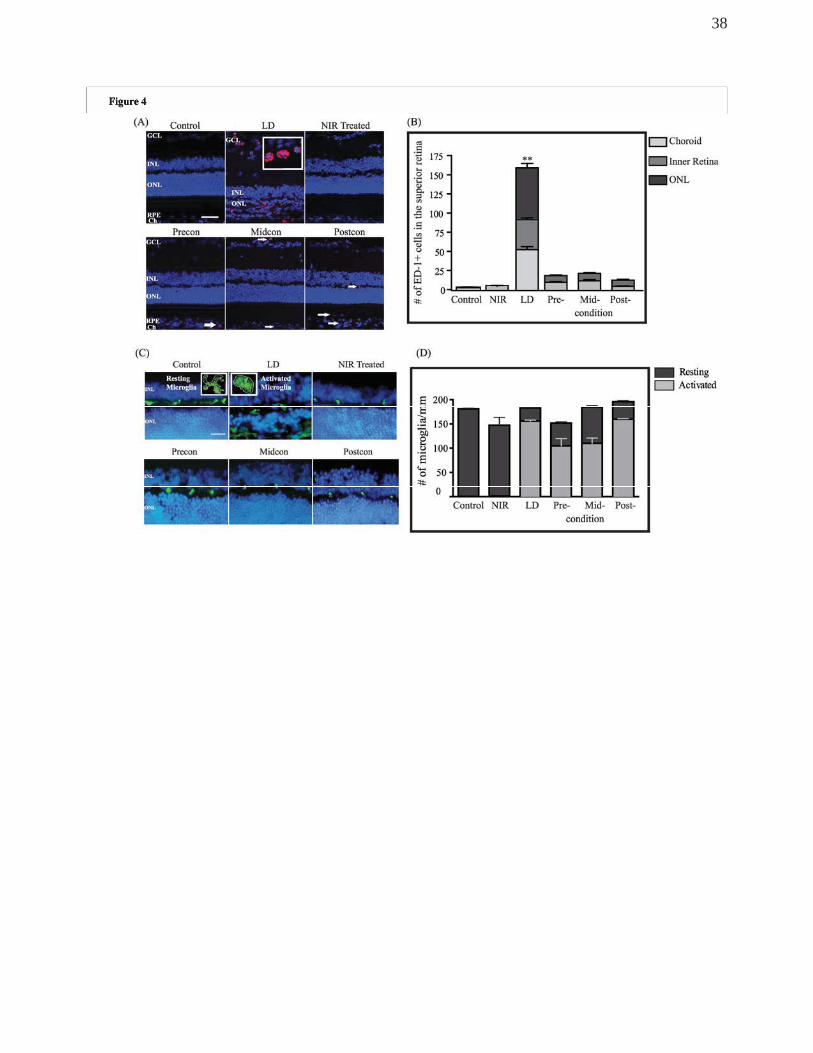
NIR light treatment mitigated light-induced inflammatory reaction
Antibodies against ED-1, macrophage and monocyte marker and IBA1, a microglia
marker were used to assess the presence of inflammatory cells in the light-stressed retina
(Figure 4). In control non-BL exposed non-treated animals, very few monocytes were seen
and those present were limited to the choroidal vessels. In BL-exposed retinas, monocytes
were detectable in both the choroidal and retinal vessels in the area of the incipient hot
spot immediately after BL exposure. By 1 week post-exposure, a breakdown of the blood-
retina barrier was apparent in the hot spot area, where monocytes invaded the retinal
tissue and were present in the severely damaged ONL (Figure 4A). NIR treatment alone
did not change monocyte numbers in the choroidal, retinal vessels or in retinal tissue. In
BL-exposed, NIR-treated animals, there was a slight increase in monocyte numbers both
in retinal and choroidal vasculature, however this increase was significantly less than the
level seen in light-exposed control animals. In addition, retinal invasion of
macrophages/monocytes was not detectable in any of the treated animals (Figure 4A).
Quantitative assessment of monocyte population was performed by counting ED-1+
profiles in different layers of the retina and in the choroid of 4 animals in each experimental
group and summarised in the graph (Figure 4B). Light exposure caused a significant
increase in the presence of monocytes in the choroid and inner retina as well as in the
severely damaged ONL of the hot spot. Although, there was a slight increase in the
number of monocytes both in the choroidal and retinal vessels in the NIR treated light-
stressed retinas, this increase was significantly less than in non-treated, BL exposed
retinas. Moreover, there were no ED-1+ profiles present in the retinal tissue in any of the
NIR-treated retinas.
18
To establish the source of the activated microglia present in the retina, IBA1 labelling
was performed (Figure 4C). This antibody can detect a protein specifically expressed in
microglia and macrophages and to discriminate resting and activated microglia. Figure 4C
shows the distribution of microglia in the retina. In control retinas, microglia present in
choroidal and retinal vessels exhibited a ramified appearance, typical to resting microglial
cells. After exposure to BL, the majority of microglial cells that were detected in the retina
showed amoeboid configuration, typical to cells in an activated phase. When we quantified
resting and activated microglia in the retina, as shown in Figure 4D, we found that NIR
treatment alone did not change the numbers or the activity status of microglia when
compared to control. Following exposure to BL, the number of microglia did not increase
significantly, however, the ratio of activated cells increased significantly, reaching 85% of
all microglia present. In the preconditioned and midconditioned groups the ratio of
activated cells increased significantly, though it only reached 66 and 57% respectively, of
the total microglial population detected. In the postconditioned group, the number of
microglial cells and the ratio of activated cell within their population were similar to the non-
treated BL-exposed group.
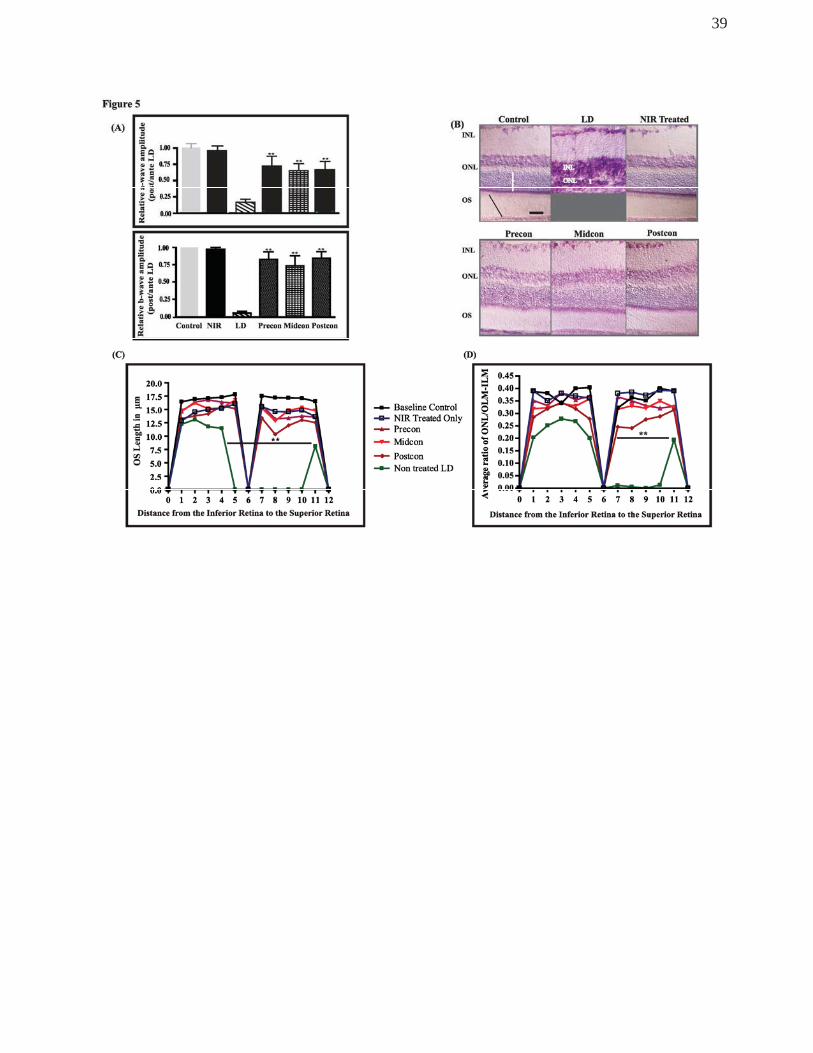
Long-term effects of NIR treatment on the light-stressed retina
To gauge the extent of the protective effect of NIR treatment, we assessed retinas 1
month after BL exposure. Figure 5A summarises photoreceptor function in all 6
experimental groups, expressed as the average of ratio of post- and pre-exposure
amplitude values for each animal, thus the value of 1 means no change. Again, NIR
treatment alone showed no significant effect on photoreceptor function. In the light
exposed but non-treated group, the average a-wave amplitude (top panel) fell to less than
15% of the pre-exposure value, which was not significantly different from values found at
the 1 week timepoint. The preconditioned group showed a mild improvement from the 1
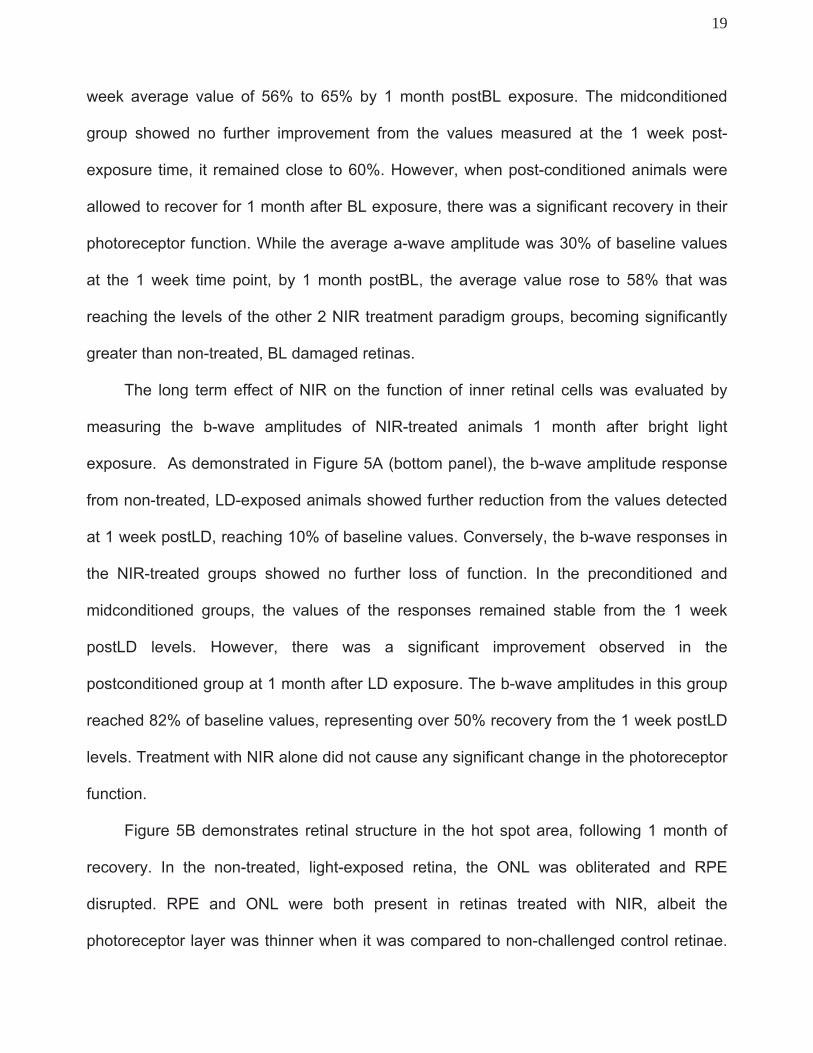
19
week average value of 56% to 65% by 1 month postBL exposure. The midconditioned
group showed no further improvement from the values measured at the 1 week post-
exposure time, it remained close to 60%. However, when post-conditioned animals were
allowed to recover for 1 month after BL exposure, there was a significant recovery in their
photoreceptor function. While the average a-wave amplitude was 30% of baseline values
at the 1 week time point, by 1 month postBL, the average value rose to 58% that was
reaching the levels of the other 2 NIR treatment paradigm groups, becoming significantly
greater than non-treated, BL damaged retinas.
The long term effect of NIR on the function of inner retinal cells was evaluated by
measuring the b-wave amplitudes of NIR-treated animals 1 month after bright light
exposure. As demonstrated in Figure 5A (bottom panel), the b-wave amplitude response
from non-treated, LD-exposed animals showed further reduction from the values detected
at 1 week postLD, reaching 10% of baseline values. Conversely, the b-wave responses in
the NIR-treated groups showed no further loss of function. In the preconditioned and
midconditioned groups, the values of the responses remained stable from the 1 week
postLD levels. However, there was a significant improvement observed in the
postconditioned group at 1 month after LD exposure. The b-wave amplitudes in this group
reached 82% of baseline values, representing over 50% recovery from the 1 week postLD
levels. Treatment with NIR alone did not cause any significant change in the photoreceptor
function.
Figure 5B demonstrates retinal structure in the hot spot area, following 1 month of
recovery. In the non-treated, light-exposed retina, the ONL was obliterated and RPE
disrupted. RPE and ONL were both present in retinas treated with NIR, albeit the
photoreceptor layer was thinner when it was compared to non-challenged control retinae.
20
The outer segments showed organised appearance, compared to the disturbances
observed in the midconditioned and postconditioned groups 1 week postBL.
Outer segment lengths measurements (Figure 5C) showed that, there was a total
loss of OS’s in a wide area of the BL exposed retina, spanning over 5mm length and
centered by the original hot spot area. In the NIR-treated groups, the length of the OS’s
was reduced compared to control retinas, but was significantly longer compared to the
non-treated light-exposed retina. Moreover, OS’s were present along the retina in all three
treatment groups.
To assess the cumulative effect of light and NIR treatment on the photoreceptor
population, we measured the ONL thickness in all groups (Figure 5D). In the LD group,
photoreceptor cells were lost in a large, 4mm long area in the superior retina extending
from the original hot spot area, whereas, there was a more moderate thinning of the ONL
in the rest of the retina. The ONL thickness did not change greatly from the 1 week time
point, in the NIR-treated retinas.
DISCUSSION
Bright white light induced retinal damage
Our findings in retinas exposed to bright continuous light for 24 hours are consistent
with those reported in the literature. Three major events, characteristic of light-induced
retinal damage are 1.) wide-spread death of photoreceptors, 2.) degeneration of pigment
epithelial cells and 3.) reduction or total extinction of the ERG2,41. Rapp and Williams
reported on the variable sensitivity of retinal regions to light42. Typically, the superior
central portion of the retina shows a higher sensitivity than other areas9, 42-44. This region
has been shown to contain the highest concentration of ganglion cells45, and
photoreceptors in this area possess longer outer segments46, which renders this part of the

21
retina the functional area centralis in the rat. Recently we reported that in the light damage
paradigm used in this study, the most severe, irreversible damage occurred in this central
area of the retina. Moreover, severe, acute damage became the centre of a progressive
degeneration9.
670nm photobiomodulation induced retinoprotection
This study demonstrated that 670nm photobiomodulation ameliorates the damaging
effects of bright continuous light on the retina. Treatment with 670nm light before, during or
even after exposure to BL led to a significant reduction in photoreceptor cell death and
prevented the severe disruption of the outer retina and the RPE. Photobiomodulation
prevented the obliteration of the choroidal vascular network, thus assuring the
maintenance of the blood-retina barrier. Photoreceptor structure was maintained in the
treated groups, albeit the outer segments shortened, misaligned and some small vacuoles
were present in the hot spot area. These changes however were reversible, because after
a period of recovery in dim light, OS’s became more organised and longer than at the early
stages after light-stress. Our findings in the preconditioned group somewhat agreed with
those reported by Qu et al47. Although they showed a reduced rate of photoreceptor loss
and better retinal function in the NIR-treated animals in their light damage paradigm, they
were not able to avoid the development of a hotspot that could be a source of long-term
degeneration.
Photobiomodulation also reduced cell stress and inflammatory reaction in the retina. NIR
treatment mitigated the up-regulation of GFAP in Muller cells, a known stress marker. It
has also reduced the number of microglial cells in the retinal and choroidal vessels.
Though it did not prevent the activation of microglia, it significantly reduced the number of
activated cells and prevented their invasion into the outer retina.
22
In conjunction with the maintenance of outer retinal structure, photoreceptor cell function
was also preserved. In animals treated before (pre-conditioned) or during (mid-
conditioned) BL, photoreceptor function was significantly better than non-treated controls
at 1 week post-exposure and that function was maintained at the 1 month post-exposure
time. In animals treated after BL (post-conditioned), photoreceptor function was
significantly reduced 1 week post-exposure. However, by 1 month post-exposure,
photoreceptor function recovered in this group as well, indicative of a protective effect
similar to the other two treatment paradigms. In contrast, photoreceptor function remained
diminished in the non-treated BL-exposed animals.
The apparent discrepancy between the state of retinal structure and its function in the
postconditioned group prompted us to investigate possible mechanisms responsible for
the reduction of photoreceptor function without apparent major structural damage. One
such mechanism may possibly be through the up-regulation of neuroprotectants, such as
ciliary neurotrophic factor (CNTF), basic fibroblast growth factor (FGF-2). Earlier studies
have shown that both of these proteins are effective retinoprotectants48-51. It has also been
demonstrated, that both of these factors have a direct effect on retinal function49, 52-55. In
our case, both CNTF and FGF-2 were up-regulated in the light-exposed non-treated
group, similarly to earlier published data56. The up-regulation of both factors has been
related to the reduction in retinal function52, 53 and thus they could be factors in the
functional changes observed in our animals. In the NIR treated animals, we were able to
detect the up-regulation of CNTF in the photoreceptor OS layer and FGF-2 protein in the
ONL at varying degree that could explain the difference in functional response in the three
treatment groups. The most severe loss of function correlated with the highest level of
CNTF and FGF-2 protein up-regulation. It has been shown that the neuroprotectant up-
regulation following an insult is only temporary52, and once the stress is removed, protein
23
levels are gradually reduced. It is possible, that the transient loss of function in the post-
conditioned retinas are due, at least partly, to the increased presence of neuroprotectants
in the outer retina, which allowed the survival and recovery of photoreceptors. Once the
crisis was over, and their presence was no longer necessary, the level of these factors
reduced, allowing the recovery of retinal function. In retinas exposed to damaging light, but
not treated by 670nm photobiomodulation, the white light induced damage of
photoreceptors and RPE might possibly have overwhelmed the retinoprotective system,
and despite the presence of these factors, a large number of photoreceptors were lost and
thus retinal function could not recover.
Potential Mechanism of Photobiomodulation
Photobiomodulation, or low energy photon irradiation by far-red/near infrared
(FR/NIR) light using low energy lasers or LED arrays, collectively termed
“photobiomodulation”, has been applied clinically in the treatment of soft tissue injuries and
acceleration of wound healing for more than 30 years57. Recent studies demonstrated that
low energy laser and LED NIR penetrates diseased tissues including the heart, spinal cord
and brain58, 59. NIR treatment has been documented to improve recovery from ischemic
heart injury58, attenuate degeneration in the injured retina and optic nerve58, 60 and improve
recovery in experimental and clinical stroke59, 61, 62. Clinical trials in the treatment of
radiation-induced mucositis and stroke have demonstrated therapeutic efficacy of 670 nm
and 830 nm light administered at doses ranging from 3 - 6 J/cm2. Thus, existing data
demonstrate the therapeutic potential of NIR light.
The cytoprotective action spectrum of FR/NIR light corresponds with the cytochrome
oxidase absorption spectrum57, 63. Recent studies have shown that NIR irradiation
produces redox alterations in the cytochrome oxidase molecule resulting in the activation
of intracellular signaling cascades which culminate in improved mitochondrial function and
24
increased synthesis of cytoprotective factors12, 57, 59, 60, 64-68. Others showed increased
tissue concentrations of antioxidants (glutathione, mitochondrial superoxide dismutase
[SOD2]) and cytoprotective growth factors69. Recently, we reported on gene regulatory
effects of NIR treatment in the normal and light-stressed retina70. Our findings showed NIR
had an effect on many intracellular pathways, among others a direct effect on antioxidant
protection and the downregulation of a chemokine, ccl2, that has been shown to induce
leukocyte recruitment and activation71. Present study provided further evidence of the
direct effect of NIR light on inflammation, by showing a reduction of monocyte recruitment
and microglia activation in treated eyes.
Our earlier genechip study suggests, that NIR has no direct effect on the regulation
of neuroprotectants, such as fgf-2 or cntf genes. This study confirmed the negative
correlation between structural protection and FGF-2 regulation, that suggests that
photobiomodulation does not act through neuroprotective pathways directly, but possibly
at a point more upstream, thereby preventing, rather than mitigating cell damage.
More interestingly, our previous wide-scale gene analysis showed that NIR
upregulated many noncoding RNAs (ncRNA)70. That could explain the lack of any
apparent effect of the NIR treatment on the healthy, non-challenged retina. Further
research is necessary to understand the exact role these ‘non-coding’ sequences may
play in the retina, but one possible hypothesis presents itself, that while they don’t have
any apparent effect on healthy tissue, they may act as a pre-conditioning event that allows
the modification of the regulation of potentially damaging genes in the presence of stress
stimuli.
Clinical implications
The use of photobiomodulation remains controversial as a consequence of an
incomplete understanding of its mechanisms of action, differences in treatment paradigms,
25
wavelengths and mixed results in both the laboratory and clinic72. In addition, it is hard to
assess the efficacy of the treatment in the clinic, due to the lack of appropriately controlled
and blinded clinical trials. Photobiomodulation is used in many types of tissues targeting a
variety of conditions using different wavelengths, dose and light sources (laser vs. non-
coherent light), which makes standardisation near impossible. Despite the controversies,
many successes have been achieved in a few areas clinically, specifically in three areas:
1) wound healing, 2) the relief of inflammation and 3) the reduction of neurogenic pain.
Present data suggest that treatment with 670nm red light can lead to significant
protection of the retina from light-induced damage. This treatment has the potential to
reduce the adverse effects of bright light exposure moreover this non-invasive therapeutic
modality has considerable promise for the treatment of retinal degenerative disorders and
ocular inflammatory disease conditions.
26
REFERENCES
1. Gorn RA, Kuwabara T. Retinal damage by visible light. A physiologic study. ArchOphthalmol 1967;77:115-118.
2. Noell WK, Walker VS, Kang BS, Berman S. Retinal damage by light in rats. Invest Ophthalmol 1966;5:450-473.
3. Lanum J. The damaging effects of light on the retina. Empirical findings, theoretical and practical implications. Surv Ophthalmol 1978;22:221-249.
4. Reme CE, Weller M, Szczesny P, et al. Light-induced apoptosis in the rat retina in vivo. In: Anderson RE (ed), Degenerative Diseases of the Retina. New York: Plenum Press; 1995.
5. Ng TF, Streilein JW. Light-induced migration of retinal microglia into the subretinal space. Invest Ophthalmol Vis Sci 2001;42:3301-3310.
6. Gordon WC, Casey DM, Lukiw WJ, Bazan NG. DNA damage and repair in light-induced photoreceptor degeneration. Invest Ophthalmol Vis Sci 2002;43:3511-3521.
7. Langmann T. Microglia activation in retinal degeneration. J Leukoc Biol 2007;81:1345-1351.
8. Joly S, Francke M, Ulbricht E, et al. Cooperative phagocytes: resident microglia and bone marrow immigrants remove dead photoreceptors in retinal lesions. Am J Pathol 2009;174:2310-2323.
9. Rutar M, Provis J, Valter K. Brief exposure to damaging light causes focal recruitment of macrophages, and long-term destabilization of photoreceptors in the albino rat retina. Current Eye Research 2010;35:631-643.
10. Hamblin MR, Demidova TN. Mechanisms of low level light therapy. In: Hamblin MR, Waynant RW, Anders J (eds), SPIE; 2006:1-12.
11. Karu T. Primary and secondary mechanisms of action of visible to near-IR radiation on cells. J Photochem Photobiol B 1999;49:1-17.
12. Wong-Riley MT, Liang HL, Eells JT, et al. Photobiomodulation directly benefits primary neurons functionally inactivated by toxins: role of cytochrome c oxidase. J Biol Chem2005;280:4761-4771.
13. Zhang Y, Song S, Fong CC, Tsang CH, Yang Z, Yang M. cDNA microarray analysis of gene expression profiles in human fibroblast cells irradiated with red light. J Invest Dermatol2003;120:849-857.
14. Yu HS, Wu CS, Yu CL, Kao YH, Chiou MH. Helium-neon laser irradiation stimulates migration and proliferation in melanocytes and induces repigmentation in segmental-type vitiligo. JInvest Dermatol 2003;120:56-64.
15. Mester E, Spiry T, Szende B, Tota JG. Effect of laser rays on wound healing. Am J Surg1971;122:532-535.
27
16. Viegas VN, Abreu ME, Viezzer C, et al. Effect of low-level laser therapy on inflammatory reactions during wound healing: comparison with meloxicam. Photomed Laser Surg 2007;25:467-473.
17. Byrnes KR, Waynant RW, Ilev IK, et al. Light promotes regeneration and functional recovery and alters the immune response after spinal cord injury. Lasers Surg Med 2005;36:171-185.
18. Eells JT, Henry MM, Summerfelt P, et al. Therapeutic photobiomodulation for methanol-induced retinal toxicity. Proc Natl Acad Sci U S A 2003;100:3439-3444.
19. Whelan HT. DARPA Soldier Self Care: Rapid Healing of Laser Eye Injuries with Light Emitting Diode Technology. RTO HFM Symposium on Combat Casualty Care in Ground Based Tactical Situations: Trauma Technologiy and Emergancy Medical Procedures. St Pete Beach, USA; 2004.
20. Neiburger EJ. Rapid healing of gingival incisions by the helium-neon diode laser. J Mass Dent Soc 1999;48:8-13, 40.
21. Whelan HT, Connelly JF, Hodgson BD, et al. NASA light-emitting diodes for the prevention of oral mucositis in pediatric bone marrow transplant patients. J Clin Laser Med Surg2002;20:319-324.
22. Schindl A, Schindl M, Pernerstorfer-Schon H, Mossbacher U, Schindl L. Low intensity laser irradiation in the treatment of recalcitrant radiation ulcers in patients with breast cancer--long-term results of 3 cases. Photodermatol Photoimmunol Photomed 2000;16:34-37.
23. Papageorgiou P, Katsambas A, Chu A. Phototherapy with blue (415 nm) and red (660 nm) light in the treatment of acne vulgaris. Br J Dermatol 2000;142:973-978.
24. Medrado AR, Pugliese LS, Reis SR, Andrade ZA. Influence of low level laser therapy on wound healing and its biological action upon myofibroblasts. Lasers Surg Med 2003;32:239-244.
25. Gigo-Benato D, Geuna S, Rochkind S. Phototherapy for enhancing peripheral nerve repair: a review of the literature. Muscle Nerve 2005;31:694-701.
26. Anders JJ, Geuna S, Rochkind S. Phototherapy promotes regeneration and functional recovery of injured peripheral nerve. Neurol Res 2004;26:233-239.
27. Anders JJ, Borke RC, Woolery SK, Van de Merwe WP. Low power laser irradiation alters the rate of regeneration of the rat facial nerve. Lasers Surg Med 1993;13:72-82.
28. Branco K, Naeser MA. Carpal tunnel syndrome: clinical outcome after low-level laser acupuncture, microamps transcutaneous electrical nerve stimulation, and other alternative therapies--an open protocol study. J Altern Complement Med 1999;5:5-26.
29. Irvine J, Chong SL, Amirjani N, Chan KM. Double-blind randomized controlled trial of low-level laser therapy in carpal tunnel syndrome. Muscle Nerve 2004;30:182-187.
28
30. Simunovic Z, Ivankovich AD, Depolo A. Wound healing of animal and human body sport and traffic accident injuries using low-level laser therapy treatment: a randomized clinical study of seventy-four patients with control group. J Clin Laser Med Surg 2000;18:67-73.
31. Ni YQ, Xu GZ, Hu WZ, Shi L, Qin YW, Da CD. Neuroprotective effects of naloxone against light-induced photoreceptor degeneration through inhibiting retinal microglial activation. Invest Ophthalmol Vis Sci 2008;49:2589-2598.
32. Yang L, Kim JH, Kovacs KD, Arroyo JG, Chen DF. Minocycline inhibition of photoreceptor degeneration. Arch Ophthalmol 2009;127:1475-1480.
33. Walsh N, van Driel D, Lee D, Stone J. Multiple vulnerability of photoreceptors to mesopic ambient light in the P23H transgenic rat. Brain Res 2004;1013:194-203.
34. Jozwick C, Valter K, Stone J. Reversal of functional loss in the P23H-3 rat retina by management of ambient light. Exp Eye Res 2006;83:1074-1080.
35. Chrysostomou V, Stone J, Stowe S, Barnett NL, Valter K. The status of cones in the rhodopsin mutant P23H-3 retina: light-regulated damage and repair in parallel with rods. Invest Ophthalmol Vis Sci 2008;49:1116-1125.
36. Arden GB, Carter RM, Hogg CR, et al. A modified ERG technique and the results obtained in X-linked retinitis pigmentosa. Br J Ophthalmol 1983;67:419-430.
37. Nilsson J, Wright T, Westall CA. Rod a-wave analysis using high intensity flashes adds information on rod system function in 25% of clinical ERG recordings. Vision Res 2008;48:1920-1925.
38. Walsh N, Valter K, Stone J. Cellular and subcellular patterns of expression of bFGF and CNTF in the normal and light stressed adult rat retina. Exp Eye Res 2001;72:495-501.
39. Xiao M, Sastry SM, Li ZY, et al. Effects of retinal laser photocoagulation on photoreceptor basic fibroblast growth factor and survival. Invest Ophthalmol Vis Sci 1998;39:618-630.
40. Li ZY, Chang JH, Milam AH. Distribution of basic fibroblast growth factor in human retinas with retinitis pigmentosa. Exp Eye Res 1997;65:855-859.
41. Penn JS, Thum LA. A comparison of the retinal effects of light damage and high illuminance light history. Prog Clin Biol Res 1987;247:425-438.
42. Rapp LM, Williams TP. A parametric study of retinal light damage in albino and pigmented rats. In: Williams TP, Baker BN (eds), The effects of constant light on visual processes. New York: Plenum Press; 1980:135-159.
43. Rapp LM, Naash MI, Wiegand RD, Joel CD, Nielsen JC, Anderson RE. Morphological and Biochemical Comparisons Between Retinal Regions Having Differing Susceptibility to Photoreceptor Degeneration. Alan R Liss Inc; 1985:421-437.
44. Tanito M, Kaidzu S, Ohira A, Anderson RE. Topography of retinal damage in light-exposed albino rats. Exp Eye Res 2008;87:292-295.
29
45. Fukuda Y. A three-group classification of rat retinal ganglion cells: histological and physiological studies. Brain Res 1977;119:327-334.
46. Battelle BA, LaVail MM. Rhodopsin content and rod outer segment length in albino rat eyes: modification by dark adaptation. Exp Eye Res 1978;26:487-497.
47. Qu C, Cao W, Fan Y, Lin Y. Near-infrared light protect the photoreceptor from light-induced damage in rats. Adv Exp Med Biol 2010;664:365-374.
48. Bush RA, Williams TP. The effect of unilateral optic nerve section on retinal light damage in rats. Exp Eye Res 1991;52:139-153.
49. Valter K, Bisti S, Gargini C, et al. Time course of neurotrophic factor upregulation and retinal protection against light-induced damage after optic nerve section. Invest Ophthalmol Vis Sci2005;46:1748-1754.
50. Faktorovich EG, Steinberg RH, Yasumura D, Matthes MT, LaVail MM. Basic fibroblast growth factor and local injury protect photoreceptors from light damage in the rat. J Neurosci1992;12:3554-3567.
51. LaVail MM, Faktorovich EG, Hepler JM, et al. Basic fibroblast growth factor protects photoreceptors from light-induced degeneration in albino rats. Ann N Y Acad Sci 1991;638:341-347.
52. Gargini C, Bisti S, Demontis GC, Valter K, Stone J, Cervetto L. Electroretinogram changes associated with retinal upregulation of trophic factors: observations following optic nerve section. Neuroscience 2004;126:775-783.
53. Gargini C, Belfiore MS, Bisti S, Cervetto L, Valter K, Stone J. The impact of basic fibroblast growth factor on photoreceptor function and morphology. Invest Ophthalmol Vis Sci1999;40:2088-2099.
54. Valter K, van Driel D, Bisti S, Stone J. FGFR1 expression and FGFR1-FGF-2 colocalisation in rat retina: sites of FGF-2 action on rat photoreceptors. Growth Factors 2002;20:177-188.
55. Valter K, Bisti S, Stone J. Location of CNTFRalpha on outer segments: evidence of the site of action of CNTF in rat retina. Brain Res 2003;985:169-175.
56. Bowers F, Valter K, Chan S, Walsh N, Maslim J, Stone J. Effects of oxygen and bFGF on the vulnerability of photoreceptors to light damage. Invest Ophthalmol Vis Sci 2001;42:804-815.
57. Karu T. Low-power laser therapy. Biomedical Photonics Handbook: CRC Press LLC; 2003:1-25.
58. Clarke G, Lumsden CJ, McInnes RR. Inherited neurodegenerative diseases: the one-hit model of neurodegeneration. Hum Mol Genet 2001;10:2269-2275.
59. Lampl Y, Zivin JA, Fisher M, et al. Infrared laser therapy for ischemic stroke: a new treatment strategy: results of the NeuroThera Effectiveness and Safety Trial-1 (NEST-1). Stroke2007;38:1843-1849.
30
60. Sommer AP, Pinheiro AL, Mester AR, Franke RP, Whelan HT. Biostimulatory windows in low-intensity laser activation: lasers, scanners, and NASA's light-emitting diode array system. JClin Laser Med Surg 2001;19:29-33.
61. Garbuzova-Davis S, Willing AE, Saporta S, et al. Chapter 14 Novel cell therapy approaches for brain repair. Prog Brain Res 2006;157:207-222.
62. Ilic S, Leichliter S, Streeter J, Oron A, DeTaboada L, Oron U. Effects of power densities, continous and pulse frequencies, and number of sessions of low-level laser therapy on intact rat brain. Photomedicine and Laser Surgery 2006;24:458-466.
63. Eells JT, Wong-Riley MT, VerHoeve J, et al. Mitochondrial signal transduction in accelerated wound and retinal healing by near-infrared light therapy. Mitochondrion 2004;4:559-567.
64. Liang HL, Whelan HT, Eells JT, et al. Photobiomodulation partially rescues visual cortical neurons from cyanide-induced apoptosis. Neuroscience 2006;139:639-649.
65. Oron U, Yaakobi T, Oron A, et al. Attenuation of infarct size in rats and dogs after myocardial infarction by low-energy laser irradiation. Lasers Surg Med 2001;28:204-211.
66. Oron U, Yaakobi T, Oron A, et al. Low-energy laser irradiation reduces formation of scar tissue after myocardial infarction in rats and dogs. Circulation 2001;103:296–301.
67. Whelan HT, Buchmann EV, Dhokalia A, et al. Effect of NASA light-emitting diode irradiation on molecular changes for wound healing in diabetic mice. J Clin Laser Med Surg2003;21:67-74.
68. Karu TI, Pyatibrat LV, Kalendo GS. Photobiological modulation of cell attachment via cytochrome c oxidase. Photochem Photobiol Sci 2004;3:211-216.
69. Ying R, Liang HL, Whelan HT, Eells JT, Wong-Riley MT. Pretreatment with near-infrared light via light-emitting diode provides added benefit against rotenone- and MPP+-induced neurotoxicity. Brain Res 2008;1243:167-173.
70. Natoli R, Zhu Y, Valter K, Bisti S, Eells J, Stone J. Gene and noncoding RNA regulation underlying photoreceptor protection: microarray study of dietary antioxidant saffron and photobiomodulation in rat retina. Mol Vis 2010;16:1801-1822.
71. Rutar M, Natoli R, Valter K, Provis JM. Early focal expression of the chemokine Ccl2 by Muller cells during exposure to damage-inducing bright continuous light. Invest Ophthalmol Vis Sci2011.
72. Posten W, Wrone DA, Dover JS, Arndt KA, Silapunt S, Alam M. Low-level laser therapy for wound healing: mechanism and efficacy. Dermatol Surg 2005;31:334-340.

31
FIGURE LEGENDS
Figure 1.
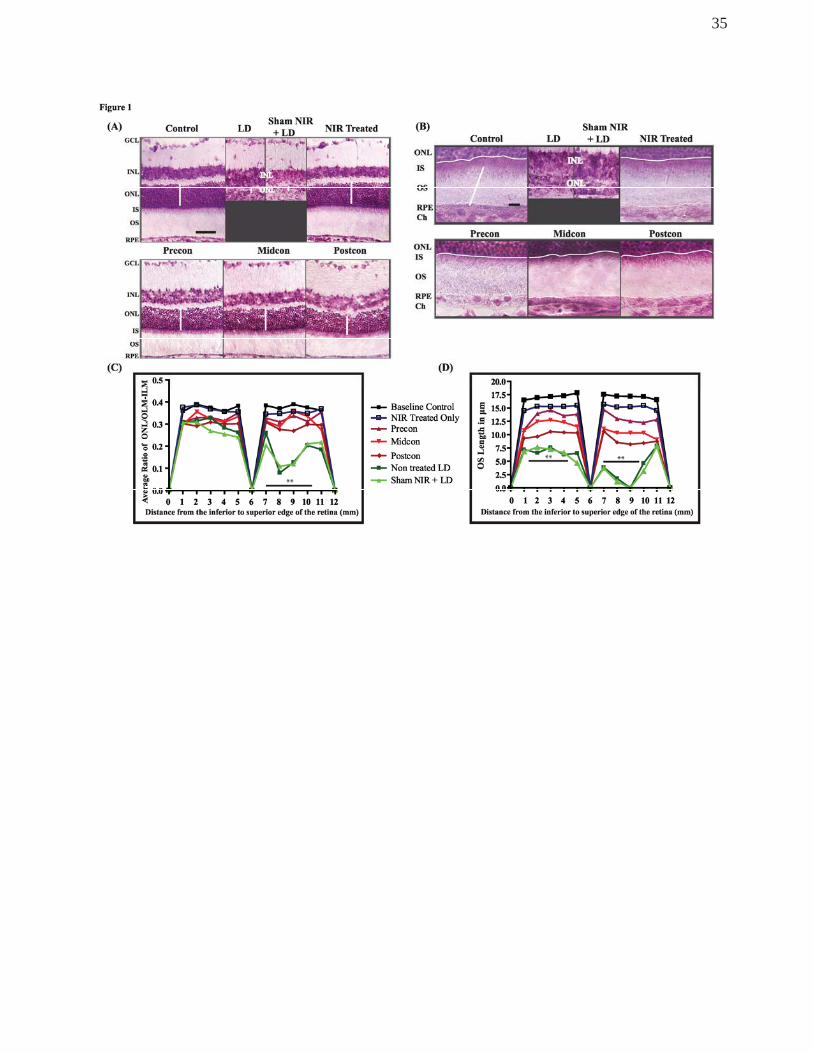
(A) Representative images of Toluidine Blue labelled sections from the superior
region of the retina. In control retina, the cells are distinctly arranged in respective layers
and outer segments are neatly organised. In LD and Sham NIR LD sections, severe
disruption of the outer retina and diminished photoreceptor population are observed. No
gross structural changes are seen in any of the NIR-treated groups. White line indicates
how ONL thickness was measured. (B) Higher magnification images of retinal sections
labelled with Toluidine blue, focussing on the outer segments, the adjacent pigment
epithelium and the choroid. Thin white line highlights the OLM, thick white vertical line
indicates how OS length was measured. The white horizontal trace indicates the intact
outer limiting membrane. (C) Graph summarising the quantitative analysis of
photoreceptor population, assessed by measuring the thickness of the ONL and the full
retina (n=8). (D) Graph summarising quantitative analysis of OS lengths in the different
groups (n=8). To counter for variations in cutting angles, the ratio of the two measures
were depicted in this graph. The black solid lines in C and D correspond to the area of the
retina with statistical significance. ** Statistically significant differences (P < 0.05)
compared to control groups. Scale bar represents 25 μm.
Figure 2.
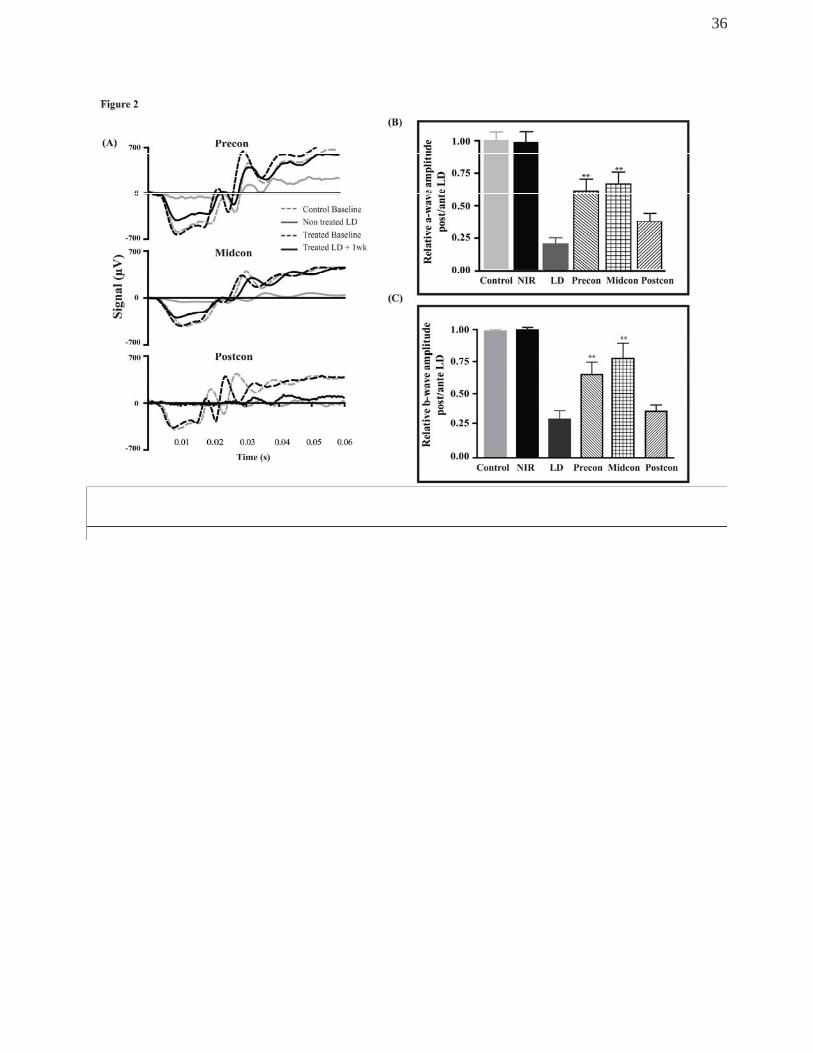
(A) Representative dark-adapted scotopic ERG recordings showing traces of a-wave
responses. Dotted lines represent ERG recording prior to treatment and/or light exposure,
solid lines represent ERG recording after light exposure and NIR treatment of the same
animals. Photoreceptor function was significantly reduced in non-treated LD retina (grey
32
solid lines) following exposure to BL. Functional recovery was observed in Precon and
Midcon but not in Postcon group (black solid lines). (B) Analysis of the relative
preservation of the a-wave response of NIR-treated groups against the non-treated, LD
retina. Functional changes were measured by taking the ratio of post damage plus
treatment and the baseline values of a-wave amplitude in all animals in each group (n=8).
(C) Analysis of the relative b-wave amplitudes of dark-adapted ERG responses in treated
and non-treated SD rat retinas prior to (baseline recording) and after 7 days after exposure
to bright light. Changes in b-wave amplitudes were analysed by taking the ratio of post
damage plus treatment and the values from the baseline recordings in all animals in each
group (n=8). The bars indicate the mean + SEM. **Statistically significant differences (P <
0.05) compared to Control group.
Figure 3.
(A, B) Validation of the differential expression of Fgf-2 and Gfap genes using
quantitative RT-PCR. cDNAs from NIR-treated and non-treated BL-exposed SD retinas
were used for quantitative expression analysis and Gapdh was the reference standard.
The level of expression of these genes in all groups was compared to the control group,
and the value was generated for a fold change in expression. A fold-change of 1 indicates
no change (dashed line), a fold change >1 shows upregulation and <1 indicates
downregulation. The bars indicate the mean +SEM. **Statistically significant differences
(P < 0.05) compared to LD group.
(C) Retinal stress status of the treated and non-treated animals after 7 days of
exposure to damaging levels of light through double immunolabelling with the stress
marker GFAP (red) and the neuroprotective protein FGF-2 (green). Treatment with NIR
mitigated the up-regulation of both proteins in all three treatment groups. There was a
33
gradient in the immunoreactivity for both proteins in the NIR treatment groups, with the
strongest up-regulation in the Postcon group.
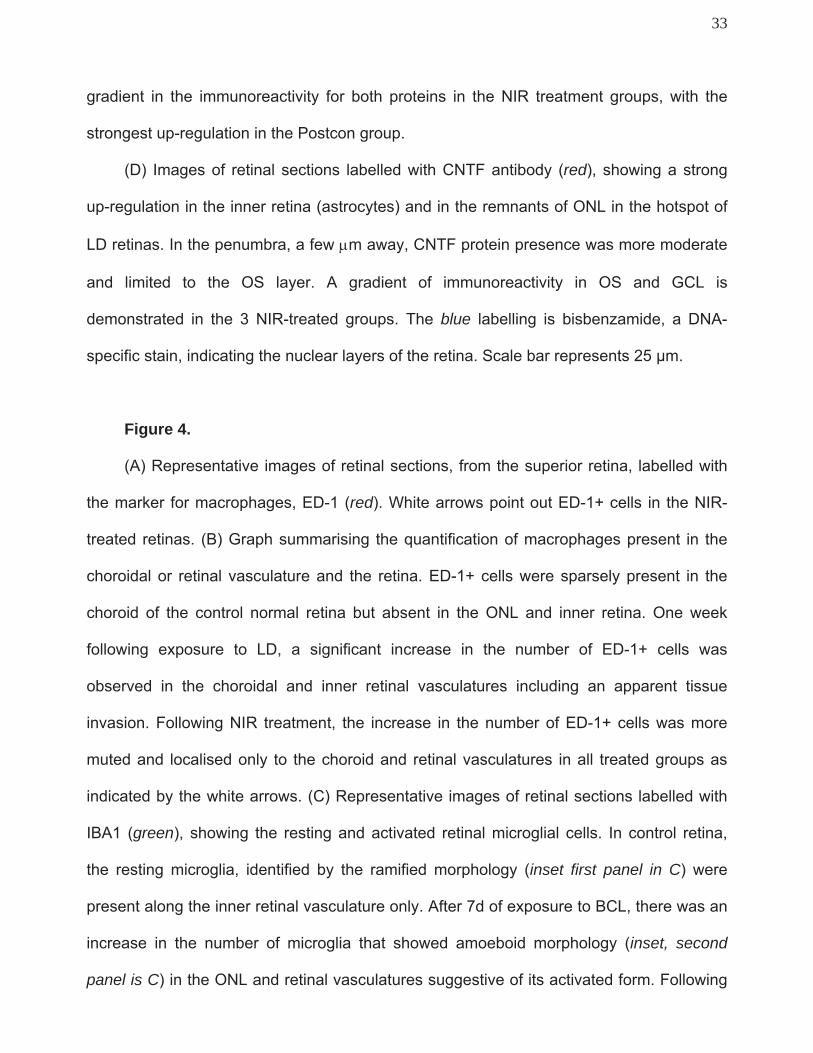
(D) Images of retinal sections labelled with CNTF antibody (red), showing a strong
up-regulation in the inner retina (astrocytes) and in the remnants of ONL in the hotspot of
LD retinas. In the penumbra, a few m away, CNTF protein presence was more moderate
and limited to the OS layer. A gradient of immunoreactivity in OS and GCL is
demonstrated in the 3 NIR-treated groups. The blue labelling is bisbenzamide, a DNA-
specific stain, indicating the nuclear layers of the retina. Scale bar represents 25 μm.
Figure 4.
(A) Representative images of retinal sections, from the superior retina, labelled with
the marker for macrophages, ED-1 (red). White arrows point out ED-1+ cells in the NIR-
treated retinas. (B) Graph summarising the quantification of macrophages present in the
choroidal or retinal vasculature and the retina. ED-1+ cells were sparsely present in the
choroid of the control normal retina but absent in the ONL and inner retina. One week
following exposure to LD, a significant increase in the number of ED-1+ cells was
observed in the choroidal and inner retinal vasculatures including an apparent tissue
invasion. Following NIR treatment, the increase in the number of ED-1+ cells was more
muted and localised only to the choroid and retinal vasculatures in all treated groups as
indicated by the white arrows. (C) Representative images of retinal sections labelled with
IBA1 (green), showing the resting and activated retinal microglial cells. In control retina,
the resting microglia, identified by the ramified morphology (inset first panel in C) were
present along the inner retinal vasculature only. After 7d of exposure to BCL, there was an
increase in the number of microglia that showed amoeboid morphology (inset, second
panel is C) in the ONL and retinal vasculatures suggestive of its activated form. Following
34
NIR treatment, activated cells were still present, but they were limited to the inner retinal
vessels of all treated paradigms and not in the tissue. (D) Graph showing the number of
microglial cells present, distinguishing between resting and activated cells. **Statistically
significant differences (P < 0.05) compared to control groups. Scale bar represents 25 μm.
Figure 5.
(A) Relative a-wave (top panel) and b-wave (bottom panel) amplitudes analyses
before and after 1 month of NIR treatment and BCL exposure. (B) Representative images
of retinal sections stained with Toluidine Blue at 1 month recovery. The white vertical line
indicates the thickness of the ONL and the black slanted line represents the outer
segments length was measured. (C-D) Quantitative analyses of the OS length and ONL
thickness sampled across the retina from the inferior to the superior edge (n=8). The bars
indicate the mean +SEM. **Statistically significant differences (P < 0.05) compared to
control groups. Scale bar represents 25 μm.
35
36
37
38
39