Embed Size (px)
Citation preview
i
PHOTOGRAPH r" « SHEET
LEVEL INVENTORY
DOCUMENT IDENTIFICATION
DjSTRIBimON STATEMBTST il
Approved for public release; Distribution Unlimited
DISTRIBUTION STATEMENT
ACCESSION FOR NTIS GRAAI
DTIC TAB
UNANNOUNCED
JUSTIFICATION
^c D D
BY DISTRIBUTION / AVAILABILITY CODES DIST AVAIL AND/OR SPECIAL
i
DISTRIBUTION STAMP
UNANNOUNCED
DATE ACCESSIONED
* Per: telecon w/Betty Fox, Chief, DNA Tech Libr'y. Div.: the Classifedl References contained herein may remain. 5 Sept.'79
Vic LaChance DnA-2
♦»Verified for Extra»ted Versions. 9 July«80
pfcooper, DTIC/DDA-2
A4 08 21 14a
DATE RECEIVED IN DTIC REGISTERED OR CERTIFIED NO.
PHOTOGRAPH THIS SHEET AND RETURN TO DTIC-DDAC
DT,C&OcRtM370A DOCUMENT PROCESSING SHEET PREVIOUS EDITION MAY BE USED UNTIL STOCK IS EXHAUSTED.
i
*
^ f J
UPSHOT-KNOTHOLE , NEVADA PROVING GROUNDSj 1^~||
March-June 1953 * n^ mJ-- «K»^? FORCES
Project l.la-1 -: ,f*
EVALUATION OF WIANCKO AND VIBROfll^t. GAGES AND DEVELOPMENT OF NEW CmCÜITRV; 1Ä FOR ATOMIC BLAST MEASUREMENTS
f(
■■<:
„1
4
■^miffiF*.v^ä&lft^
Sa -
-lotion (Conoe^.e.il ("l^wf^ t(^ ;ilASSIy^ED ■ —
^-:h.rk '■~^*1-*^JC ~A--~~
HEAOQUAfiTERS FIELD COMMAND, ARMF.O FORCES SPECIAL WEAPONS PROJECT
SANDIA BASE, ALBUQUEHQIIE, NfW MEXICO
. '.It*-''" «.•':*
.•
Reproduced Direct from Manuscript Copy by AEC Technical Mormation Service
Oak Ridge, Tennessee
Inquiries relative to this report aay ba made to
Chief, Arned Forces Special Weapona Project
Washington, D. G.
If this report is no longer needed, return to
AEC Technical Informatkn Service P, 0. Box 401
Oak Ridge, Tenneswe
^Ff iciÄL #SE ONLY 'WmWi
^. WT-784
OPERATION UPSHOT-KNOTHOLE
Project l.la-1
EVALUATION OF WIANCKO AND VIBROTRON GAGES AND DEVELOPMENT OF NEW CIRCUITRY
FOR ATOMIC BLAST MEASUREMENTS
REPORT TO THE TEST DIRECTOR
by
Joseph Petes C. C. Little
J. L. Dossey, Lt., USAF
,4 February 1955
^5
Naval Ordnance Laboratory Report NOLR-1181 U. S. Naval Ordnance Laboratory
White Oak, Silver Spring, Maryland
s- ,,.-*..-t.
■*
OFFICIAISUSE ONLY
• •
• •
9 •
9 •
t •
• •
-- -■■■-■-■ ■ - - . -^. -.-.—-— — ^-.
• •
• •
ABSTRACT
• •
A program to ^est experimental instrumentation was undertaken "by the Naval Ordnance laboratory on Operation UPSHOT-KNOTHOLE in an endeavor to improve existing blast phenomena measuring equipment and techniques. Four experimental designs were tested: (l) a field unit oscillator-amplifier using transistor circuit elements, (2) a sub- « « miniature two-wire field unit, (3) a commercially developed Vibrotron gage and amplifier unit, and {k) a frequency deviation multiplier cir- cuit for obtaining increased signal to noise ratios. The operation also provided the opportunity to evaluate more fully the performance of the Wiancko gage. It was found that transistor circuitry is little, if at all, affected by atomic blast phenomena and holds much promise ß % for futher development. The sub-miniature two-wire system was success- ful and offers many advantages in economy and adaptability in field use over the present NOL system. The deviation multiplier scheme was com- pletely successful; however, its complexity must be weighed against the freedom from noise required on any particular operation. The Vibrotron gage and oscillator was unstable, not rugged, and in gen- • 9 eral gave poor results; it requires a good deal of redesign and de- velopment before it can be used in atomic effects measuring programs. The NOL modified Wiancko pressure gage proved to be an acceptable gage, giving results superior to those obtained on previous operations with other inductance type gages. In certain applications, the acceleration sensitivity of the gage is excessive and confuses the pressure-time • * record. Also the damping characteristics of the gage could be improved.
• •
«usss® § •
ernciAi USE OMir
• •
w* • •
FOREWORD
This report ia one of the reports presenting the results of the 78 projects participating in the Military Effects Tests Program of Operation UPSHOT-KNOTHOLE, which included 11 test detonations. For readers interested in other pertinent test - information, reference is made to Wr-782, Summary Report of the Technical Director, Military Effects Program. This summary report includes the following information of possible general inter- est.
a. An over-all description of each detonation, " including yield, height of "burst, ground zero - location, time of detonation, ambient atmospheric conditions at detonation, etc., for the 11 shots.
b. Compilation and correlation of all project results on the basic measurements of blast J • -^ and shock, thermal radiation, and nuclear radiation.
c. Compilation and correlation of the various project results on weapons effects.
d. A summary of each project, including objectives and results.
e. A complete listing of all reports covering the Military Effects Tests Program.
I •
I •
UNCLASSIFIED 1 •
ornciAi usi OMI*-
• •••••••••••••••
• •
ACKNOWLEDGMJWTS
Grateful acknowledgment Is tendered to £. J. Culling for his advice and help In overall planning of this program and to P. S. Bengston who designed the transistor oscillator-amplifier and the deviation multiplier circuits.
Appreciation Is also expressed to all personnel participating In Project 1.1a of Operation UPSHOT-KNOTHOLE for assistance In the laboratory and In the field.
9 •
• •
9 •
i •
• •
UNCLASSIFIED i •
orpieiAh use OMLY-
CONTENTS
ABSTRACT . . . .
FOREWORD . . . .
ACKNOWLEDGMENTS
3
5
7
ILLUSTRATIONS 11
TABLES 11
CHAPTER 1 INTRODUCTION AND OBJECTIVES 13
1.1 Introduction 13 1.2 Objectives I1*
CHAPTEK 2 TRANSISTOR OSCILIATOR-AMPLIFIER 1.5
2.1 Design 15 2.2 Performance 15 2.3 Conclusions and Recommendations 19
CHAPTER 3 SUB-MINIATURE TWO-WIRE FIEID UNIT 20
3.1 Design 20 3.2 Performance 21 3.3 Conclusions and Recommendations 23
CHAPTER k VIBROTRON GAGE AND AMPLIFIER 2k
U.l Design 2k k.2 Performance 27 U.3 Conclusions and Recommendations 26
CHAPTER 5 DEVIATION MULTIPUES 29
5.1 Introduction 29 5.2 Design 29
5.2.1..(<MinAflAinLn 30
ll«CDSS»:
—ornciM USE ont-Y
• • 5.2.2 Circuit 30
5.3 Performance 33 5.^ Conclusions and Recommenäations 35
CHAPTER 6 THE WIAHCKO PRESSURE GAGE 36 • •
6.1 Introduction 36 6.1.1 General 36 6.1.2 Gage Requirements 36
6.2 The Wiancko Pressure Gage 36 6.2.1 General Description 36 w .-.. 6.2.2 Design Specifications 38 • •
6.3 Electrical Characteristics 39 6.3.1 Q of Coil 39 6.3.2 Frequency Deviation ^0
6.^ MeCi-inical Characteristics ^2 6.^,1 Frequency Response k2 6.U.2 Damping ^3 • • 6.U.3 Acceleration Sensitivity ^5 S.k.k Temperature Dependence ..... 50
6.5 Calibration Technique 50 6.6 Accuracy 50 6.7 Field Performance ..... 51 6.8 Conclusions and Recommendations 52 • *
BIBUOGRAPffif . 53
• •
.• •
t •
Ji •
^v
• •
ILLUSTRATIONS
31
• •
• • 2.1 Circuit Diagram of the Transistor Oscillator Amplifier . . . l6 2.2 Vacuum Tube Equivalent of the Transistor Oscillator-Amplifier It 2.3 Comparison of a Transistor Circuitry Produced Pressure-
Time Record with a Standard Record 18 3.1 Circuit Diagram of Suh-Miniature Two-wire Oscillator-
Amplifier , 20 ^ Q 3.2 Sub-Miniature Two-wire Oscillator-Amplifier and Gage
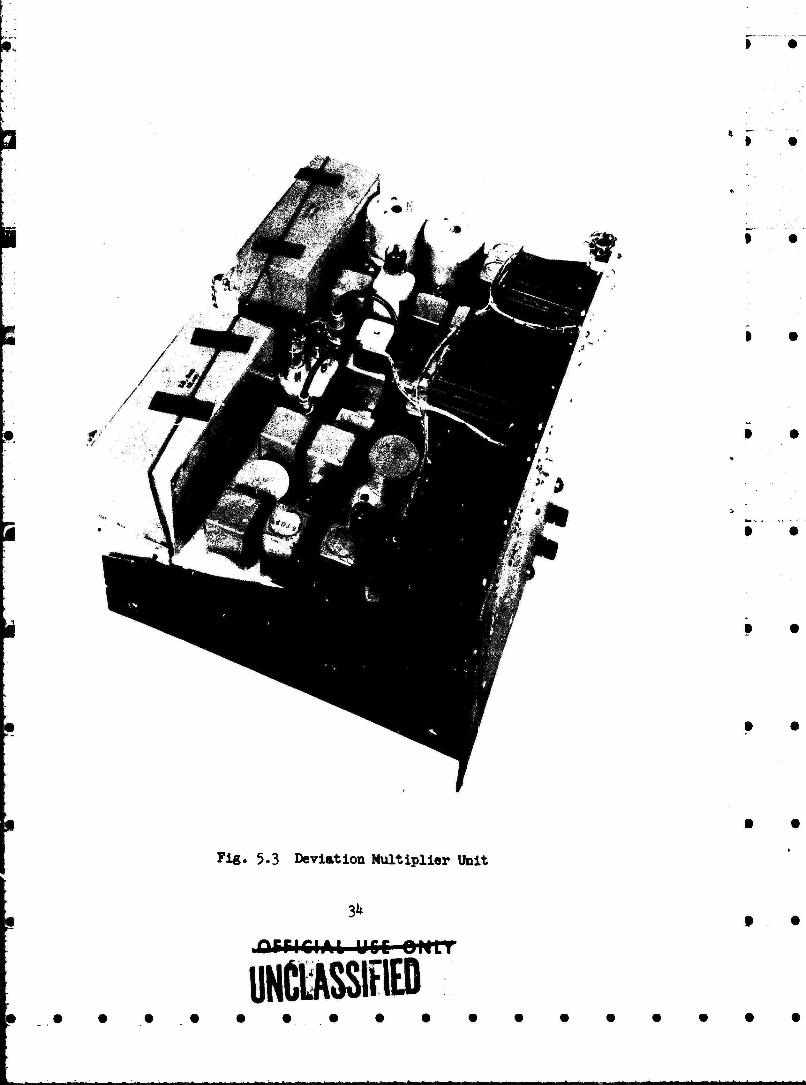
Field Unit 22 U.l Circuit Diagram of the Vibrotron Gage and Oscillator ... 25 h.2 Circuit Diagram of the Vibrotron Line Amplifier 26 1+.3 Vibrotron Gage and Amplifier Pressure-Time Record 27 5.1 Block Diagram of the Deviation Multiplier 31 • % 5.2 Circuit Diagram of the Deviation Multiplier 32 5.3 Deviation Multiplier Unit 3^ 5.U Pressure-Time Record Produced by the Deviation
Multiplier System . 35 6.1 Wiancko Pressure Gage 37 6.2 Wiancko Pressure Gage Sensing Element 38 9 • 6.3 Q of Coil vs Frequency of Oscillator - Wiancko Gage . . . . ÜO 6.U Q of Coil vs Pressure - Wiancko Gage hi 6.5 Modes of Vibration in the Wiancko Gage U3 6.6 Dynamic Response of the Wiancko Gage Showing Creep UU 6.7 Dynamic Response of the Wiancko Gage with Optimum
Damping hk "ß 9 6.8 Acceleration Effect vs Frequency of Vibration - Wiancko Gag»} U7 6.9 Acceleration Effect vs Acceleration Due to Drop Impact . . . U8 6.10 Dynamic Response of Wiancko Gage to Transient Pulses in
Shock Tube 1*9 6.11 Typical Calibration Curve - Wiancko Gage ... 51 6.12 Q of Coil vs Frequency of Oscillator for Wiancko Gages 9 ^
Failing in Field 52
TABLES
6.1 Electrical Characteristics of Several Wiancko Gages . . , , hO • • 6.2 Over-Range Protection for Various Range Wiancko Gages ... ^1 6.3 Natural and Damped Resonant Frequencies for Various
Range Wiancko Gages ^3
f t
UNCLASSIFIED CHAPTER 1
INTRODUCTION AND OBJECTIVES
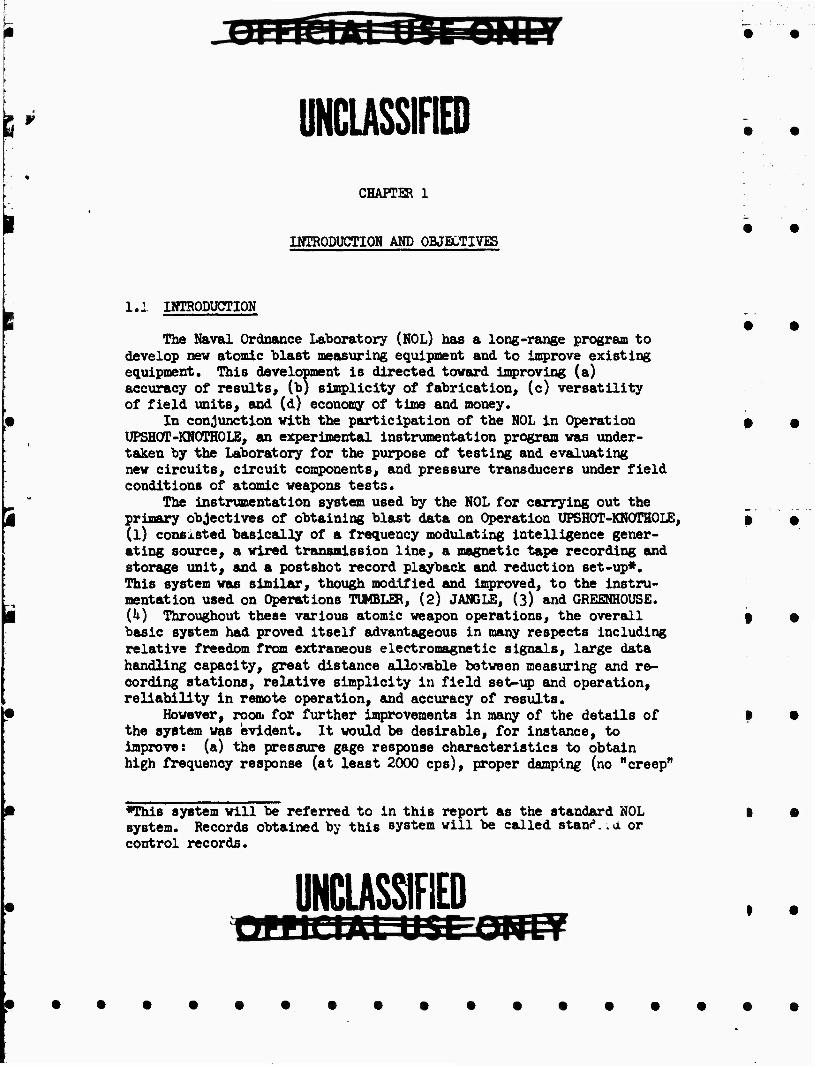
1.1 INTRODUCTION
The Naval Ordnance Laboratory (NOL) has a long-range program to develop new atomic blast measuring equipment and to improve existing equipment. This development is directed toward improving (a) accuracy of results, (h) simplicity of fabrication, (c) versatility of field units, and (d) economy of time and money.
In conjunction with the participation of the NOL in Operation UPSHOT-KNOTHOLE, an experimental instrumentation program was under- taken by the Laboratory for the purpose of testing and evaluating new circuits, circuit components, and pressure transducers under field conditions of atomic weapons tests.
The instrumentation system used by the NOL for carrying out the primary objectives of obtaining blast data on Operation UPSHOT-KNOTHOLE, (l) consisted basically of a frequency modulating intelligence gener- ating source, a wired transmission line, a magnetic tape recording and storage unit, and a postshot record playback and reduction set-up*. This system was similar, though modified and Improved, to the instru- mentation used on Operations TUMBLES, (2) JANGLE, (3) and GREENHOUSE. (k) Throughout these various atomic weapon operations, the overall basic system had proved itself advantageous in many respects including relative freedom from extraneous electromagnetic signals, large data handling capacity, great distance allowable between measuring and re- cording stations, relative simplicity in field set-up and operation, reliability in remote operation, and accuracy of results.
However, room for further improvements in many of the details of the system was evident. It would be desirable, for instance, to improve: (a) the pressure gage response characteristics to obtain high frequency response (at least 2000 cps), proper damping (no "creep"
«This system will be referred to in this report as the standard NOL system. Records obtained by this system will be called stam'-.d or control records.
UNCLASSIFIED J J J|W»*«M._
or ringing) and linear transfer characteristics; (b) the compactness of the field gage-oscillator unit packaging to permit use of the same unit in different types of mounts - ground, aboveground, in structures, etc.; (c) the field installation procedure by decreasing the total quantity of transmission wire necessary; (d) the flutter characteristics of the recording and playback machines by using wider frequency devi- ation signals and/or flutter bucking or canceling scheme's; (e) the record reduction procedure by using electromechanical or electronic data handling equipment.
1.2 OBJECTIVES
The scope of tho program undertaken was limited to the design, development, and testing of new equipment for only those desirable improvements which required full-scale field testing before complete and final evaluation could be made. On this basis, the following four experimental instrumentation problems were undertaken: (l) the development of a transistor oscillator-amplifier circuit to function with the Wiancko gage in a field unit, (2) the modification and adaption of the commercially developed Vibrotron pressure gage and oscillator circuit, (3) the development of a sub-miniature oscillator and two wire transmission line, and (U) the design and development of a deviation multiplier circuit for flutter compensation. / fifth problem, that of determining the resprnse characteristics of the Wiancko pressure gage, used so extensively on UPSHOT-KNOTHOLE, and evaluating its field performance, was added to this program and is reported herein.
All the experimental instrumentation tasks had a laboratory phase and a field testing phase. In the laboratory, the desired circuitry was designed, produced, and tested within the limitations imposed by the need for compatability with the basic instrumentation system and by a stringent time schedule. In the field, the test units were disposed to provide a direct performance correlation with the main instrumentation. These experimental units, their design, performance, and evaluation are described in the following chapters.
ÜHCLASSIFIED
• •
• •
CHAPTER 2
TRANSISTOR OSGILLu?OR-At!PLIFIER • •
2.1 DESIGN • , . •
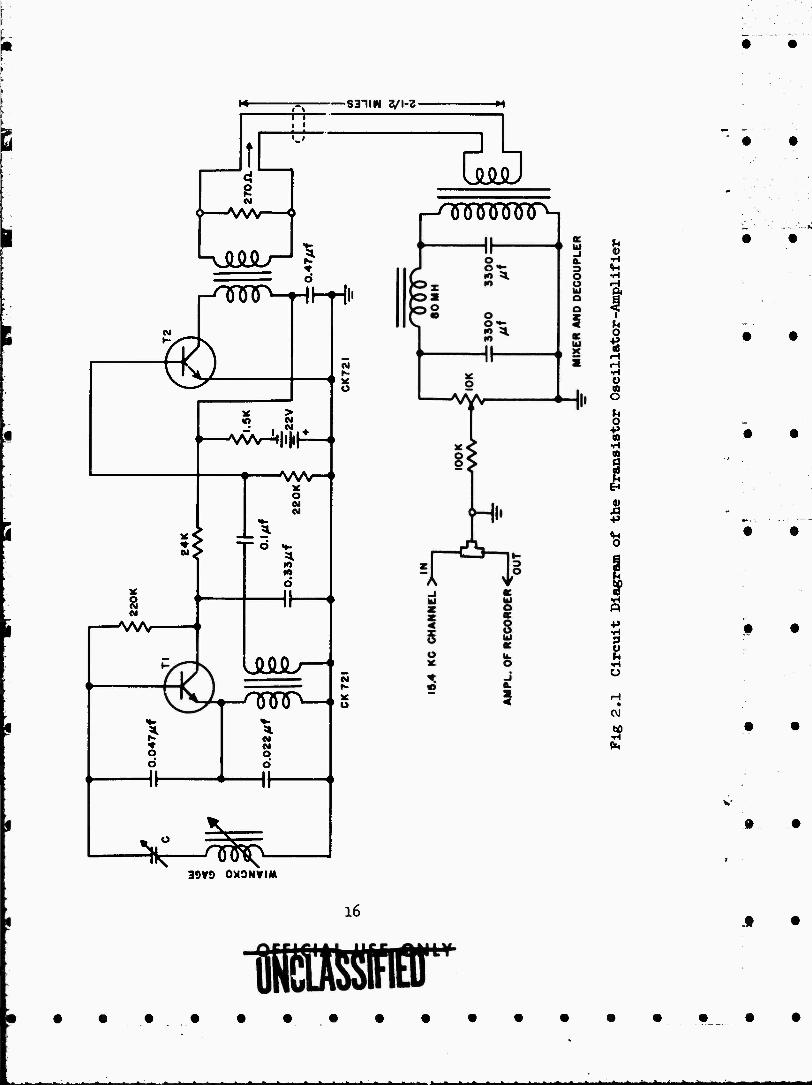
The transistor oscillator-amplifier field unit was designed to test the performance of transistors in circuits subject to high transient thermal and nuclear radiations, and high pressures and accelerations. Two Raytheon CK 721 p-n-p junction type transistors were used (Fig. 2.1). In the oscillator stage, transistor Tl (or tube, Tl in the vacuum tube equivalent circuit shown in Fig. 2,2) • • was operated essentially as a positive feedback current amplifier to produce series resonance. The variable inductance coil of the Wiancko gage served as the frequency determining element of the oscillator tank circuit. The output of the oscillator was fed to transistor T2 which operated as a grounded emitter power amplifier „ and buffer stage. An impedance-matching transformer coupled the • • output signal of this stage to a low impedance 3 mile long trans- mission line. The complete unit was powered from a 22-1/2 volt Minimax battery. With the oscillator operating at a center frequency of 10.7 kc, the total current requirement for the unit was 1.5 ma, and approximately 1.0 volt rms was developed across the 270 ohm load. No attempt was made to miniaturize the packaging of this experimental field unit since the transistor operational performance was the main point of investigation in this experiment.
2.2 PERFORMANCE
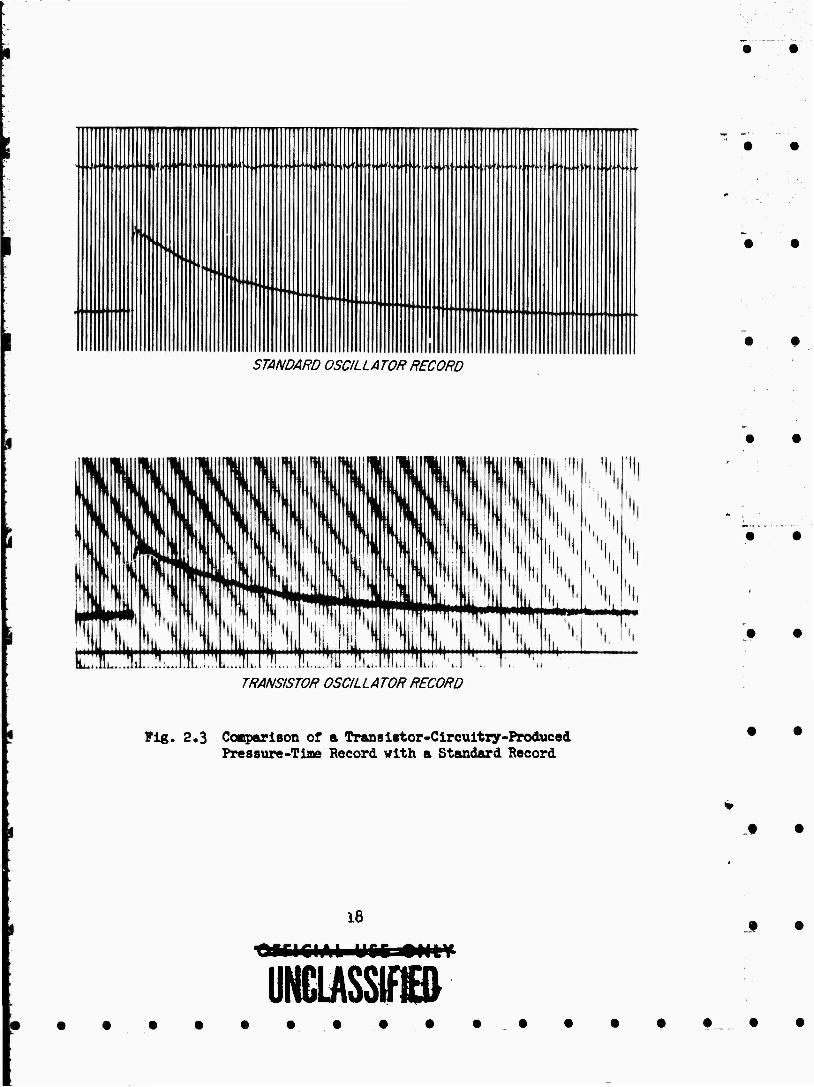
Only one transistor unit was built. The unit was used on two • • shots of UPSHOT-KNOTHOLE, and in both instances this unit was within a few feet of the standard vacuum tube field unit so that direct comparison could be made of the results. On the first shot a good record was obtained from the transistor unit. This record compared very well with the adjacent standard control record as to gross quali- tative and quantitative features (Fig. 2.3). However, the transistor • • oscillator-amplifier record showed an extraneous "hash" superimposed on the trace which was not present on the control record. The origin of this noise is not known. It appeared approximately 15-20 msec
• •
«Hem» ji •
y
p
^^~ r4-~ ■ i
t v
o N
i WA^ « i
kilÄiL^ 5
■S31IW Z/\-Z-
r^WT^Hhrll
i
m CM
u
• ^ÄAr-!^|lil^i
o N M
1 WVr
-wv—(• o M M
m d
ülÄiL/-^_
r-^Tnnr^—• 5t ♦ O Ö
HI-
51 N M O d
^ ■nrs^
UMJ
r^wöinnrtrs
I u o
15 H •H O m O
o 09 •H ID
Ü
O
9 Ü
Ü
1*4
*;•
39V9 OMONVIM
16
" ■ - ■ J -■■ ■
■IH-L • •
• •
• •
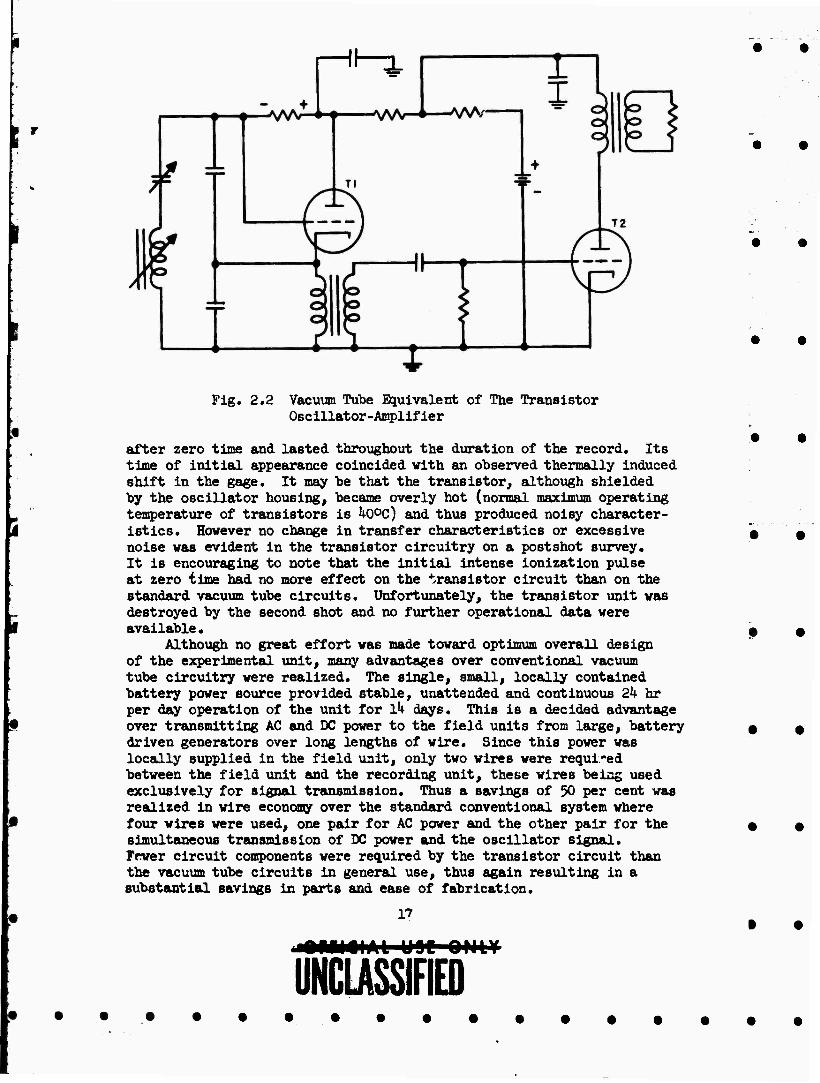
Fig. 2.2 Vacuum Tube Equivalent of The Transistor Oscillator-Amplifier
after zero time and lasted throughout the duration of the record. Its time of initial appearance coincided with an observed thermally induced shift in the gage. It may be that the transistor, although shielded by the oscillator housing, became overly hot (normal maximum operating temperature of transistors is ^0oC) and thus produced noisy character- istics. However no change in transfer characteristics or excessive noise was evident in the transistor circuitry on a postshot survey. It is encouraging to note that the initial intense ionization pulse at zero time had no more effect on the transistor circuit than on the standard vacuum tube circuits. Unfortunately, the transistor unit was destroyed by the second shot and no further operational data were available.
Although no great effort was made toward optimum overall design of the experimental unit, many advantages over conventional vacuum tube circuitry were realized. The single, small, locally contained hattery power source provided stable, unattended and continuous 2k hr per day operation of the unit for Ik days. This is a decided advantage over transmitting AC and DC power to the field units from large, battery driven generators over long lengths of wire. Since this power was locally supplied in the field unit, only two wires were requi-ed between the field unit and the recording unit, these wires being used exclusively for signal transmission. Thus a savings of 30 per cent was realized in wire economy over the standard conventional system where four wires were used, one pair for AC power and the other pair for the simultaneous transmission of DC power and the oscillator signal. Fewer circuit components were required by the transistor circuit than the vacuum tube circuits in general use, thus again resulting in a substantial savings in parts and ease of fabrication.
17
L USE ONLY
UNCLASSIFIED
• •
STANDARD OSCILLATOR RECORD
• •
• •
• •
• •
• •
• •
TRANSISTOR OSCILLATOR RECORD
Fig. 2.3 CoBparison of a Transistor-Clrcultxy-Produced PreBsure-Time Record with a Standard Record
• •
UNeiASStfB
Jl •
18 • •
• •
» ■ I»
2.3 COSCLUSIOMS AM) RBCOMMENDATIOHS
' Based on the results of the one test, the transistor element is f conslderud promising for atomic test instrumentation, although further
development and testing should he undertaken hefore a complete measure- l went program is committed to transistor circuitry. The source of the [ extraneous noise should be determined and if possible, this source
should be eliminated. Laboratory investigation may provide the solution to this problem; full-scale atomic testing should confirm it.
r Development work should be undertaken to realize the full potentialities of the advantages inherent in transistor circuitry, particularly vith regard to miniaturization. A small field unit would be adaptable to a variety of mounting conditions. By proper attention to these and other details, even further over-all savings should be realized.
With the encouraging transistor circuitry performance realized and P the potential advantages so readily obtainable, further investigation P and development of transistor circuits should continue with high hopes
of producing a serviceable field unit for atomic weapon blast measure- ments instrumentation.
» r
9.
• •
• •
• •
ft •
i •
I •
I •
I •
19
msm
• •
CHAPTER 3
SUB-MINIATURE TWO-WIRE FIELD UNIT
3.1 DESIGN
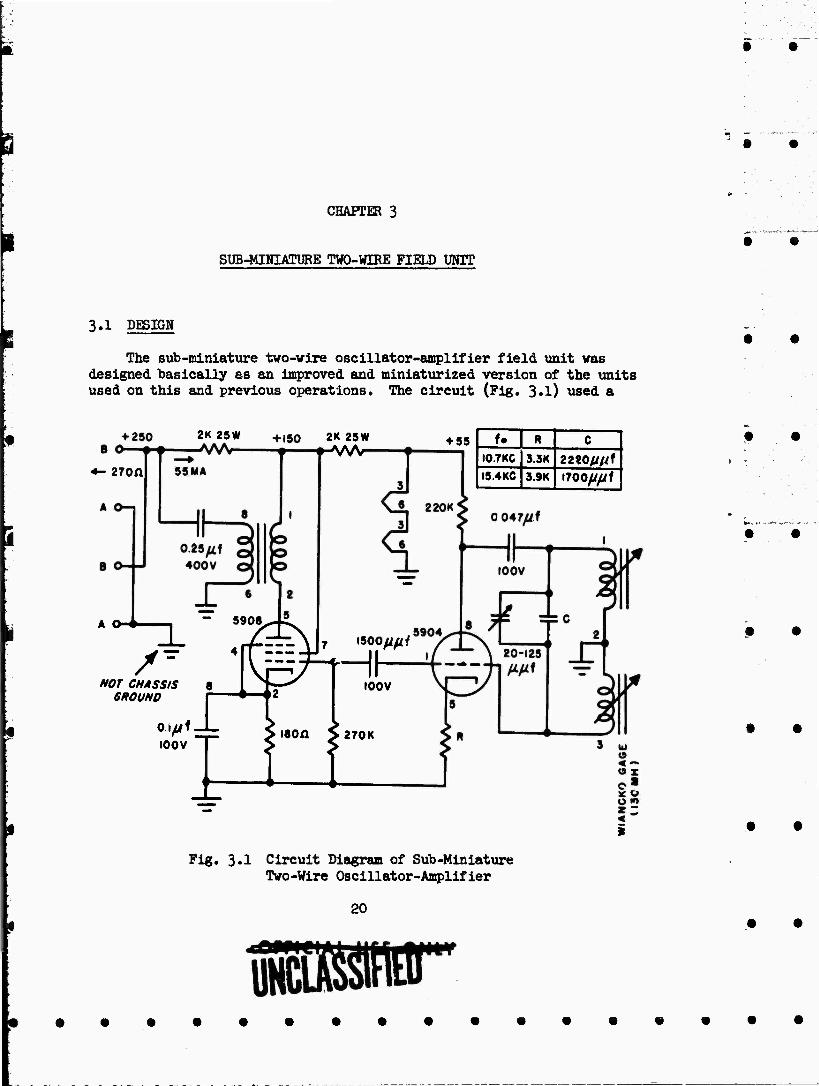
The sub-miniature two-wire oscillator-amplifier field unit was designed basically ss an improved and miniaturized version of the units used on this and previous operations. The circuit (Fig. 3*1) used a
• •
• •
2K 2SW
«-270X1
2K 2SW + S5
A O-*
NOT CHASSIS GROUND
Ol/ifJ- 100 V
fo R C
I0.7KC 3.3K 2220l///f IS.4KC S.9K 1700////f
- 5906^- i
k (»2 I00V
I80n > 270K
Fig. 3.1 Circuit Diagram of Sub-Miniature Two-Wire Oscillator-Amplifier
20
Sylvanla type 590^ triode in the Hartley oscillator stage. As in the standard unit, the Wiancko gage inductance vas the frequency-determin- ing element of the tuned circuit. Because of the low Q of the gage inductance (approximately 5-6) resistor R was inserted into the cathode circuit of the 590^ tube to improve the stability of the oscillator. The oscillator output was coupled to the grid of a pentode power amplifier tube, Sylvania type 5906. Since the plate resistance, rp, of the pentode is large, the output circuits of several field units could be put in parallel without reduced output or excessive distortion resulting from feedback. The amplifier as used developed 50 volts rms across tne 220 ohm line with a total harmonic distortion of less than 3 per cent. (The distortion figure can be reduced to 1 per cent with a slight reduction in output voltage by adding a 1 megohm resistor between the plate and grid of the pentode to provide a small amount of negative feedback.)
The 26 volt filaments of the two tubes were put in series, and this series arrangement was placed in parallel with the plate of the oscillator tube which required 55 volts DC. By thus utilizing the DC plate source for the filament power source also, the need for AC power at the field unit was circumvented and it became a simple task to simultaneously transmit the required DC power and the oscillator- amplifier signal over the same pair of leads. The total DC current drawn from the unit was approximately 60 milliamperes at 300V DC.
The sub-miniature size of the tubes and the elimination of the need for a filament transformer, materially helped in producing a small, compact field unit. A further saving in space and components was realized in the elimination of the bridge network required when signals from several standard low rp triode output units were mixed. By careful design, the complete field unit - gage and oscillator- amplifier - was housed in an aluminum cylinder 3 in. in diameter and 6 in. long (Fig. 3*2), making the unit easily adaptable for installation in structures, aboveground baffles, and ground mounts. The unit was made relatively free from detrimental environmental conditions s ich as dust, temperature variations, and water by the use of "0" ring seals. An attempt was made to dissipate heat uniformly within the unit so as to obtain stable oscillator performance Independent of ambient field temperatures. This was done by wrapping each tube in crinkled aluminum foil so thtt an uninterrupted thermal conductive (rather than convective) path was provided from the tube to the metal housing.
• •
• •
• •
3.2 PBBFaBMAHCE
Two experimental sub-miniature field units were built for testing on this operation. Each was used on two shots. The outputs of the two units, operating at center frequencies of 15*^ kc and 10.7 kc respec- tively, were diplexed and transmitted back to the recording units over approximately 2-1/2 miles of unshielded telephone wire (Signal Corps wire WD-l/TT).
Both units functioned properly on both shots. The records ob- tained from these units were indistinguishable from the control records
21
•
p
m
ß.
i
•
i •
» •
i •
f •
i •
» •
Fig. 3.2 Sub-Miniature Two-Wire Oscillator-Amplifier and Gage Field Uolt
22 I •
I
i
i
produced by the standard field units. A miner deficiency was observed in preshot operation of the oscillator: the center frequency of the experimented units varied with changes in ambient temperature to a greater extent than the standard oscillator unit center frequency. A relocation of parts or the selection of temperature compensating elec- tronic components should ease this problem.
3.3 CONCLUSIOHS AMD RBCOMMEHDATIONS
The sub-miniature two-wire oscillator-amplifier field unit proved successful. Except for the slightly excessive temperature sensitivity, the desired goals were reached - a small sealed package adaptable to many field Installations, a reduction in the number of electronic components, and the use of only two wires between the field unit and the power and recording station. The design of this experimental unit will certainly serve as the basis for new oscillators for the NOL FM system when new oscillators are warranted; however, for the present at least this unit will be limited in its field application to those situ- ations where signals are at most diplexed because of the limited power supply capacity of the present NOL instrumentation trailers.
• •
f •
• •
• •
*3 . 9
• •
CHAPTER U
"V •' VIBROTRON GAGE AMD AMPLIFIER
U.l DESIGN • •
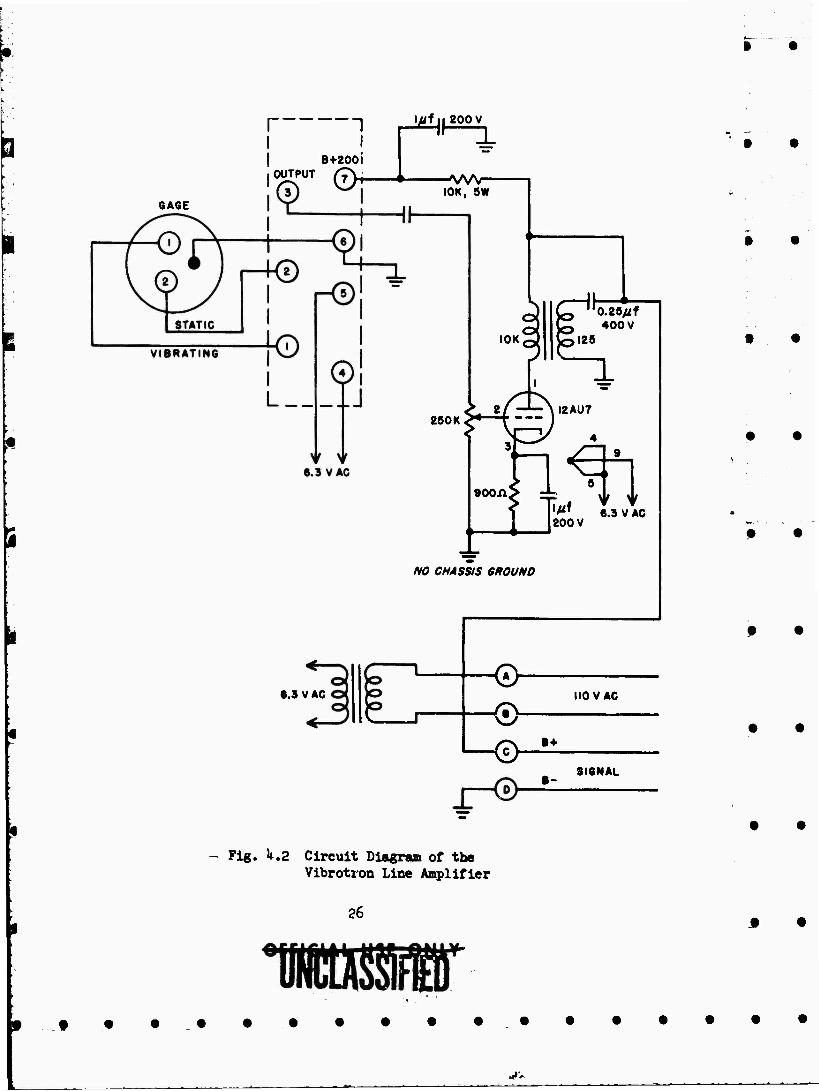
The Vibrotron gage and amplifier, a commercially available product of the Byron Jackson Co., derives its principal potential advantages from the gage design itself. The gage affers high frequency response, linear transfer characteristics, and wide frequency deviation for application in an FM system. The sensing element of the gage consists of a vibrating wire, Q»k mil tungsten, held in tension between a fixed • • tie point and a pressure sensitive diaphragm. The length and tension v
of the wire determine its vibrating frequency, and its mode of vibration is controlled by a magnetic field directed perpendicular to the wire. The gage is part of a bridge circuit which derives its er ^y from the 6BA6-12AT7 positive feedback voltage amplifier (Fig. k,l). Pressure * . . on the diaphragm changes the length and tension of the wire, altering * * its vibration frequency accordingly, and thus providing a frequency modulated signal. This signal from the Bridge amplifier is then fed to the remaining half of the 12AT7 output amplifier. A portion of the output is rectified and used as the bias for the bridge amplifier thus making the circuit stability practically independent of plate supply variations. _ • ..•
In order to use the Vibrotron gage and amplifier unit with the HOL system, slight modifications to the unit were required as shown in Fig. U.2. The power amplifier stage was added to match the high im- pedance output of the 12AT7 to the 270 ohm line, and this stage served in the additional capacity of a buffer amplifier permitting the paral- leling of two signals into a common load without undue intermodulation * * between these signals.
Three Vibrotron units were purchased and adapted for the testing program. Two units were operated at a center frequency of approximately 15.U kc; the third unit was operated at 7.7 kc. The frequency response of the gage and amplifier was approximately 3 kc. A design figure of + 20 per cent frequency deviation at nominal pressure range was realized * * on two units; the third unit was operated at + 30 per cent frequency deviation at nominal pressure range.
2%
r»IUJVl
ÜHCLASM
i
f—f-'WVr-t—l|l
r
5 V^ws^i, \ 1 (M o. 8 o
>—^AAr-*——AAAH i
u o
o a O
I C5
U
s o
I •rl O
9 o U u
pH
AAAr-||i
ü t
-, 'Af II 200V
I B+200i
6A6E I0K, SW
^
IOK,
•o.as^f 400 V
,129
a 250 K >*-l/rzi\l2AU7
^
I'WT 6.S V AC 200 V
NO CHASSIS 6/fOUND
«.S V AC
-0- no VAC
l-(£> •+
SIGNAL
Fig. U.2 Circuit Diagraa of the Vibrotron Line Anplifier
26
• •
t •
• •
t •
• •
• •
f •
• •
• •
-• •
«»v
U,2 PERFORMANCE
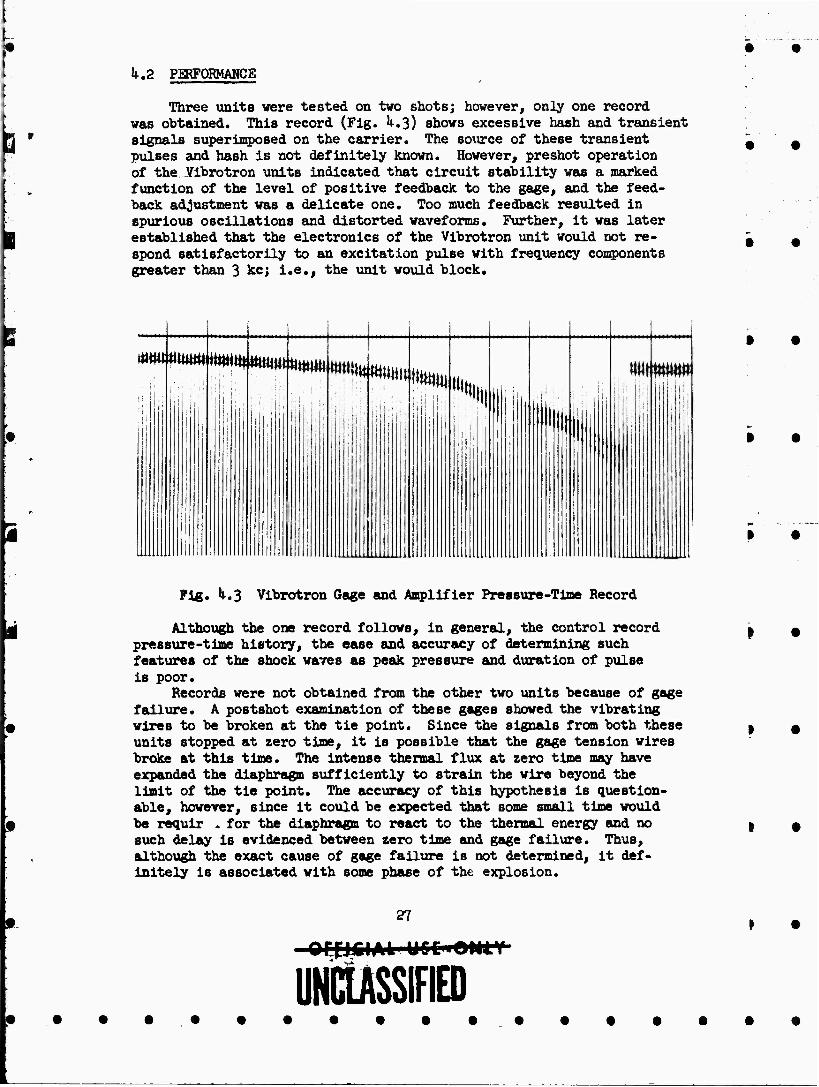
Three units were tested on two shots; however, only one record was ohtained. This record (Fig. ^.3) shows excessive hash and transient signals superimposed on the carrier. The source of these transient pulses and hash is not definitely known. However, preshot operation of the Jfibrotron units indicated that circuit stability was a marked function of the level of positive feedback to the gage, and the feed- back adjustment was a delicate one. Too much feedback resulted in spurious oscillations and distorted waveforms. Further, it was later established that the electronics of the Vibrotron unit would not re- spond satisfactorily to an excitation pulse with frequency components greater than 3 kc; i.e., the unit would block.
«^««««♦^^^«m^mii toWMMiittim ^iiil
Fig. H.3 Vibrotron Gage and Amplifier Pressure-Tin» Record
Although the one record follows, in general, the control record pressure-time history, the ease and accuracy of determining such features of the shock waves as peak pressure and duration of pulse is poor.
Records were not obtained from the other two units because of gage failure. A postshot examination of these gages showed the vibrating wires to be broken at the tie point. Since the signals from both these units stopped at zero time, it is possible that the gage tension wires broke at this time. The intense thermal flux at zero time may have expanded the diaphragm sufficiently to strain the wire beyond the limit of the tie point. The accuracy of this hypothesis is question- able, however, since it could be expected that some small time would be requir * for the diaphragm to react to the thermal energy and no such delay is evidenced between zero time and gage failure. Thus, although the exact cause of gage failure is not determined, it def- initely is associated with some phase of the explosion.
27
orqjsiAL
UNCLASSIFIED
» •
J|.3 CONCLUSIONS AND RBCOMMEHDATIOMS
On the feasis of the field operational tests performed on the Vibro- tron units, it is concluded that the Vibrotron gages and amplifiers as used on UPSHOT-KNOTHOLE are unsuitable for use in applications of this ' » • type. They are unstable in operation, insufficiently rugged for field operation, and require excessive care in adjustment. Further develop- ment work may overcome the existing deficiencies of the units and make . : available the full potentialities of the basically sound principle of the vibrating wire gage.
i •
I •
i •
i » •
i •
t •
** . .
•«rnciAL u» mmr
.^._
CHAPTER 5
DEVIATION MUITIPLIHl
5.1 IHTRODUCTION •
The dynamic range of a measuring system is determined, to a large extent, by the inherent noise level of the system. In general, it is desirable to have a low noise level and a large signal; i.e., a large signal-to-noise ratio. The deviation multiplier unit is a circuit designed to increase the signal-to-noise ratio by increasing the signal frequency deviation obtained from a transducer. •
In the HOL M system using magnetic tape recorders and reproducers, the inherent system noise is introduced principally by the tape handling machines in the form of a frequency modulating flutter. This flutter noise is of a fixed value equal to 0.15 per cent of the frequency re- corded on the tape. For a full scale (nominal) pressure signal a frequency deviation of 7*5 per cent of the oscillator center frequency P is realized for the signal. The signal to noise ratio ie then 7»?
0.15 or 50:1. However, if a signal deviation of only 1.0 per cent is realized, the signal-to-noise ratio becomes 1.0 or approximately 7:1/
0.15 which value becomes marginal for required accuracies and desired ease f of reading records. The deviation multiplier receives this low level signal (or any signal) and effectively increases the frequency deviation by a factor of approximately 3, and thus increases the signal-to-nolse ratio by the same factor, which makes it an acceptable value, (in the above example, the deviation multiplier would increase the 1 per cent frequency deviation to 3 per cent and the signal-to-nolse ratio would *
^ -2-. * 20:1.) It is obvious that since it is the tape handling v. JLp
machines that introduce the flutter noise, the signal deviation should be large on the tape; therefore, the deviation multiplier unit is inserted into the system between the gage pr-iuced FM signal and the recording amplifiers. *
5.2 DESIGN
29 .
-■--■■■ ■- -
5.2.1 General
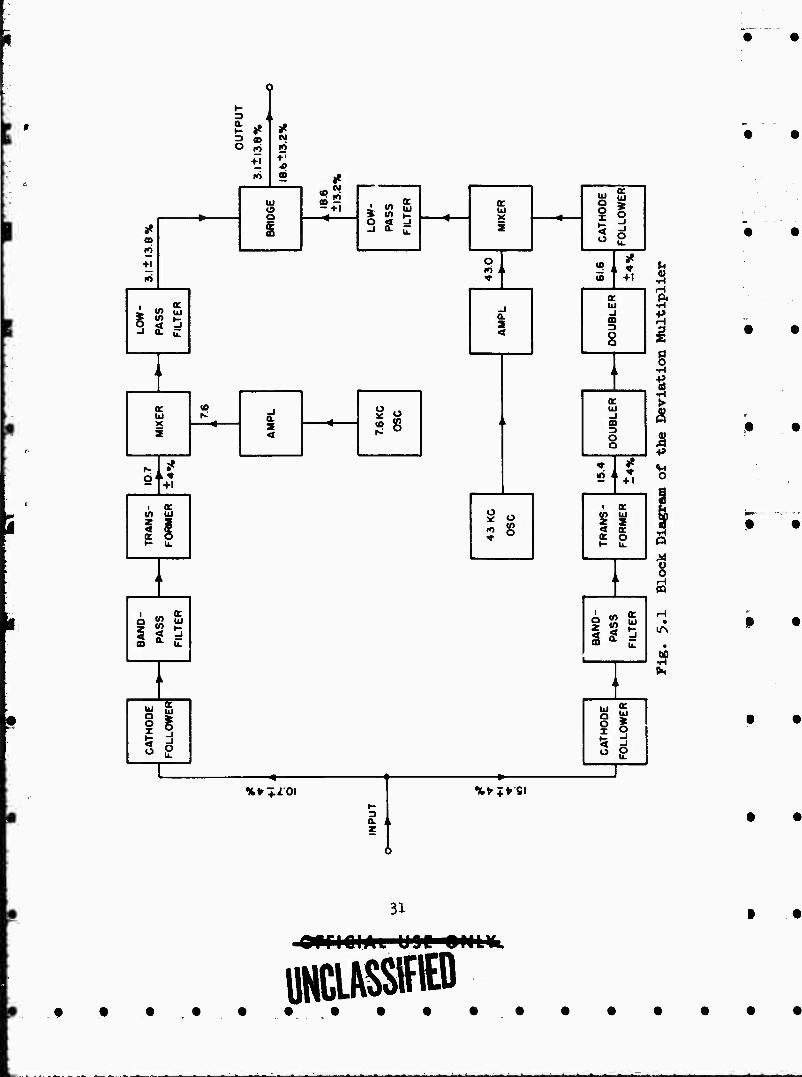
The deviation multiplier unit contained two channels, one for use with a 15.^ kc input signal, and the other for use with a 10.7 kc input signal. Slightly different methods were used in each channel to pro- vide the Increase in deviation. This was required in order to prevent intermodulation between the frequencies of the two channels and to allow the diplexlng of recorded signals.
In the 15.^ kc channel (Fig« 5*l) tiie input signal with its modulation was quadrupled. For example, a 15*'' kc signal with a + 1*- per cent frequency deviation modulation (15^00 cps + 616 cps) is-
converted into 61.6 kc + U per cent (61,600 cps + 2^64 cps). This signal is then heterodyned with the output of a fixed ^3 kc local oscillator. By suitable filtering, the difference frequencies only are fed to the tape recorder. These frequencies are 18,600 + 2U6U cps or 18,6 kc + 13.2 per cent. Thus the unit has effectively multiplied the original signal deviation of 616 cps or k per cent to 2k6h cps or 13.2 per cent; the signal deviation has been increased by a factor of 13*2 »3,3. Since the flutter value for the tape oachiae is a constant
0.15 per cent, the signal-to-noise ratio is increased by a factor of 3.3.
In the 10.7 kc channel, the input signal with its modulation signal is mixed directly with the signal from a 7.6 kc heterodyning oscillator. A low pass filter following the mixer removes all but the difference frequencies and passes them on to the amplifier of the tape recorder. As an example, a 10.7 kc input signal with & ±k per cent modulation (10,700 + Ü28 cps) is mixed with the fixed 7.6 kc frequency of the local oscillator. The difference frequencies are 3.1 kc + lf28 cps or 3.1 kc + 13.8 per cent. Thus the signal frequency deviation being recorded on the tape has been increased from h per cent to 13.8 per cent, or by a factor of 13^ a 3,1»5. With the noise
remaining constant at 0,15 per cent, the effective signal-to-noise ratio hat been increased by the same factor: 3*^5*
Thus, for both input signals, wide frequency deviation is ob- tained. It is to be noted that the 15,k kc input signal with its modulation is recorded as an 18.6 kc signal with increased modulation deviation, and the 10.7 kc plus modulation input signal is recorded as a 3*1 kc signal also with Increased modulation deviation. This separa- tion of recorded signal frequencies was sufficient to permit diplexing on a common recorder head without undue intermodulation between signals.
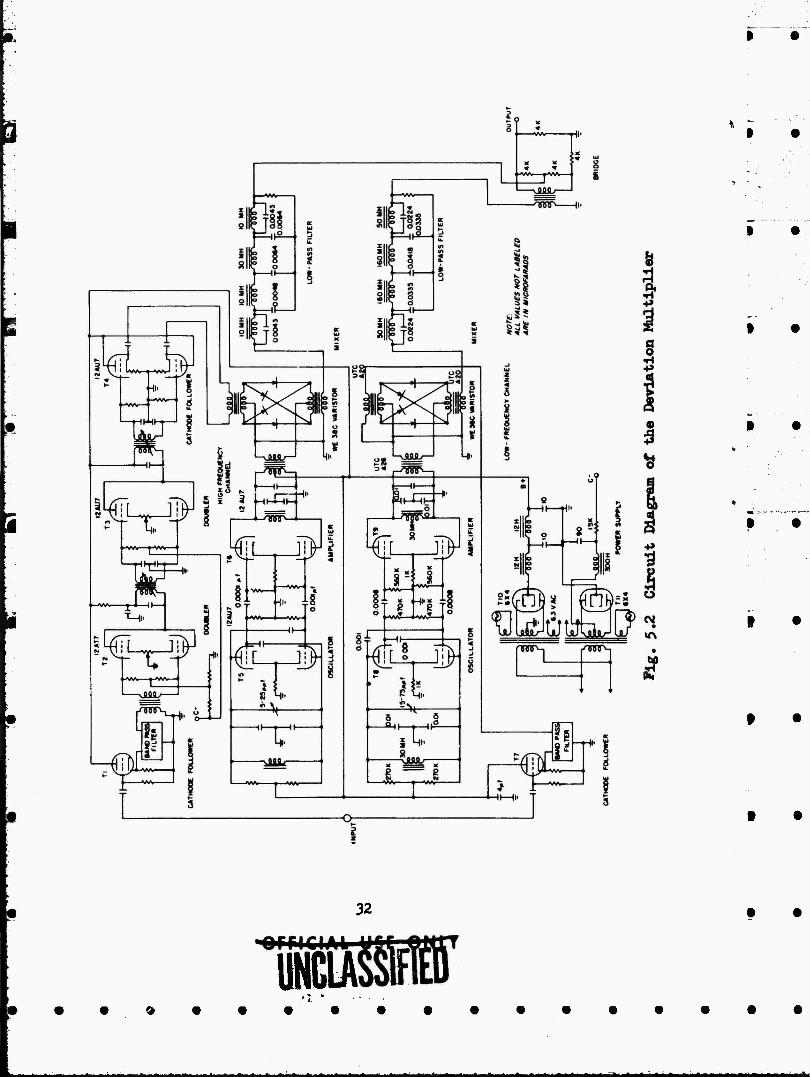
5.2.2 Circuit
A brief description of the deviation multiplier circuit (Fig.5.2) follows: The diplexed signal frequencies, 15.^ and 10,7 kc, from the field units enter the input cathode follower stages, Tj^ and Tg, of the two channels. These low impedance output stages provide adequate signal to the channel band pass filters. The filtered 15.U kc signal
30
? K 3 A ^ »« * 3 CD M O ,0 K>
+1 IO CO
«.1 1
LO
W-
PA
SS
FIL
TE
R
UJ X Z
CA
THO
DE
FOLL
OW
ER
*
+1 s SH ro * «, +i
K . (t UJ
s. O Ui 1 (rt " q 4 _i 2
-J CO
-J a. c 4 o o
J i i
K ac ID
s! o ., UI
UJ r^ • 8 i -1
o z> S
3
o
2' *
+1 !0 '^
■ K I QE «A UJ
5 S tf> UJ
z 1 Z Z « 1 4 ac a o oc o »- b. •- u.
i i -
BA
ND
-
PA
SS
FIL
TE
R
BA
ND
-
PA
SS
FIL
TE
R
i i i i
CA
THO
DE
FOLL
OW
ER
ATH
OD
E
LLO
WE
R
oy
%*110\
3 a. ,,
%fr I*SI
o o
1^1
31
• »
32
HJMT • • • • • •
— --■• '- -.^ - ... - -... ^.■...- ■a--a,.„.^^..^.,...^_-.. .^. .„.■J....^,a-^-3^.. ^^—--,—^--.^.^■■.a..
is then transformer matched to a broad tuned frequency doubler, T2. The output is then doubled again in To. The two doublers increase the input 15.If kc signal frequency to 6l.6 kc and are operated push-push Class B to minimize harmonic distortion. An output cathode follower stage, T^, matches the high impedance output to a 2000 ohm balanced modulator type varistor mixer. The heterodyning U3 kc oscillator T5, is followed by a tuned amplifier, T6, operated Class A. This push- pull amplifier was designed to reduce harmonic distortion and to provide sufficient output voltage at a low inipedance to effect efficient mixing. A high ratio of oscillator voltage to signal voltage is necessary for efficient mixing. The output of the amplifier is transformer cotfsled to the non-linear varistor mixing stage where sum and difference frequencies are produced. The difference frequencies (16.6 kc + modu- lation) are passed on through the low pass filter following the mixer and are linearly combined with the output of the 10.7 kc channel in the resistance bridge circuit.
The 10.7 kc signal input after filtering is fed directly to an- other varistor mixer. The signal from the local heterodyning oscil- lator, Tg, operating at 7*6 kc is amplified by T], and fed to this same mixer stage. The difference frequencies produced (3.1 kc + modulation) pass through the low pass filter to the resistance bridge and combine with the l8.1 kc signal from the high frequency channel. The output of the bridge is fed directly to the recording amplifiers.
A total input signal of 1 volt rms results in an output of approximately 0.5 volts rms - quite adequate to drive the recording amplifiers.
5.3 PBffORMAHCE
One deviation multiplier unit (Fig. 3*3) was constructed and used on two shots. Excellent results were obtained, (Fig. 5»10, and the designed increase of signal-to-noise ratio was realized in the field. The records are noise-free (the width of the trace is limited by the spot size of the galvanometers) and follow in detail the pressure vari- ations of the control records. Without question, the records obtained by use of the deviation multiplier are superior to the standard records, and they can be read with greater ease and accuracy.
The one disadvantage of the unit is its complexity. Extreme care was taken to minimize the production of extraneous frequencies within the unit and to properly channel the desired frequencies through the various stages. This resulted in the inclusion of many filter circuits and optlmumly designed linear amplifiers, (it was found in the devia- tion multiplier units used on GREENHOUSE {k) that where insufficient signal level and poor filtering occurred simultaneously, the deviation multiplier introduced more "noise" into the system than was compensated for by the wide signal deviation obtained.) The further requirement for diplexlng resulted in the additional complexity of frequency doublers and still more filters.
3
I
ill
Fig. 5.3 Deviation Multiplier Unit
• •
3^
.Q»I6IAL U
• • •
■■ ■ ^ » *.* ^-.a.— j ^ A.^-..,»^..,^^-^ _„_J^_^J_ IWiMWUMMlMHtt WiMMiMliMilllMHiBMMMHMlMIMtfiWflHItalHiUI
[■
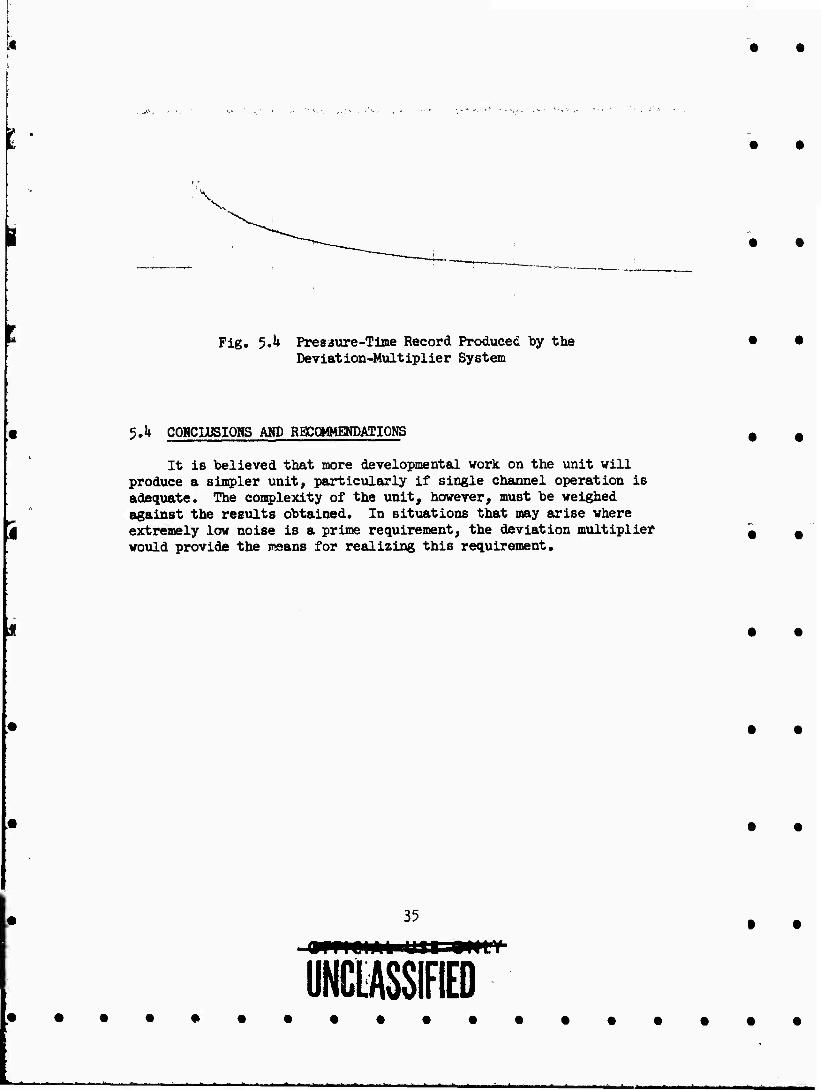
E Fig. 5«^ Presisure-Tlme Record Produced ty the Deviation-Multiplier System
i
5.^ COMCLÜSIOHS AND RBCOMMEMDATIONS
It is believed that more developmental work on the unit will produce a simpler unit, particularly if single channel operation is adequate. The complexity of the unit, however, must he weighed against the results obtained. In situations that may arise where extremely low noise is a prime requirement, the deviation multiplier would provide the means for realizing this requirement.
35
• MHIHll UJI gllLY
UNCtASSIFIED
•^ " ■* - ». ^ . ^ ■•■*- "■ ^ "
CHAPTER 6
THE WIANCKO PRESSURE GAGE
6.1 IMTRODÜCTION ' #
6.1.1 General
In the selection of a transducer for measuring pressure phenomena there are two important questions which must be considered; namely, what type of pressure phenomenon is to he measured, and what recording " _ system is to he used to transform the pressure-induced signals into a usable record. In the present application, the pressure phenomenon to he measured was that of shock pressure-time histories resulting from large-scale explosions, and the recording was to he accomplished by an FM signal generation system, (l) Thus the transducer had to , have the ability to change a pressure signal from an atomic blast into r - - an electrical output which could in turn be used to modulate the FM carrier frequency.
6.1.2 Gage Requirements
The above requirements for a transducer could be met by the use _ # of a variable reluctance type transducer whose variation in inductance modulates the center frequency of a Hartley oscillator, thus giving a frequency variation which is a function of the applied pressure. For a nominal 20 KT bomb, a frequency response of 1000 cps would give results of 1 per cent accuracy for a critically damped system. Thus the transducer should have a frequency response of this order.
6.2 THE WIANCKO PRESSURE GAGE
6.2.1 General Description
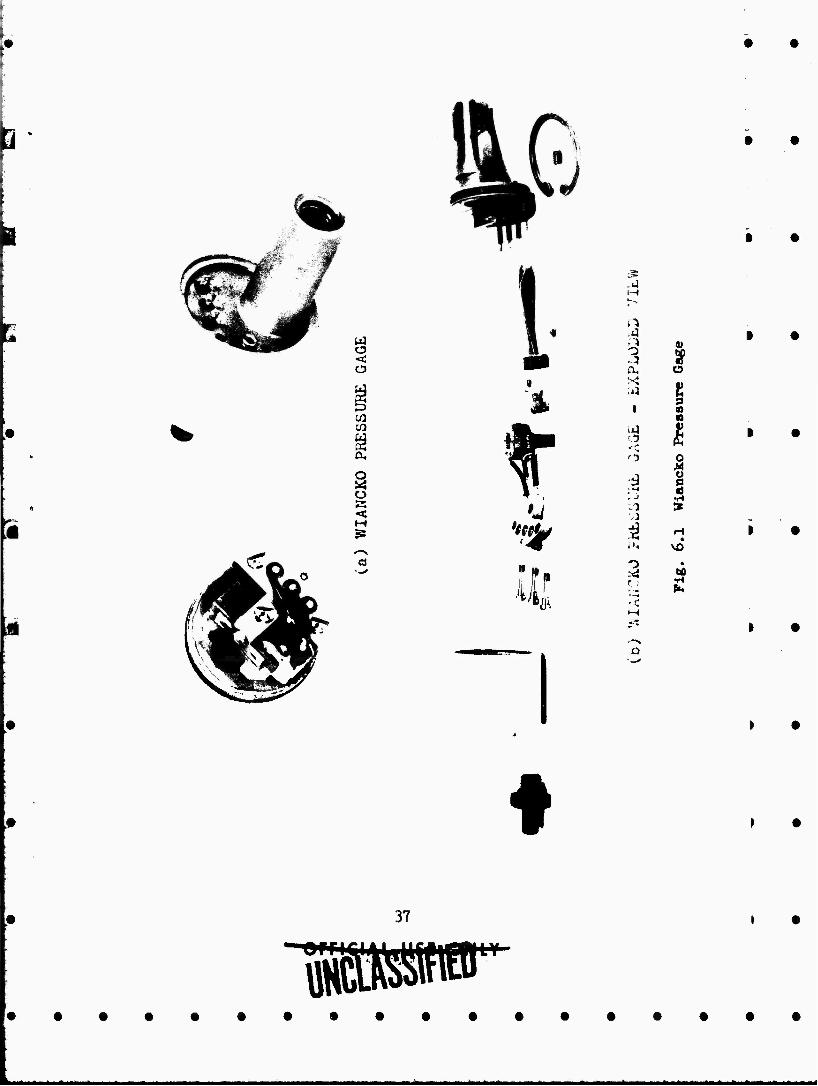
The preceding electrical and mechanical characteristics along _ . with temperature stability, accuracy, simplicity of operation, rugged- ness, and compactness led to the selection of a transducer (Fig. 6.1) of the PAD type (now the IhOO series) manufactured by the Wiancko Ebgineering Co. and modified by the manufacturer to fit the specific
36 9 •
orriii^h ycc
B
I
o
a.
o
M
d
fl
,A
a. ;i3
•5
o
.1
v
3 a a
I S a § •H SB
vw^w —■.
Q
^^^^Jl\^^^^^^
!• j
1 •
!■• f ► •
• 37 1 •
• • • • ••••••
ir • • • • • • • •
"'-■J- - ' - ^ -— - - ■ - mamtammiim^ma^m ^MMMM^MniMIMiMIHilHMllHldtelAHl
requirements of NOL. The sensing element (Fig. 6.2), in the Wiancko pressure pickup
consists of a flat twisted tube which, when excited by an internal pressure, moves in torsion causing the armature (Mn-metal pad) above the E core to rotate and change the inductance of the gage. The rotation is directly analogous to the straightening out of a bourdon tube. The rotation of the armature is approximately 1 degree for the normal rated range of the gage and the desired electrical sensitivity Is obtained by changing the initial spacing between the armature and and the S core.
■
MU METAL ARMATURE
WIANCKO TWISTED TUBE FIXED AT THIS END TO GAGE HOUSING
PRESSURE INLET
INDUCTANCE COIL
CORE • •
Fig. 6.2 Wiancko Pressure Gage Sensing Element
I
The gages were equipped with an adjustable "bleed plug" to equalize the pressure in the Instrument case as the ambient temperature and barometric pressure changed. These gages also could be used as a differential pressure gage if the need arose.
6.2.2 Design Specifications
As the electrical coil configuration in the majority of Wiancko pickups had been designed for use as the two active arms of an induct- ance bridge, a slight modification had to be made so that the gage could be used in a Hartley oscillator circuit. One coil was removed and a single coll was used with the following electrical specifications:
Inductance: Approximately 120 millihenries, with a ho per cent tap, tumswise.
• •
• t
• •
Resistance;
Q
Approximately 100 ohms (DC),
Minimum U.5 at 1U.5 kc.
It was felt that the desired mechanical properties of the gage should be those listed helow:
Deviation
Rise Time
Damping
Hysteresis
Linearity
8 to 9 per cent of rated range on 10 psi gage and higher with a minimum of l6o per cent over-range protection. Minimum of 7»5 per cent of rated range on 5 psi gage vith minimum of 135 per cent over- range protection.
Less than 0.3 msec.
0.6 to 0.7 critical at 75*^.
0.8 per cent of 'bandwidth.
Not greater than 10 per cent non- linearity over indicated usable range.
Acceleration Effect 0.01 to 0.05 per cent per G.
Temperature Effect 0,02 per cent of pressure per degree Fahrenheit (-25^ to 180°?).
Because of the close time schedule involved mid the dep«»nrlence of mechanical properties on electrical qualities, a compromise discussed subsequently had to be reached vith the manufacturer.
6.3 ELECTRICAL CHARACTERISTICS
6.3.1 Q of Coil
The frequency stability of the modified Hartley oscillator (l) used vith this gage is dependent on having a gage coil vith as large a Q as possible. The frequency stability of the oscillator approached 30 parts per million per volt at a frequency of 1U.5 kc vhen the Q vas greater than 5; hovever, the oscillator failed to function if the Q of the coil vere below 2. The low Q of the coils in the standard pickups vas one of the most serious problems vhich the manufacturer had to overcome.
As the lack of time prohibited the extensive redesign of the E- core, the Q vas Improved slightly by using thinner laminations and by increasing the size of the Mu-meted armature. Figure 6.3 shovs a plot of Q vs frequency for a typical 5 psi gage and a typical 10 psi gage. It vas noted that the Q's of the 5 psi gages were lower than the Q's of the 10 psi and above range gages. This vas due to the fact that the spacing bexveen the E-core and Mu-metal armature vas less in
39
UHCtASSIflB) 9
10 r rT^rTTpi(T]7ippT^^^ r,:. :.;•, !njT-:,: ■::: ■::; i::i Till rT; TTJi ITilT7 ;;J: :;;; i; ; i; | Ulli;: ;::; ;.;:;::. ;!:; :::::•:• :;;; T|!T Rv; S; Eu !t!t Tffl-tf
O O
5000 10,000
FREQUENCY (CPS/
15,000
Fig. 6.3 Q of Coil vs Frequency of Oscillator - Wiancko Gage
the case of the 5 psi gages. As the 5 psi gages have the same size twisted tube, it was necessary to close the gap to 5 mils to get the 7,5 per cent minimum deviation required. Figure 6,k shows that as the gap between the E-core and Mu-metal becomes smaller by the appli- cation of pressure to the gage, the Q changes slightly.
In Table 6.1 are listed the various electrical characteristics of a few typical gages.
TABLE 6.1 Electrical Characteristics of Several Wiancko Gsges
Gage No.
Range psi
DC Resistance ohms
Inductance mh
Q at lk.3 kc
988? 9979 11533 115^9
j
+ 5 to -2 + 5 to -2 + 10 to -U + 15 to -6
lUo Ikl 136 1U6
105 107 85 85
U.O U.l M 5.1
6.3.2 Frequency Deviation
It has been pointed out (l) that larger signals in a magnetic tape recording system would produce an increased signal to "wow-and-
U0
PRESSURE (PSI)
Fig. 6.U Q of Coil vs Pressure - Wiancko Gage
flutter" induced noise ratio. Therefore, greater deviation was sought with this gage than had been previously obtained with the Bendix gage used on TUMBLES. (2) To produce greater deviation the gap between the E-core and Mu-metal armature was decreased to about 12 mils on 10 psi range gages and above. However, as the spacing is decreased, the over-range protection of the gage is lost. As the predicted values of the pressures to be measured were accurate to + 20 per cent, a l60 per cent over-range protection was more than sufficient. For a gage having a frequency deviation between 6 and 9 per cent for its rated range, the over-range protection pressure would result in a frequency deviation between Ik and 16 per cent. Table 6.2 shows the range of gages used and their average over-range protection.
TABLE 6.2 Over-Range Protection for Various Range Wiancko Gages
Boainal Gage Range (psi)
Actual Gage 1 Range (psi)
| Nominal Gage || Range (psi)
Actual Gage 1 Range (psi)
5 10 15 20
-2 to + 7 -k to +16 -6 to +2U -8 to +32
30 6o
100 300
-10 to + U8 -Ik to + 96 -Ik to +160 'Ik to +U80
As the gap spacing on the 3 pal gages was 5 mils, its over- range protection was slightly less (lUo per cent) than that of the other gages.
Ul
• •
6.1+ MECHANICAL CHARACTERISTICS
G.k.l Frequency Response
The maximum frequency response that can be obtained from any ' • • spring-mass system depends on the natural undamped frequency of the system. Assuming that the gage has a natural frequency of 1000 cps, the minimum rise tin» that can be expected is 0.5 msec. If we con- sider the motion of the Wiancko tvisted tube and armature as having only a torsional rotation, the motion approaches that of a simple _ torsional pendulum whose frequency is given by the following equation: . • . •
f - 2v w
where k is the spring constant of the twisted tube and I is the moment ^ of inertia of the armature about the center of rotation of the tube. • * (The mass of the armature is accounted for, in part, by the Is. factor«) As k is inversely proportional to the langth of the tube and I directly proportional to the mass of the armature, higher natural frequencies can be obtained by using a shorter twisted tube and an armature of less mass.
A variable frequency audio oscillator was applied to the coil * * of the gage and the frequency varied until the audio signal induced a , vibration in the undamped armature« Four modes of oscillation (Fig. 6.5) were observed at different resonant frequencies. A strobotac was used to check the mode of oscillation, and in most eases it was observed that the armature was oscillating at the second harmonic of _ - — the driving frequency. • •
The most easily excited mode of vibration, a rotational oscil- lation of the armature, was considered the natural mode of oscillation of the gage (Fig. 6.5a). This torsional mode was excited in all gages selected and was considered the mods of oscillation produced when a damped gage was subjected to a step-pressure function. As the twisted tube is Joined to the main gage frame only at one end, the armature . * * and tube can behave as a loaded cantilever beam. The three cantilever vibrations which were most predominant were oscillations in the plane of the armature (Fig. 6.5b), oscillations at right angles to the plane formed by the armature and twisted tube (Fig. 6.5c), and oscillations in a plane rotated U50 from the armature plane (Fig. 6.5d).
The three different cantilever modes were not excited in all * * gages selected. Table 6.3 lists the natural undamped cantilever and torsional frrv > «cies for various range gages. It also lists the ring frequency of v J gages that have been damped for use in the field. As expected, this frequency is slightly less than the natural, undamped torsional frequency. These natural undamped frequencies are con- siderably lover than those reported by Vulgan (6) for a similar gage. -• * It is believed that this difference in frequency is due to the in* creased mass of the armature used in the gage modified for the HOL.
te _• •
«HtU»
- - - ■ * -'■--
• •
• •
; i ^ ► i \
• •
Fig. 6.5 Modes of Vibration in the Wiancko Gage
TABLE 6,3 Natural and Damped Resonant Frequencies For Various Range Wiancko Gages
[Nominal Gage Range
1 Frequency (cps) | | Undamped | 1 Damped 1 1 Mode B* Mode C* Mode D» (Mode A)« 1 Torsional
(P8i) Torsional
5 and 10 2J+8 T89 3^7 821 790 15 1 880 - 950 1 866 20 I 885 - 1076 10U8 30 . 388 652 11U8 1130 60 680 1265 - 1650 1621
100 930 650 1859 18^0
* §e« Fig. 6.5 for definitions of various modes.
6.U.2 Damping
The gages which vere originally received from the manufacturer were damped 0.6 to 0.7 of critical at a temperature of 75^. It was found that this type of damping produced a considerable amount of drag-out or "creep" when the gage was excited by a step pressure func tion. Creep is defined as the failure of the gage to reach its steady-state value in the time that it takes the transient response oscillations to die out. Figure 6.6 is the transient response of a 10 psi gage to a step pressure from the NOL pressure pot. (7) The creep effect is quite apparent as the gage does not reach the steady- state pressure for more than 10 msec.
^3
**^X- . ^ ... A-.-,.
5 PSI STEP PRESSURE
10 PSI STEP PRESSURE
14 PSI STEP PRESSURE (2 Kc TIMING FREQUENCY)
Pig. 6.6 Dynamic Response of the Wiancko Gage Shoving Creep
5 PSI STEP PRESSURE
10 PSI STEP PRESSURE
14 PSI STEP PRESSURE (2kc TIMING FREQUENCY)
Pig. 6.7 Dynamic Response of the Wiancko Gage vith Optimum Damping
MlBSW
• •
- - — ■ * - !!■* !■ ■ I« fc I
• • Various parameters of the damping mechanism were changed in an
effort to overcome this drag-out. Normally, a drop of silicone grease was placed between a fixed damping bar and the armature to provide damping. Several damping greases and mixtures were tried. The length and width of the damping-bar were changed. The spacing between the _ damping bar and armature was varied, as well as bending the bar so • • that the spacing was not uniform. Grease was even placed between the armature (Fig. 6.2) and the center section of the E-core,
On the basis of later investigations on the acceleration sensi- tivity of the Wiancko gage (see sect 6.U.3), and with the observation of cantilever modes of vibration for the twisted tube, a probable explanation for creep occurs. The 0.6 to 0.7 of critical damping that • • is desired for the high frequency torsional motion of the armature results in a greatly overdamped condition for the low frequency canti- lever motion. When the gage is pressure excited, not only does tor- sional motion of the armature result, but also a cantilever action. The overdamped cantilever mode thus gives the creep effect. However, because time did not permit a detailed study of the effects of damping • • on the complex modes of vibration of the armature prior to the oper- ation, a compromise had to be reached. By letting the gage ring for 3 to 5 msec with 0.2 and 0.3 of critical damping, the creep effect was overcome and still the ringing or "overshoot" of the gage did not hinder unduly the reading of the record. It was felt that records with a „ little ring were better for reading peak pressures from a shock wave • • than records where the gage had been critically damped and creep appeared.
Each gage received fron the manufacturer was redamped using Dow Coming No. 33 "fluid type" low temperature grease and the damping bar spacing adjusted by trial and error to obtain the desired result. _,„. . „ This spacing varied between 0.00? in. and 0.015 in. and in seme cases • • the damping bar was bent up slightly at its ends. Transient responses of a properly damped gage are shown in Fig. 6.7. It was also observed that with 0.2 of critical damping the hysteresis or failure of the gage to return to zero promptly was considerably reduced.
6.^.3 Acceleration Sensitivity • •
Upon the conclusion of UPSHOT-KNOTHOLE, it was felt that some of the pressure-time records exhibited an undue amount of ring for a properly damped gage.* As this gage had been modified by increasing the size of the Mu-metal armature and using it in a single ended mag- netic circuit, perhaps an acceleration effect was being observed on • • the pressure-time record. Previously, Shreve (6) had likewise noted acceleration-like effects with the standard light armature balanced Wiancko gage. An extensive investigation was undertaken to see what the acceleration effects were for this HOL modified gage.
Tvo methods were used to observe this effect. First the gage was placed on a variable frequency shake table of the acceleration 9 •
♦ For a more complete discussion of the acceleration sensitivity of the gage and its effect on UPSHOT-KNOTHOLE records see References (l) and (6).
f •
type. The plane formed by the Mu-metal pad and the twisted tube was perpendicular to the mode of vibration. This is the most sensitive position for producing a change In the reluctance of the coil. By varying the frequency and the magnitude of the acceleration, any noticeable effect in the output of the oscillator circuit was recorded. The second method used subjected the gage to a drop test. Here the gage was subjected to an average acceleration upon impact varying from 7G to 30G for a duration of 10 msec.
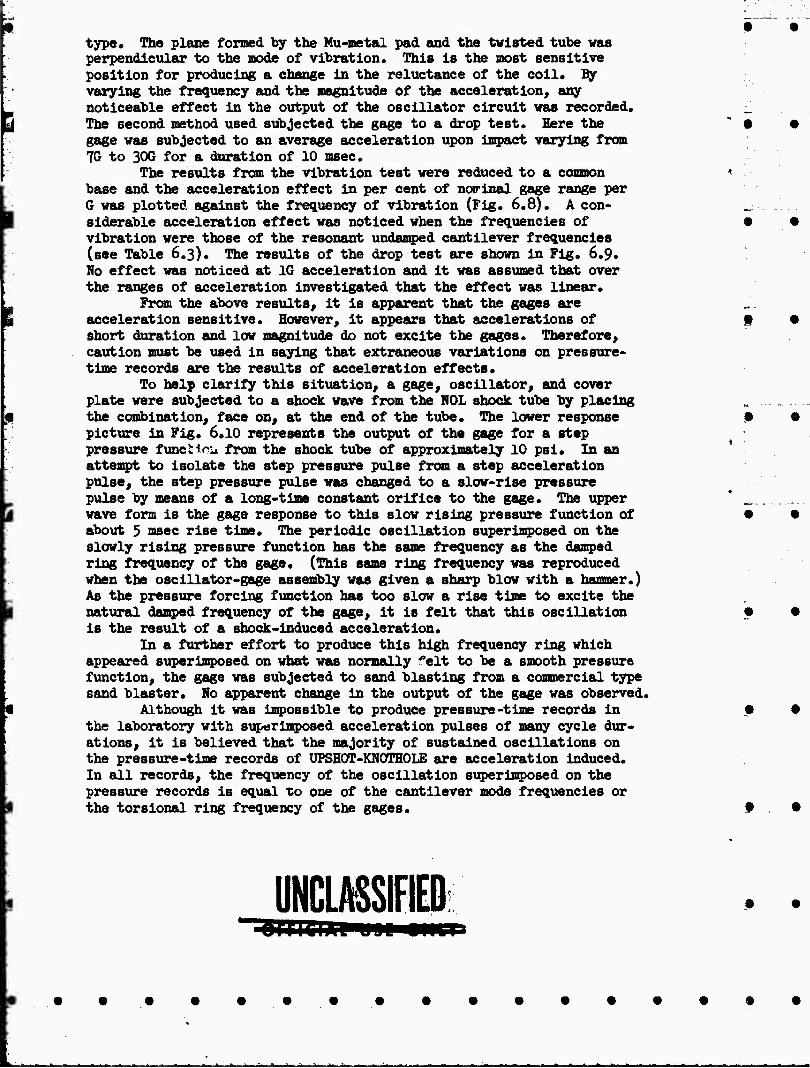
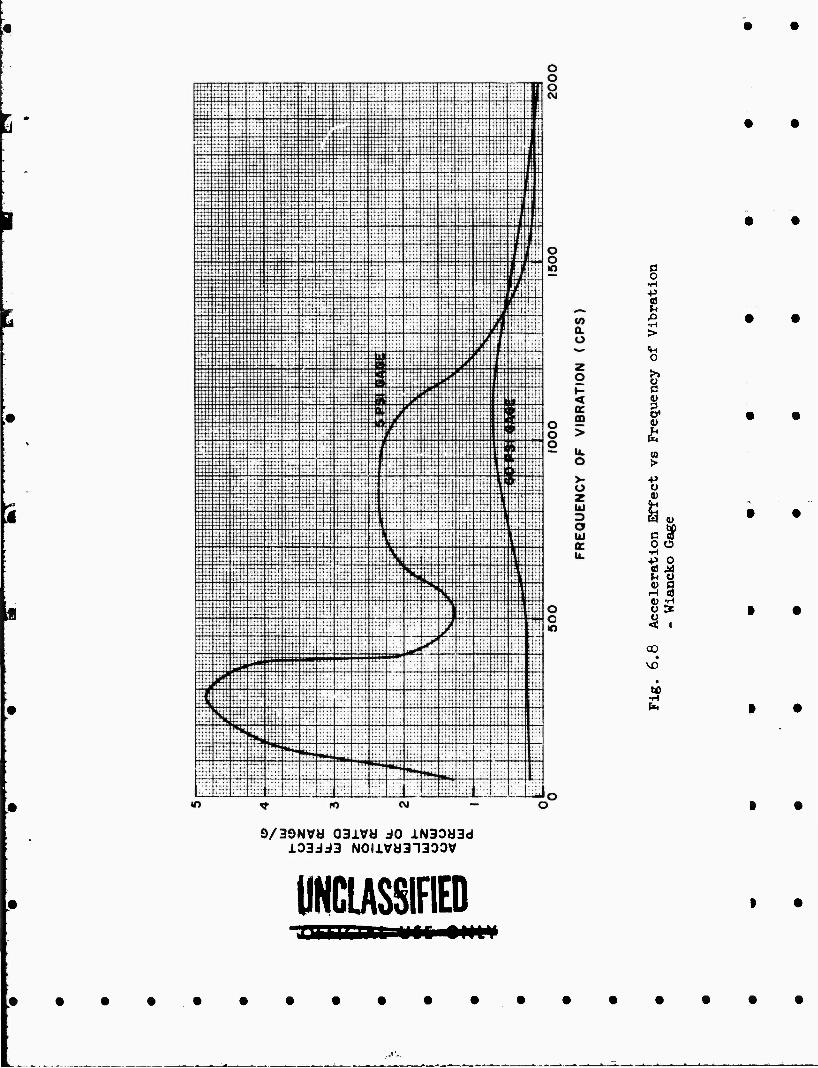
The results from the vibration test were reduced to a common base and the acceleration effect in per cent of ncnrlnal gage range per G was plotted against the frequency of vibration (Fig. 6.8). A con- siderable acceleration effect was noticed when the frequencies of vibration were those of the resonant undamped cantilever frequencies (see Table 6.3). The results of the drop test are shown in Fig. 6.9. No effect was noticed at IG acceleration and it was assumed that over the ranges of acceleration Investigated that the effect was linear.
From the above results, it is apparent that the gages are acceleration sensitive. However, it appears that accelerations of short duration and low magnitude do not excite the gages. Therefore, caution must be used in saying that extraneous variations on pressure- time records are the results of acceleration effects.
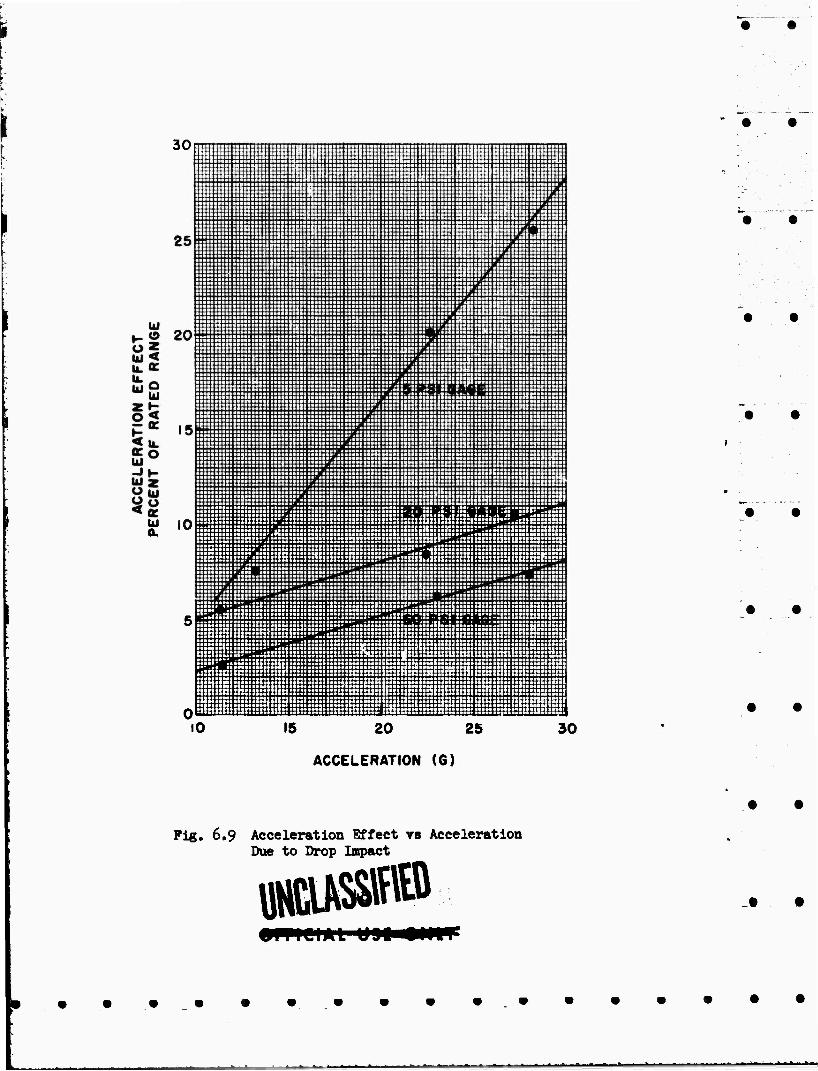
To help clarify this situation, a gage, oscillator, and cover plate were subjected to a shock wave from the HOL shook tube by placing the combination, face on, at the end of the tube. The lower response picture in Fig. 6.10 represents the output of the gage for a step pressure functicu from the shock tube of approximately 10 psi. In an attempt to isolate the step pressure pulse from a step acceleration pulse, the step pressure pulse was changed to a slow-rise pressure pulse by means of a long-time constant orifice to the gage. The upper wave form is the gage response to this slow rising pressure function of about 3 msec rise time. The periodic oscillation superimposed on the slowly rising pressure function has the same frequency as the damped ring frequency of the gage. (This same ring frequency was reproduced when the oscillator-gage assembly was given a sharp blow with a hammer.) As the pressure forcing function has too slow a rise time to excite the natural damped frequency of the gage, it is felt that this oscillation is the result of a shock-induced acceleration.
In a further effort to produce this high frequency ring which appeared superimposed on what was normally felt to be a smooth pressure function, the gage was subjected to sand blasting from a commercial type sand blaster. No apparent change in the output of the gage was observed.
Although it was impossible to produce pressure-time records in the laboratory with superimposed acceleration pulses of many cycle dur- ations, it is believed that the majority of sustained oscillations on the pressure-time records of UPSHOT-KNOTHOLE are acceleration Induced. In all records, the frequency of the oscillation superimposed on the pressure records is equal to one of the cantilever mode frequencies or the torsional ring frequency of the gages.
UNCLASSIFIED;
0 o •H
o
Ü c 0) 3
05 !> +> o 0>
W 0»
c o o o •H •P o OS M
0) Ö
CO
to
D/39NVH QBiVW JO iN3DH3d i03dJ3 NOIlVä313DDV
UHCIASSinED
• •
• •
30m
Ui 101 '■■•■•«■•••■■••••t••■•' ■■•■■•■«■•••■«••■■■■■■■■■ia*«a«>- .« ■ mm» ' tm'- •• <•■. ' i «it !«• ■■#**- .■■■■■■
:;::::::;:::!!:;:::;-;::::::::;!::;:;:::::::::;:;:::::::::!!:;:::::S::::e:::;i:!":.ii:]i;::!9:::i
I::::::::::::::*;:::::::::::: :::::::::;::::::::::::::s:s:!v;^3:::::::::;::::;::::::::::::;::s:u: !«>aa*a**aaa*a ••••••••••«a**••«••••••••••«••aa«»•••••- .aaa iiaaa«aa«»«aa*a«« ' a«a*a««a«a laavaaaaaaaaa- aa«aiBaiaaa«aaaai»iaa««*aa<aBaaaa«aa»- «•■■••■. .iBB«BaiaaBiaaaaB**«BBe8«B«aa*BliBB«aa jBaaaiavi» ■■••■■■•••■■■■•■■■••■■•aaa••■■■•■■■■■■*' .■■■•■■■iaa■!■aaBBaaaaaa■■■■■••BaaaaBBBaaaBBBB*'
i:::-::!-::..::::::::;::::::::::::!::;::::::::!:::::;:!":..::::::: ::::::::::::::::::::::::::: :: !"...::::j::{:::::::::::::::::::::::::::::::::;":;.is;:':;:'!::!:!:::J:!:s;:5:::::::::::::::: :: iBaBaBZaaaB«aaa*a*aaaBBSBaaaa*«aBaaai.aBB*B*>- ..aaaaaa - ■ -aa'■ a «a aa »a • ,•. ■-aaaaaaaaaaaaaiiaaai
iililljiiliiiiliiljilllililiil^:iiiii::iiiiiiiiiiii:Hiii^ isaBBaai•••>■•■•■■aisBBaaaa- *■■&*«■■■BaaBaaBBaaaasBaaaaBBBaaaaaaBa BBaaaaBBBa BBBBBaBBBaaBBaBaaaa
■ ■- ,.:,:.: f: I"'i: 5:;::" '-'•■
::: i I. ■i: \\\\ :;:: ; : |:;:::; ::
:; :± :::: :: ±
i- ■::::;;
.: ;. ■ :.:: i:: | . :::;::: :: ::: :; ;:: ;l: ::;; ; i ::::::: t \ ^ ::. ; ; • ■ | ■ 1 ;: ;:. :; i ÜJ 10 15 20 25
ACCELERATION (G)
30
• •
Fig. 6.9 Acceleration Effect vs Acceleration Due to Drop Impact
fc gi !- •■ - -- ^■- ■ - Bh fc ■ * ^—^—B-..-.. » ..-A-^^-^-J. Bm„^-m».ah.l,i.->^,l..,M„,.-,aBn.i«fc,r—*nmAHl
• •
Pig. 6,10 Dynamic Response of Wiancko Gage to Transient Pulses in Shock Tube
ÜHMS1F1ED
• •
• •
• •
• •
• •
• •
• 0
■ •
• t
• •
6,k,k Temperature Dependence
The gages vere equipped with an adjustable "bleed plug" to equalize the presEure in the instrument case as the ambient temperature conditions changed. Changes in temperature produced an 0.02 per cent/*^ change in the center frequency of the oscillator; however, the sensi- tivity change with temperature was so small that this shift can be neglected in determining measured prossures.
In the field it was found that the center frequency of the oscil- lator shifted at zero time on gages where the thermal radiation could enter the twisted tube. From experimentation with the sun's rays focused through a magnifying glass in the laboratory, it was found that by letting the radiation strike one side of the twisted tube a sizable frequency shift could be produced. By letting the radiation hit the opposite side of the tube, a frequency shift in the other direction was produced. No change was produced when the incident radiation was normal to the gage. In some cases in the field the oscillator had returned to its zero position frequency before the arrival of the shock wave. In cases where it did not, a correction had to be made to the peak pressure measurements, as the gage was not operating over the cali- bration section of the Inductance-Frequency curve.
6.5 CALIBRATION TECHNIQUE
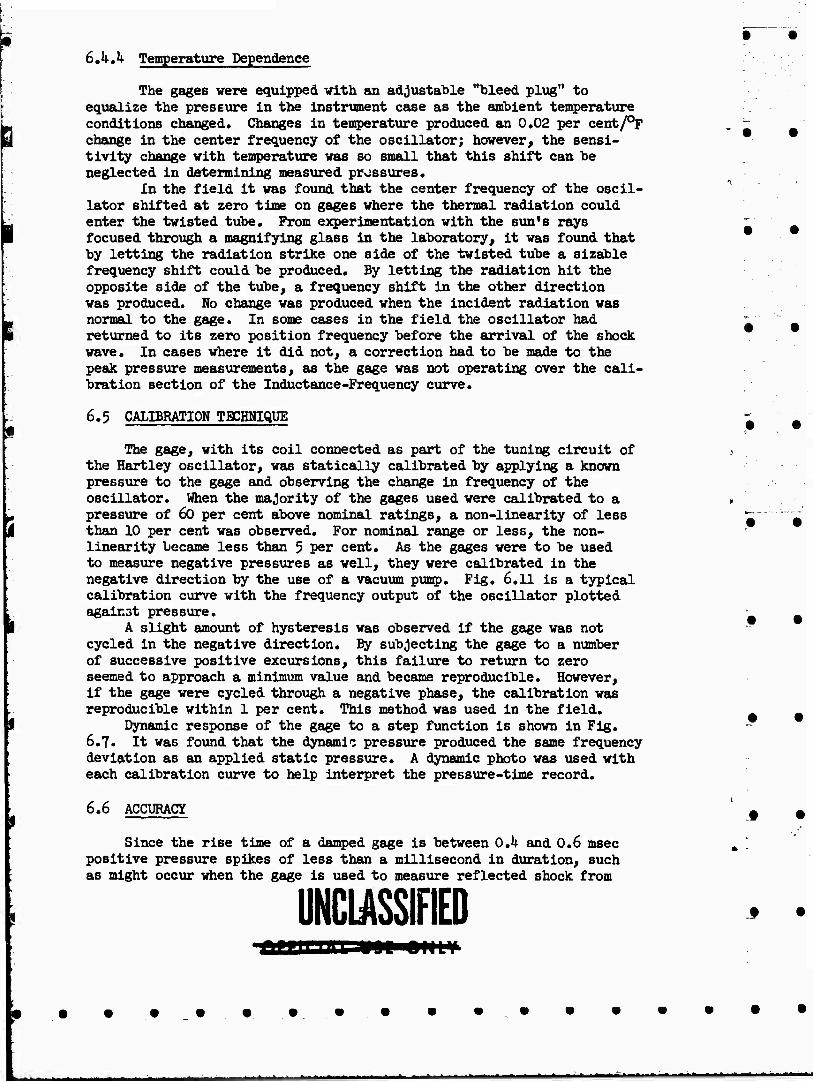
The gage, with its coil connected as part of the tuning circuit of the Hartley oscillator, was statically calibrated by applying a known pressure to the gage and observing the change in frequency of the oscillator. When the majority of the gages used were calibrated to a pressure of 60 per cent above nominal ratings, a non-linearity of less than 10 per cent was observed. For nominal range or less, the non- linearity became less than 5 per cent. As the gages were to be used to measure negative pressures as well, they were calibrated in the negative direction by the use of a vacuum pump. Fig. 6.11 is a typical calibration curve with the frequency output of the oscillator plotted against pressure.
A slight amount of hysteresis was observed if the gage was not cycled in the negative direction. By subjecting the gage to a number of successive positive excursions, this failure to return to zero seemed to approach a minimum value and became reproducible. However, if the gage were cycled through a negative phase, the calibration was reproducible within 1 per cent. This method was used in the field.
Dynamic response of the gage to a step function is shown in Fig. 6.7. It was found that the dynamic pressure produced the same frequency deviation as an applied static pressure. A dynamic photo was used with each calibration curve to help interpret the pressure-time record,
6.6 ACCURACY
Since the rise time of a damped gage is between O.k and 0.6 msec positive pressure spikes of less than a millisecond in duration, such as might occur when the gage is used to measure reflected shock from
UNC1ASSIFIED agacnc
• •
• •
• •
• •
• •
• •
• •
§ •
.# •
13,500 14,000 14,500
FREQUENCY (CPS)
15,000 15,500
Fig. 6.11 Typical Calibration Curve - Wiancko Gage
small walls or posts, cannot he read to a greater accuracy than 20 per cent. Step functions which have an exponential decay can he read to 2 per cent accuracy; however, because of the hysteresis in the decaying phase, accuracies in this portion are about 5 per cent.
6.7 FIELD PERFORMANCE
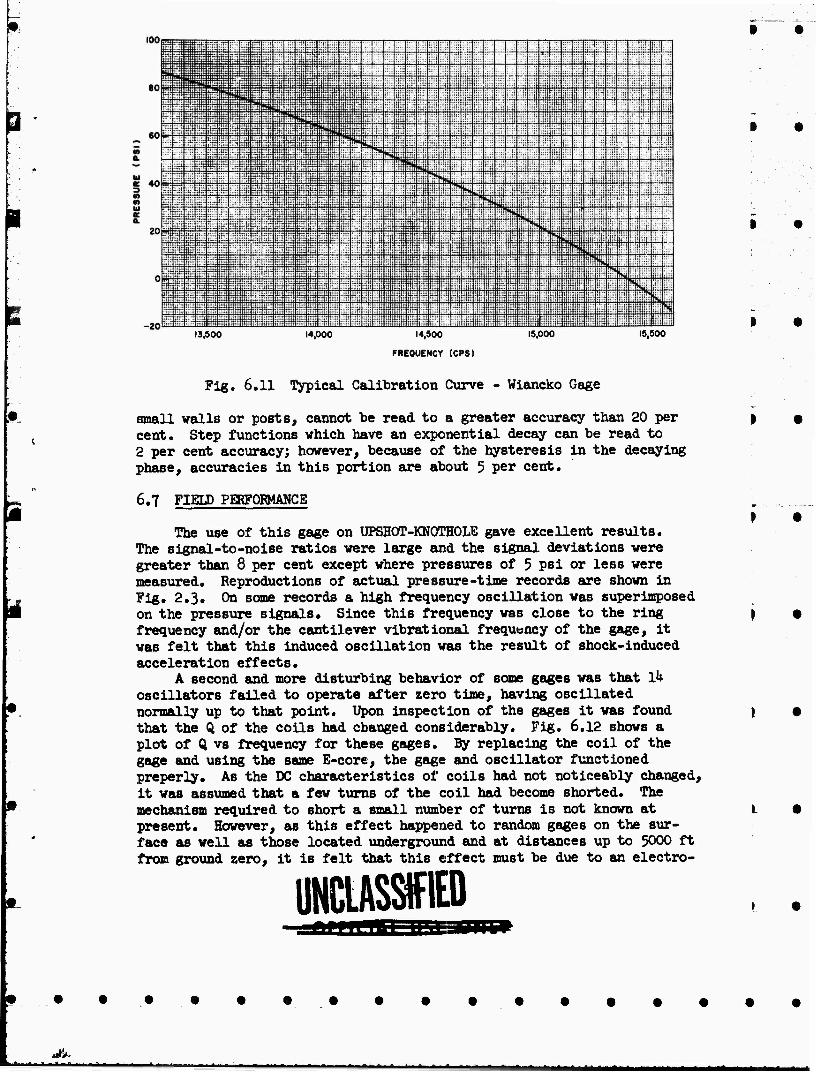
The use of this gage on UPSHOT-KMOTHOLB gave excellent results. The signal-to-noise ratios were large and the signal deviations were greater than 8 per cent except where pressures of 5 psi or less were measured. Reproductions of actual pressure-time records are shown in Fig. 2.3. On some records a high frequency oscillation was superimposed on the pressure signals. Since this frequency was close to the ring frequency and/or the cantilever vibrational frequency of the gage, it was felt that this induced oscillation was the result of shock-induced acceleration effects.
A second and more disturbing behavior of some gages was that lh oscillators failed to operate after zero time, having oscillated normally up to that point. Upon inspection of the gages it was found that the Q of the coils had changed considerably. Fig. 6.12 shows a plot of Q vs frequency for these gages. By replacing the coil of the gage and using the same E-core, the gage and oscillator functioned preperly. As the DC characteristics of coils had not noticeably changed, it was assumed that a few turns of the coil had become shorted. The mechanism required to short a small number of turns is not known at present. However, as this effect happened to random gages on the sur- face as well as those located underground and at distances up to 5000 ft from ground zero, it is felt that this effect must be due to an electro-
UNCLASSIFIED
iiilt-i m*mtmmmimmmam~llmmt*mimm*taämtmm*m
o J 5 o
5000 10,000
FREQUENCY (CPS)
15,000
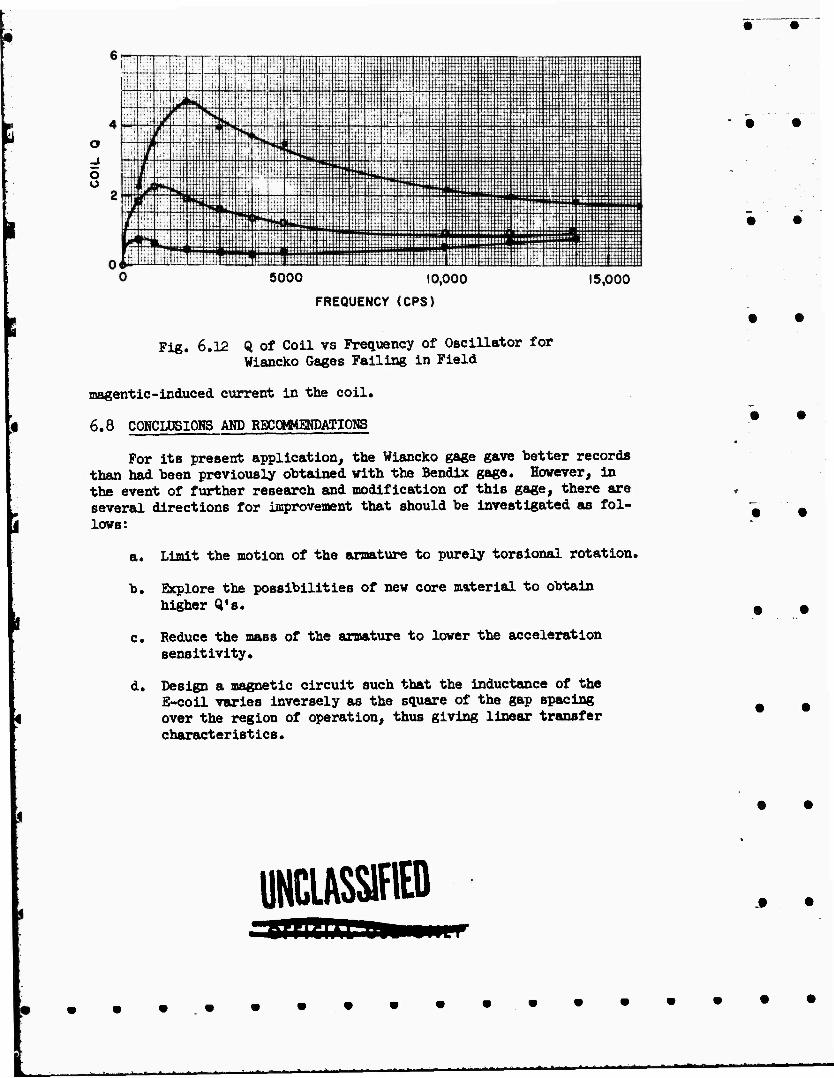
Fig. 6.12 Q of Coil vs Frequency of Oscillator for Wiancko Gages Failing in Field
magentic-induced current in the coil.
6.8 CONCLOSIOHS AND RECOMMETODAIIOMS
For its present application, the Wiancko gage gave better records than had been previously obtained with the Bendlx gage. However, in the event of further research and modification of this gage, there are several directions for iffiprovement that should be investigated as fol- lows:
a. Limit the motion of the armature to purely torsionai rotation.
b. Explore the possibilities of new core material to obtain higher Q's.
c. Reduce the mass of the armature to lower the acceleration sensitivity.
d. Design a magnetic circuit such that the inductance of the E-coil varies inversely as the square of the gap spacing over the region of operation, thus giving linear transfer characteristics.
UNCIASSIFIED
--*■"■-- -.*.—.....^
BQUOCffiAFlS
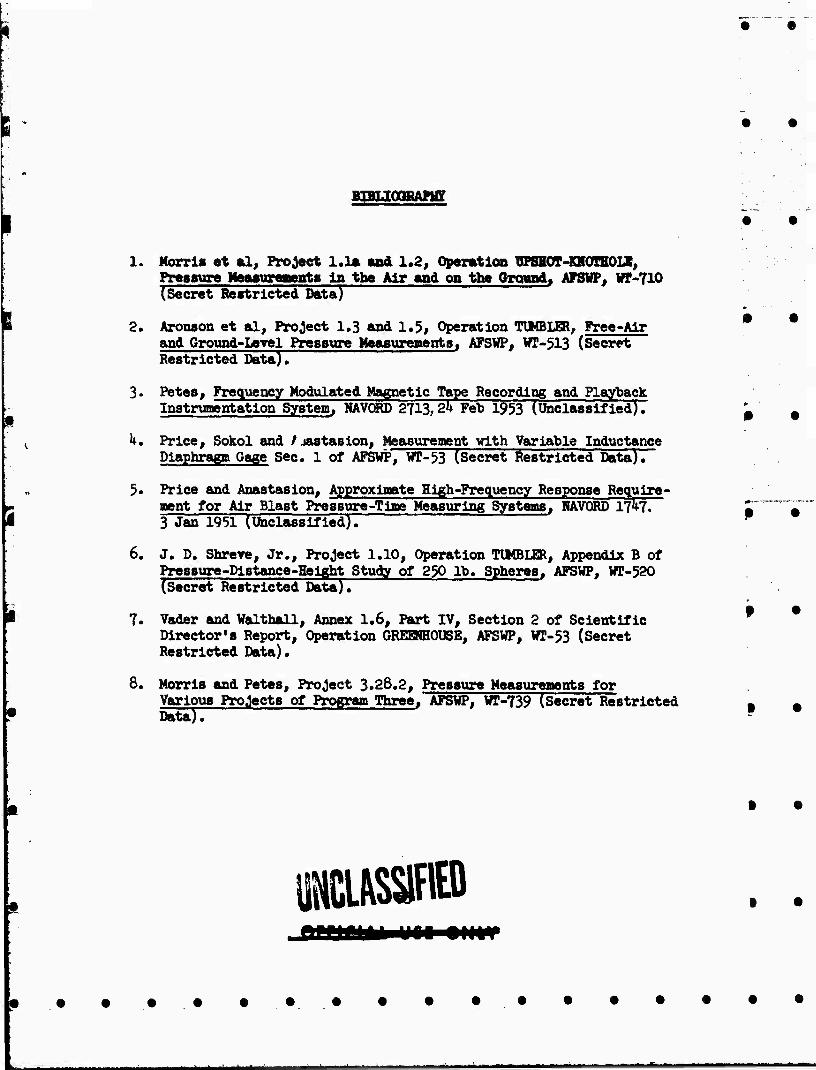
1. Morris «t *1, Project 1.1a and 1,2, Operation ÜPSIOI-XMOEHOIJB, Pressure ItoMmvmvb» in the Air and on the Qrownd, AFSHP, W-T10 (Secret Bertrleted Data)
2. Aronson et al. Project 1*3 and 1.5, Operation TUMBUER, Free-Air and Ground-Level PresBure Measureaents, AFSWP, WP-513 (Secret Restricted Data).
3. Petes, Frequency Modulated Magnetic Tape Recording and Playback Instrumentation System, WAVORD 2713.2^ Feb 1953 (Unclassified).
k. Price, Sokol and /jastaslon. Measurement vith Variable Inductance Diaphragm Gage Sec. 1 of AFSWP, Wr-53 (Secret Restricted Data).
5. Price and Anastasion, Approximate High-Frequency Response Require- ment for Air Blast Pressure-Time Measuring Systems, HAVQRD ijkl. 3 Jan 1951 (Unclassified). "
6. J. D. Shreve, Jr., Project 1.10, Operation TUMBLER, Appendix B of Pressure-Distance-Height Study of 250 lb. Spheres, AFSWP, wr-520 (Secret Restricted Data). ~~~~~
7. Vader and Walthall, Annex 1.6, Part IV, Section 2 of Scientific Director's Report, Operation GREHIHOUSE, AFSWP, WT-53 (Secret Restricted Data).
8. Morris and Petes, Project 3.28.2, Pressure Measurements for Various Projects of Program Three, AFSWP, WT-739 (Secret Restricted Data).
«usaw
0 •
ß •
p •
t •
• •
' - -
DISTRIBUTION Military Distribution Categories 5 -21
ABHT ACTIVITIES
1
3
k- 6
7
8- 9 10
ll- 15
16
17- 19
20
21
22
23
21*
25- 26
27- 28
29- 30
31 32
33
31*
35
36
37
38
39- kO
1*1- "»3
1*1»
W
i*6
1*7- US
Aaet. Chief of Staff, 0-3, D/A, Washington 25, D.C ATTN: Dep. CofS, 0-3 (HH&SW)
Deputy Chief of Staff for Logistics, D/A, Washington 25, D.C. ATTN: Director of Besearoh & Development
Chief of Ordnance, D/A, Washington 25, D.C. ATTN: ORDTX-AB
Chief Signal Officer, D/A, P&O Division, Washington 25, D.C. ATW: SIGOP
The Surgeon General, D/A, Washington 25, D.C. ATTN: Chief, BSD Division
Chief Chemical Officer, D/A, Washington 25, D.C. The (Juartermaeter General, CBB, Lljleon Officer, He-
search and Development Dlv,, D/A, Washington 25, D.C, Chief of Bnglneoro, D/A, Washington 25, D.C. ATDI:
ENGNB Chief of Transportation, Military Planning and Intel-
ligence Dlv., Washington 25, D.C. Comnandlng General, Continental Army Command, Ft.
Monroe, Va. President, Board #1, Headquarters, Continental Amy
Command, Ft. Bragg, N.C. President, Board #2, Headquarters, Continental Army
Conmand, Ft. Khoz, Ky. President, Board #3, Headquarters, Continental Army
Commend, Ft. Henning, Ga. President, Board #4, Headquarters, Continental Army
Command, Ft. Bliss, Tex. Commanding General, U.S. Army Caribbean, Ft. Amador,
C.Z. ATTB: Cml. Off. Comnander-ln-Chlef, Far East Coanand, APO 500, o/o FM,
San Francisco, Calif. ATTH: ACofS, J-3 Conoandlng General, U.S. Army Europe, APO 1*03, c/o ffl,
Rew Tork, N.T. ATTJI: OPOT Dlv., Combat Dev. Br. Commandant, Command and General Staff College, Ft.
Leavenworth, Kan. ATDI: ALLLS(AS) Conmiandant, The Artillery School, Ft. Sill, Okie. Secretary, The AA&GH Branch, The Artillery School, Ft.
Blies, Tei. Amt: Lt. Col. Albert D. Bpley, Dept. of Tactics and Combined Arms
Comnandlng General, Medical Field Service School, Brooke Army Medical Center, Ft. Sam Houston, Tei.
Director, Special Weapons Development Office, Ft. Bliss, Tex. ATTV: Lt. Arthur Jasklerny
Com&andant, Army Medical Service Graduate School, Walter Reed Army Medical Center, Washington 25, D.C.
Superintendent, U.S. Military Academy, West Point, N.I ATTN: Prof, of Ordnance
Consoandant, Chemical Corps School, Chemical Corps Training Connand, Ft. HcClellan, Ala,
Comandlng General, Research and Engineering Consaand, Anay Chemical Center, Md. ATTN: Deputy for RW and Non-Toxic Material
Comandlng General, Aberdeen Proving Grounds, Md. (inner envelop«) AITS: RD Control Officer (for Director, Ballistics Research Laboratory)
Conaiandlng General, The Engineer Center, Ft. Belvolr, Va. ATTN: Aast. Commandant, Engineer School
Coonandlng Officer, Engineer Research and Development Laboratory, Ft. Belvolr, Va. ATW: Chief, Technical Intelligence Branch
Commanding Officer, Plcotlnny Arsenal, Dover, N.J. ATM: OHDBB-TK
Conaandlng Officer, Army Medical Research Laboratory, Ft. fcox, Ky,
Commanding Officer, Chemical Cores Chemlial and Ridlo- loglcal Laboratory, Army Cheolcal Center, Md. ATTH: Tech. Library
1*9 Commanding Officer, Transportation BH) Station, Ft. Eustls, Va.
50 Director, Technical Documents Center, Evans Signal Laboratory, Belmar, N.J.
51 Director, Waterways Experiment Station, PO Box 631, Vlckehurg, Mlas. ATTN: Library
52 Director, Armed Forces Institute of Pathology, 7th and Independence Avenue, S.W., Washington 25, D.C.
53 Director, Operations Research Office, Johns Hopklna University, 7100 Connecticut Ave., Chevy Chase, Md. ATTN: Library
54- SO Technical Information Service, Oak Ridge, Tenn. (Surplus)
NAVT ACTIVITIES
61- 62 Chief of Naval Operations, D/N, Washington 25, D.C. ATTN: OP-36
63 Chief of Naval Operations, D/N, Washington 25, D.C. ATTN: 0P-03EG
61* Director of Naval Intelligence, D/N, Washington 25, D.C. ATTN: 0P-922V
65 Chief, Bureau of Medicine and Surgery, D^(, Washington 25, D.C. ATIH: Special Weapons Defense Dlv.
66 Chief, Bureau of Ordnance, D/N, Washington 25, D.C, 67 Chief, Bureau of Ships, D/N, Washington 25, D.C. ATI»:
Code ik8 68 Chief, Bureau of Yards and Docks, D/N, Washington 25,
D.C. ATTN: D-1*1*0 69 Chief, Bureau of Supplies and Accounts, D/H, Washing-
ton 25, D.C. Chief, Bureau of Aeronautics, D/1>, Washington 25, D.C. Chief of Naval Besearoh, Department of the Navy
Washington 25, D.C. ATTW: LT(jg) F. McKM, USN Commander-In-Chief, U.S. laciflc Fleet, Fleet Post
Office, San Francisco, Calif. Conmander-tn-Chlef, U.S. Atlantic Fleet, U.S. Naval
Base, Norfolk 11, Va. Comaandant, U.S. Marine Corps, Washington 25, D.C.
ATTN: Code A03H President, U.S. Naval War College, Newport, 3.1. Superintendent, U.S. Naval Postgraduate School,
Monterey, Calif. Si Comnandlng Officer, U.S, Naval Schools Command, U,S.
Naval Station, Treasure Island, San Francisco, Calif.
02 Commanding Officer, U.S. Fleet Training Center, Naval Base, Norfolk 11, Va. ATTN: Special Weapons School
83- flU Cannandlng Officer, U.S. Fleet Training Center, Naval Stution, San Diego j6, Calif. ATTN: (SPWP School)
.■'>5 Commanding Officer, Air Development Squadron 5, VX-5, U.S. Naval Air Station, Moffett Field, Calif.
06 Comnandlng Officer, U.S. Naval Damage Control Training Center, Naval Base, Philadelphia 12, Pn. ATTN: ABC Defense Course
97 Comnandlng Officer, U.S. Naval Unit, Chemical CorjiB .'.chool, Army Chemical Training Center, Ft. HcClellan, Ala.
3d Commander, U.S. Naval Ordnance Laboratory, Sliver
70- 71 72
73
7U
75- 78
79
Spring IS Md. ATTN Coraaonder, U.S. Nuvul
Spring 1^, Md. APTN Cotaauuder, U.S. Nav^l
ring 19, Md. ATTA: H
EE Ordnunce L ibomtory, Silver
EH Ordnance Luborntory, Silver
M^UiM^^I
Ksiüssife ■ir'tejo.
OFFICIAL ONLY I* --'"' ,. -
E
• •
91 Conmander, U.S. Naval OatUffiioB Test StaftSs^ai^Wn, ^^J^ö China Lake, Calif.
9S Officer-In-Charge, U.S. Baval Civil Engineering Eea. 139 and Evaluation Lab.# U.S. Naval Conatructlon Bat- talion Center, Port Hueneme, Calif. ATTN: Code 753 ito-lltl
93 Commanding Officer, U.S. Naval Medical Eeaearch Inst., National Naval Medical Center, Betheada X\, Md. lte-147
94 Director, U.S. Naval Research Laboratory, Washington 25, D.C. ATOI: Code 2029 ll*8-ll*9
95 Commanding Officer and Director, U.S. Navy Electronics Laboratory, San Diego 52, Calif. ATTN: Code 1*223 150-152
96- 97 Commanding Officer, U.S. Naval Radiological Defense Laborato.T. San Francisco 24, Calif. ATTN: Technical 153 Information Division
98 Director, Navel Air Experimental Station, Air 15^ Material Center, U. S. Naval Base, Philadelphia, Penn. 155
99-100 Commanding Officer and DireotoT-, itevld W. Taylor Model Basin, Washington 7, D.C. AIOT: Library 156-157
101 Conmander, U.S. Naval Air Development Center, Johns- „ „ ville, Pa. 153-164
102 Director, Office of Naval Research Branch Office, 1000 Geary St., San Francisco, Calif.
103-109 Technical Information Service, Oak Ridge, Tenn. (Surplus)
165
AIR POECE ACTIVITIES j^g
110 Asst. for Atomic Energy, Headquarters, USAP, Washing- ton 25, D.C. ATTN: DCS/0 ^
11.1 Director of Operations, Headquarters, USAT, Washington 25, D.C. ATTN: Operations Analysis lby
112 Director of Plans, Headquarters, USAT, Washington 25, D.C. ATTN: War Plans Dlv. I69
113 Director of Research and Development, Headquarters, USAT, Washington 25, D.C. ATTN: Combat Components 170-175 Dlv.
lli-US Director of Intelligence, Headquarters, USAf, Washing- ton 25, D.C. ATTN: Ar0IN-IB2 176-177
116 The Surgeon General, Headquarters, USAF, Washington 25, D.C. ATTN: Bio. Def. Br., Pre. Med. Dlv.
117 Deputy Chief of Staff, Intelligence, Headquarters, U.S. 178-186 Air Forces Europe, APO 633, c/o m, New Tork, N.Y. ATOT; Directorate of Air Targets 187
118 Coranander, U97th Reconnaissance Technical Squadron (Augmented), APO 63 , 0/0 IM, Nev York, N.Y.
119 Craanander, Far East . r Forces, APO 925, c/o PM, San 100-194 Francisco, Calif.
120 Cooaander, Strategic Ir Ccmund, Offutt Air Force Base, Omaha, Ifebraeka. ATM: Special Weapons Branch, Inspection Dlv., Inspector General
121 Comander, Tactical Air Comand, Langley AFB, Va. ATTO: Documents Security Branch 195-197
122 Coamander, Air Defense Comand, Snt AFB, Colo. 123-121* Connander, Wright Air Development Center, Wrlght-
Pstterson AFB, Daytc-i, 0. ATTN: WCRBN, Blast 196-200 Effects Research
125 Coonander, Air Training Ccnaand, Scott AFB, Belleville, 201-201» 111. ATTN: DC3/0 GTP
126 ConBfinder, Air Hesearcn and Development Coomfind, PO Box 1395, Baltimore, Md. ATTN: RDDN 205-206
127 Comander, Air Proving Ground Coomand, Kglln AFB, Fla. ATM: AO/TRB 207
128-129 Director, Air University Llbmry, Maxwell AFB, Ala. 130-137 Coonander, Flyln,; Training Air Force, Waco, Tex. 206-220
ATW: Director of Observer Trnlnln«
Commander, Crev Training Air Force, Randolph Field, Tex. ATTN: 2GTS, DCS/0
Commander, Headquarters, Technical Training Air Force, Gulfport, Miss. ATTN; TA&D
Conanandant, Air Force School of Aviation Medicine, Randolph AFB, Tex.
Commander, Wright Air Development Center, Wright- Patteraon AFB, Dayton, 0. ATTN; WCOSI
Ccomander, Air Force Cambridge Research Center, 230 Albany Street, Cambridge 39, Mass. ATTS: CRQST-2
Conmander, Air Force Special Weapons Center, Kirtland AFB, N. Mex. ATTN: Library
Commandant, USAF Institute of Technology, Wright- Patterson AFB, Dayton, 0. A'lTN: Resident College
Commander, Dowry AFB, Denver, Colo. ATTN: Department of Armament Training
Commander, 1009th Special Weapons Squadron, Head- quarters, USAF, Washington 25, D.C.
The RAND Corporation, 1700 Main Street, Santa Monica, Calif. ATTO: Nuclear Energy Division
Technical Information Service, Oak Ridge, Term. (Surplus)
OTHER DEPARIMENT OF DEFENSE ACTIVITIES
Asst. Secretary of Defense, Research and Development, D/D, Washington 25, B.C.
U.S. National Military Representative, Headquarters, SHAPE, APO 55, c/o IM, New Tork, N.I. ATTO: Col. J. P. Healy
Director, Weapons Systems Evaluation Orcup, OSD, Ra 2E1006, Pentagon, Washington 25, D.C.
Armed Services Expxosives Safety Board, D/D, Building T-7. Gravelly Point, Washington 25, D.C.
Commandant, Arnsd Forces Staff College, Norfolk 11, Va. AOTH: Secretary
Commanding General, Field Ccomand, Armed Forces Spe- cial Weapons Project, PO Box 5100, Albuquerque, H. Mex.
CoBiaanJlng General, Field Comand, Armed Forces, Special Weapons Project, PO Box 5100, Albuquerque, N. Mex. ATTN: Technical Training Group
Chief, Armed Forces Special Weapons Project, Washington 25, D.C.
Office of the Technical Director, Directorate of Ef- fects Tests, Field Comand, AFSWP, PO Box 577, Menlo Park, Calif. ATTS; Dr. E. B. Doll
Technical Information Service, Oak Ridge, Tenn. (Surplus)
ATOMIC KNKROT COMMISSION ACTIVITIES
U.S. Atomic Energy Comission, Classified Technical Library, 1901 Constitution Ave., Washington 25, D.C. ATM; Mrs. J. H. O'Leary (For »A)
Los Alamos Scientific Loboratory, Report Library, PO Box I663, Los Alamos, N. Mex. ATTS: Helen Redman
Sandla Corporation, Classified Document Division, Sandle Base, Albuquerque, S. Mex. ATTS: Martin Lueero
University of California Radiation Laboratory, PO Box 806, Llvermore, :allf. ATW; Margaret Edlund
Weapon Data Section, Technical Information Service, Oak Ridge, Tenn.
Technical Information Serrlce, Oak Ridge, Tenn. (Surplus)
• •
• •
• •
• •
• •
• •
•».. '«
AK..O»* ■•«■■. r«M .„,.. - OFFICIAL l|5£ ONLY Oiii-Lf'iSSifitfc-,,,


![THIS SHEET ,, , Dill]FILE COPY · 2011. 5. 15. · photograph this sheet,, , dill]file copy cc-- level inventory-apost 7x 90g9 4 ? document identification oi _ _ _ _ _ _ _ __public](https://img.pdfslide.net/doc/110x75/60a099e207b2d732a30f23eb/this-sheet-dillfile-copy-2011-5-15-photograph-this-sheet-dillfile.jpg)