Embed Size (px)
Citation preview
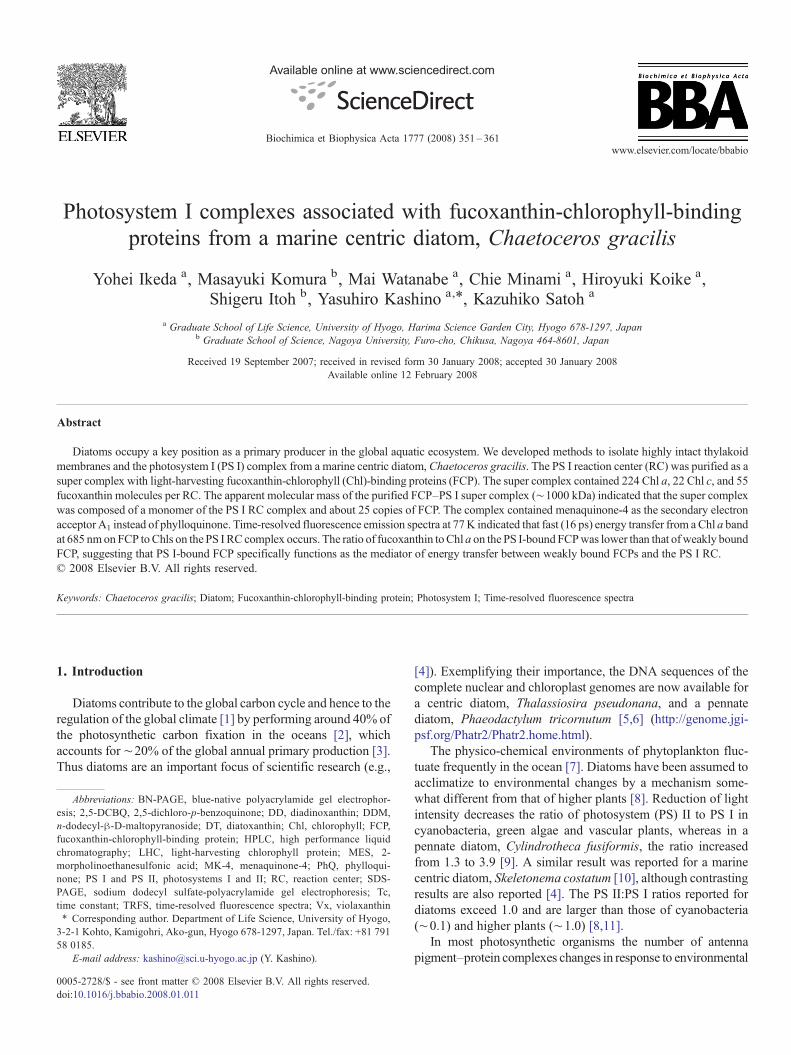
Available online at www.sciencedirect.com
a 1777 (2008) 351–361www.elsevier.com/locate/bbabio
Biochimica et Biophysica Act
Photosystem I complexes associated with fucoxanthin-chlorophyll-bindingproteins from a marine centric diatom, Chaetoceros gracilis
Yohei Ikeda a, Masayuki Komura b, Mai Watanabe a, Chie Minami a, Hiroyuki Koike a,Shigeru Itoh b, Yasuhiro Kashino a,⁎, Kazuhiko Satoh a
a Graduate School of Life Science, University of Hyogo, Harima Science Garden City, Hyogo 678-1297, Japanb Graduate School of Science, Nagoya University, Furo-cho, Chikusa, Nagoya 464-8601, Japan
Received 19 September 2007; received in revised form 30 January 2008; accepted 30 January 2008Available online 12 February 2008
Abstract
Diatoms occupy a key position as a primary producer in the global aquatic ecosystem. We developed methods to isolate highly intact thylakoidmembranes and the photosystem I (PS I) complex from a marine centric diatom, Chaetoceros gracilis. The PS I reaction center (RC) was purified as asuper complex with light-harvesting fucoxanthin-chlorophyll (Chl)-binding proteins (FCP). The super complex contained 224 Chl a, 22 Chl c, and 55fucoxanthin molecules per RC. The apparent molecular mass of the purified FCP–PS I super complex (∼1000 kDa) indicated that the super complexwas composed of a monomer of the PS I RC complex and about 25 copies of FCP. The complex contained menaquinone-4 as the secondary electronacceptor A1 instead of phylloquinone. Time-resolved fluorescence emission spectra at 77K indicated that fast (16 ps) energy transfer from aChl a bandat 685 nmon FCP toChls on the PS I RC complex occurs. The ratio of fucoxanthin toChl a on the PS I-bound FCPwas lower than that of weakly boundFCP, suggesting that PS I-bound FCP specifically functions as the mediator of energy transfer between weakly bound FCPs and the PS I RC.© 2008 Elsevier B.V. All rights reserved.
Keywords: Chaetoceros gracilis; Diatom; Fucoxanthin-chlorophyll-binding protein; Photosystem I; Time-resolved fluorescence spectra
1. Introduction
Diatoms contribute to the global carbon cycle and hence to theregulation of the global climate [1] by performing around 40% ofthe photosynthetic carbon fixation in the oceans [2], whichaccounts for ∼20% of the global annual primary production [3].Thus diatoms are an important focus of scientific research (e.g.,
Abbreviations: BN-PAGE, blue-native polyacrylamide gel electrophor-esis; 2,5-DCBQ, 2,5-dichloro-p-benzoquinone; DD, diadinoxanthin; DDM,n-dodecyl-β-D-maltopyranoside; DT, diatoxanthin; Chl, chlorophyll; FCP,fucoxanthin-chlorophyll-binding protein; HPLC, high performance liquidchromatography; LHC, light-harvesting chlorophyll protein; MES, 2-morpholinoethanesulfonic acid; MK-4, menaquinone-4; PhQ, phylloqui-none; PS I and PS II, photosystems I and II; RC, reaction center; SDS-PAGE, sodium dodecyl sulfate-polyacrylamide gel electrophoresis; Tc,time constant; TRFS, time-resolved fluorescence spectra; Vx, violaxanthin⁎ Corresponding author. Department of Life Science, University of Hyogo,
3-2-1 Kohto, Kamigohri, Ako-gun, Hyogo 678-1297, Japan. Tel./fax: +81 79158 0185.
E-mail address: [email protected] (Y. Kashino).
0005-2728/$ - see front matter © 2008 Elsevier B.V. All rights reserved.doi:10.1016/j.bbabio.2008.01.011
[4]). Exemplifying their importance, the DNA sequences of thecomplete nuclear and chloroplast genomes are now available fora centric diatom, Thalassiosira pseudonana, and a pennatediatom, Phaeodactylum tricornutum [5,6] (http://genome.jgi-psf.org/Phatr2/Phatr2.home.html).
The physico-chemical environments of phytoplankton fluc-tuate frequently in the ocean [7]. Diatoms have been assumed toacclimatize to environmental changes by a mechanism some-what different from that of higher plants [8]. Reduction of lightintensity decreases the ratio of photosystem (PS) II to PS I incyanobacteria, green algae and vascular plants, whereas in apennate diatom, Cylindrotheca fusiformis, the ratio increasedfrom 1.3 to 3.9 [9]. A similar result was reported for a marinecentric diatom, Skeletonema costatum [10], although contrastingresults are also reported [4]. The PS II:PS I ratios reported fordiatoms exceed 1.0 and are larger than those of cyanobacteria(∼0.1) and higher plants (∼1.0) [8,11].
In most photosynthetic organisms the number of antennapigment–protein complexes changes in response to environmental

352 Y. Ikeda et al. / Biochimica et Biophysica Acta 1777 (2008) 351–361
changes in light intensity, as typically occurs with chlorophyll(Chl) a/b protein in green plants and green algae [8,12]. However,in diatoms the ratio of accessory pigments to Chl a does notchange significantly [9,10,12,13]. This seems to be related todiatoms' specific light-harvesting antenna complex with uniqueaccessory pigments; Chl c, fucoxanthin, diadinoxanthin (DD) anddiatoxanthin (DT) are components of the fucoxanthin-Chl bindingproteins (FCP) [14]. DD andDTare the representative pigments ofa unique xanthophyll cycle that protects their photosystems underhigh irradiance [15–18].
Biochemical studies of diatom photosynthetic systems arerare [5,19] because of the difficulty of isolating photoactivethylakoid membranes from the cells, which have hard silicateshells. Thylakoid membranes isolated from C. fusiformis afterdisruption with a French pressure cell exhibited a rate of oxygenevolution about half of that in the intact cells [20]. Berkaloff etal. isolated a P700 (a reaction center (RC) Chl dimer of PS I)-enriched fraction from P. tricornutum with digitonin [19].Further solubilization of the P700-enriched fraction with n-dodecyl-β-D-maltopyranoside (DDM) released polypeptides ofaround 20 kDa, which were assumed to be a light-harvestingChl protein (LHC) associated with the PS I complex. Recently,Brakemann et al. isolated thylakoid membranes from a centricdiatom, Cyclotella cryptica, using a French pressure cell [21].Pigment-containing fractions obtained by sucrose densitygradient centrifugation or deriphate-polyacrylamide gel electro-phoresis after solubilization of the thylakoid membranes with10% DDM were shown to be PS I and PS II complexesassociated with FCP [21]. The composition of the PS I complexof diatoms, however, has not been precisely determined yet.
In this study we report new methods for isolating highlyphotoactive thylakoid membranes and the PS I complex from amarine centric diatom, Chaetoceros gracilis. The purified PS Icomplex contained tightly-bound FCPs that transfer excitationenergy to PS I. Blue native polyacrylamide gel electrophoresis(BN-PAGE) and size-exclusion chromatography revealed thePS I complex to be a monomer with antenna FCPs similar to thepea PS I with Chl a/b LHC [22], rather than a trimer as in the PSI of cyanobacteria [23].
2. Materials and methods
2.1. Culture conditions
The centric diatom, C. gracilis Schütt (UTEX LB2658), was grownphotoautotrophically in 7.5 L F/2 medium [24] supplemented with artificial seawater (Sigma, St. Louis, MO), which was aerated with air containing 5% CO2, at20 °C for 6–8 d in a 9 L polycarbonate square bottle (Nalge Nunc, Rochester,NY). Continuous light was supplied by two 22 W fluorescent bulbs (Toshiba,Tokyo, Japan) placed on the opposite sides of the bottle. The light intensity at thesurface facing the light source was 13 μmol photons m−2 s−1. Cells in a latelogarithmic-phase were collected by centrifugation (3000×g, 15 min) andresuspended in buffer A (50 mM 2-morpholinoethanesulfonic acid (MES)-NaOH (pH 6.0), 10 mMMgCl2, 5 mM CaCl2) supplemented with 25% glycerol(buffer B). The collected cells were frozen and stored at −80 °C until use.
2.2. Purification of PS I complexes from Chaetoceros gracilis
All procedures were performed under room or dim light at 4 °C. After additionof DNase I (∼0.5 μg mL−1) (Sigma) and protease inhibitor cocktail (250 μL/
100 mL cell suspension) (Sigma) to the thawed cell suspension, thylakoidmembranes were precipitated by centrifugation (40,000×g, 15 min) and washedonce in buffer A. The thylakoid membranes were resuspended in buffer Asupplementedwith 1M betaine at 1mgChl amL−1 and solubilizedwith 0.5–1.0%w/v n-dodecyl-β-D-maltopyranoside (DDM) (Anatrace, Maumee, OH) for 10 minon ice. The suitable concentrations of DDM were determined in prior preliminaryexperiments for each of the cultures so that solubilized thylakoid membranesaccounted for 60–70% of Chl a (w/w). The solubilized thylakoid membranesobtained after centrifugation (6000×g, 15 min) were loaded on a stepwise sucrosedensity gradient comprising 6 mL solutions of 0.4 M, 0.6 M and 0.8 M sucrose inbuffer A supplemented with 0.04% DDM. After centrifugation (300,000 ×g, 2 h)the pellet was resuspended in buffer B containing 0.04% DDM. After removal ofunsolubilized materials by centrifugation (9000 ×g, 15 min), the PS I-enrichedsupernatant was applied to size-exclusion chromatographs (HiPrep 16/60Sephacryl S-300 HR, GE Healthcare UK Ltd., Buckinghamshire, England) withbuffer B containing 0.04% DDM at a flow rate of 0.5 mL min−1. The elution wasmonitored at 280 nm. Molecular mass was estimated using a PS I trimer fromSynechocystis sp. PCC 6803 (∼1000 kDa) obtained as a flow-through fraction at apurifying step for PS II complexes [25], ferritin (440 kDa), catalase (232 kDa) andaldolase (158 kDa) as molecular-mass markers. The peak fraction accounting foronly 1% Chl a (w/w) in the thylakoid membrane preparation was collected and thePS I complexes were precipitated by centrifugation (40,000 ×g, 15 min) in thepresence of 15% polyethylenglycol 8000 and resuspended in buffer B containing0.04% DDM.
2.3. Isolation of PS I-enriched membranes from spinach
PS I-enriched membranes were prepared as a Triton X100-solubilizedstromal thylakoid fraction from spinach purchased at a local market [26].
2.4. Polypeptide analysis
Sodium dodecyl sulfate-polyacrylamide gel electrophoresis (SDS-PAGE)and N-terminal amino acid sequencing using a protein sequencer PSQ-1(Shimadzu, Kyoto, Japan) were performed as described in [27]. PsaA/PsaB andFCPs were identified immunologically using specific antibodies against PsaA/B[28] and FCPs from the raphidophyte Heterosigma akashiwo (obtained fromProf. B. R. Green of the University of British Columbia). For immunodetection,bands were visualized using enhanced chemiluminescence reagents (WestPico;Pierce) on a Fujifilm LAS-1000 imager (Fujifilm, Tokyo, Japan). BN-PAGEwasperformed as described in [29] with a 2.5–13% T acrylamide separation gel and2.5% T acrylamide stacking gel run at 4 °C using PS I complexes equivalent to6 μg Chl a. Molecular mass of the PS 1 complexes was estimated using the setof standard proteins for size-exclusion chromatography, as described in section2.2, supplemented with thyroglobulin (669 kDa). Second-dimensional SDS-PAGE was conducted using a Tris/MES gel system with a 18–24% gradientacrylamide gel containing 6 M urea as described in [27].
2.5. Analysis of pigments and quinones
The amounts of menaquinone-4 (MK-4), phylloquinone (PhQ), andphotosynthetic pigments were determined by reverse-phase high performanceliquid chromatography (HPLC) with a Prodigy 5 (ODS 3, 100 Å) column(150×4.60 mm) (Phenomenex Inc., Torrance, CA) and a Shimadzu LC-10 ADsystem with a SCL-10A controller using a gradient of solvents as describedpreviously [18]. Pigments and quinones were extracted using N,N-dimethylfor-mamide [30] prior to HPLC analysis. Pigment extracts equivalent to 0.25–0.6 μgChl a were injected. Pigment absorption patterns were detected with a ShimadzuSPD-M10AVP photodiode array detector and analyzed with Shimadzu CLASS-M10A software. MK-4 and PhQ quantities were determined at 270 nm and theamount of photosynthetic pigments was determined at 430 nm. MK-4 and PhQlevels were calibrated using extinction coefficients described in [31]. The amountof photochemically active P700 was assessed by the reduction in light-inducedabsorbance at 700 nm using a MPS2000 UV–VIS spectrophotometer(Shimadzu) at room temperature with 10 μg Chl a mL−1. The reaction mixturecontained 1 mM methylviologen as an electron acceptor, and 0.5 mM sodiumascorbate and 10 μM 2,6-dichlorophenolindophenol as electron donors in buffer
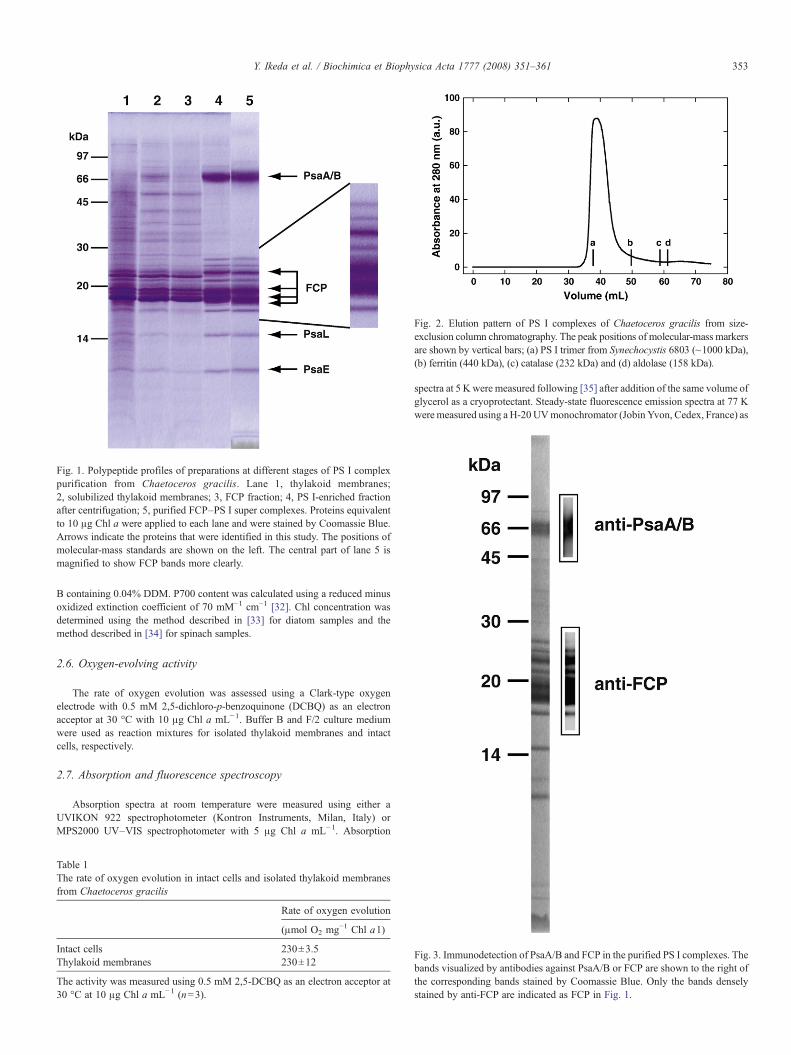
Fig. 1. Polypeptide profiles of preparations at different stages of PS I complexpurification from Chaetoceros gracilis. Lane 1, thylakoid membranes;2, solubilized thylakoid membranes; 3, FCP fraction; 4, PS I-enriched fractionafter centrifugation; 5, purified FCP–PS I super complexes. Proteins equivalentto 10 μg Chl a were applied to each lane and were stained by Coomassie Blue.Arrows indicate the proteins that were identified in this study. The positions ofmolecular-mass standards are shown on the left. The central part of lane 5 ismagnified to show FCP bands more clearly.
Fig. 2. Elution pattern of PS I complexes of Chaetoceros gracilis from size-exclusion column chromatography. The peak positions of molecular-mass markersare shown by vertical bars; (a) PS I trimer from Synechocystis 6803 (~1000 kDa),(b) ferritin (440 kDa), (c) catalase (232 kDa) and (d) aldolase (158 kDa).
353Y. Ikeda et al. / Biochimica et Biophysica Acta 1777 (2008) 351–361
B containing 0.04% DDM. P700 content was calculated using a reduced minusoxidized extinction coefficient of 70 mM−1 cm−1 [32]. Chl concentration wasdetermined using the method described in [33] for diatom samples and themethod described in [34] for spinach samples.
2.6. Oxygen-evolving activity
The rate of oxygen evolution was assessed using a Clark-type oxygenelectrode with 0.5 mM 2,5-dichloro-p-benzoquinone (DCBQ) as an electronacceptor at 30 °C with 10 μg Chl a mL−1. Buffer B and F/2 culture mediumwere used as reaction mixtures for isolated thylakoid membranes and intactcells, respectively.
2.7. Absorption and fluorescence spectroscopy
Absorption spectra at room temperature were measured using either aUVIKON 922 spectrophotometer (Kontron Instruments, Milan, Italy) orMPS2000 UV–VIS spectrophotometer with 5 μg Chl a mL−1. Absorption
Table 1The rate of oxygen evolution in intact cells and isolated thylakoid membranesfrom Chaetoceros gracilis
Rate of oxygen evolution
(μmol O2 mg−1 Chl a1)
Intact cells 230±3.5Thylakoid membranes 230±12
The activity was measured using 0.5 mM 2,5-DCBQ as an electron acceptor at30 °C at 10 μg Chl a mL−1 (n=3).
spectra at 5 K were measured following [35] after addition of the same volume ofglycerol as a cryoprotectant. Steady-state fluorescence emission spectra at 77 Kweremeasured using aH-20UVmonochromator (Jobin Yvon, Cedex, France) as
Fig. 3. Immunodetection of PsaA/B and FCP in the purified PS I complexes. Thebands visualized by antibodies against PsaA/B or FCP are shown to the right ofthe corresponding bands stained by Coomassie Blue. Only the bands denselystained by anti-FCP are indicated as FCP in Fig. 1.

Table 2Content of photosynthetic pigments in purified FCP–PS I super complexes
Pigments Chl c1+c2 Fucoxanthin DD+DT Vx β-carotene
Molar ratioper 224 Chl a
21.7 54.7 30.0 0.72 16.7(±1.1) (±3.3) (±0.39) (±0.087) (±0.31)
Molar ratios of pigments per 224 Chl a are presented. Pigment quantities weredetermined by HPLC. The Chl a antenna size (224 Chl a) was assessed based onthe concentration of photo-oxidizable P700. The values are expressed with±SE(n=5).
354 Y. Ikeda et al. / Biochimica et Biophysica Acta 1777 (2008) 351–361
in [36]. Measurement of time-resolved fluorescence spectra (TRFS) wasperformed as described in [35] with some modifications. A Ti:sapphire laser(Mai Tai; Spectra-Physics in Newport Corporation, Irvine, CA) was used as thelight source. The 460 nm pulse of 150 fs width was generated from the original920 nm laser pulse operated at 80MHz through a piece of BBO crystal. The laserpulse was passed through a 460 nm interference filter and focused onto thesample. The time resolution of the streak camera spectrophotometer for detectionof the fluorescence signal was 5 ps [35]. The photoelectrons were collected inCCD images of 50,000 shots [35]. Global analysis of the fluorescence decaycurve was conducted as described in [35].
Chl, chlorophyll; DD, diadinoxanthin; DT, diatoxanthin; Vx, violaxanthin.
3. Results
3.1. Isolation of thylakoid membranes
Highly photoactive thylakoid membranes were successfullyisolated by simply disrupting diatomcells by freezing and thawing.
Fig. 4. Two-dimensional separation of purified PS I complexes from Chaeto-ceros gracilis using blue-native electrophoresis. PS I complexes equivalent to6 μg Chl a were applied to BN-PAGE after incubation for 5 min with 0.05%DDM. The gel strip after BN-PAGE, which is shown at the top without staining,was developed on the second-dimensional SDS-PAGE. The second-dimensionalpicture was obtained after staining with Coomassie. Polypeptides separated fromPS I complexes on the second-dimensional SDS-PAGE are indicated by arrows.The position of molecular-mass standards for the BN-PAGE were determinedusing a PS I trimer from Synechocystis 6803 (∼1000 kDa), thyroglobulin(669 kDa), ferritin (440 kDa), catalase (232 kDa) and aldolase (158 kDa).
The thylakoid membranes (Fig. 1, lane 1) showed oxygen-evolving activity of 230 μmol O2 mg−1 Chl a h−1 with 0.5 mM2,5-DCBQ as an electron acceptor. The activitywas comparable tothat of intact cells (Table 1). The most abundant protein in theisolated thylakoid membranes was FCP (Fig. 1, lane 1).
3.2. Purification of PS I complex
The thylakoid membranes solubilized with a detergent,DDM, also contained FCP as a main component (Fig. 1, lane 2).Following sucrose density gradient centrifugation of the
Fig. 5. HPLC traces of MK-4 (A), PhQ (B) and pigments extracted from diatomPS I complexes (C) and the spinach PS I fraction (D). Peak 1, MK-4; peak 2,PhQ; peak 3, MK-4; peak 4, Chl a; peak 5, Chl a'; peak 6, β-carotene; peak 7,Chl b; peak 8, PhQ. The Chl a/b ratio of the spinach PS I fraction was 7.8 (w/w),which confirmed its high enrichment of PS I.

355Y. Ikeda et al. / Biochimica et Biophysica Acta 1777 (2008) 351–361
solubilized membranes, most FCP and PS II complexes wereseparated as a brown band (Fig. 1, lane 3) in the∼0.4 M sucroseregion (data not shown) and the PS I RC fraction formed a pellet(Fig. 1, lane 4). The purified PS I complex (Fig. 1, lane 5),which was obtained as a single peak by size-exclusionchromatography of the PS I-enriched pellet, had a molecularsize of ∼1000 kDa (Fig. 2). The purified PS I complexcontained at least fourteen polypeptides between 3 and 70 kDain size (Fig. 1, lane 5).
3.3. Polypeptide composition
Themajor bands at∼70 kDawere identified as PsaA and PsaBby immunoblotting using an antiserum specific to PsaA/B (Fig. 3).The four dark bands of∼18.5, 20.0 and 23.5 kDawere assigned toFCPproteins by immunoblotting using an antiserum raised againstFCP (Fig. 3). All the distinct polypeptide bands other than those at∼20 kDa and PsaA/PsaBwere subjected toN-terminal amino acidsequencing. A BLAST search [37] identified the ∼15 kDa bandwith a N-terminal amino acid sequence of ANFIKPYNDDPFVGas PsaL. The ∼10 kDa band with a N-terminal amino acidsequence of VSRGSKVRILRKExY (x represents an uncertainresidue) was confirmed to be PsaE. N-terminal sequences of otherpolypeptides could not be determined. They were blocked. Nopolypeptides showed migration lengths identical to those of PS IIcomponents (data not shown).
The purified PS I complex, which was obtained after size-exclusion chromatography, contained FCP proteins as the majorbands (Fig. 1, lane 5). The purified PS I complex was subjectedto non-denaturing BN-PAGE and second-dimensional denatur-ing SDS-PAGE. Only a single green band was detected in theBN-PAGE (Fig. 4, top horizontal strip). The migration length ofthe purified PS I complex on BN-PAGE was comparable to that
Fig. 6. Absorption spectra of MK-4 and PhQ compared to those of peak 3 (A) and pealevel at 270 nm. The spectrum for peak 8 of the spinach PS I fraction was obtained usinof 0.005 N HCl to eliminate interference by Chls a and a'.
of the PS I trimer of Synechocystis 6803 (∼1000 kDa) [23]. Thesecond-dimensional SDS-PAGE of this single green bandrevealed thirteen distinct polypeptide spots including the FCPbands at ∼20 kDa (Fig. 4), indicating the FCP proteins and thePS I RC complex were closely associated.
3.4. Pigment and quinone composition
The antenna size of the FCP–PS I super complex wasestimated to be 224 (±4.0, n=5) Chl a per P700, which is inagreement with the value estimated for PS I isolated fromP. tricornutum (225±25 per P700; [19]). HPLC analyses of thepurified FCP–PS I super complex revealed an abundance of Chlc and xanthophylls such as fucoxanthin, DD, DT andviolaxanthin (Vx) (Table 2).
PhQ, which is known to be the secondary electron acceptor A1
in PS I, was eluted by reverse-phase HPLC between Chl a andChl a' from the spinach PS I fraction (peak 8 in Figs. 5D and 6B).However, PhQ was not detected in the FCP–PS I super complexfrom C. gracilis (Fig. 5C). Instead, a quinone was detected at theretention time of 32–34min (peak 3 in Fig. 5C) whose absorptionspectrum was identical to that of MK-4 (Fig. 6A), which waseluted at the comparable retention time as peak 1 (Fig. 5A). TheMK-4 detected in the C. gracilis FCP–PS I super complex wasestimated to have a molecular ratio of 1.59 (±0.10, n=5) perP700.
3.5. Absorption spectrum of purified FCP–PS I super complex
The absorbance between 450 and 550 nm in the spectrum ofthe purified FCP–PS I super complex is smaller than those inthe spectra of thylakoid membranes and FCP, indicating that thepurified FCP–PS I super complex contained lower amounts of
k 8 (B) in Fig. 5, respectively. The spectra amplitudes were adjusted to the sameg extracted pigments whose Chls had been converted to pheophytins by addition

Fig. 7. Absorption spectra of the FCP fraction, thylakoid membranes andpurified FCP–PS I super complexes of Chaetoceros gracilis. A, absorptionspectra measured at 290 K. Dotted line, thylakoid membranes; dashed line, FCPfraction; and solid line, purified FCP–PS I super complexes. The Chl aconcentration was 5 μg mL−1. Absorption spectra were measured at roomtemperature and normalized at the red peak. B, Absorption spectrum of theFCP–PS I super complex (7.5 μg Chl a mL−1) measured at 5 K.
Fig. 8. Steady-state fluorescence emission spectra at 77 K. FCP, FCP fraction;Thy, thylakoid membranes; PS I, purified FCP–PS I super complexes fromChaetoceros gracilis. The Chl a concentration was 0.8 mg mL−1.
Fig. 9. Decay time course and wavelength-decay time image of fluorescence at77 K for the Chaetoceros gracilis FCP–PS I super complex. Fluorescence decaytime courses at different wavelengths were calculated from the measurements at77 K as shown in B. The symbols a, b and c correspond to 679, 697, and 714 nm,respectively. B, fluorescence emission excited by the repetitive 150 fs, 460 nmlaser light was measured with the streak camera system. The emission spectrumis painted from cold to warm colors to represent the increase in fluorescenceintensity. The Chl a concentration was 0.15 mg mL−1.
356 Y. Ikeda et al. / Biochimica et Biophysica Acta 1777 (2008) 351–361
Chl c and carotenoids with respect to Chl a. The purified FCP–PS I super complex gave a red peak at 679 nm, which is aremarkably longer wavelength than those of the thylakoidmembranes (675 nm) and FCP (671 nm). The band width at thehalf maximum in the FCP–PS I super complex is comparable tothat of thylakoid membranes, but is wider than that of FCP.Neither the thylakoid membranes nor the purified FCP–PS Isuper complexes contained components absorbing at ∼705 nmcorresponding to the so-called red Chls, which are found inmost PS I RCs [38]. The absorption spectrum at 5 K of thepurified FCP–PS I super complex (Fig. 7B) showed almost noabsorption at ∼705 nm, which confirmed the absence of redChls. The spectrum showed an asymmetric peak at 680 nm,extended on the shorter wavelength side, which indicated thepresence of FCP.
3.6. Energy transfer
The steady-state fluorescence emission spectrum at 77 K ofthylakoid membranes showed a distinct peak at 696 nm andshoulder peaks at ∼685 nm and 710 nm (Fig. 8, Thy). The FCPfraction emitted peak fluorescence at a shorter wavelength of683 nm (Fig. 8, FCP). The purified FCP–PS I super complexemitted peak fluorescence at 710 nm (Fig. 8, PS I), and producedvery low fluorescence of FCP at 680∼690 nm despite the highcontent of FCP (Fig. 1, lane 5 and Table 2), which is suggestiveof efficient energy transfer from FCP to the PS I RC complex.
To address energy transfer from FCP to the PS I core, thefluorescence decay kinetics and time-resolved fluorescencespectrum (TRFS) [35] of the purified FCP–PS I super complexwere obtained (Fig. 9). The three-dimensional image (Fig. 9B)demonstrated the gradual transition of the fluorescence peakfrom 690 nm to longer wavelengths. The kinetics at 679 nm(Fig. 9A, line a) calculated from the image showed very rapiddecay within 100 ps, while those at 697 and 714 nm (Fig. 9A,lines b and c, respectively) showed slow rises with much slower
decays, which was indicative of energy transfer from the short-to long-wavelength fluorescence bands.
To clarify the complete TRFS picture, a global multi-expo-nential analysis of the decay kinetics was performed; theresulting decay-associated spectra (DAS) [35] are shown inFig. 10. When the PS I complex was excited at 460 nm, fourDAS components were obtained with time constants of 16, 57,246 and larger than 3000 ps, respectively. Positive peaks werelocated at around 685, 695, 710 and 715 nm. A similar resultwas obtained when the complex was excited at 440 nm (data notshown). The fastest 16 ps DAS component showed a positivepeak at ∼685 nm. The following three DAS components hadtime constants of 57 ps, 246 ps and longer than 3 ns withpositive peaks but lower amplitudes at ∼695, ∼710 and

Fig. 10. Decay-associated spectra (DAS) obtained through the global multi-exponential analysis of the fluorescence decay kinetics shown in Fig. 9. Each fluorescencespectrum belongs to the decay component whose time constant is 16–24 ps (red line, 16 ps), 45–57 ps (green line, 57 ps), 236–336 ps (blue line, 246 ps) and largerthan 3 ns (dark blue line, N3 ns), respectively. The spectrum of the fluorescence component whose decay time constant is larger than 3 ns is shown at a ×20 scale(dashed dark blue line, N3 ns).
357Y. Ikeda et al. / Biochimica et Biophysica Acta 1777 (2008) 351–361
∼715 nm, respectively. These results demonstrate that excita-tion energy sequentially transferred from the fastest DAScomponent (F685) to the slower DAS components (F695, F710and F715 in Fig. 11). The peak wavelength of the fastest DAScomponent was identical to that observed in the FCP fractionshown in Fig. 8. Fluorescence from FCP could not be clearlyrecognized in other slower DAS components (Fig. 10). It seemsthat the fluorescence from the energy transfer-active fractionof FCP mainly contributes to the fastest DAS component(see below). Therefore, the features of the fastest DAS com-ponent, together with those of the other DAS components, seemto represent excitation energy transfer from FCP to PS I RC. Asmall contribution of fluorescence at ∼685 nm in the slowestDAS component (N3 ns) might correspond to the small fraction
Fig. 11. Model of the FCP–PS I super complex and light energy transfer withinthe complex. Tc, time constant.
of FCP that could not transfer excitation energy to PS I RC inthe purified complexes.
4. Discussion
4.1. Isolation of photoactive thylakoid membranes
Thylakoid membranes were isolated from C. gracilis by avery simple process, which consisted of disruption of cells byfreezing and thawing followed by centrifugation. The integrityof the thylakoidmembranes is demonstrated by the high oxygen-evolving activity (as high as 230 μmol O2 mg−1 Chl h−1), whichis comparable to that of intact cells. The activity is significantlyhigher than the rate of 52 μmol O2 mg−1 Chl h−1 reported byMartinson et al. [20]. The method was also used to preparehighly active membranes from T. pseudonana, indicating that itis applicable for the biochemical study of other diatoms.
4.2. Composition of polypeptides in the purified FCP–PS Isuper complex
The polypeptide profile of the purified FCP–PS I supercomplex (Fig. 1, lane 5) analyzed by a specialized gel system[27,39] indicated the presence of PsaA, PsaB, PsaE and PsaL(Fig. 1). PsaE and PsaL were identified for the first time in apurified diatom PS I preparation. Recently, PsaL was detected in amixed PS I/PS II fraction from P. tricornutum by mass spectro-metry analysis [40]. At least six more polypeptides (12 polypep-tides in total) were detected in the present study, although theiridentification awaits internal amino acid sequencing. The PS Icomposition of C. gracilis is somewhat different from that of thePS I preparation from a pennate diatom,P. tricornutum [19], whichcontained at least six additional polypeptides of 30–50 kDa. ThePS I fraction associated with FCP obtained from a centric diatom,C. cryptica, also showed additional polypeptides of∼30 kDa [21].Since the crystallized PS I RC complex of cyanobacteria [23] andhigher plants, which retains LHC [22,41], did not containpolypeptides in this molecular size range, the PS I complex

358 Y. Ikeda et al. / Biochimica et Biophysica Acta 1777 (2008) 351–361
obtained in the present study seems to be highly purified.Purification of a FCP–PS I complex from P. tricornutum hasrecently been reported [42], after the preparation of the presentreport. However, our method yielded a more highly purifiedpolypeptide profile for C. gracilis than those for P. tricornutum[42] andC. cryptica [21]. A remarkable feature of our purified PS Icomplex is seen in its association with multiple specific FCPproteins, as demonstrated by their co-migration with the PS I RCcomplex throughout BN-PAGE (Fig. 4). FCP proteins may exist atthe periphery of the PS I RC complex in the form of higheroligomers [43] (see Fig. 11). The integrity of the purified FCP–PSIcomplex we obtained was indicated by the low contribution ofFCP to the fluorescence emission spectrum (Fig. 8), despite thehigh FCP content (lane 5 in Fig. 1 and Table 2). This resultcontrasted with those for the FCP–PS I complexes fromC. cryptica [21] and P. tricornutum [42], which showed highFCP fluorescence. In C. cryptica, the apparent uncoupling of theFCP and PS I RC complex might be due to the over-solubilizationof thylakoid membranes from using a DDM concentration as highas 10% (w/w), since green bands were reported after sucrosedensity centrifugation or deriphat-PAGE [21]. Greenish bandswere also obtained following sucrose density gradient centrifuga-tion in the initial stages of our study, but subsequently weoptimized the amount of DDM until only brown bands wereobtained. As well, the use of a French pressure cell to disrupt thecell [42,44] might have affected the integrity of the FCP–PS Icomplex in P. tricornutum.
4.3. Characteristics of the FCP–PS I super complex
The number of FCPproteins bound to the PS IRC complex canbe estimated as follows. The size of themonomeric cyanobacterialPS I RC complex is 356 kDa based on the inclusion of 96 Chl aand 22 carotenoid molecules [23]. The extra pigments in ourpurified PS I complex comprise 128 Chl a, 22 Chl c and 80carotenoid molecules (Table 2), which altogether correspond to∼170 kDa. The molecular size of the purified PS I complex wasestimated to be ∼1000 kDa (Figs. 2 and 4). The remainingunassigned mass (∼470 kDa) is attributed to FCP apoproteins.Since the molecular size of FCP apoproteins could be assumed tobe ∼19 kDa (Fig. 1), the number of FCPs was estimated to be∼25 copies per PS I, which is quite large compared to that of LHCbound to pea PS I RC complex [22,41]. If we assume that theextra pigments are evenly distributed with each FCP protein,the number of Chl a, Chl c and fucoxanthin molecules oneach FCP would be about 5, 1 and 3, respectively (Chl a:Chlc:fucoxanthin=100:17.2:42.7). The exact stoichiometry ofpigments on a single FCP protein has not been reported yet.
The estimated pigment stoichiometry is comparable to thatreported for the native LHCF-I fraction obtained from a brownalga (Chl a:Chl c:fucoxanthin=100:19.3:58.1) [45] but differssomewhat from that obtained for the isolated FCP in the presentstudy (Chl a:Chl c:fucoxanthin=100:44.9:130). The latter issimilar to that reported for ‘native’ LH from P. tricornutum(Chl a:Chl c:fucoxanthin=100:38:127) [19]. However, themolar pigment ratios from different FCP preparations varyconsiderably (e.g., [14,42,45,47,48]), and may reflect different
peptide compositions from the expressions of the many FCPgenes known to come from diatoms [5,46]. Similarly, the re-latively high ratio of Chl a to Chl c and fucoxanthin reportedhere for the purified FCP–PS I super complex may reflect theinvolvement of PS I-specific FCP genes.
4.4. Menaquinone as the secondary electron acceptor A1
MK-4 was detected at a ratio of 1.59 molecules per P700 inthe purified PSI complex instead of phylloquinone, which isknown to function as the secondary electron acceptor A1 or itscounterpart A1
' . A portion of MK-4 might be released during thepurification process. The role of phylloquinone as A1 or itscounterpart A1
' . is known to be functionally substituted byartificial quinones [49–51]. However, until now only twospecies, a primitive cyanobacterium, Gloeobacter violaceus[52], and a primitive red alga, Cyanidium caldarium [53], havebeen reported to use MK-4 as A1. The PS I complexes isolatedfrom a centric diatom, T. pseudonana, and a pennate diatom,P. tricornutum, also use MK-4 rather than phylloquinone (Ikedaet al., unpublished data). These results indicate that diatomsmay be phylogenetically unique with regard to A1.
4.5. Excitation energy transfer within the FCP–PSI supercomplex
Published reports of the fluorescence peak of FCPs varies from∼675 to ∼686 nm [19,54,55]. The peak wavelength of the FCPfraction obtained in the present study was ∼685 nm, which wasidentical to that of the fastest DAS component. Together with thebiochemical characteristics of the FCP–PS I super complexobtained, the identity of the fastest DAS component (F685) can beconcluded to beFCP. The excitation energy seems to be transferredfrom FCP to the chromophores (F695) in the PS I RC complexwith a time constant of 16 ps, with subsequent sequential energymigration to P700 or other fluorescent components. Direct energytransfer from FCPs to the PS I RC complex was demonstrated forthe first time in the present study. Trautman et al. reported that theexcitation energy transfer from fucoxanthin to Chl occurred in therange of 0.2 ps in P. tricornutum cells at room temperature [56].More recently, Papagiannakis et al. isolated FCP from Cyclotellameneghiniana and demonstrated that excitation energy transferoccurred on a time scale of 100 fs from Chl c to Chl a, and thatrapid energy transfer from fucoxanthin andChl c to Chl a occurredat room temperature [48]. Therefore, we can hypothesize thatexcitation energy trapped by accessory pigments (fucoxanthin andChl c) of FCP migrates to Chl a at the sub-picosecond time scale,and then to Chl a on the PS I RC complex on a time scale of tens ofpicoseconds. The tightly-bound FCPs in PS I may also mediateenergy transfer between theweakly boundperipheral FCPs and thePS I RC complex.
4.6. Chlorophylls on the core complex
The fluorescence spectrum of the isolated diatom thylakoidswas quite different from that observed in thylakoid membranesor cells of green plants and cyanobacteria, in which the long-wavelength fluorescence (720–740 nm) peaks have been

359Y. Ikeda et al. / Biochimica et Biophysica Acta 1777 (2008) 351–361
attributed to PS I and the shorter wavelength peaks at 680–690 nm to PS II (as reviewed in [57]). It is difficult to assign PS Ifluorescence in the fluorescence spectrum of the thylakoidmembranes of C. gracilis (Fig. 8). The steady-state fluorescencepeak for the purified FCP–PS I super complex was 710 nm at77 K, which is 10–30 nm shorter than that for PS I of manyother organisms. Similarly blue-shifted PS I fluorescence hasbeen reported for several species [58–62].
It is evident that the amount of the PS I complex componentthat absorbs light at ∼705 nm (red Chls) is small in diatoms(Fig. 7). In cyanobacterial PS I RC complexes, nine to twelveChls are assumed to be red Chls associated with PsaA, PsaB andPsaL [23]. In G. violaceus, which lacks long-wavelength fluo-rescence emitters [60,63], the comparison of deduced aminoacid sequences from a wide variety of organisms (data notshown) suggested that the loop PsaB, where Chls B31, B32, andB33 were coordinated [23,38], was modified so that red Chlswere absent. However, in diatoms, the deduced amino acidsequences of PsaB did not show similar modifications to thosein G. violaceus. Further analysis of the structural basis for theabsence of red Chls must await a high-resolution structure of aPS I complex deficient in red Chls from Chl c-containing algae.
The light intensity in the habitat of marine diatoms may below and, furthermore, the light quality is totally blue-shifted [7].C. gracilis, therefore, might not retain red Chls that are notuseful in such environments. Alternatively, the DD cycle withinthe FCP might take their place to dissipate the excess lightenergy on PS I [15,64]. Therefore, the tight binding and effi-cient energy transfer between FCP and the PS I core seems to beessential for the efficient function of diatom PS I.
4.7. Concluding remarks
In this study the diatom PS I complex was highly purified asa super complex with multiple FCP molecules (Fig. 11). Highamounts of FCPs that bind fucoxanthin and transfer excitationenergy efficiently to PS I will contribute to the light-harvestingfunction of PSI, especially in the blue-shifted light environmentin the oceans. The gentle method of purifying thylakoids andthe FCP–PS I super complex developed in this study will beuseful for future studies of photosynthetic mechanisms and themetabolic systems of diatoms, as well as contributing to a betterunderstanding of the global carbon cycle.
Acknowledgments
We are grateful to Drs. Beverly R. Green and Isao Enami forproviding antibodies andDr. SadaoWakabayashi for his technicalassistance with N-terminal amino acid sequencing. We also thanktwo anonymous referees and the journal editor for their construc-tive comments that improved our final manuscript. This workwassupported by the Ministry of Education, Culture, Sports, Scienceand Technology, Japan (18054028 to YK and 17370055 to SI)and grants from Hyogo Prefecture (YK), the National Institute ofPolar Research (16–28, YK) and the 21st Century Center ofExcellence Program (COE) from the Ministry of Education,Culture, Sports, Science and Technology, Japan (KS, SI).
References
[1] P. Falkowski, R.J. Scholes, E. Boyle, J. Canadell, D. Canfield, J. Elser, N.Gruber, K. Hibbard, P. Högberg, S. Linder, F.T. Mackenzie, B. Moor III, T.Pedersen, Y. Rosenthal, S. Seitzinger, V. Smetacek, W. Steffen, The globalcarbon cycle: a test of our knowledge of earth as a system, Science 290(2000) 291–296.
[2] D.M. Nelson, P. Tréguer, M.A. Brzezinski, A. Leynaert, B. Quéguiner,Production and dissolution of biogenic silica in the ocean: revised globalestimates, comparison with regional data and relationship to biogenic silicasedimentation, Global Biogeochem. Cycles 9 (1995) 359–372.
[3] C.B. Field, M.J. Behrenfeld, J.T. Randerson, P. Falkowski, Primaryproduction of the biosphere: integrating terrestrial and oceanic compo-nents, Science 281 (1998) 237–240.
[4] R.F. Strzepek, P.J. Harrison, Photosynthetic architecture differs in coastaland oceanic diatoms, Nature 431 (2004) 689–692.
[5] E.V. Armbrust, J.A. Berges, C. Bowler, B.R. Green, D. Martinez, N.H.Putnam, S. Zhou, A.E. Allen, K.E. Apt, M. Bechner, M.A. Brzezinski, B.K.Chaal, A. Chiovitti, A.K. Davis, M.S. Demarest, J.C. Detter, T. Glavina, D.Goodstein, M.Z. Hadi, U. Hellsten, M. Hildebrand, B.D. Jenkins, J. Jurka,V.V. Kapitonov, N. Kröger, W.W. Lau, T.W. Lane, F.W. Larimer, J.C.Lippmeier, S. Lucas,M.Medina, A.Montsant,M. Obornik,M.S. Parker, B.Palenik, G.J. Pazour, P.M. Richardson, T.A. Rynearson, M.A. Saito, D.C.Schwartz, K. Thamatrakoln, K. Valentin, A. Vardi, F.P. Wilkerson, D.S.Rokhsar, The genome of the diatom Thalassiosira pseudonana: ecology,evolution, and metabolism, Science 306 (2004) 79–86.
[6] M.P. Oudot-Le Secq, J. Grimwood, H. Shapiro, E.V. Armbrust, C. Bowler,B.R. Green, Chloroplast genomes of the diatoms Phaeodactylumtricornutum and Thalassiosira pseudonana: comparison with other plastidgenomes of the red lineage, Mol. Genet. Genomics 277 (2007) 427–439.
[7] P.G. Falkowski, J.A. Raven, Aquatic Photosynthesis, Princeton UnivPress, Princeton, NJ, 2007.
[8] A. Melis, Regulation of photosystem stoichiometry in oxygenic photosynth-esis, in: S. Miyachi, R. Kanai, S. Katoh (Eds.), Regulation of PhotosyntheticProcesses, The Botanical Society of Japan, Tokyo, 1991, pp. 9–28.
[9] B.M. Smith, A. Melis, Photochemical apparatus organization in the diatomCylindrotheca fusiformis: photosystem stoichiometry and excitationdistribution in cells grown under high and low irradiance, Plant CellPhysiol. 29 (1988) 761–769.
[10] P.G. Falkowski, T.G. Owens, A.C. Ley, D.C. Mauzerall, Effects of growthirradiance levels on the ratio of reaction centers in two species of marinephytoplankton, Plant Physiol. 68 (1981) 969–973.
[11] J.A. Raven, M.C.W. Evans, R.E. Korb, The role of trace metals inphotosynthetic electron transport in O2-evolving organisms, Photosynth.Res. 60 (1999) 111–150.
[12] P.G. Falkowski, T.G. Owens, Light–shade adaptation: tow strategies inmarine phytoplankton, Plant Physiol. 66 (1980) 592–595.
[13] A. Ban, S. Aikawa, H. Hattori, H. Sasaki, M. Sampei, S. Kudoh, M.Fukuchi, K. Satoh, Y. Kashino, Comparative analysis of photosyntheticproperties in ice algae and phytoplankton inhabiting Franklin Bay, theCanadian Arctic, with those in mesophilic diatoms during CASES 03–04,Polar Biosci. 19 (2006) 11–28.
[14] G. Guglielmi, J. Lavaud, B. Rousseau, A.L. Etienne, J. Houmard, A.V.Ruban, The light-harvesting antenna of the diatom Phaeodactylumtricornutum. Evidence for a diadinoxanthin-binding subcomplex, FEBSJ. 272 (2005) 4339–4348.
[15] B. Demmig-Adams, Carotenoids and photoprotection in plants: a role forthe xanthophyll zeaxanthin, Biochim. Biophys. Acta 1020 (1990) 1–24.
[16] M. Olaizola, H.Y. Yamamoto, Short-term response of the diadinoxanthincycle and fluorescence yield to high irradiance in Chaetoceros muelleri(Bacillariophyceae), J. Phycol. 30 (1994) 606–612.
[17] W. Arsalane, B. Rousseau, J.-C. Duval, Influence of the pool size of thexanthophyll cycle on the effects of light stress in a diatom: competitionbetween photoprotection and photoinhibition, Photochem. Photobiol. 60(1994) 237–243.
[18] Y. Kashino, S. Kudoh, Concerted response of xanthophyll-cycle pigmentsin a marine diatom, Chaetoceros gracilis, to the sifts of light condition,Phycol. Res. 51 (2003) 168–172.

360 Y. Ikeda et al. / Biochimica et Biophysica Acta 1777 (2008) 351–361
[19] C. Berkaloff, L. Caron, B. Rousseau, Subunit organization of PSI particlesfrom brown algae and diatoms: polypeptide and pigment analysis,Photosynth. Res. 23 (1990) 181–193.
[20] T.A. Martinson, M. Ikeuchi, F.G. Plumley, Oxygen-evolving diatomthylakoid membranes, Biochim. Biophys. Acta 1409 (1998) 72–86.
[21] T. Brakemann, W. Schlörmann, J. Marquardt, M. Nolte, E. Rhiel,Association of fucoxanthin chlorophyll a/c-binding polypeptides withphotosystems and phosphorylation in the centric diatom Cyclotellacryptica, Protist 157 (2006) 463–475.
[22] A. Ben-Shem, F. Frolow, N. Nelson, Crystal structure of plant photosystemI, Nature 426 (2003) 630–635.
[23] P. Jordan, P. Fromme, H.T. Witt, O. Klukas, W. Saenger, N. Krauß, Three-dimensional structure of cyanobacterial photosystem I at 2.5 Å resolution,Nature 411 (2001) 909–917.
[24] R.R. Guillard, J.H. Ryther, Studies of marine planktonic diatoms. I. Cy-clotella nana Hustedt, and Detonula confervacea (cleve) Gran, Can. J.Microbiol. 8 (1962) 229–239.
[25] Y. Kashino, W.M. Lauber, J.A. Carroll, Q. Wang, J. Whitmarsh, K. Satoh,H.B. Pakrasi, Proteomic analysis of a highly active photosystem IIpreparation from the cyanobacterium Synechocystis sp. PCC 6803 revealsthe presence of novel polypeptides, Biochemistry 41 (2002) 8004–8012.
[26] Y. Kashino, H. Koike, K. Satoh, Isolation of oxygen-evolving photosystemII particles with the intact QB site, in: N. Murata (Ed.), Research inPhotosynthesis, vol. II, Kluwer, 1992, pp. 163–166.
[27] Y. Kashino, H. Koike, K. Satoh, An improved sodium dodecyl sulfate-polyacrylamide gel electrophoresis system for the analysis of membraneprotein complexes, Electrophoresis 22 (2001) 1004–1007.
[28] Y. Kashino, I. Enami, K. Satoh, S. Katoh, Immunological cross-reactivityamong corresponding proteins of photosystems I and II from widelydivergent photosynthetic organisms, Plant Cell Physiol. 31 (1990) 479–488.
[29] H. Schägger, Blue native electrophoresis, in: C. Hunte, G. von Jagow, H.Schägger (Eds.), Membrane Protein Purification and Crystallization:A Practical Guide, Academic Press, Amsterdam, 2002, pp. 105–130.
[30] K. Furuya,M. Hayashi, Y. Yabushita, HPLC determination of phytoplanktonpigments using N,N-dimethylformamide, J. Oceanogr. 54 (1998) 199–203.
[31] P.J. Dunphy, A.F. Brodie, The structure and function of quinones inrespiratory metabolism, in: D.B. McCormick, L.D. Wright (Eds.),Vitamins and Coenzymes, Part C, Methods in Enzymology, vol. 18,Academic Press, New York, 1971, pp. 407–461.
[32] T. Hiyama, B. Ke, Difference spectra and extinction coefficients of P700,Biochim. Biophys. Acta 267 (1972) 160–171.
[33] S.W. Jeffrey, G.F. Humphrey, New spectroscopic equations for determin-ing chlorophylls a, b, c1 and c2 in higher plants, algae and naturalphytoplankton, Biochem. Physiol. Pflanzen 167 (1975) 191–194.
[34] R.J. Porra, W.A. Thompson, P.E. Kriedemann, Determination of accurateextinction coefficients and simultaneous equations for assaying chlor-ophylls a and b extracted with four different solvents: verification of theconcentration of chlorophyll standards by atomic absorption spectroscopy,Biochim. Biophys. Acta 975 (1989) 384–394.
[35] M. Komura, Y. Shibata, S. Itoh, A new fluorescence band F689 inphotosystem II revealed by picosecond analysis at 4–77 K: function of twoterminal energy sinks F689 and F695 in PS II, Biochim. Biophys. Acta1757 (2006) 1657–1668.
[36] N. Inoue-Kashino, Y. Kashino, K. Satoh, I. Terashima, H.B. Pakrasi,PsbU provides a stable architecture for the oxygen-evolving system incyanobacterial photosystem II, Biochemistry 44 (2005) 12214–12228.
[37] S.F. Altschul, T.L. Madden, A.A. Schäffer, J. Zhang, Z. Zhang, W. Miller,D.J. Lipman, Gapped BLASTand PSI-BLAST: a new generation of proteindatabase search programs, Nucleic Acids Res. 25 (1997) 3389–3402.
[38] M. Byrdin, P. Jordan, N. Krauss, P. Fromme, D. Stehlik, E. Schlodder, Lightharvesting in photosystem I: modeling based on the 2.5-Å structure of pho-tosystem I from Synechococcus elongatus, Biophys. J. 83 (2002) 433–457.
[39] Y. Kashino, Separation methods in the analysis of protein membranecomplexes, J. Chromatogr. B 797 (2003) 191–216.
[40] B. Lepetit, D. Volke, M. Szabo, R. Hoffmann, G. Garab, C. Wilhelm, R.Goss, Spectroscopic and molecular characterization of the oligomericantenna of the diatom Phaeodactylum tricornutum, Biochemistry 46(2007) 9813–9822.
[41] A. Amunts, O. Drory, N. Nelson, The structure of a plant photosystem Isupercomplex at 3.4 Å resolution, Nature 447 (2007) 58–63.
[42] T. Veith, C. Büchel, The monomeric photosystem I-complex of the diatomPhaeodactylum tricornutum binds specific fucoxanthin chlorophyllproteins (FCPs) as light-harvesting complexes, Biochim. Biophys. Acta1767 (2007) 1428–1435.
[43] C. Büchel, Fucoxanthin-chlorophyll proteins in diatoms: 18 and 19 kDasubunits assemble into different oligomeric states, Biochemistry 42 (2003)13027–13034.
[44] L.A. Gugliemelli, H.J. Dutton, P.A. Jursinic, H.W. Siegelman, Energytransfer in a light-harvesting carotenoid-chlorophyll c-chlorophyll a-proteinof Phaeodactylum tricornutum, Photochem. Photobiol. 33 (1981) 903–907.
[45] A. De Martino, D. Douady, M. Quinet-Szely, B. Rousseau, F. Crepineau,K. Apt, L. Caron, The light-harvesting antenna of brown algae: highlyhomologous proteins encoded by a multigene family, Eur. J. Biochem. 267(2000) 5540–5549.
[46] S. Scala, N. Carels, A. Falciatore, M.L. Chiusano, C. Bowler, Genomeproperties of the diatom Phaeodactylum tricornutum, Plant Physiol. 129(2002) 993–1002.
[47] A. Beer, K.Gundermann, J. Beckmann, C. Büchel, Subunit composition andpigmentation of fucoxanthin-chlorophyll proteins in diatoms: evidence for asubunit involved in diadinoxanthin and diatoxanthin binding, Biochemistry45 (2006) 13046–13053.
[48] E. Papagiannakis, I.H.M. van Stokkum, H. Fey, C. Büchel, R. vanGrondelle, Spectroscopic characterization of the excitation energy transferin the fucoxanthin-chlorophyll protein of diatoms, Photosynth. Res. 86(2005) 241–250.
[49] I. Ikegami, S. Itoh, M. Iwaki, Selective extraction of antenna chlorophylls,carotenoids and quinones from photosystem I reaction center, Plant CellPhysiol. 41 (2000) 1085–1095.
[50] M. Iwaki, S. Itoh, Electron transfer in spinach photosystem I reactioncenter containing benzo-, naphtho- and anthraquinones in place ofphylloquinone, FEBS Lett. 256 (1989) 11–16.
[51] T.W. Johnson, B. Zybailov, A.D. Jones, R. Bittl, S. Zech, D. Stehlik, J.H.Golbeck, P.R. Chitnis, Recruitment of a foreign quinone into the A1 siteof photosystem I. In vivo replacement of plastoquinone-9 by media-supplemented naphthoquinones in phylloquinone biosynthetic pathwaymutants of Synechocystis sp. PCC 6803, J. Biol. Chem. 276 (2001)39512–39521.
[52] M. Mimuro, T. Tsuchiya, H. Inoue, Y. Sakuragi, Y. Itoh, T. Gotoh, H.Miyashita, D.A. Bryant, M. Kobayashi, The secondary electron acceptor ofphotosystem I in Gloeobacter violaceus PCC 7421 is menaquinone-4 thatis synthesized by a unique but unknown pathway, FEBS Lett. 579 (2005)3493–3496.
[53] E. Yoshida, A. Nakamura, T. Watanabe, Reversed-phase HPLC determina-tion of chlorophyll a' and naphthoquinones in photosystem I of red algae:existence of two menaquinone-4 molecules in photosystem I of Cyanidiumcaldarium, Anal. Sci. 19 (2003) 1001–1005.
[54] J. Lavaud, B. Rousseau, A.L. Etienne, Enrichment of the light-harvestingcomplex in diadinoxanthin and implications for the nonphotochemicalfluorescence quenching in diatoms, Biochemistry 42 (2003) 5802–5808.
[55] T.G. Owens, E.R. Wold, Light-harvesting function in the diatom Phaeo-dactylum tricornutum: I. Isolation and characterization of pigment–proteincomplexes, Plant Physiol. 80 (1986) 732–738.
[56] J.K. Trautman, A.P. Shreve, T.G. Owens, A.C. Albrecht, Femtoseconddynamics of carotenoid to chlorophyll energy transfer in thylakoid mem-brane preparations from Phaeodactylum tricornutum and Nannochloropsissp, in: M. Baltscheffsky (Ed.), Recent Progress of Photosynthesis Research,vol. II, Kluwer Academic Publishers, Dordrecht, 1990, pp. 289–292.
[57] S. Itoh, K. Sugiura, in: G.C. Papageorgiou (Ed.), Chlorophyll aFluorescence: A Signature of Photosynthesis, vol. 19, Springer, Dordrech,The Netherlands, 2004, pp. 231–250.
[58] S. Lin, R.S. Knox, Studies of excitation energy transfer within the greenalga Chlamydomonas reinhardtii and its mutants at 77 K, Photosynth. Res.27 (1991) 157–168.
[59] D. Mangels, J. Kruip, S. Berry, M. Rögner, E.J. Boekema, F. Koenig,Photosystem I from the unusual cyanobacterium Gloeobacter violaceus,Photosynth. Res. 72 (2002) 307–319.

361Y. Ikeda et al. / Biochimica et Biophysica Acta 1777 (2008) 351–361
[60] M. Mimuro, T. Ookubo, D. Takahashi, T. Sakawa, S. Akimoto, I. Yamazaki,H. Miyashita, Unique fluorescence properties of a cyanobacterium Gloeo-bacter violaceus PCC 7421: reasons for absence of the long-wavelength PSIChl a fluorescence at −196 °C, Plant Cell Physiol. 43 (2002) 587–594.
[61] K. Satoh, D.C. Fork, Chlorophyll fluorescence transients as indications ofchanges in the redox state of plastoquinone in intact Bryopsis corticulans,Plant Sci. Lett. 29 (1983) 133–144.
[62] K. Sugahara, N. Murata, A. Takamiya, Fluorescence of chlorophyll inbrown algae and diatoms, Plant Cell Physiol. 12 (1971) 377–385.
[63] F. Koenig, M. Schmidt,Gloeobacter violaceus— investigation of an unusualphotosynthetic apparatus. Absence of the long wavelength emission of photo-system I in 77 K fluorescence spectra, Physiol. Plant. 94 (1995) 621–628.
[64] A.Wehner, S. Storf, P. Jahns, V.H. Schmid, De-epoxidation of violaxanthin inlight-harvesting complex I proteins, J. Biol. Chem. 279 (2004) 26823–26829.