Embed Size (px)
DESCRIPTION
Physical Activity and the Metabolic Syndrome in Canada. Susan E. Brien, PhD School of Physical and Health Education Queen’s University Kingston, ON. Metabolic Syndrome. National Cholesterol Education Program Adult Treatment Panel III (NCEP ATP III) guidelines* Three or more of: - PowerPoint PPT Presentation
Citation preview
Physical Activity and the Metabolic Syndrome in Canada
Susan E. Brien, PhD
School of Physical and Health EducationQueen’s University
Kingston, ON
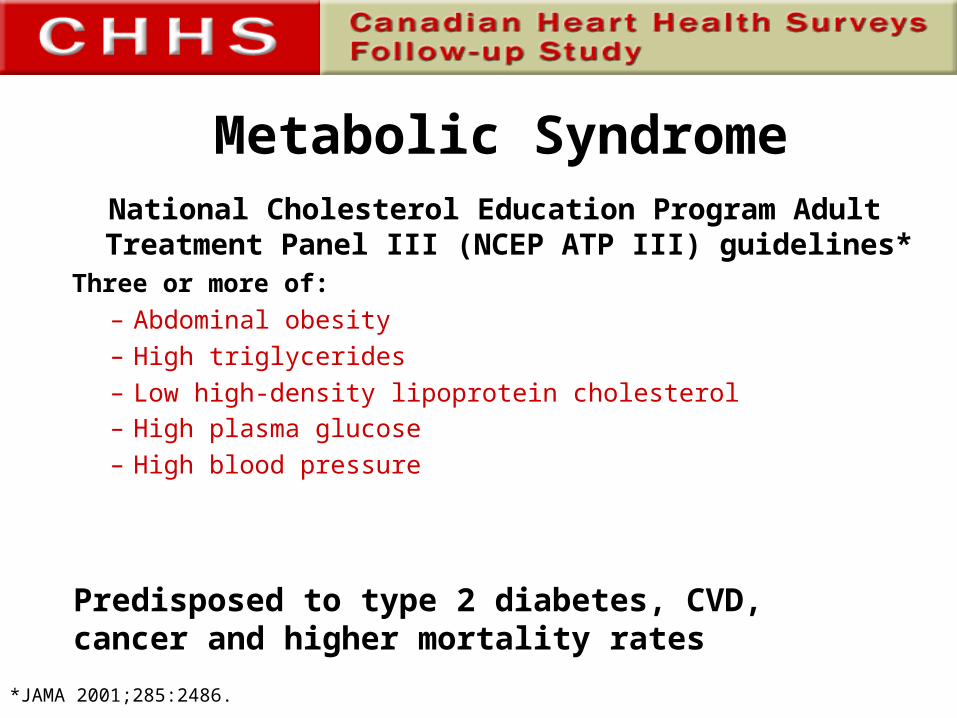
Metabolic Syndrome
Predisposed to type 2 diabetes, CVD, cancer and higher mortality rates
National Cholesterol Education Program Adult Treatment Panel III (NCEP ATP III) guidelines*
Three or more of:– Abdominal obesity – High triglycerides – Low high-density lipoprotein cholesterol – High plasma glucose
– High blood pressure
*JAMA 2001;285:2486.
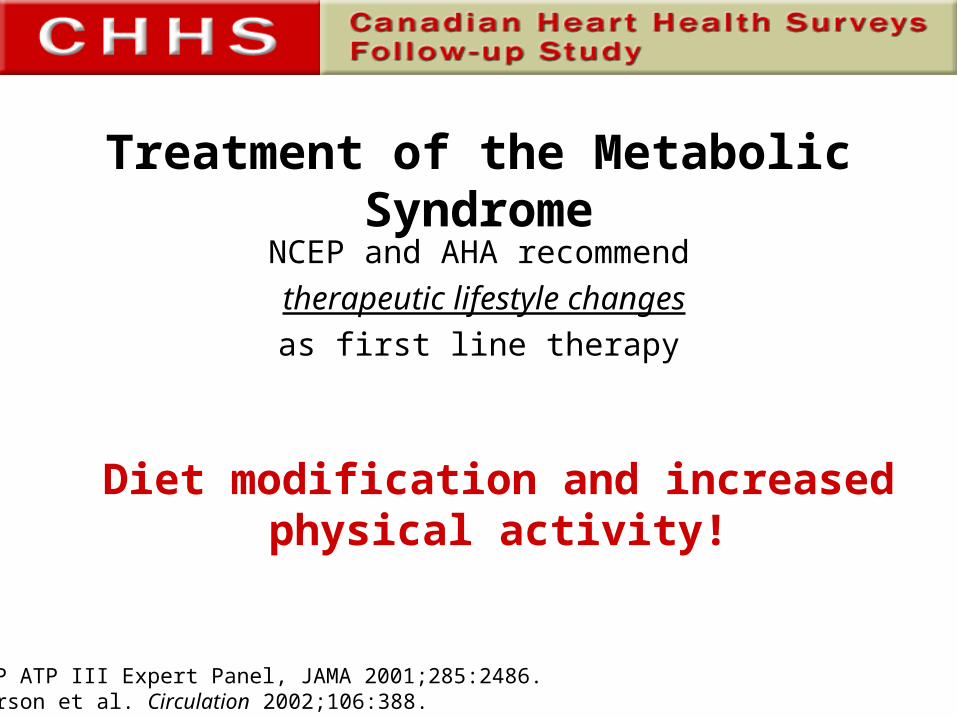
NCEP and AHA recommend
therapeutic lifestyle changes
as first line therapy
Treatment of the Metabolic Syndrome
NCEP ATP III Expert Panel, JAMA 2001;285:2486.Pearson et al. Circulation 2002;106:388.
Diet modification and increased physical activity!
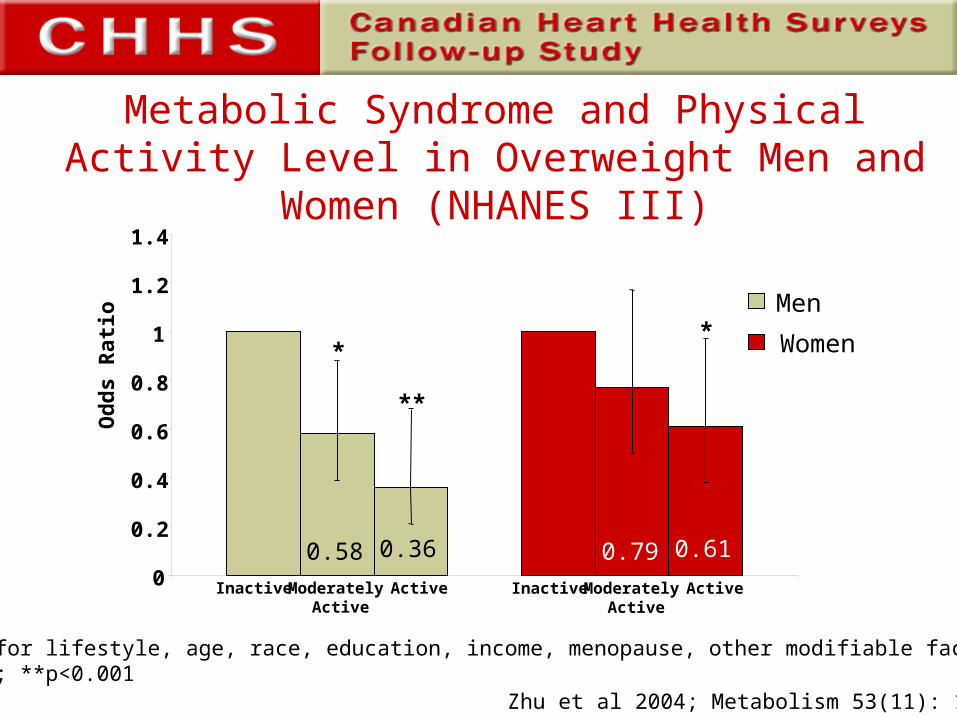
Metabolic Syndrome and Physical Activity Level in Overweight Men and Women (NHANES III)
Zhu et al 2004; Metabolism 53(11): 1503
0
0.2
0.4
0.6
0.8
1
1.2
1.4
Od
ds
Rat
io
Inactive Moderately Active
Active
**
Adjusted for lifestyle, age, race, education, income, menopause, other modifiable factors*p < 0.05; **p<0.001
**
Inactive Moderately Active
Active
Men
Women
0.360.58 0.610.79
Healthy Metabolic Syndrome
All
-cau
se d
eath
rat
e p
er 1
0 0
00 m
an-y
ears
Unfit
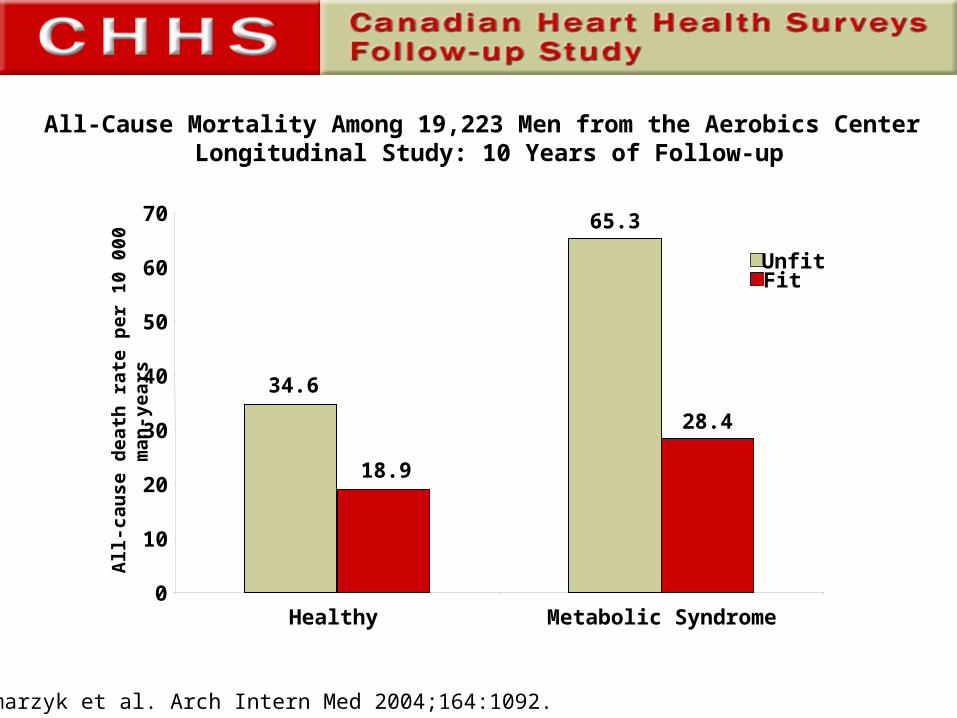
Katzmarzyk et al. Arch Intern Med 2004;164:1092.
All-Cause Mortality Among 19,223 Men from the Aerobics Center Longitudinal Study: 10 Years of Follow-up
34.6
65.3
Fit
18.9
28.4
0
10
20
30
40
50
60
70
Purpose
To determine the relationship between physical activity, metabolic syndrome and component
risk factors among Canadian adults.
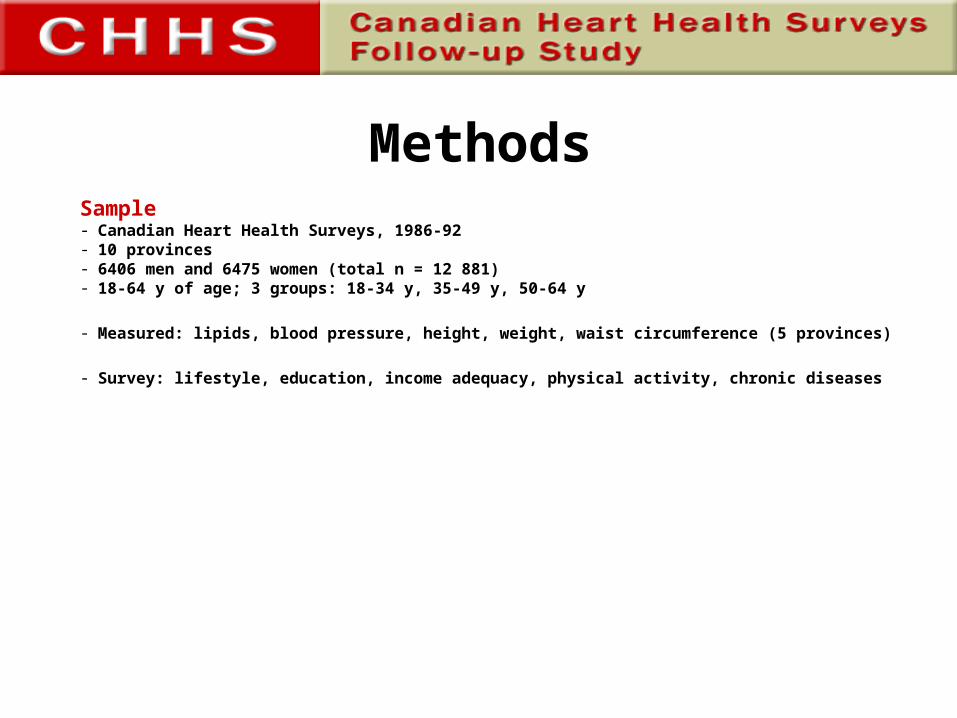
MethodsSample- Canadian Heart Health Surveys, 1986-92- 10 provinces- 6406 men and 6475 women (total n = 12 881)- 18-64 y of age; 3 groups: 18-34 y, 35-49 y, 50-64 y
- Measured: lipids, blood pressure, height, weight, waist circumference (5 provinces)
- Survey: lifestyle, education, income adequacy, physical activity, chronic diseases
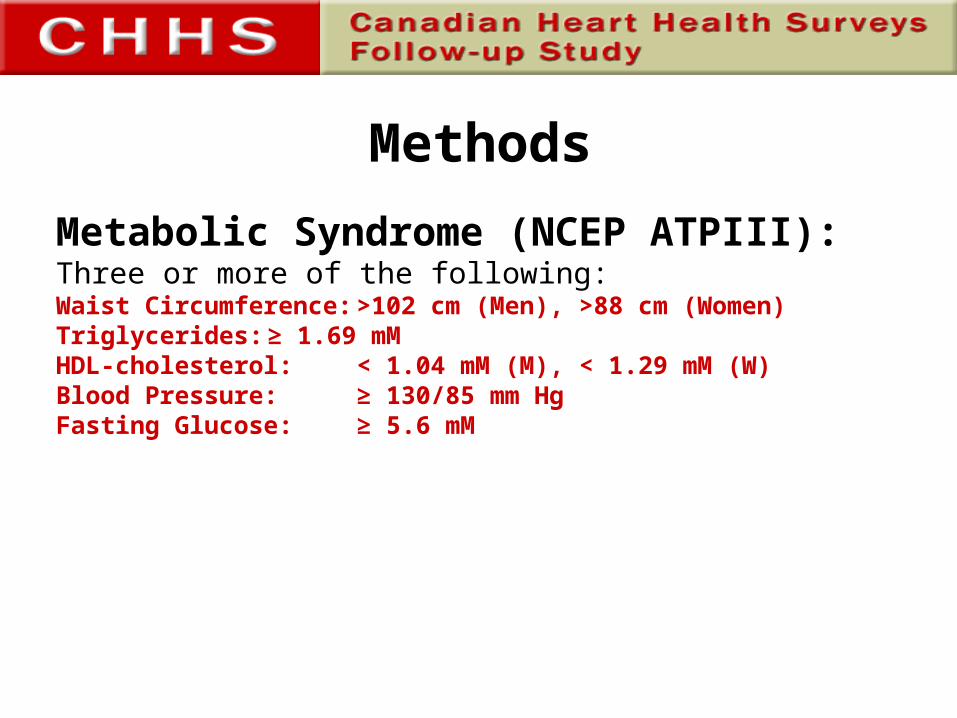
Methods
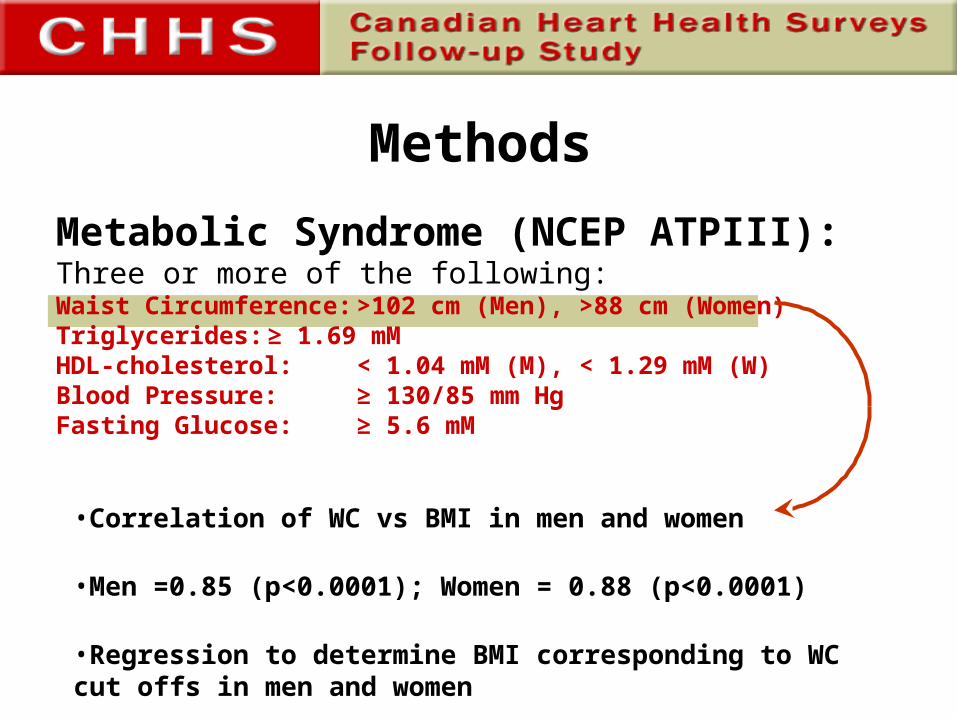
Metabolic Syndrome (NCEP ATPIII):Three or more of the following:Waist Circumference: >102 cm (Men), >88 cm (Women) Triglycerides: ≥ 1.69 mMHDL-cholesterol: < 1.04 mM (M), < 1.29 mM (W)Blood Pressure: ≥ 130/85 mm HgFasting Glucose: ≥ 5.6 mM
Methods
Metabolic Syndrome (NCEP ATPIII):Three or more of the following:Waist Circumference: >102 cm (Men), >88 cm (Women) Triglycerides: ≥ 1.69 mMHDL-cholesterol: < 1.04 mM (M), < 1.29 mM (W)Blood Pressure: ≥ 130/85 mm HgFasting Glucose: ≥ 5.6 mM
•Correlation of WC vs BMI in men and women
•Men =0.85 (p<0.0001); Women = 0.88 (p<0.0001)
•Regression to determine BMI corresponding to WC cut offs in men and women
Methods
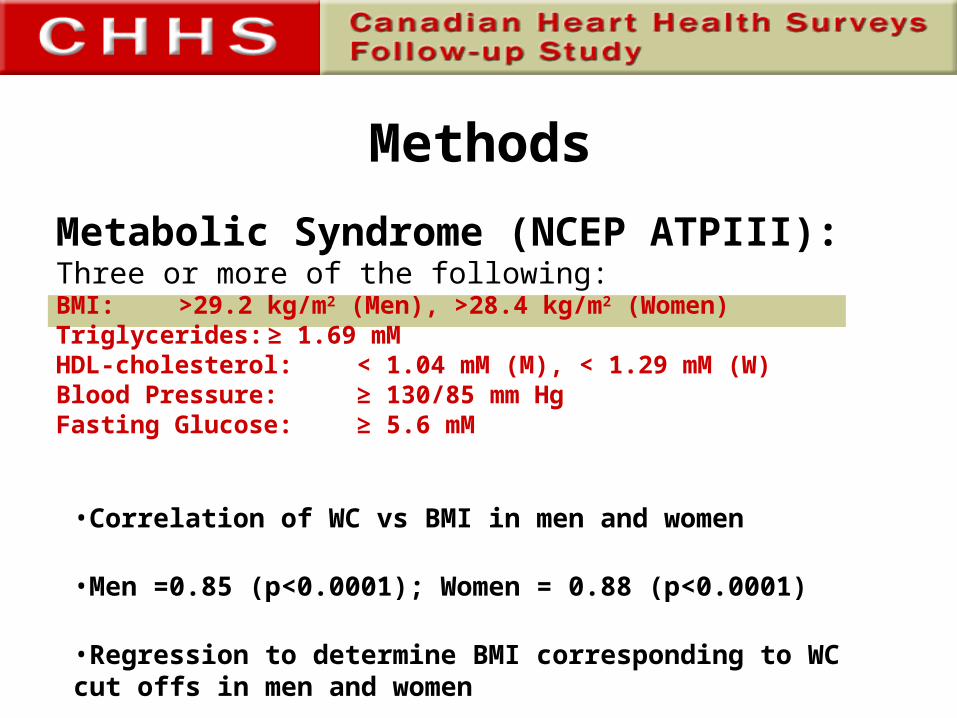
Metabolic Syndrome (NCEP ATPIII):Three or more of the following:BMI: >29.2 kg/m2 (Men), >28.4 kg/m2 (Women) Triglycerides: ≥ 1.69 mMHDL-cholesterol: < 1.04 mM (M), < 1.29 mM (W)Blood Pressure: ≥ 130/85 mm HgFasting Glucose: ≥ 5.6 mM
•Correlation of WC vs BMI in men and women
•Men =0.85 (p<0.0001); Women = 0.88 (p<0.0001)
•Regression to determine BMI corresponding to WC cut offs in men and women
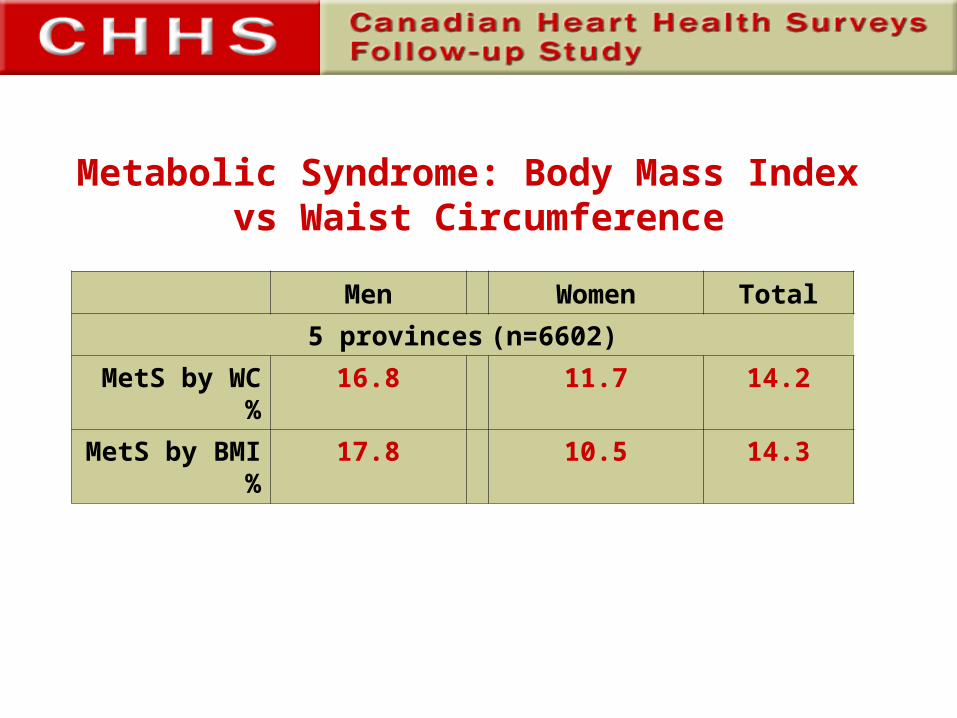
Metabolic Syndrome: Body Mass Index vs Waist Circumference
Men Women Total
5 provinces (n=6602)
MetS by WC % 16.8 11.7 14.2
MetS by BMI % 17.8 10.5 14.3
Methods
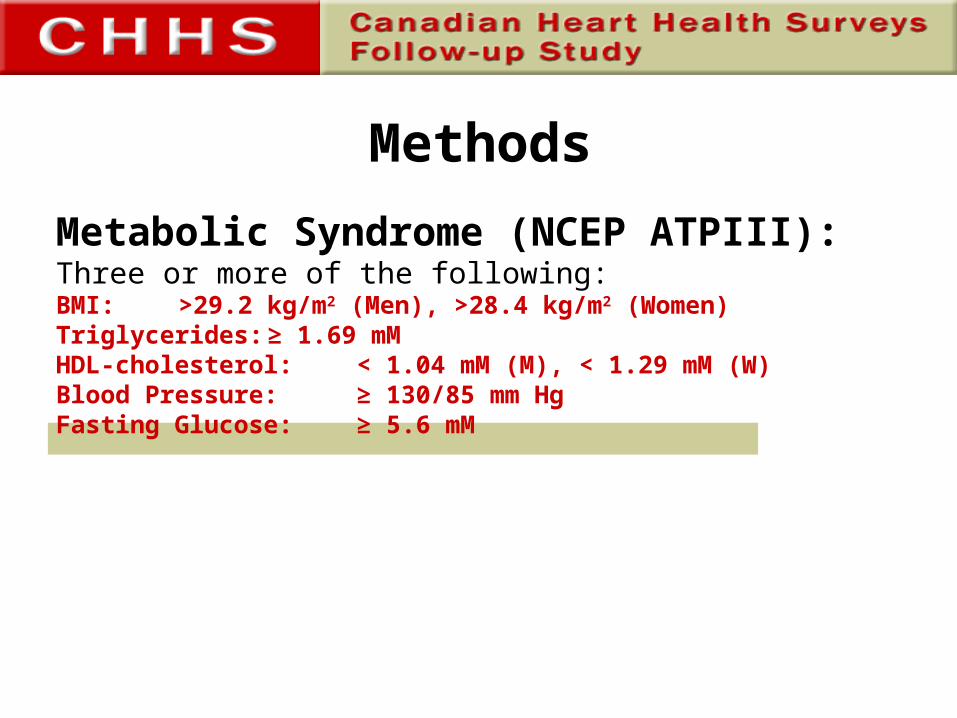
Metabolic Syndrome (NCEP ATPIII):Three or more of the following:BMI: >29.2 kg/m2 (Men), >28.4 kg/m2 (Women) Triglycerides: ≥ 1.69 mMHDL-cholesterol: < 1.04 mM (M), < 1.29 mM (W)Blood Pressure: ≥ 130/85 mm HgFasting Glucose: ≥ 5.6 mM
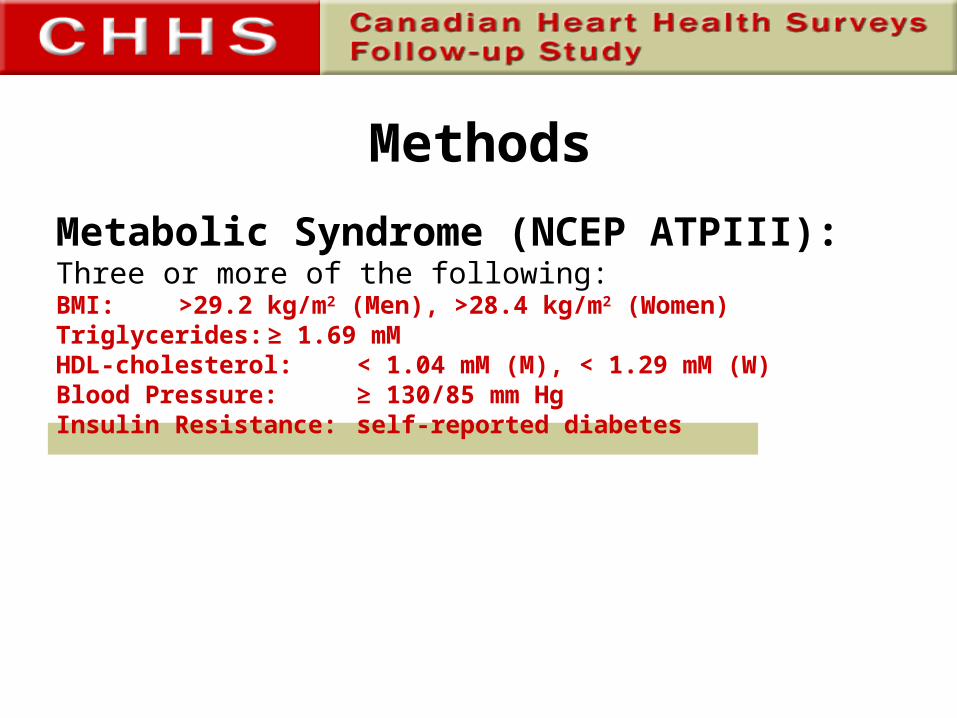
Methods
Metabolic Syndrome (NCEP ATPIII):Three or more of the following:BMI: >29.2 kg/m2 (Men), >28.4 kg/m2 (Women) Triglycerides: ≥ 1.69 mMHDL-cholesterol: < 1.04 mM (M), < 1.29 mM (W)Blood Pressure: ≥ 130/85 mm HgInsulin Resistance: self-reported diabetes
Methods
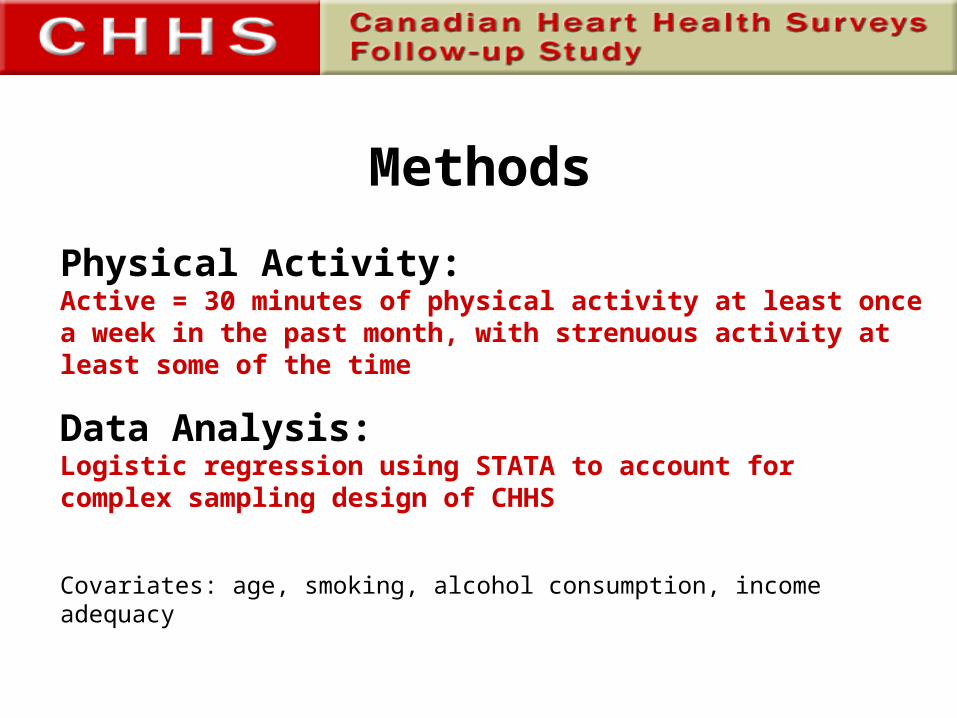
Physical Activity:Active = 30 minutes of physical activity at least once a week in the past month, with strenuous activity at least some of the time
Data Analysis:Logistic regression using STATA to account for complex sampling design of CHHS
Covariates: age, smoking, alcohol consumption, income adequacy
36.8
18-34
29.9
35-49
22.2
50-64
32.6
35-49
22.7
50-64
46.3
18-34 (n=12 881)totaltotal
Metabolic Syndrome (%)
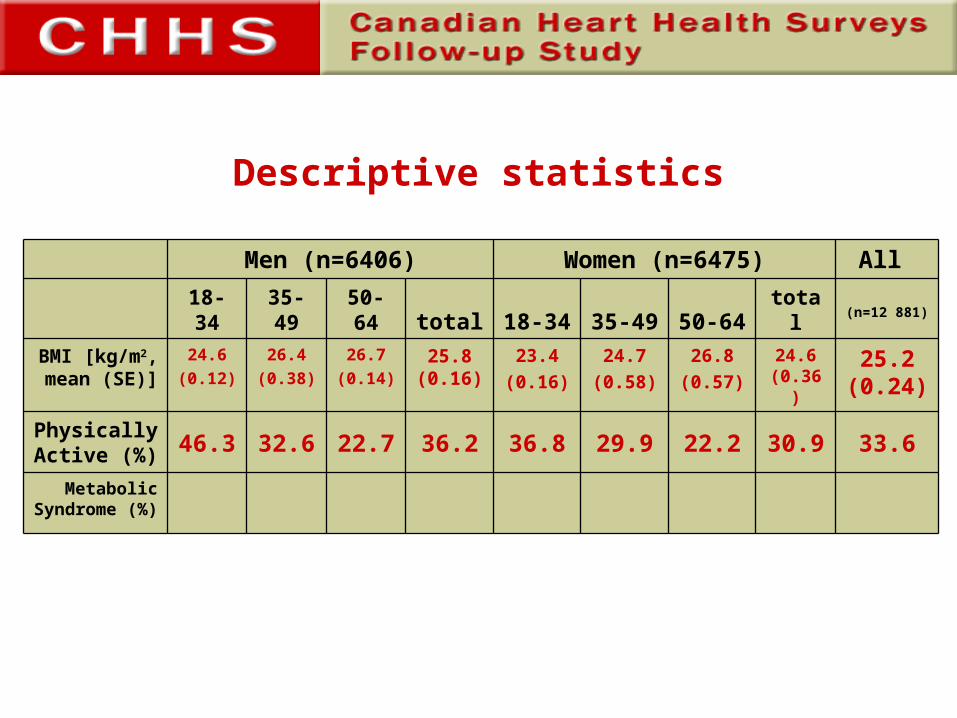
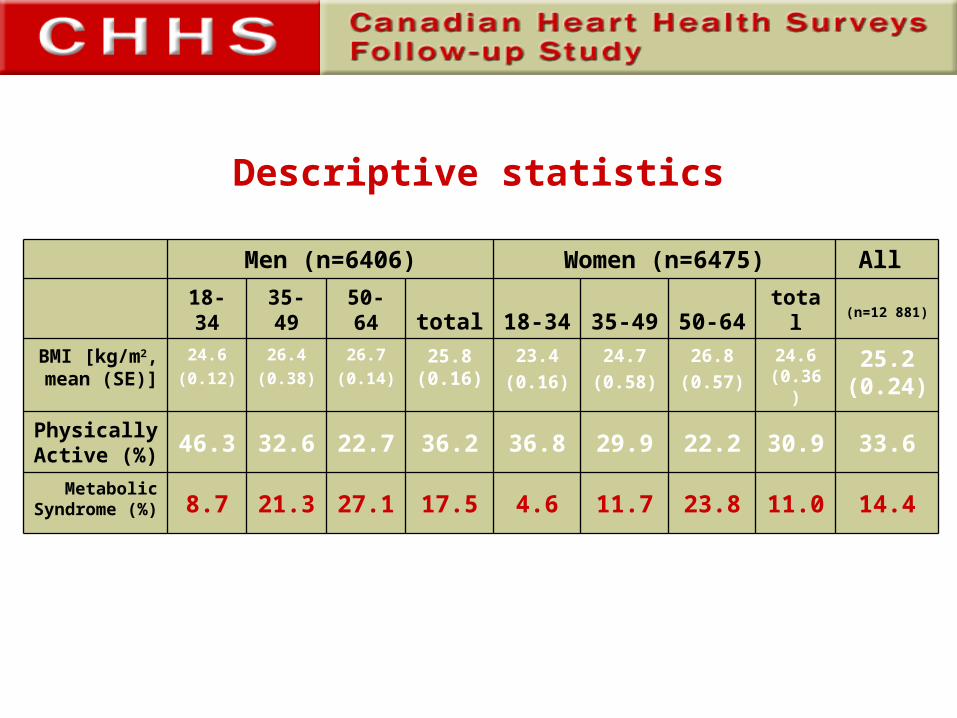
33.630.936.2Physically Active (%)
23.4
(0.16)
24.7
(0.58)
26.8
(0.57)
26.4
(0.38)
26.7
(0.14)
24.6
(0.12)
25.2 (0.24)
24.6 (0.36)
25.8 (0.16)
BMI [kg/m2, mean (SE)]
All Women (n=6475)Men (n=6406)
Descriptive statistics
4.6
36.8
18-34
11.7
29.9
35-49
23.8
22.2
50-64
21.3
32.6
35-49
27.1
22.7
50-64
8.7
46.3
18-34 (n=12 881)totaltotal
14.411.017.5Metabolic
Syndrome (%)
33.630.936.2Physically Active (%)
23.4
(0.16)
24.7
(0.58)
26.8
(0.57)
26.4
(0.38)
26.7
(0.14)
24.6
(0.12)
25.2 (0.24)
24.6 (0.36)
25.8 (0.16)
BMI [kg/m2, mean (SE)]
All Women (n=6475)Men (n=6406)
Descriptive statistics
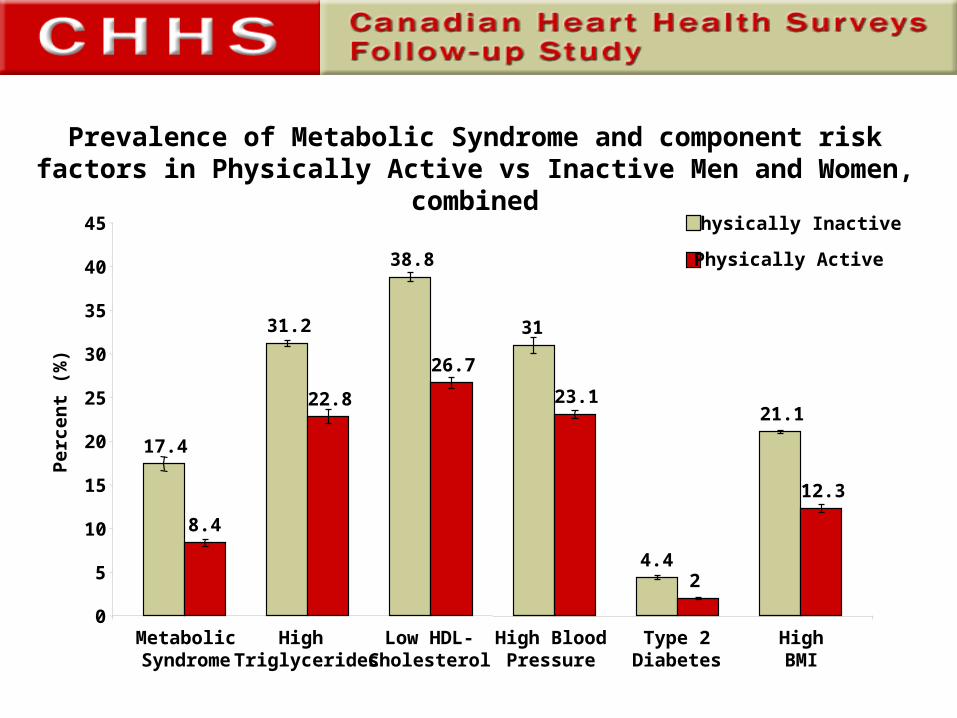
Prevalence of Metabolic Syndrome and component risk factors in Physically Active vs Inactive Men and Women, combined
17.4
8.4
31.2
22.8
38.8
26.7
31
23.1
4.42
21.1
12.3
0
5
10
15
20
25
30
35
40
45
Per
cen
t (%
)
MetabolicSyndrome
High Triglycerides
Low HDL-Cholesterol
High BloodPressure
Type 2Diabetes
HighBMI
Physically Inactive
Physically Active
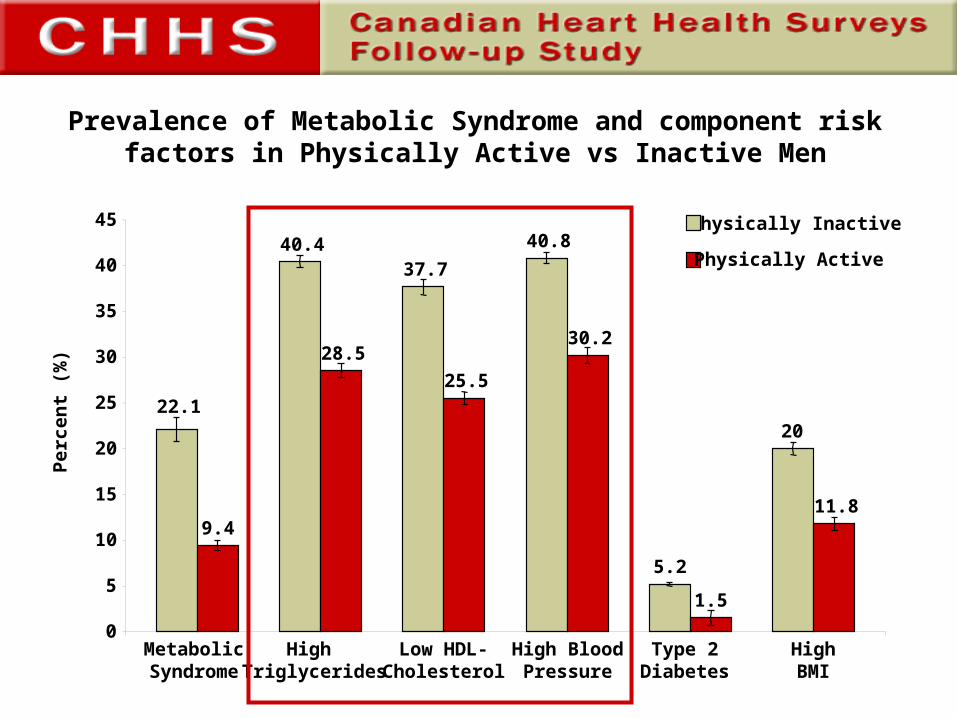
22.1
9.4
40.4
28.5
37.7
25.5
40.8
30.2
5.2
1.5
20
11.8
0
5
10
15
20
25
30
35
40
45
Prevalence of Metabolic Syndrome and component risk factors in Physically Active vs Inactive Men
MetabolicSyndrome
High Triglycerides
Low HDL-Cholesterol
High BloodPressure
Type 2Diabetes
HighBMI
Per
cen
t (%
)
Physically Inactive
Physically Active
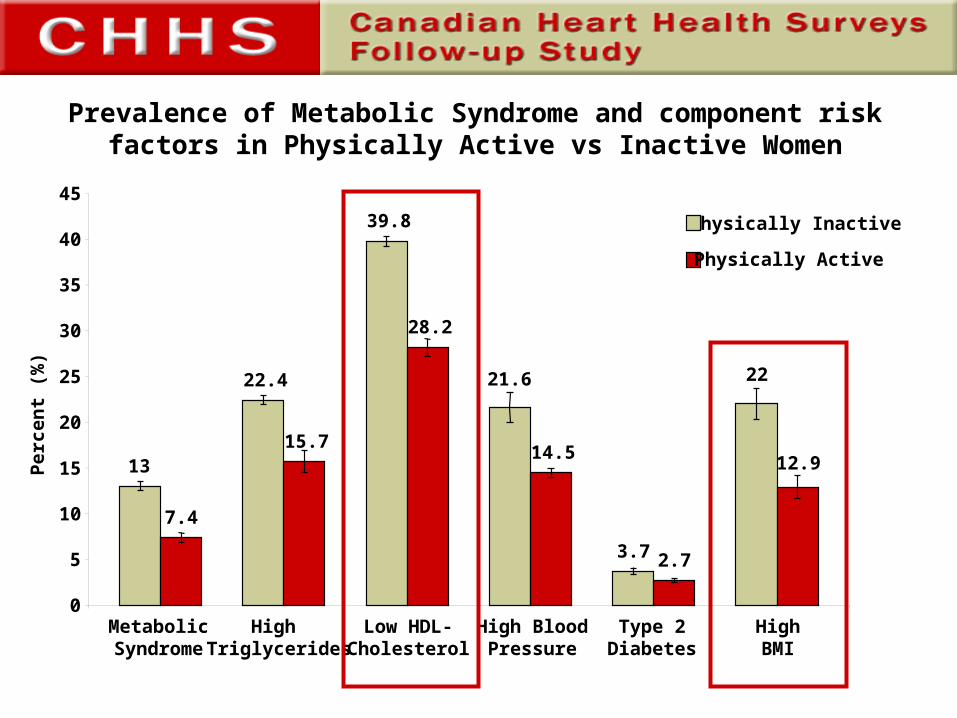
13
7.4
22.4
15.7
39.8
28.2
21.6
14.5
3.7 2.7
22
12.9
0
5
10
15
20
25
30
35
40
45
Prevalence of Metabolic Syndrome and component risk factors in Physically Active vs Inactive Women
MetabolicSyndrome
High Triglycerides
Low HDL-Cholesterol
High BloodPressure
Type 2Diabetes
HighBMI
Per
cen
t (%
)
Physically Inactive
Physically Active
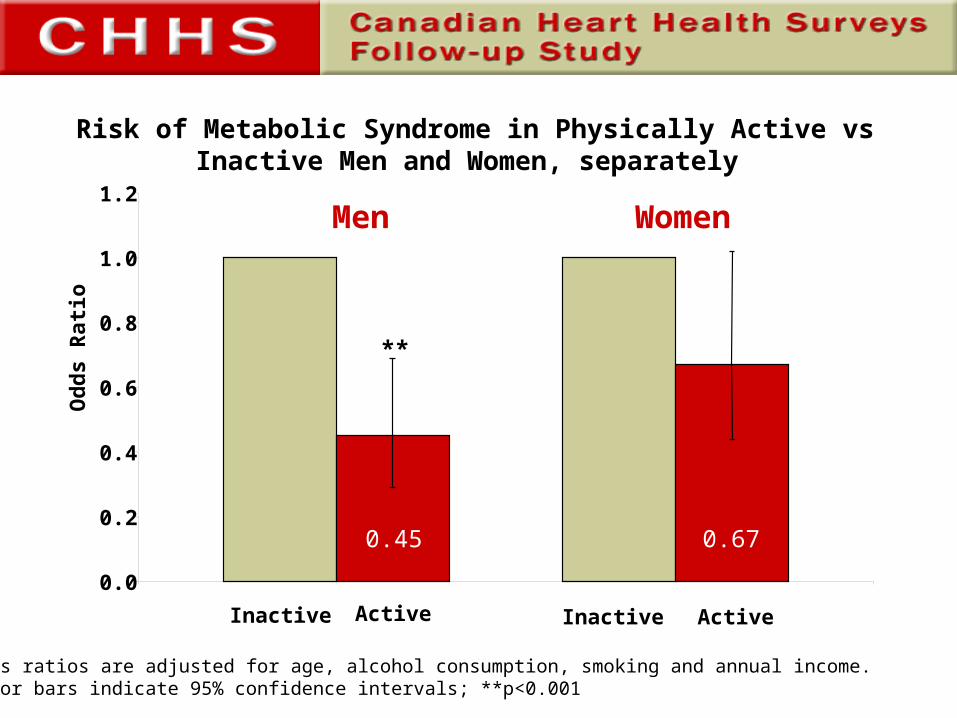
Men Women
Odds ratios are adjusted for age, alcohol consumption, smoking and annual income.Error bars indicate 95% confidence intervals; **p<0.001
Inactive Inactive
Risk of Metabolic Syndrome in Physically Active vs Inactive Men and Women, separately
0.0
0.2
0.4
0.6
0.8
1.0
1.2
Od
ds
Rat
io
Active
**
0.45
Active
0.67
Odds ratios are adjusted for alcohol consumption, smoking and annual income.Error bars indicate 95% confidence intervals; **p<0.001; *p<0.05
Inactive Active
18-34 y 35-49 y 50-64 y
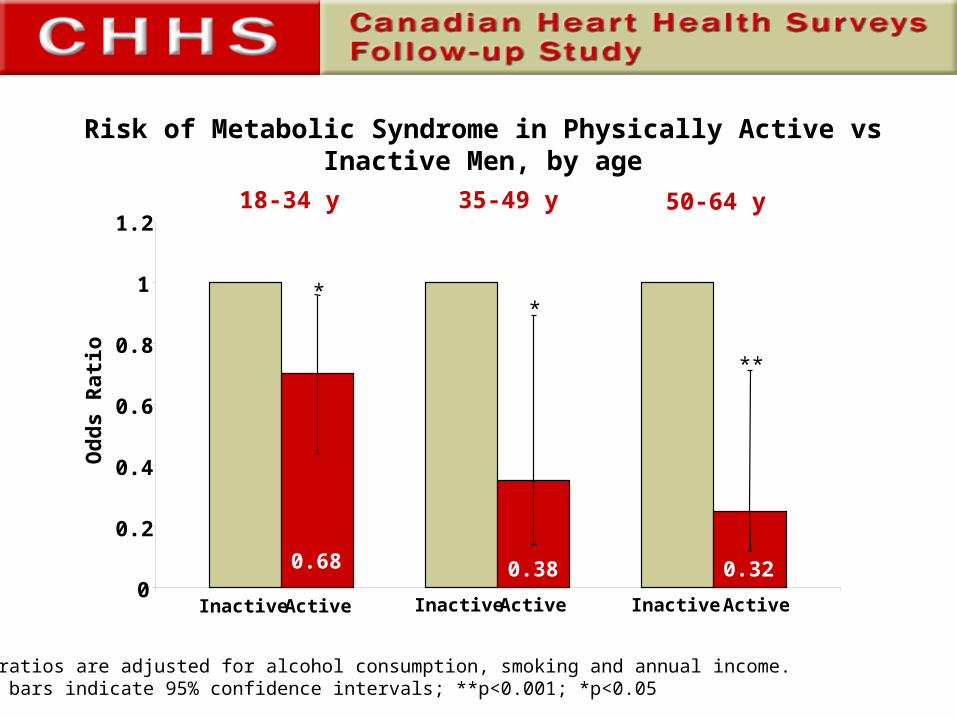
Risk of Metabolic Syndrome in Physically Active vs Inactive Men, by age
0
0.2
0.4
0.6
0.8
1
1.2
Od
ds
Rat
io
Inactive Active Inactive Active
**
0.320.38
*
0.68
*
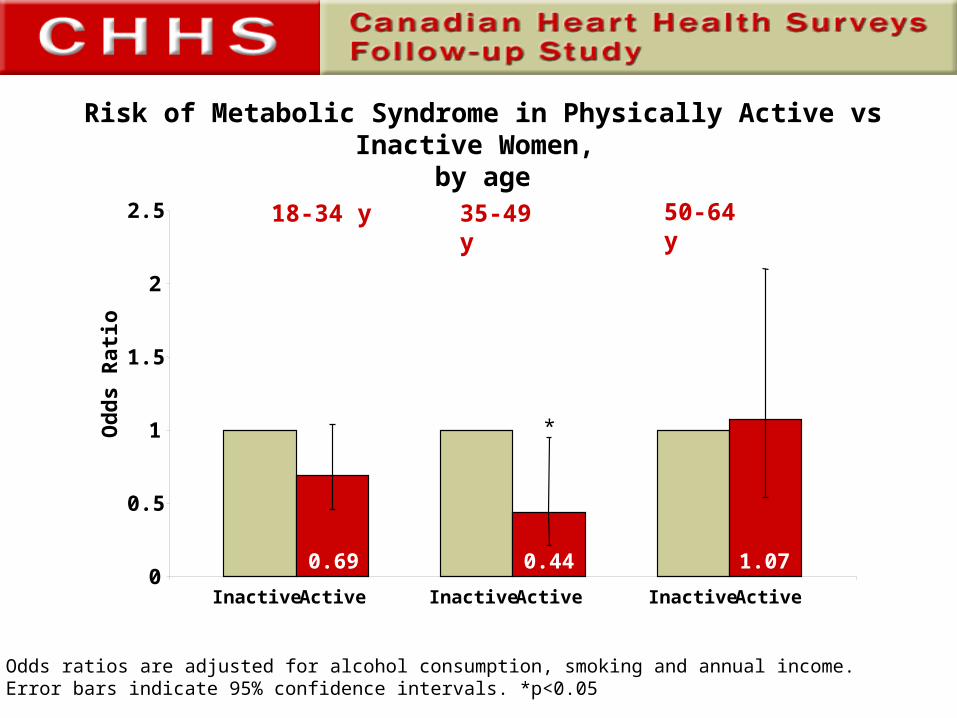
Odds ratios are adjusted for alcohol consumption, smoking and annual income.Error bars indicate 95% confidence intervals. *p<0.05
Inactive Inactive InactiveActive Active Active
18-34 y 35-49 y 50-64 y
0
0.5
1
1.5
2
2.5
Od
ds
Rat
io
0.69
*
0.44 1.07
Risk of Metabolic Syndrome in Physically Active vs Inactive Women, by age
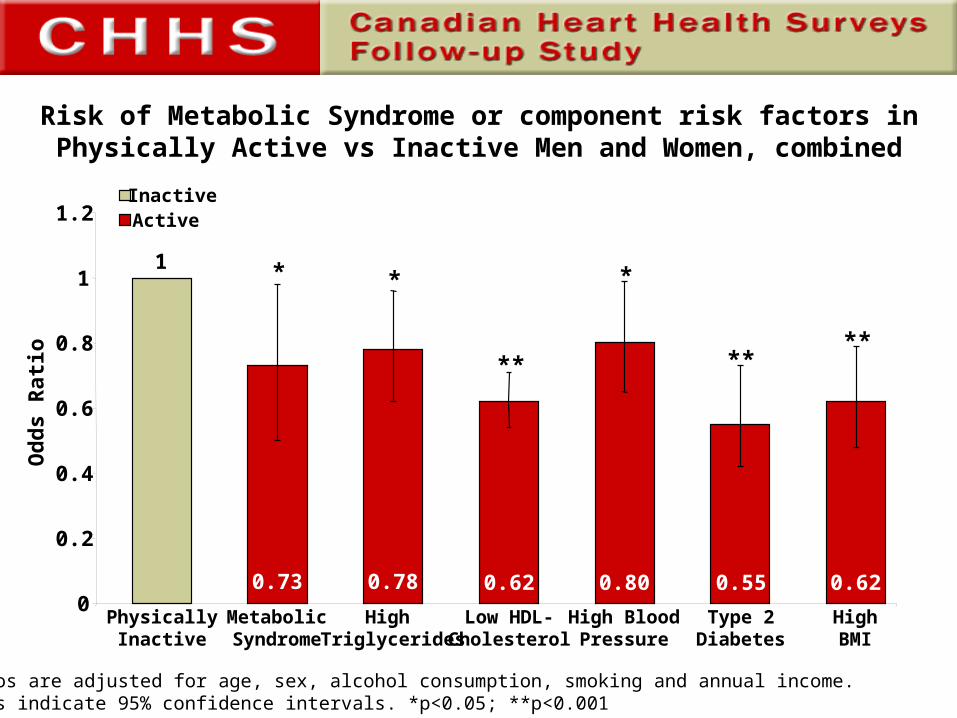
Risk of Metabolic Syndrome or component risk factors in Physically Active vs Inactive Men and Women, combined
1
0.73 0.78 0.62 0.80 0.55 0.620
0.2
0.4
0.6
0.8
1
1.2
MetabolicSyndrome
Od
ds
Rat
io
High Triglycerides
Low HDL-Cholesterol
High BloodPressure
Type 2Diabetes
PhysicallyInactive
HighBMI
*
**
**
****
Odds ratios are adjusted for age, sex, alcohol consumption, smoking and annual income.Error bars indicate 95% confidence intervals. *p<0.05; **p<0.001
InactiveActive
0.2
0.4
0.6
0.8
1.0
1.2
1.4
1.6
1.8
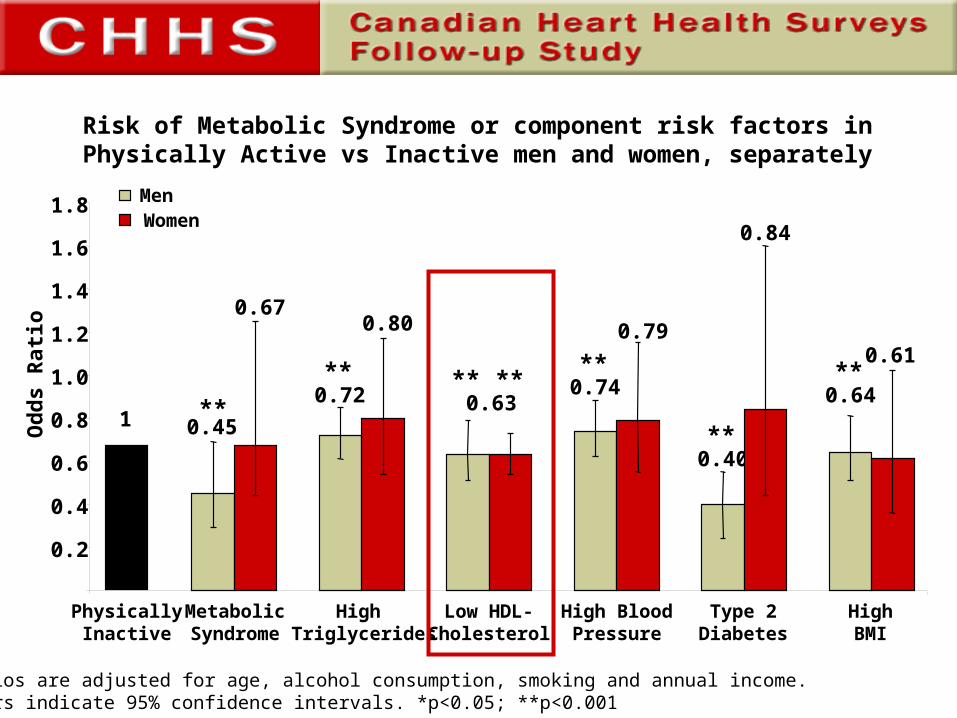
Risk of Metabolic Syndrome or component risk factors in Physically Active vs Inactive men and women, separately
MetabolicSyndrome
High Triglycerides
Low HDL-Cholesterol
High BloodPressure
Type 2Diabetes
PhysicallyInactive
HighBMI
Od
ds
Rat
io
1 0.45
0.72
0.40
0.640.740.63
0.80 0.790.67
0.84
0.61**
**
** ****
**
**
MenWomen
Odds ratios are adjusted for age, alcohol consumption, smoking and annual income.Error bars indicate 95% confidence intervals. *p<0.05; **p<0.001
Conclusions
• Physical activity is associated with lower risk of Metabolic Syndrome and risk factors
• Stronger relationship in men than women
• Further research is necessary to determine the effectiveness of physical activity in the treatment of the metabolic syndrome.
The Canadian Heart Health Surveys Follow-up Study is a New Emerging
Team, funded by the Canadian Institutes for Health Research and the Heart and
Stroke Foundation of Canada
www.chhsnet.ca


![Metabolic Syndrome[1]](https://img.pdfslide.net/doc/110x75/577cd7141a28ab9e789dffc3/metabolic-syndrome1.jpg)