Embed Size (px)
Citation preview

See discussions, stats, and author profiles for this publication at: https://www.researchgate.net/publication/273758009
Physical Modeling on Ground Responses to Tunneling in Sand Considering
the Existence of HDPE Pipes
Article in Geotechnical Testing Journal · October 2014
DOI: 10.1520/GTJ20140031
CITATIONS
7
READS
418
3 authors:
Some of the authors of this publication are also working on these related projects:
Sustainable Geomaterials for Geotechnical and Geoenvironmental Applications View project
Solidification/stabilization of clayey soils contaminated with multiple heavy metals using innovative binder View project
Fei Wang
RTE Technologies, Inc.
95 PUBLICATIONS 281 CITATIONS
SEE PROFILE
Yan Jun Du
Southeast University (China)
211 PUBLICATIONS 2,155 CITATIONS
SEE PROFILE
Xiaoming Yang
Oklahoma State University - Stillwater
15 PUBLICATIONS 240 CITATIONS
SEE PROFILE
All content following this page was uploaded by Yan Jun Du on 20 March 2015.
The user has requested enhancement of the downloaded file.
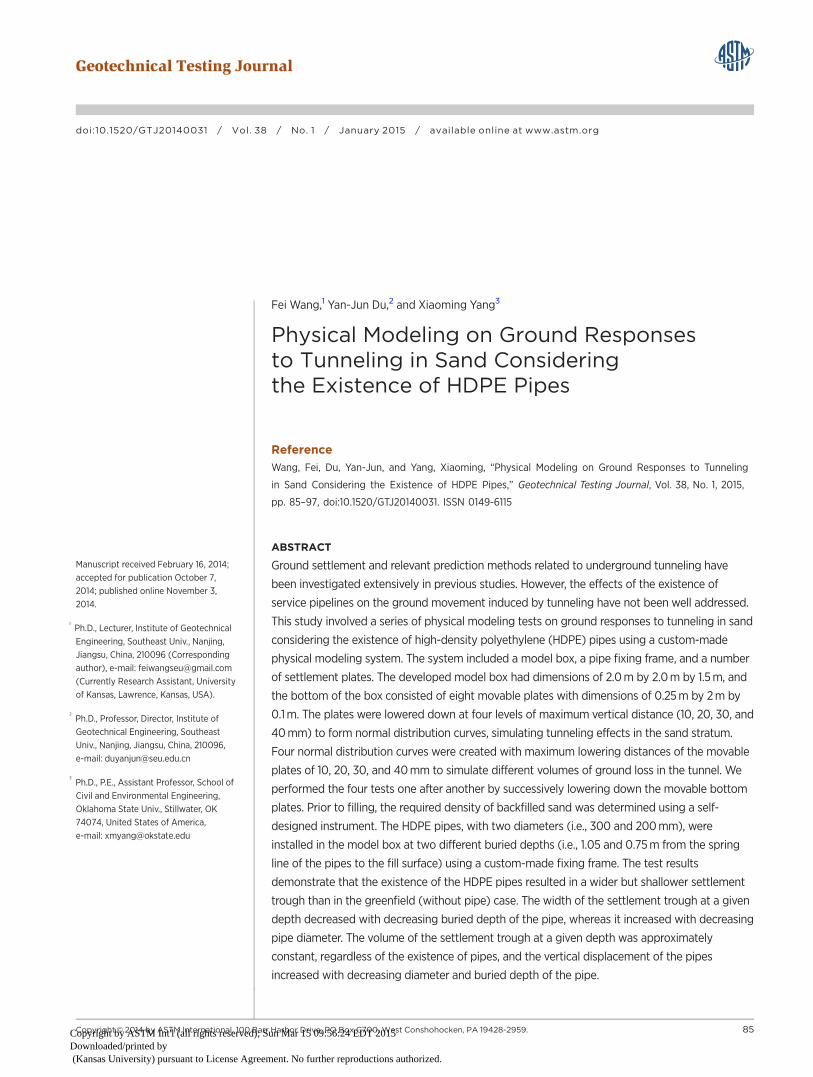
Fei Wang,1 Yan-Jun Du,2 and Xiaoming Yang3
Physical Modeling on Ground Responsesto Tunneling in Sand Consideringthe Existence of HDPE Pipes
Reference
Wang, Fei, Du, Yan-Jun, and Yang, Xiaoming, “Physical Modeling on Ground Responses to Tunneling
in Sand Considering the Existence of HDPE Pipes,” Geotechnical Testing Journal, Vol. 38, No. 1, 2015,
pp. 85–97, doi:10.1520/GTJ20140031. ISSN 0149-6115
ABSTRACT
Ground settlement and relevant prediction methods related to underground tunneling have
been investigated extensively in previous studies. However, the effects of the existence of
service pipelines on the ground movement induced by tunneling have not been well addressed.
This study involved a series of physical modeling tests on ground responses to tunneling in sand
considering the existence of high-density polyethylene (HDPE) pipes using a custom-made
physical modeling system. The system included a model box, a pipe fixing frame, and a number
of settlement plates. The developed model box had dimensions of 2.0 m by 2.0 m by 1.5 m, and
the bottom of the box consisted of eight movable plates with dimensions of 0.25 m by 2 m by
0.1 m. The plates were lowered down at four levels of maximum vertical distance (10, 20, 30, and
40 mm) to form normal distribution curves, simulating tunneling effects in the sand stratum.
Four normal distribution curves were created with maximum lowering distances of the movable
plates of 10, 20, 30, and 40 mm to simulate different volumes of ground loss in the tunnel. We
performed the four tests one after another by successively lowering down the movable bottom
plates. Prior to filling, the required density of backfilled sand was determined using a self-
designed instrument. The HDPE pipes, with two diameters (i.e., 300 and 200 mm), were
installed in the model box at two different buried depths (i.e., 1.05 and 0.75 m from the spring
line of the pipes to the fill surface) using a custom-made fixing frame. The test results
demonstrate that the existence of the HDPE pipes resulted in a wider but shallower settlement
trough than in the greenfield (without pipe) case. The width of the settlement trough at a given
depth decreased with decreasing buried depth of the pipe, whereas it increased with decreasing
pipe diameter. The volume of the settlement trough at a given depth was approximately
constant, regardless of the existence of pipes, and the vertical displacement of the pipes
increased with decreasing diameter and buried depth of the pipe.
Manuscript received February 16, 2014;
accepted for publication October 7,
2014; published online November 3,
2014.
1
Ph.D., Lecturer, Institute of Geotechnical
Engineering, Southeast Univ., Nanjing,
Jiangsu, China, 210096 (Corresponding
author), e-mail: [email protected]
(Currently Research Assistant, University
of Kansas, Lawrence, Kansas, USA).
2
Ph.D., Professor, Director, Institute of
Geotechnical Engineering, Southeast
Univ., Nanjing, Jiangsu, China, 210096,
e-mail: [email protected]
3
Ph.D., P.E., Assistant Professor, School of
Civil and Environmental Engineering,
Oklahoma State Univ., Stillwater, OK
74074, United States of America,
e-mail: [email protected]
Copyright VC 2014 by ASTM International, 100 Barr Harbor Drive, PO Box C700, West Conshohocken, PA 19428-2959. 85
Geotechnical Testing Journal
doi:10.1520/GTJ20140031 / Vol. 38 / No. 1 / January 2015 / available online at www.astm.org
Copyright by ASTM Int'l (all rights reserved); Sun Mar 15 09:56:24 EDT 2015Downloaded/printed by (Kansas University) pursuant to License Agreement. No further reproductions authorized.
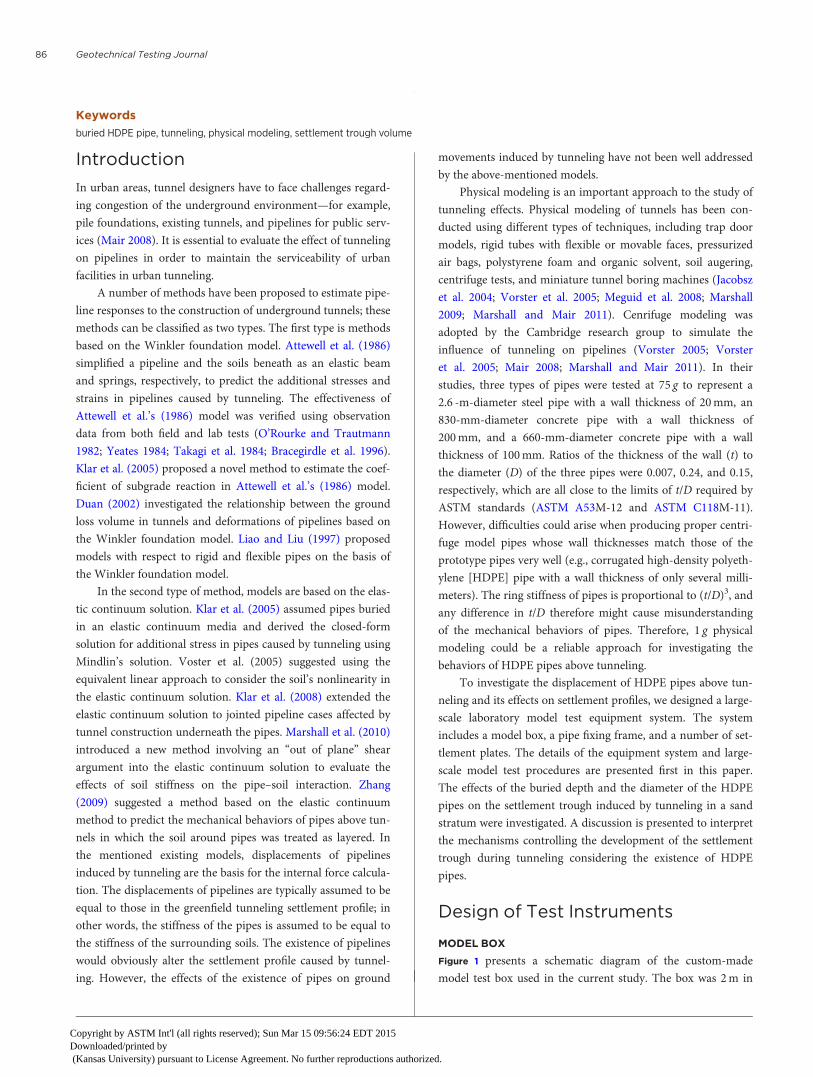
Keywords
buried HDPE pipe, tunneling, physical modeling, settlement trough volume
Introduction
In urban areas, tunnel designers have to face challenges regard-
ing congestion of the underground environment—for example,
pile foundations, existing tunnels, and pipelines for public serv-
ices (Mair 2008). It is essential to evaluate the effect of tunneling
on pipelines in order to maintain the serviceability of urban
facilities in urban tunneling.
A number of methods have been proposed to estimate pipe-
line responses to the construction of underground tunnels; these
methods can be classified as two types. The first type is methods
based on the Winkler foundation model. Attewell et al. (1986)
simplified a pipeline and the soils beneath as an elastic beam
and springs, respectively, to predict the additional stresses and
strains in pipelines caused by tunneling. The effectiveness of
Attewell et al.’s (1986) model was verified using observation
data from both field and lab tests (O’Rourke and Trautmann
1982; Yeates 1984; Takagi et al. 1984; Bracegirdle et al. 1996).
Klar et al. (2005) proposed a novel method to estimate the coef-
ficient of subgrade reaction in Attewell et al.’s (1986) model.
Duan (2002) investigated the relationship between the ground
loss volume in tunnels and deformations of pipelines based on
the Winkler foundation model. Liao and Liu (1997) proposed
models with respect to rigid and flexible pipes on the basis of
the Winkler foundation model.
In the second type of method, models are based on the elas-
tic continuum solution. Klar et al. (2005) assumed pipes buried
in an elastic continuum media and derived the closed-form
solution for additional stress in pipes caused by tunneling using
Mindlin’s solution. Voster et al. (2005) suggested using the
equivalent linear approach to consider the soil’s nonlinearity in
the elastic continuum solution. Klar et al. (2008) extended the
elastic continuum solution to jointed pipeline cases affected by
tunnel construction underneath the pipes. Marshall et al. (2010)
introduced a new method involving an “out of plane” shear
argument into the elastic continuum solution to evaluate the
effects of soil stiffness on the pipe–soil interaction. Zhang
(2009) suggested a method based on the elastic continuum
method to predict the mechanical behaviors of pipes above tun-
nels in which the soil around pipes was treated as layered. In
the mentioned existing models, displacements of pipelines
induced by tunneling are the basis for the internal force calcula-
tion. The displacements of pipelines are typically assumed to be
equal to those in the greenfield tunneling settlement profile; in
other words, the stiffness of the pipes is assumed to be equal to
the stiffness of the surrounding soils. The existence of pipelines
would obviously alter the settlement profile caused by tunnel-
ing. However, the effects of the existence of pipes on ground
movements induced by tunneling have not been well addressed
by the above-mentioned models.
Physical modeling is an important approach to the study of
tunneling effects. Physical modeling of tunnels has been con-
ducted using different types of techniques, including trap door
models, rigid tubes with flexible or movable faces, pressurized
air bags, polystyrene foam and organic solvent, soil augering,
centrifuge tests, and miniature tunnel boring machines (Jacobsz
et al. 2004; Vorster et al. 2005; Meguid et al. 2008; Marshall
2009; Marshall and Mair 2011). Cenrifuge modeling was
adopted by the Cambridge research group to simulate the
influence of tunneling on pipelines (Vorster 2005; Vorster
et al. 2005; Mair 2008; Marshall and Mair 2011). In their
studies, three types of pipes were tested at 75 g to represent a
2.6 -m-diameter steel pipe with a wall thickness of 20mm, an
830-mm-diameter concrete pipe with a wall thickness of
200mm, and a 660-mm-diameter concrete pipe with a wall
thickness of 100mm. Ratios of the thickness of the wall (t) to
the diameter (D) of the three pipes were 0.007, 0.24, and 0.15,
respectively, which are all close to the limits of t/D required by
ASTM standards (ASTM A53M-12 and ASTM C118M-11).
However, difficulties could arise when producing proper centri-
fuge model pipes whose wall thicknesses match those of the
prototype pipes very well (e.g., corrugated high-density polyeth-
ylene [HDPE] pipe with a wall thickness of only several milli-
meters). The ring stiffness of pipes is proportional to (t/D)3, and
any difference in t/D therefore might cause misunderstanding
of the mechanical behaviors of pipes. Therefore, 1 g physical
modeling could be a reliable approach for investigating the
behaviors of HDPE pipes above tunneling.
To investigate the displacement of HDPE pipes above tun-
neling and its effects on settlement profiles, we designed a large-
scale laboratory model test equipment system. The system
includes a model box, a pipe fixing frame, and a number of set-
tlement plates. The details of the equipment system and large-
scale model test procedures are presented first in this paper.
The effects of the buried depth and the diameter of the HDPE
pipes on the settlement trough induced by tunneling in a sand
stratum were investigated. A discussion is presented to interpret
the mechanisms controlling the development of the settlement
trough during tunneling considering the existence of HDPE
pipes.
Design of Test Instruments
MODEL BOX
Figure 1 presents a schematic diagram of the custom-made
model test box used in the current study. The box was 2m in
Geotechnical Testing Journal86
Copyright by ASTM Int'l (all rights reserved); Sun Mar 15 09:56:24 EDT 2015Downloaded/printed by (Kansas University) pursuant to License Agreement. No further reproductions authorized.
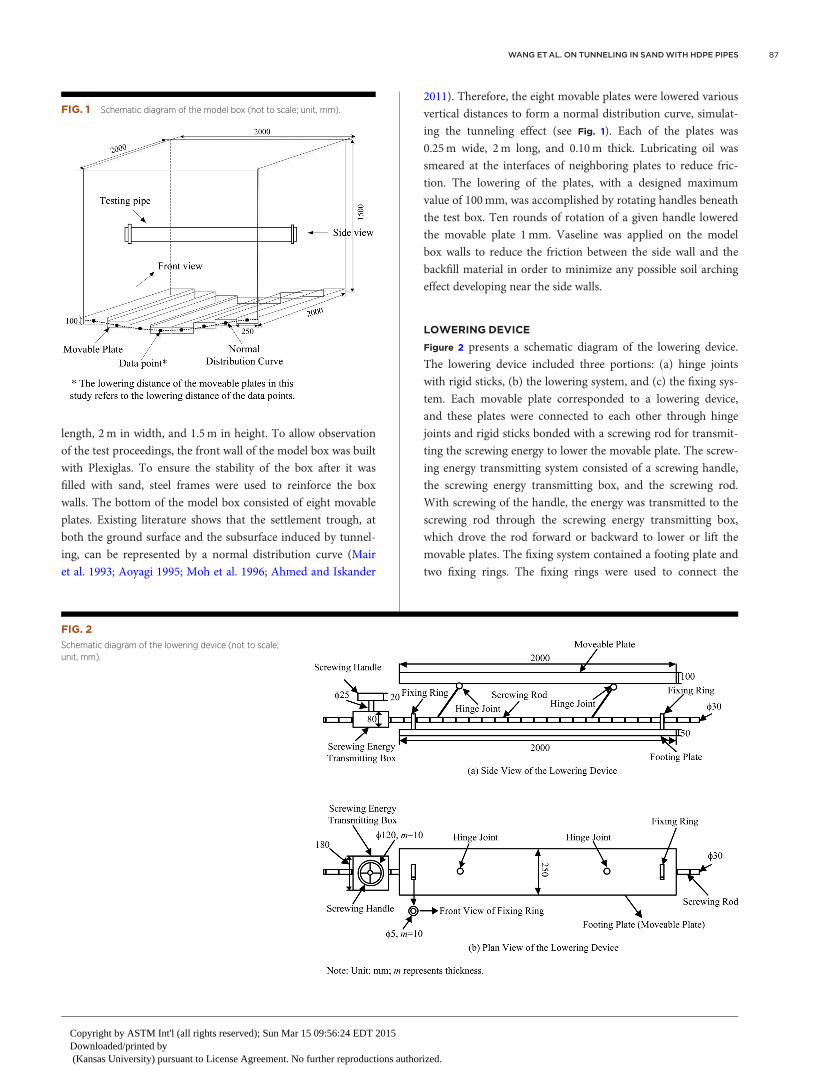
length, 2m in width, and 1.5m in height. To allow observation
of the test proceedings, the front wall of the model box was built
with Plexiglas. To ensure the stability of the box after it was
filled with sand, steel frames were used to reinforce the box
walls. The bottom of the model box consisted of eight movable
plates. Existing literature shows that the settlement trough, at
both the ground surface and the subsurface induced by tunnel-
ing, can be represented by a normal distribution curve (Mair
et al. 1993; Aoyagi 1995; Moh et al. 1996; Ahmed and Iskander
2011). Therefore, the eight movable plates were lowered various
vertical distances to form a normal distribution curve, simulat-
ing the tunneling effect (see Fig. 1). Each of the plates was
0.25m wide, 2m long, and 0.10m thick. Lubricating oil was
smeared at the interfaces of neighboring plates to reduce fric-
tion. The lowering of the plates, with a designed maximum
value of 100mm, was accomplished by rotating handles beneath
the test box. Ten rounds of rotation of a given handle lowered
the movable plate 1mm. Vaseline was applied on the model
box walls to reduce the friction between the side wall and the
backfill material in order to minimize any possible soil arching
effect developing near the side walls.
LOWERING DEVICE
Figure 2 presents a schematic diagram of the lowering device.
The lowering device included three portions: (a) hinge joints
with rigid sticks, (b) the lowering system, and (c) the fixing sys-
tem. Each movable plate corresponded to a lowering device,
and these plates were connected to each other through hinge
joints and rigid sticks bonded with a screwing rod for transmit-
ting the screwing energy to lower the movable plate. The screw-
ing energy transmitting system consisted of a screwing handle,
the screwing energy transmitting box, and the screwing rod.
With screwing of the handle, the energy was transmitted to the
screwing rod through the screwing energy transmitting box,
which drove the rod forward or backward to lower or lift the
movable plates. The fixing system contained a footing plate and
two fixing rings. The fixing rings were used to connect the
FIG. 1 Schematic diagram of the model box (not to scale; unit, mm).
FIG. 2
Schematic diagram of the lowering device (not to scale;
unit, mm).
WANG ET AL. ON TUNNELING IN SAND WITH HDPE PIPES 87
Copyright by ASTM Int'l (all rights reserved); Sun Mar 15 09:56:24 EDT 2015Downloaded/printed by (Kansas University) pursuant to License Agreement. No further reproductions authorized.
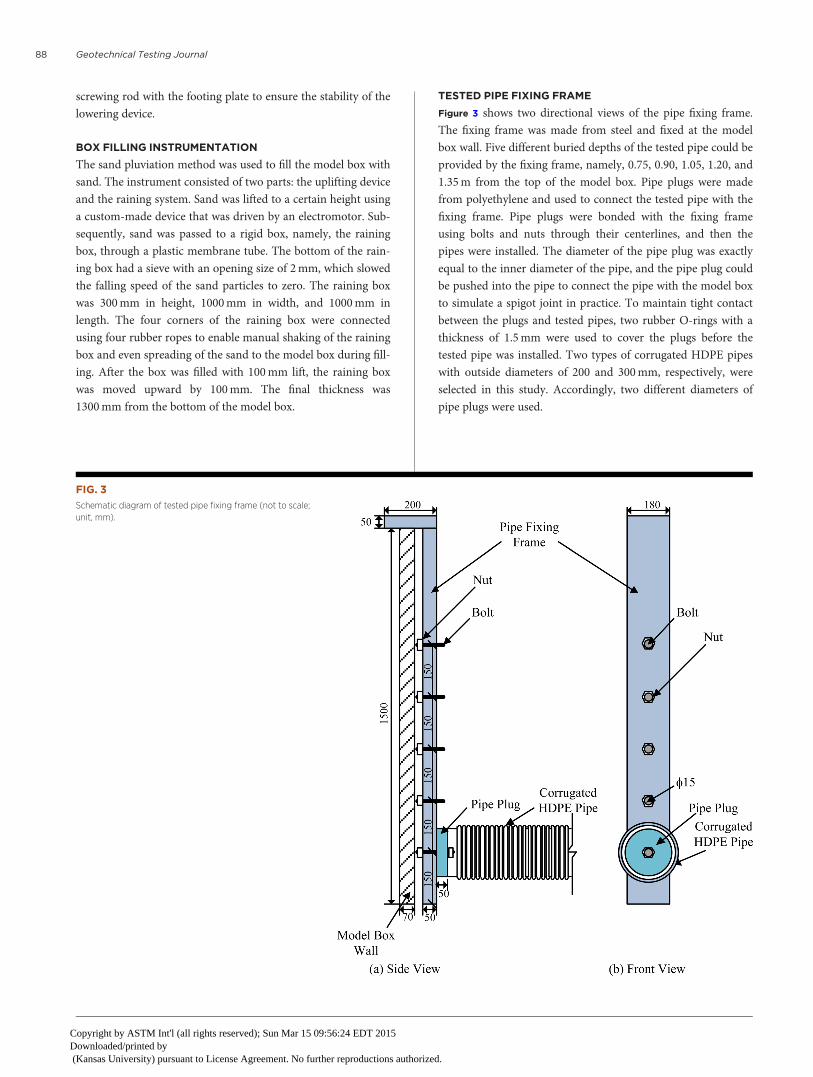
screwing rod with the footing plate to ensure the stability of the
lowering device.
BOX FILLING INSTRUMENTATION
The sand pluviation method was used to fill the model box with
sand. The instrument consisted of two parts: the uplifting device
and the raining system. Sand was lifted to a certain height using
a custom-made device that was driven by an electromotor. Sub-
sequently, sand was passed to a rigid box, namely, the raining
box, through a plastic membrane tube. The bottom of the rain-
ing box had a sieve with an opening size of 2mm, which slowed
the falling speed of the sand particles to zero. The raining box
was 300mm in height, 1000mm in width, and 1000mm in
length. The four corners of the raining box were connected
using four rubber ropes to enable manual shaking of the raining
box and even spreading of the sand to the model box during fill-
ing. After the box was filled with 100mm lift, the raining box
was moved upward by 100mm. The final thickness was
1300mm from the bottom of the model box.
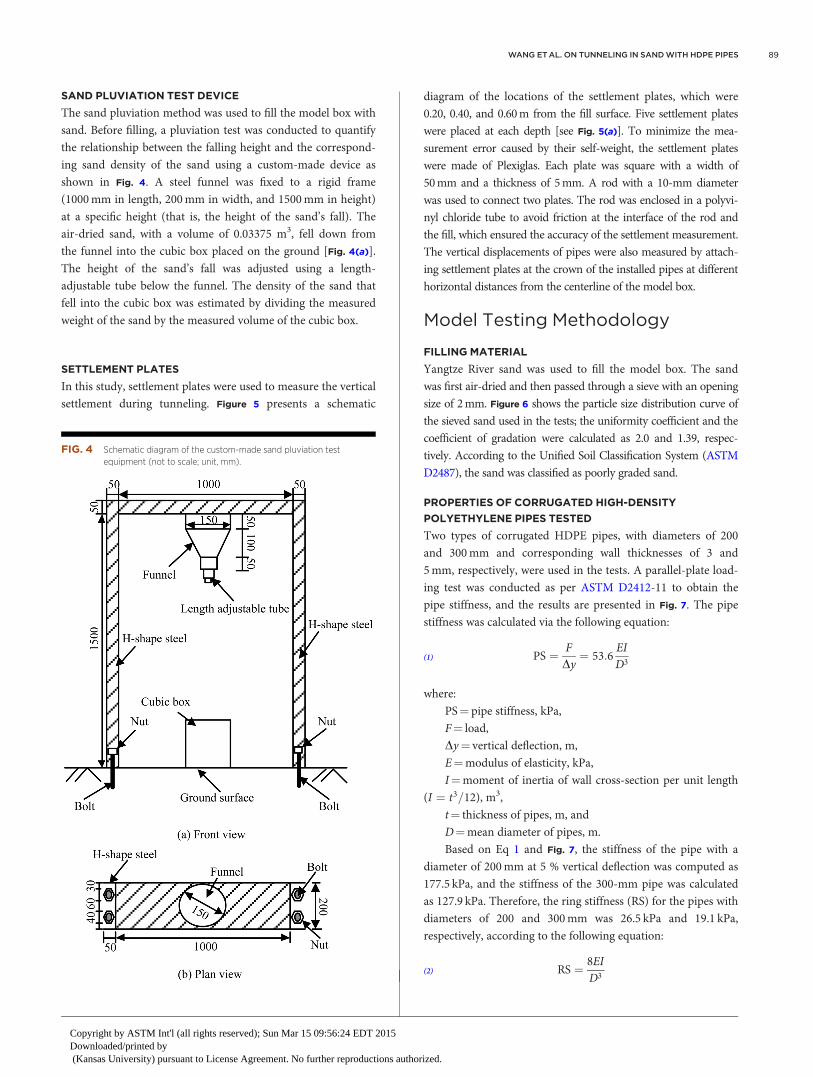
TESTED PIPE FIXING FRAME
Figure 3 shows two directional views of the pipe fixing frame.
The fixing frame was made from steel and fixed at the model
box wall. Five different buried depths of the tested pipe could be
provided by the fixing frame, namely, 0.75, 0.90, 1.05, 1.20, and
1.35m from the top of the model box. Pipe plugs were made
from polyethylene and used to connect the tested pipe with the
fixing frame. Pipe plugs were bonded with the fixing frame
using bolts and nuts through their centerlines, and then the
pipes were installed. The diameter of the pipe plug was exactly
equal to the inner diameter of the pipe, and the pipe plug could
be pushed into the pipe to connect the pipe with the model box
to simulate a spigot joint in practice. To maintain tight contact
between the plugs and tested pipes, two rubber O-rings with a
thickness of 1.5mm were used to cover the plugs before the
tested pipe was installed. Two types of corrugated HDPE pipes
with outside diameters of 200 and 300mm, respectively, were
selected in this study. Accordingly, two different diameters of
pipe plugs were used.
FIG. 3
Schematic diagram of tested pipe fixing frame (not to scale;
unit, mm).
Geotechnical Testing Journal88
Copyright by ASTM Int'l (all rights reserved); Sun Mar 15 09:56:24 EDT 2015Downloaded/printed by (Kansas University) pursuant to License Agreement. No further reproductions authorized.
SAND PLUVIATION TEST DEVICE
The sand pluviation method was used to fill the model box with
sand. Before filling, a pluviation test was conducted to quantify
the relationship between the falling height and the correspond-
ing sand density of the sand using a custom-made device as
shown in Fig. 4. A steel funnel was fixed to a rigid frame
(1000mm in length, 200mm in width, and 1500mm in height)
at a specific height (that is, the height of the sand’s fall). The
air-dried sand, with a volume of 0.03375 m3, fell down from
the funnel into the cubic box placed on the ground [Fig. 4(a)].
The height of the sand’s fall was adjusted using a length-
adjustable tube below the funnel. The density of the sand that
fell into the cubic box was estimated by dividing the measured
weight of the sand by the measured volume of the cubic box.
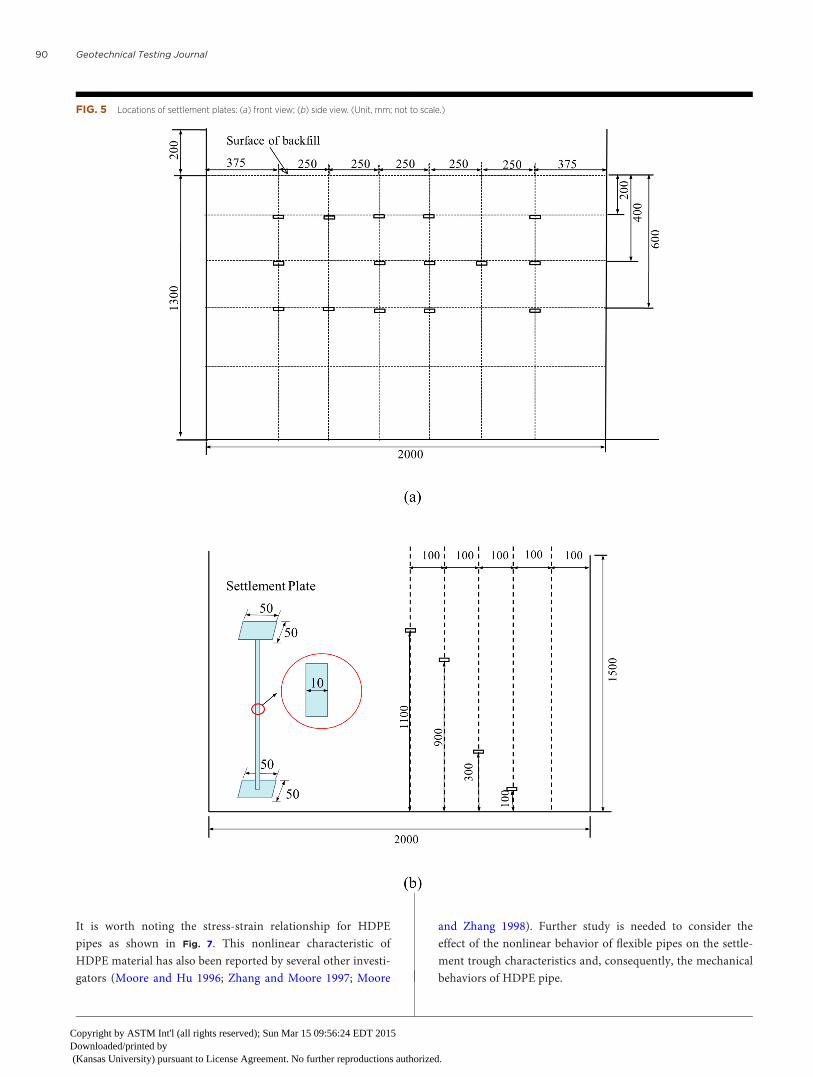
SETTLEMENT PLATES
In this study, settlement plates were used to measure the vertical
settlement during tunneling. Figure 5 presents a schematic
diagram of the locations of the settlement plates, which were
0.20, 0.40, and 0.60m from the fill surface. Five settlement plates
were placed at each depth [see Fig. 5(a)]. To minimize the mea-
surement error caused by their self-weight, the settlement plates
were made of Plexiglas. Each plate was square with a width of
50mm and a thickness of 5mm. A rod with a 10-mm diameter
was used to connect two plates. The rod was enclosed in a polyvi-
nyl chloride tube to avoid friction at the interface of the rod and
the fill, which ensured the accuracy of the settlement measurement.
The vertical displacements of pipes were also measured by attach-
ing settlement plates at the crown of the installed pipes at different
horizontal distances from the centerline of the model box.
Model Testing Methodology
FILLING MATERIAL
Yangtze River sand was used to fill the model box. The sand
was first air-dried and then passed through a sieve with an opening
size of 2mm. Figure 6 shows the particle size distribution curve of
the sieved sand used in the tests; the uniformity coefficient and the
coefficient of gradation were calculated as 2.0 and 1.39, respec-
tively. According to the Unified Soil Classification System (ASTM
D2487), the sand was classified as poorly graded sand.
PROPERTIES OF CORRUGATED HIGH-DENSITY
POLYETHYLENE PIPES TESTED
Two types of corrugated HDPE pipes, with diameters of 200
and 300mm and corresponding wall thicknesses of 3 and
5mm, respectively, were used in the tests. A parallel-plate load-
ing test was conducted as per ASTM D2412-11 to obtain the
pipe stiffness, and the results are presented in Fig. 7. The pipe
stiffness was calculated via the following equation:
PS ¼ FDy¼ 53:6
EID3
(1)
where:
PS¼ pipe stiffness, kPa,
F¼ load,
Dy¼ vertical deflection, m,
E¼modulus of elasticity, kPa,
I¼moment of inertia of wall cross-section per unit length
(I ¼ t3=12), m3,
t¼ thickness of pipes, m, and
D¼mean diameter of pipes, m.
Based on Eq 1 and Fig. 7, the stiffness of the pipe with a
diameter of 200mm at 5 % vertical deflection was computed as
177.5 kPa, and the stiffness of the 300-mm pipe was calculated
as 127.9 kPa. Therefore, the ring stiffness (RS) for the pipes with
diameters of 200 and 300mm was 26.5 kPa and 19.1 kPa,
respectively, according to the following equation:
RS ¼ 8EID3
(2)
FIG. 4 Schematic diagram of the custom-made sand pluviation test
equipment (not to scale; unit, mm).
WANG ET AL. ON TUNNELING IN SAND WITH HDPE PIPES 89
Copyright by ASTM Int'l (all rights reserved); Sun Mar 15 09:56:24 EDT 2015Downloaded/printed by (Kansas University) pursuant to License Agreement. No further reproductions authorized.
It is worth noting the stress-strain relationship for HDPE
pipes as shown in Fig. 7. This nonlinear characteristic of
HDPE material has also been reported by several other investi-
gators (Moore and Hu 1996; Zhang and Moore 1997; Moore
and Zhang 1998). Further study is needed to consider the
effect of the nonlinear behavior of flexible pipes on the settle-
ment trough characteristics and, consequently, the mechanical
behaviors of HDPE pipe.
FIG. 5 Locations of settlement plates: (a) front view; (b) side view. (Unit, mm; not to scale.)
Geotechnical Testing Journal90
Copyright by ASTM Int'l (all rights reserved); Sun Mar 15 09:56:24 EDT 2015Downloaded/printed by (Kansas University) pursuant to License Agreement. No further reproductions authorized.
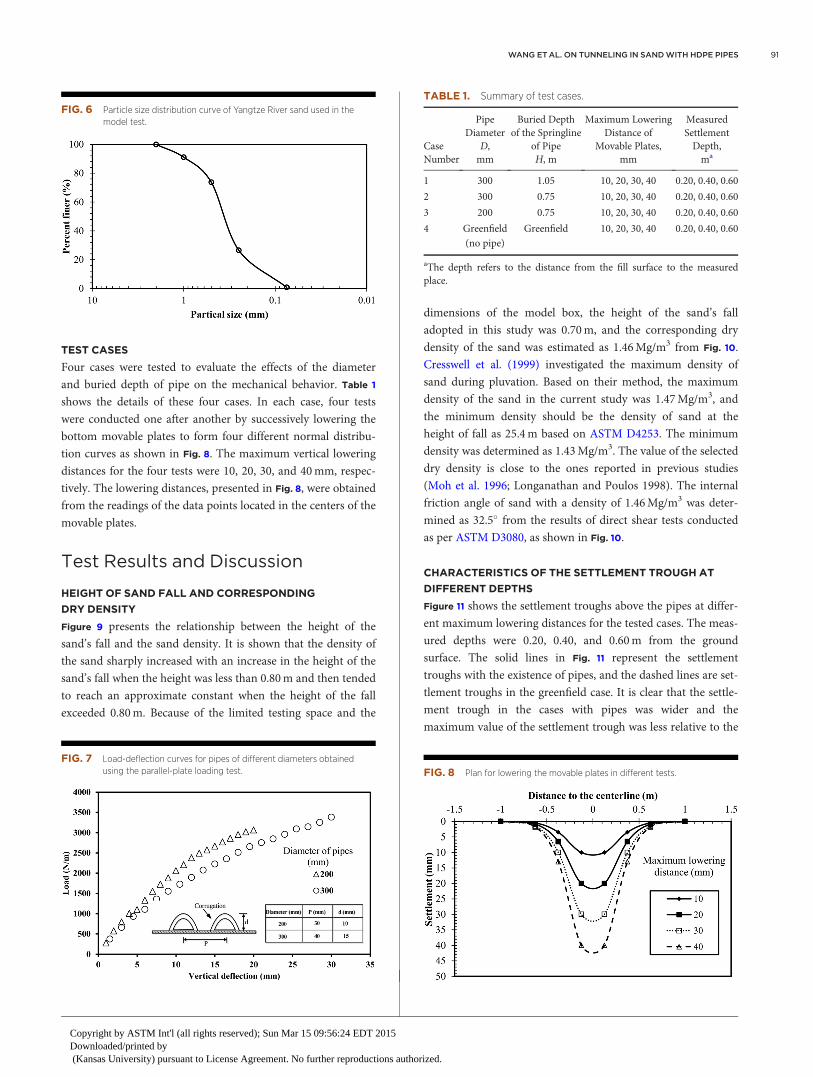
TEST CASES
Four cases were tested to evaluate the effects of the diameter
and buried depth of pipe on the mechanical behavior. Table 1
shows the details of these four cases. In each case, four tests
were conducted one after another by successively lowering the
bottom movable plates to form four different normal distribu-
tion curves as shown in Fig. 8. The maximum vertical lowering
distances for the four tests were 10, 20, 30, and 40mm, respec-
tively. The lowering distances, presented in Fig. 8, were obtained
from the readings of the data points located in the centers of the
movable plates.
Test Results and Discussion
HEIGHT OF SAND FALL AND CORRESPONDING
DRY DENSITY
Figure 9 presents the relationship between the height of the
sand’s fall and the sand density. It is shown that the density of
the sand sharply increased with an increase in the height of the
sand’s fall when the height was less than 0.80m and then tended
to reach an approximate constant when the height of the fall
exceeded 0.80m. Because of the limited testing space and the
dimensions of the model box, the height of the sand’s fall
adopted in this study was 0.70m, and the corresponding dry
density of the sand was estimated as 1.46Mg/m3 from Fig. 10.
Cresswell et al. (1999) investigated the maximum density of
sand during pluvation. Based on their method, the maximum
density of the sand in the current study was 1.47Mg/m3, and
the minimum density should be the density of sand at the
height of fall as 25.4m based on ASTM D4253. The minimum
density was determined as 1.43Mg/m3. The value of the selected
dry density is close to the ones reported in previous studies
(Moh et al. 1996; Longanathan and Poulos 1998). The internal
friction angle of sand with a density of 1.46Mg/m3 was deter-
mined as 32.5� from the results of direct shear tests conducted
as per ASTM D3080, as shown in Fig. 10.
CHARACTERISTICS OF THE SETTLEMENT TROUGH AT
DIFFERENT DEPTHS
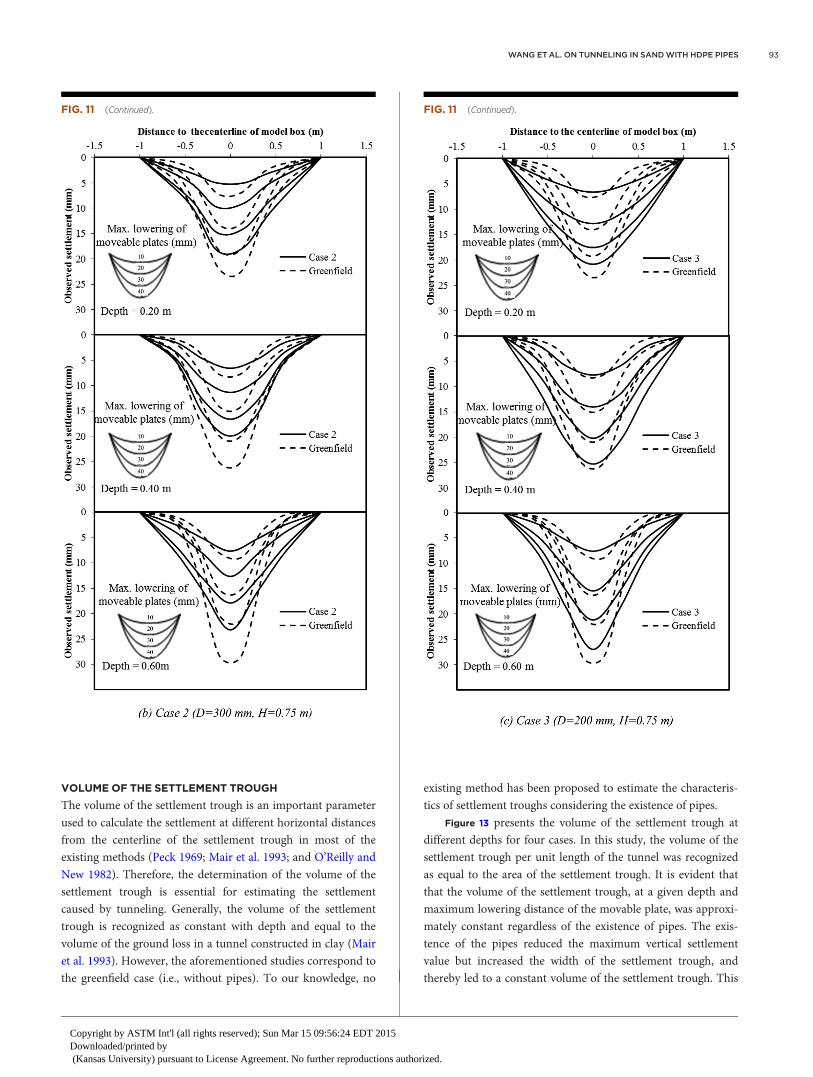
Figure 11 shows the settlement troughs above the pipes at differ-
ent maximum lowering distances for the tested cases. The meas-
ured depths were 0.20, 0.40, and 0.60m from the ground
surface. The solid lines in Fig. 11 represent the settlement
troughs with the existence of pipes, and the dashed lines are set-
tlement troughs in the greenfield case. It is clear that the settle-
ment trough in the cases with pipes was wider and the
maximum value of the settlement trough was less relative to the
FIG. 6 Particle size distribution curve of Yangtze River sand used in the
model test.
FIG. 7 Load-deflection curves for pipes of different diameters obtained
using the parallel-plate loading test.
TABLE 1. Summary of test cases.
CaseNumber
PipeDiameter
D,mm
Buried Depthof the Springline
of PipeH, m
Maximum LoweringDistance of
Movable Plates,mm
MeasuredSettlementDepth,ma
1 300 1.05 10, 20, 30, 40 0.20, 0.40, 0.60
2 300 0.75 10, 20, 30, 40 0.20, 0.40, 0.60
3 200 0.75 10, 20, 30, 40 0.20, 0.40, 0.60
4 Greenfield(no pipe)
Greenfield 10, 20, 30, 40 0.20, 0.40, 0.60
aThe depth refers to the distance from the fill surface to the measuredplace.
FIG. 8 Plan for lowering the movable plates in different tests.
WANG ET AL. ON TUNNELING IN SAND WITH HDPE PIPES 91
Copyright by ASTM Int'l (all rights reserved); Sun Mar 15 09:56:24 EDT 2015Downloaded/printed by (Kansas University) pursuant to License Agreement. No further reproductions authorized.
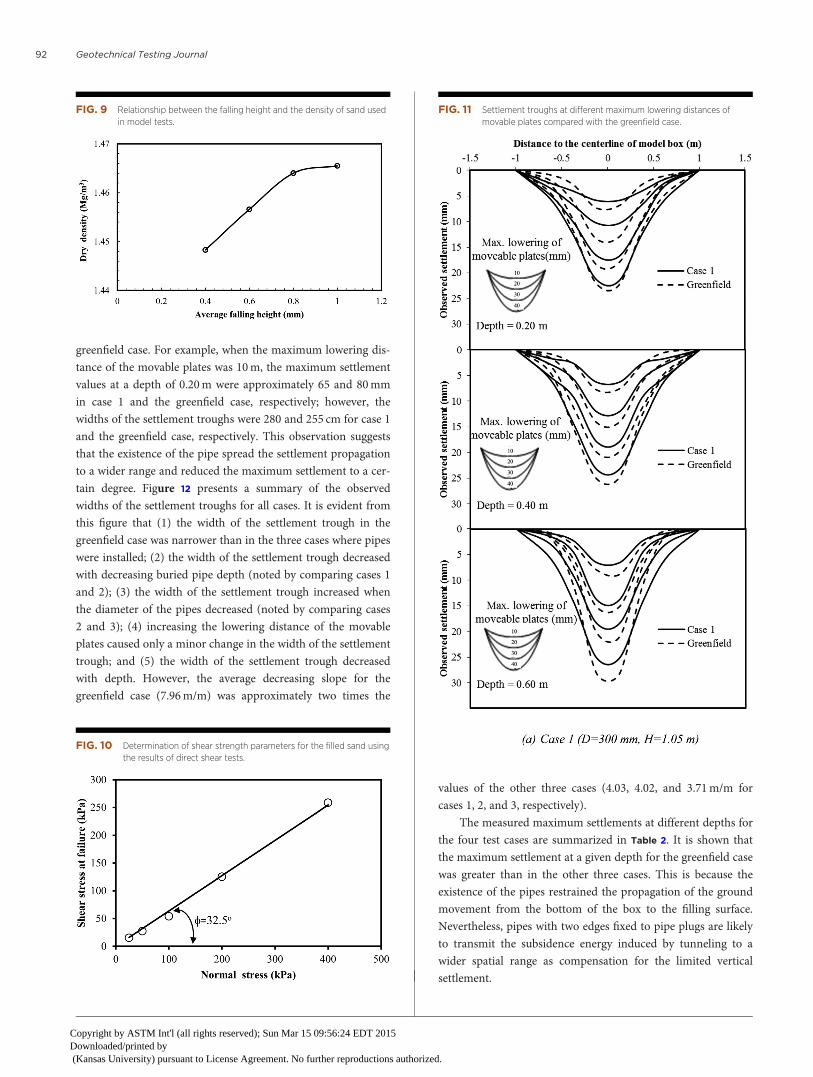
greenfield case. For example, when the maximum lowering dis-
tance of the movable plates was 10m, the maximum settlement
values at a depth of 0.20m were approximately 65 and 80mm
in case 1 and the greenfield case, respectively; however, the
widths of the settlement troughs were 280 and 255 cm for case 1
and the greenfield case, respectively. This observation suggests
that the existence of the pipe spread the settlement propagation
to a wider range and reduced the maximum settlement to a cer-
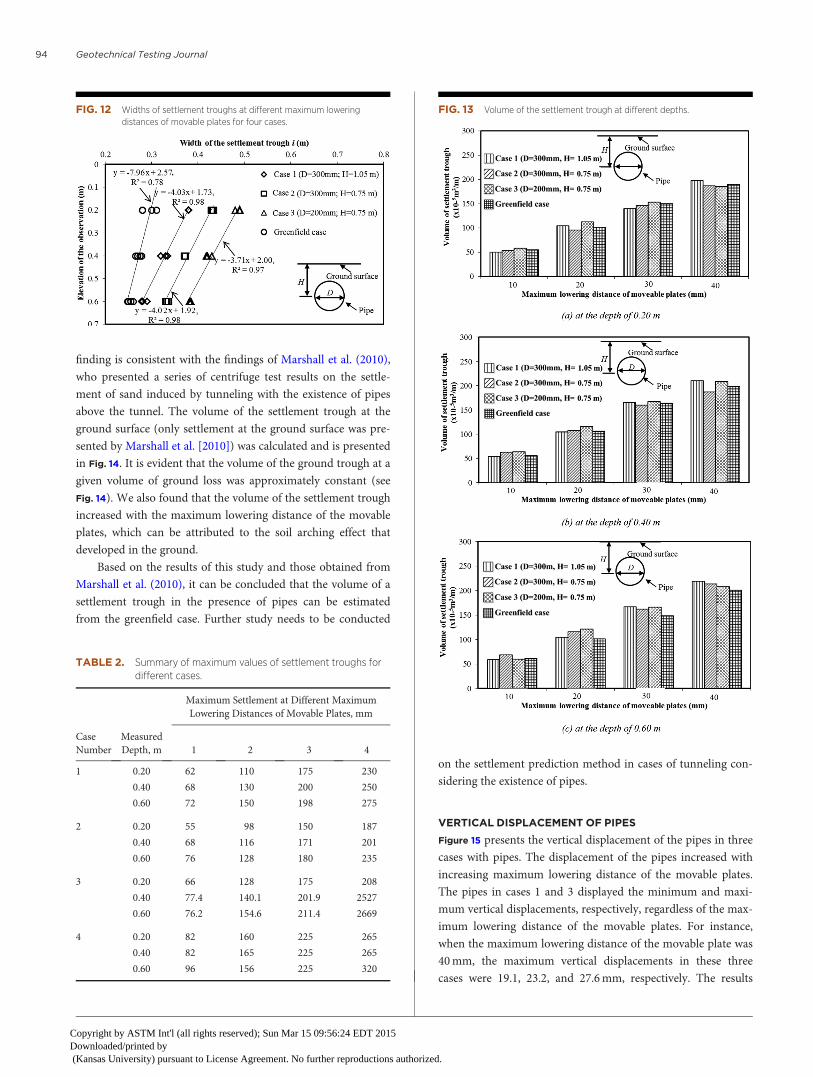
tain degree. Figure 12 presents a summary of the observed
widths of the settlement troughs for all cases. It is evident from
this figure that (1) the width of the settlement trough in the
greenfield case was narrower than in the three cases where pipes
were installed; (2) the width of the settlement trough decreased
with decreasing buried pipe depth (noted by comparing cases 1
and 2); (3) the width of the settlement trough increased when
the diameter of the pipes decreased (noted by comparing cases
2 and 3); (4) increasing the lowering distance of the movable
plates caused only a minor change in the width of the settlement
trough; and (5) the width of the settlement trough decreased
with depth. However, the average decreasing slope for the
greenfield case (7.96m/m) was approximately two times the
values of the other three cases (4.03, 4.02, and 3.71m/m for
cases 1, 2, and 3, respectively).
The measured maximum settlements at different depths for
the four test cases are summarized in Table 2. It is shown that
the maximum settlement at a given depth for the greenfield case
was greater than in the other three cases. This is because the
existence of the pipes restrained the propagation of the ground
movement from the bottom of the box to the filling surface.
Nevertheless, pipes with two edges fixed to pipe plugs are likely
to transmit the subsidence energy induced by tunneling to a
wider spatial range as compensation for the limited vertical
settlement.
FIG. 9 Relationship between the falling height and the density of sand used
in model tests.
FIG. 10 Determination of shear strength parameters for the filled sand using
the results of direct shear tests.
FIG. 11 Settlement troughs at different maximum lowering distances of
movable plates compared with the greenfield case.
Geotechnical Testing Journal92
Copyright by ASTM Int'l (all rights reserved); Sun Mar 15 09:56:24 EDT 2015Downloaded/printed by (Kansas University) pursuant to License Agreement. No further reproductions authorized.
VOLUME OF THE SETTLEMENT TROUGH
The volume of the settlement trough is an important parameter
used to calculate the settlement at different horizontal distances
from the centerline of the settlement trough in most of the
existing methods (Peck 1969; Mair et al. 1993; and O’Reilly and
New 1982). Therefore, the determination of the volume of the
settlement trough is essential for estimating the settlement
caused by tunneling. Generally, the volume of the settlement
trough is recognized as constant with depth and equal to the
volume of the ground loss in a tunnel constructed in clay (Mair
et al. 1993). However, the aforementioned studies correspond to
the greenfield case (i.e., without pipes). To our knowledge, no
existing method has been proposed to estimate the characteris-
tics of settlement troughs considering the existence of pipes.
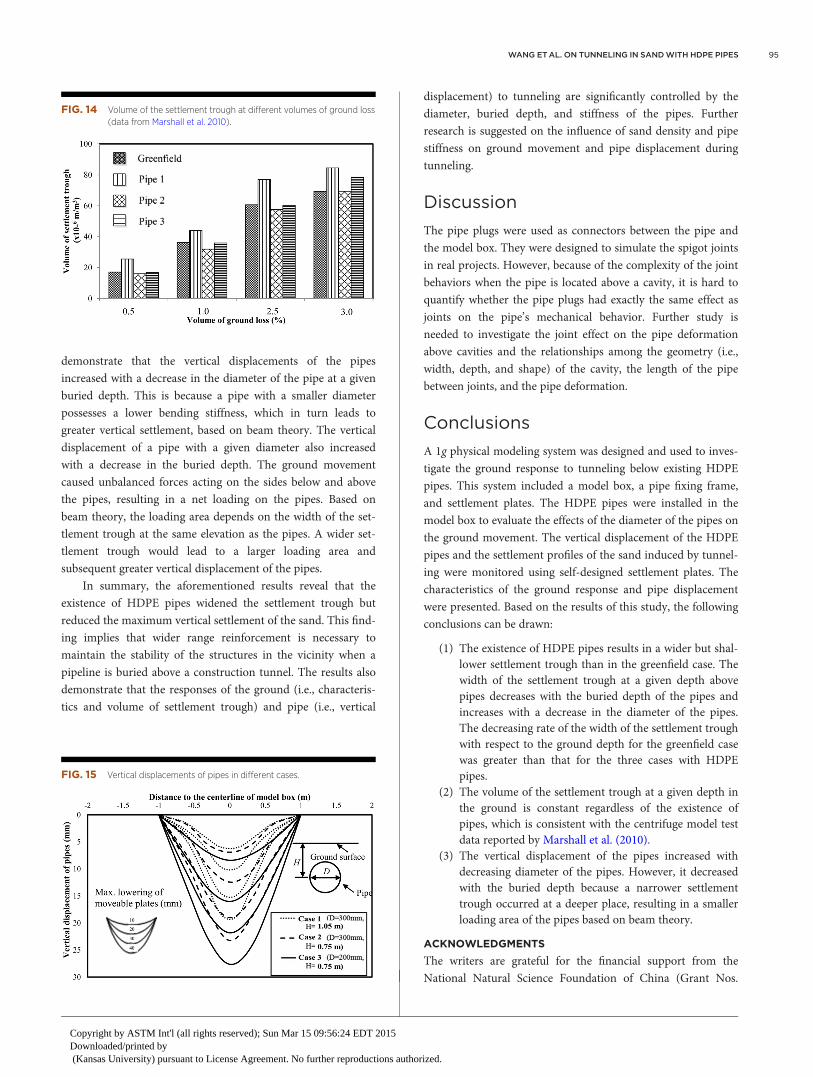
Figure 13 presents the volume of the settlement trough at
different depths for four cases. In this study, the volume of the
settlement trough per unit length of the tunnel was recognized
as equal to the area of the settlement trough. It is evident that
that the volume of the settlement trough, at a given depth and
maximum lowering distance of the movable plate, was approxi-
mately constant regardless of the existence of pipes. The exis-
tence of the pipes reduced the maximum vertical settlement
value but increased the width of the settlement trough, and
thereby led to a constant volume of the settlement trough. This
FIG. 11 (Continued). FIG. 11 (Continued).
WANG ET AL. ON TUNNELING IN SAND WITH HDPE PIPES 93
Copyright by ASTM Int'l (all rights reserved); Sun Mar 15 09:56:24 EDT 2015Downloaded/printed by (Kansas University) pursuant to License Agreement. No further reproductions authorized.
finding is consistent with the findings of Marshall et al. (2010),
who presented a series of centrifuge test results on the settle-
ment of sand induced by tunneling with the existence of pipes
above the tunnel. The volume of the settlement trough at the
ground surface (only settlement at the ground surface was pre-
sented by Marshall et al. [2010]) was calculated and is presented
in Fig. 14. It is evident that the volume of the ground trough at a
given volume of ground loss was approximately constant (see
Fig. 14). We also found that the volume of the settlement trough
increased with the maximum lowering distance of the movable
plates, which can be attributed to the soil arching effect that
developed in the ground.
Based on the results of this study and those obtained from
Marshall et al. (2010), it can be concluded that the volume of a
settlement trough in the presence of pipes can be estimated
from the greenfield case. Further study needs to be conducted
on the settlement prediction method in cases of tunneling con-
sidering the existence of pipes.
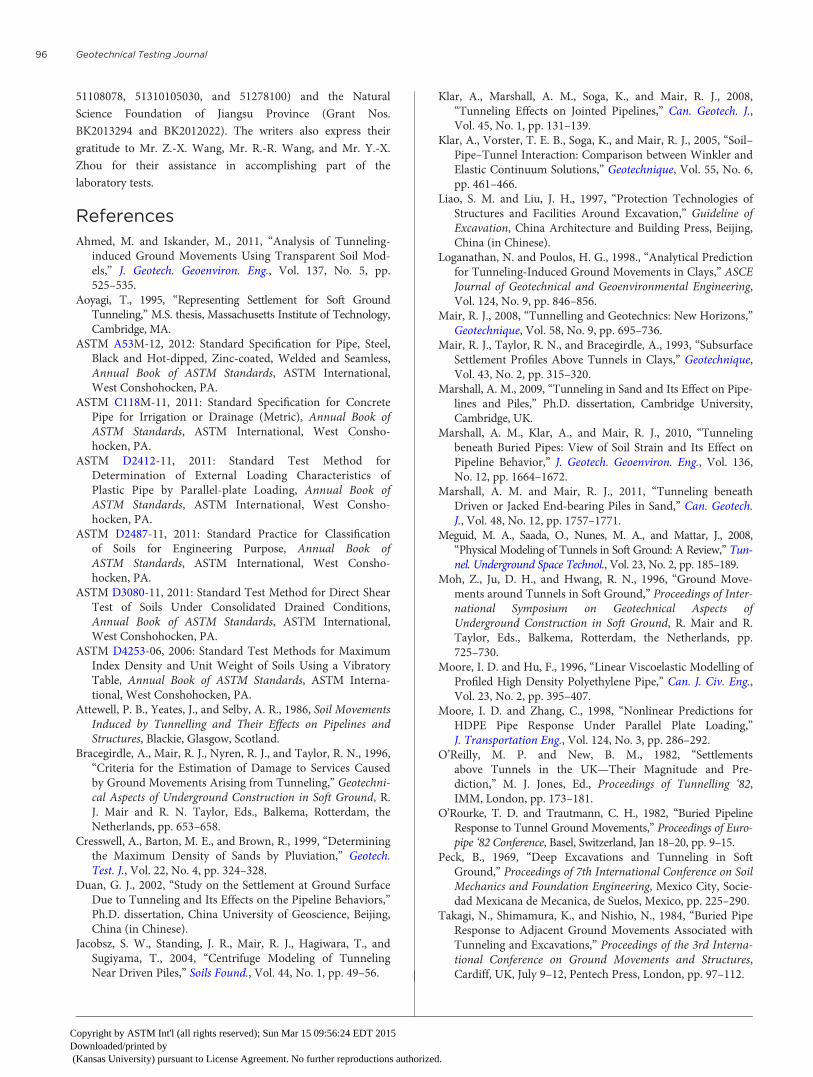
VERTICAL DISPLACEMENT OF PIPES
Figure 15 presents the vertical displacement of the pipes in three
cases with pipes. The displacement of the pipes increased with
increasing maximum lowering distance of the movable plates.
The pipes in cases 1 and 3 displayed the minimum and maxi-
mum vertical displacements, respectively, regardless of the max-
imum lowering distance of the movable plates. For instance,
when the maximum lowering distance of the movable plate was
40mm, the maximum vertical displacements in these three
cases were 19.1, 23.2, and 27.6mm, respectively. The results
FIG. 12 Widths of settlement troughs at different maximum lowering
distances of movable plates for four cases.
TABLE 2. Summary of maximum values of settlement troughs for
different cases.
Maximum Settlement at Different MaximumLowering Distances of Movable Plates, mm
CaseNumber
MeasuredDepth, m 1 2 3 4
1 0.20 62 110 175 230
0.40 68 130 200 250
0.60 72 150 198 275
2 0.20 55 98 150 187
0.40 68 116 171 201
0.60 76 128 180 235
3 0.20 66 128 175 208
0.40 77.4 140.1 201.9 2527
0.60 76.2 154.6 211.4 2669
4 0.20 82 160 225 265
0.40 82 165 225 265
0.60 96 156 225 320
FIG. 13 Volume of the settlement trough at different depths.
Geotechnical Testing Journal94
Copyright by ASTM Int'l (all rights reserved); Sun Mar 15 09:56:24 EDT 2015Downloaded/printed by (Kansas University) pursuant to License Agreement. No further reproductions authorized.
demonstrate that the vertical displacements of the pipes
increased with a decrease in the diameter of the pipe at a given
buried depth. This is because a pipe with a smaller diameter
possesses a lower bending stiffness, which in turn leads to
greater vertical settlement, based on beam theory. The vertical
displacement of a pipe with a given diameter also increased
with a decrease in the buried depth. The ground movement
caused unbalanced forces acting on the sides below and above
the pipes, resulting in a net loading on the pipes. Based on
beam theory, the loading area depends on the width of the set-
tlement trough at the same elevation as the pipes. A wider set-
tlement trough would lead to a larger loading area and
subsequent greater vertical displacement of the pipes.
In summary, the aforementioned results reveal that the
existence of HDPE pipes widened the settlement trough but
reduced the maximum vertical settlement of the sand. This find-
ing implies that wider range reinforcement is necessary to
maintain the stability of the structures in the vicinity when a
pipeline is buried above a construction tunnel. The results also
demonstrate that the responses of the ground (i.e., characteris-
tics and volume of settlement trough) and pipe (i.e., vertical
displacement) to tunneling are significantly controlled by the
diameter, buried depth, and stiffness of the pipes. Further
research is suggested on the influence of sand density and pipe
stiffness on ground movement and pipe displacement during
tunneling.
Discussion
The pipe plugs were used as connectors between the pipe and
the model box. They were designed to simulate the spigot joints
in real projects. However, because of the complexity of the joint
behaviors when the pipe is located above a cavity, it is hard to
quantify whether the pipe plugs had exactly the same effect as
joints on the pipe’s mechanical behavior. Further study is
needed to investigate the joint effect on the pipe deformation
above cavities and the relationships among the geometry (i.e.,
width, depth, and shape) of the cavity, the length of the pipe
between joints, and the pipe deformation.
Conclusions
A 1g physical modeling system was designed and used to inves-
tigate the ground response to tunneling below existing HDPE
pipes. This system included a model box, a pipe fixing frame,
and settlement plates. The HDPE pipes were installed in the
model box to evaluate the effects of the diameter of the pipes on
the ground movement. The vertical displacement of the HDPE
pipes and the settlement profiles of the sand induced by tunnel-
ing were monitored using self-designed settlement plates. The
characteristics of the ground response and pipe displacement
were presented. Based on the results of this study, the following
conclusions can be drawn:
(1) The existence of HDPE pipes results in a wider but shal-lower settlement trough than in the greenfield case. Thewidth of the settlement trough at a given depth abovepipes decreases with the buried depth of the pipes andincreases with a decrease in the diameter of the pipes.The decreasing rate of the width of the settlement troughwith respect to the ground depth for the greenfield casewas greater than that for the three cases with HDPEpipes.
(2) The volume of the settlement trough at a given depth inthe ground is constant regardless of the existence ofpipes, which is consistent with the centrifuge model testdata reported by Marshall et al. (2010).
(3) The vertical displacement of the pipes increased withdecreasing diameter of the pipes. However, it decreasedwith the buried depth because a narrower settlementtrough occurred at a deeper place, resulting in a smallerloading area of the pipes based on beam theory.
ACKNOWLEDGMENTS
The writers are grateful for the financial support from the
National Natural Science Foundation of China (Grant Nos.
FIG. 14 Volume of the settlement trough at different volumes of ground loss
(data from Marshall et al. 2010).
FIG. 15 Vertical displacements of pipes in different cases.
WANG ET AL. ON TUNNELING IN SAND WITH HDPE PIPES 95
Copyright by ASTM Int'l (all rights reserved); Sun Mar 15 09:56:24 EDT 2015Downloaded/printed by (Kansas University) pursuant to License Agreement. No further reproductions authorized.
51108078, 51310105030, and 51278100) and the Natural
Science Foundation of Jiangsu Province (Grant Nos.
BK2013294 and BK2012022). The writers also express their
gratitude to Mr. Z.-X. Wang, Mr. R.-R. Wang, and Mr. Y.-X.
Zhou for their assistance in accomplishing part of the
laboratory tests.
References
Ahmed, M. and Iskander, M., 2011, “Analysis of Tunneling-induced Ground Movements Using Transparent Soil Mod-els,” J. Geotech. Geoenviron. Eng., Vol. 137, No. 5, pp.525–535.
Aoyagi, T., 1995, “Representing Settlement for Soft GroundTunneling,” M.S. thesis, Massachusetts Institute of Technology,Cambridge, MA.
ASTM A53M-12, 2012: Standard Specification for Pipe, Steel,Black and Hot-dipped, Zinc-coated, Welded and Seamless,Annual Book of ASTM Standards, ASTM International,West Conshohocken, PA.
ASTM C118M-11, 2011: Standard Specification for ConcretePipe for Irrigation or Drainage (Metric), Annual Book ofASTM Standards, ASTM International, West Consho-hocken, PA.
ASTM D2412-11, 2011: Standard Test Method forDetermination of External Loading Characteristics ofPlastic Pipe by Parallel-plate Loading, Annual Book ofASTM Standards, ASTM International, West Consho-hocken, PA.
ASTM D2487-11, 2011: Standard Practice for Classificationof Soils for Engineering Purpose, Annual Book ofASTM Standards, ASTM International, West Consho-hocken, PA.
ASTM D3080-11, 2011: Standard Test Method for Direct ShearTest of Soils Under Consolidated Drained Conditions,Annual Book of ASTM Standards, ASTM International,West Conshohocken, PA.
ASTM D4253-06, 2006: Standard Test Methods for MaximumIndex Density and Unit Weight of Soils Using a VibratoryTable, Annual Book of ASTM Standards, ASTM Interna-tional, West Conshohocken, PA.
Attewell, P. B., Yeates, J., and Selby, A. R., 1986, Soil MovementsInduced by Tunnelling and Their Effects on Pipelines andStructures, Blackie, Glasgow, Scotland.
Bracegirdle, A., Mair, R. J., Nyren, R. J., and Taylor, R. N., 1996,“Criteria for the Estimation of Damage to Services Causedby Ground Movements Arising from Tunneling,” Geotechni-cal Aspects of Underground Construction in Soft Ground, R.J. Mair and R. N. Taylor, Eds., Balkema, Rotterdam, theNetherlands, pp. 653–658.
Cresswell, A., Barton, M. E., and Brown, R., 1999, “Determiningthe Maximum Density of Sands by Pluviation,” Geotech.Test. J., Vol. 22, No. 4, pp. 324–328.
Duan, G. J., 2002, “Study on the Settlement at Ground SurfaceDue to Tunneling and Its Effects on the Pipeline Behaviors,”Ph.D. dissertation, China University of Geoscience, Beijing,China (in Chinese).
Jacobsz, S. W., Standing, J. R., Mair, R. J., Hagiwara, T., andSugiyama, T., 2004, “Centrifuge Modeling of TunnelingNear Driven Piles,” Soils Found., Vol. 44, No. 1, pp. 49–56.
Klar, A., Marshall, A. M., Soga, K., and Mair, R. J., 2008,“Tunneling Effects on Jointed Pipelines,” Can. Geotech. J.,Vol. 45, No. 1, pp. 131–139.
Klar, A., Vorster, T. E. B., Soga, K., and Mair, R. J., 2005, “Soil–Pipe–Tunnel Interaction: Comparison between Winkler andElastic Continuum Solutions,” Geotechnique, Vol. 55, No. 6,pp. 461–466.
Liao, S. M. and Liu, J. H., 1997, “Protection Technologies ofStructures and Facilities Around Excavation,” Guideline ofExcavation, China Architecture and Building Press, Beijing,China (in Chinese).
Loganathan, N. and Poulos, H. G., 1998., “Analytical Predictionfor Tunneling-Induced Ground Movements in Clays,” ASCEJournal of Geotechnical and Geoenvironmental Engineering,Vol. 124, No. 9, pp. 846–856.
Mair, R. J., 2008, “Tunnelling and Geotechnics: New Horizons,”Geotechnique, Vol. 58, No. 9, pp. 695–736.
Mair, R. J., Taylor, R. N., and Bracegirdle, A., 1993, “SubsurfaceSettlement Profiles Above Tunnels in Clays,” Geotechnique,Vol. 43, No. 2, pp. 315–320.
Marshall, A. M., 2009, “Tunneling in Sand and Its Effect on Pipe-lines and Piles,” Ph.D. dissertation, Cambridge University,Cambridge, UK.
Marshall, A. M., Klar, A., and Mair, R. J., 2010, “Tunnelingbeneath Buried Pipes: View of Soil Strain and Its Effect onPipeline Behavior,” J. Geotech. Geoenviron. Eng., Vol. 136,No. 12, pp. 1664–1672.
Marshall, A. M. and Mair, R. J., 2011, “Tunneling beneathDriven or Jacked End-bearing Piles in Sand,” Can. Geotech.J., Vol. 48, No. 12, pp. 1757–1771.
Meguid, M. A., Saada, O., Nunes, M. A., and Mattar, J., 2008,“Physical Modeling of Tunnels in Soft Ground: A Review,” Tun-nel. Underground Space Technol., Vol. 23, No. 2, pp. 185–189.
Moh, Z., Ju, D. H., and Hwang, R. N., 1996, “Ground Move-ments around Tunnels in Soft Ground,” Proceedings of Inter-national Symposium on Geotechnical Aspects ofUnderground Construction in Soft Ground, R. Mair and R.Taylor, Eds., Balkema, Rotterdam, the Netherlands, pp.725–730.
Moore, I. D. and Hu, F., 1996, “Linear Viscoelastic Modelling ofProfiled High Density Polyethylene Pipe,” Can. J. Civ. Eng.,Vol. 23, No. 2, pp. 395–407.
Moore, I. D. and Zhang, C., 1998, “Nonlinear Predictions forHDPE Pipe Response Under Parallel Plate Loading,”J. Transportation Eng., Vol. 124, No. 3, pp. 286–292.
O’Reilly, M. P. and New, B. M., 1982, “Settlementsabove Tunnels in the UK—Their Magnitude and Pre-diction,” M. J. Jones, Ed., Proceedings of Tunnelling ‘82,IMM, London, pp. 173–181.
O’Rourke, T. D. and Trautmann, C. H., 1982, “Buried PipelineResponse to Tunnel Ground Movements,” Proceedings of Euro-pipe ‘82 Conference, Basel, Switzerland, Jan 18–20, pp. 9–15.
Peck, B., 1969, “Deep Excavations and Tunneling in SoftGround,” Proceedings of 7th International Conference on SoilMechanics and Foundation Engineering, Mexico City, Socie-dad Mexicana de Mecanica, de Suelos, Mexico, pp. 225–290.
Takagi, N., Shimamura, K., and Nishio, N., 1984, “Buried PipeResponse to Adjacent Ground Movements Associated withTunneling and Excavations,” Proceedings of the 3rd Interna-tional Conference on Ground Movements and Structures,Cardiff, UK, July 9–12, Pentech Press, London, pp. 97–112.
Geotechnical Testing Journal96
Copyright by ASTM Int'l (all rights reserved); Sun Mar 15 09:56:24 EDT 2015Downloaded/printed by (Kansas University) pursuant to License Agreement. No further reproductions authorized.
Vorster, T. E. B., 2005, “The Effects of Tunnellingon Buried Pipes,” Ph.D. thesis, Cambridge University,Cambridge, UK.
Vorster, T. E. B., Klar, A., Soga, K., and Mair, R. J., 2005,“Estimating the Effects of Tunneling on Existing Pipelines,”J. Geotech. Geoenviron. Eng., Vol. 131, No. 11, pp. 1399–1410.
Yeates, J., 1984, “The Response of Buried Pipelines to GroundMovements Caused by Tunnelling in Soil,” Proceedings ofthe 3rd International Conference on Ground Movements and
Structures, Cardiff, UK, July 9–12, Pentech Press, London,pp. 129–144.
Zhang, C. and Moore, I. D., 1997, “Nonlinear MechanicalResponse of High Density Polyethylene. Part I: ExperimentalInvestigation and Model Evaluation,” Polym. Eng. Sci., Vol.37, No. 2, pp. 404–413.
Zhang, Z. G., 2009, “The Effects of Tunneling on Existing Pipesin Layered Soils,” Ph.D. dissertation, Tongji University,Shanghai, China (in Chinese).
WANG ET AL. ON TUNNELING IN SAND WITH HDPE PIPES 97
Copyright by ASTM Int'l (all rights reserved); Sun Mar 15 09:56:24 EDT 2015Downloaded/printed by (Kansas University) pursuant to License Agreement. No further reproductions authorized.
View publication statsView publication stats