Embed Size (px)
Citation preview

Physical restoration options to address morphology and flood pressures on the River Nith - a pilot study
Submitted to:
SEPA
Developed by: cbec eco-engineering, Mott MacDonald &Walking the Talk
Project Number: U13-1007
October 2013
www.cbecoeng.co.uk
T/F: 01975 564 492
fl ood risk | river restoration | diff use pollution control | fi sheries management | hydropower support
cbec eco-engineering UK Ltd3 Aberdeen Road, Alford Aberdeenshire, AB33 8ED
Company Number: SC385000 | VAT Number: GB111101405

PHYSICAL RESTORATION OPTIONS TO ADDRESS MORPHOLOGY AND FLOOD PRESSURES ON THE
RIVER NITH – A PILOT STUDY
FINAL REPORT
Prepared for
SEPA
Erskine Court
Castle Business Park
Stirling
FK9 4TR
Prepared by
cbec eco-engineering
Mott MacDonald
Walking-the-Talk
October 2013
cbec Project #: U13-1007

Services provided pursuant to this Agreement are intended solely for
the use and benefit of SEPA. No other person or entity shall be
entitled to rely on the services, opinions, recommendations, plans or
specifications provided pursuant to this agreement without the
express written consent of cbec, Ltd., 3 Aberdeen Road, Alford, AB33
8ED.
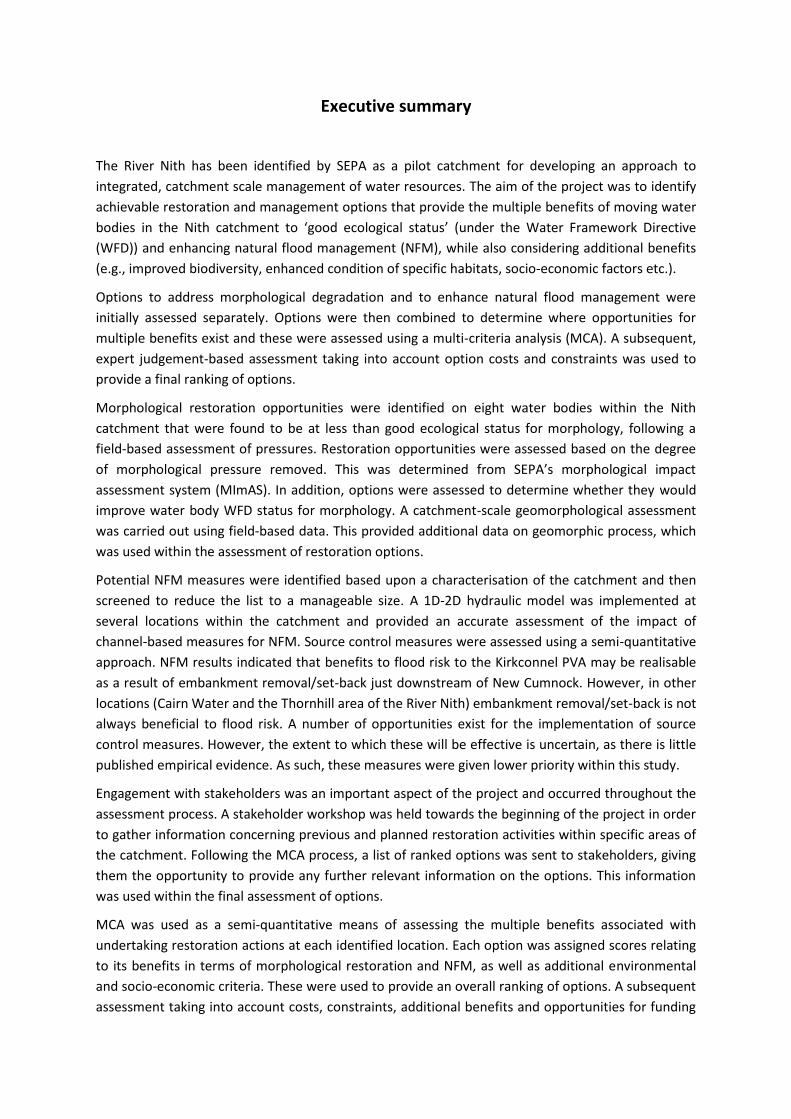
Executive summary
The River Nith has been identified by SEPA as a pilot catchment for developing an approach to
integrated, catchment scale management of water resources. The aim of the project was to identify
achievable restoration and management options that provide the multiple benefits of moving water
bodies in the Nith catchment to ‘good ecological status’ (under the Water Framework Directive
(WFD)) and enhancing natural flood management (NFM), while also considering additional benefits
(e.g., improved biodiversity, enhanced condition of specific habitats, socio-economic factors etc.).
Options to address morphological degradation and to enhance natural flood management were
initially assessed separately. Options were then combined to determine where opportunities for
multiple benefits exist and these were assessed using a multi-criteria analysis (MCA). A subsequent,
expert judgement-based assessment taking into account option costs and constraints was used to
provide a final ranking of options.
Morphological restoration opportunities were identified on eight water bodies within the Nith
catchment that were found to be at less than good ecological status for morphology, following a
field-based assessment of pressures. Restoration opportunities were assessed based on the degree
of morphological pressure removed. This was determined from SEPA’s morphological impact
assessment system (MImAS). In addition, options were assessed to determine whether they would
improve water body WFD status for morphology. A catchment-scale geomorphological assessment
was carried out using field-based data. This provided additional data on geomorphic process, which
was used within the assessment of restoration options.
Potential NFM measures were identified based upon a characterisation of the catchment and then
screened to reduce the list to a manageable size. A 1D-2D hydraulic model was implemented at
several locations within the catchment and provided an accurate assessment of the impact of
channel-based measures for NFM. Source control measures were assessed using a semi-quantitative
approach. NFM results indicated that benefits to flood risk to the Kirkconnel PVA may be realisable
as a result of embankment removal/set-back just downstream of New Cumnock. However, in other
locations (Cairn Water and the Thornhill area of the River Nith) embankment removal/set-back is not
always beneficial to flood risk. A number of opportunities exist for the implementation of source
control measures. However, the extent to which these will be effective is uncertain, as there is little
published empirical evidence. As such, these measures were given lower priority within this study.
Engagement with stakeholders was an important aspect of the project and occurred throughout the
assessment process. A stakeholder workshop was held towards the beginning of the project in order
to gather information concerning previous and planned restoration activities within specific areas of
the catchment. Following the MCA process, a list of ranked options was sent to stakeholders, giving
them the opportunity to provide any further relevant information on the options. This information
was used within the final assessment of options.
MCA was used as a semi-quantitative means of assessing the multiple benefits associated with
undertaking restoration actions at each identified location. Each option was assigned scores relating
to its benefits in terms of morphological restoration and NFM, as well as additional environmental
and socio-economic criteria. These were used to provide an overall ranking of options. A subsequent
assessment taking into account costs, constraints, additional benefits and opportunities for funding

and collaborative work, as well as the MCA score, was used to provide a final ranking of options. The
options ranked highest are the most favourable on the balance of overall benefit and practicality of
implementation, providing a starting point for determining which options to take forward. However,
options that do not fall into the top ten should not be completely ruled out.
The highest ranked option was removal of embankments on the Nith main stem downstream of New
Cumnock, which would result in improvement of water body status to good, as well as providing
potential reduction in flood risk at the Kirkconnel PVA. Other favourable options included
embankment removal and/or re-meandering on three reaches of Cample Water and two reaches of
Scar Water, as well as re-meandering and embankment removal on a reach of the Nith upstream of
Auldgirth.
River Nith restoration, cbec UK Ltd, October 2013
1
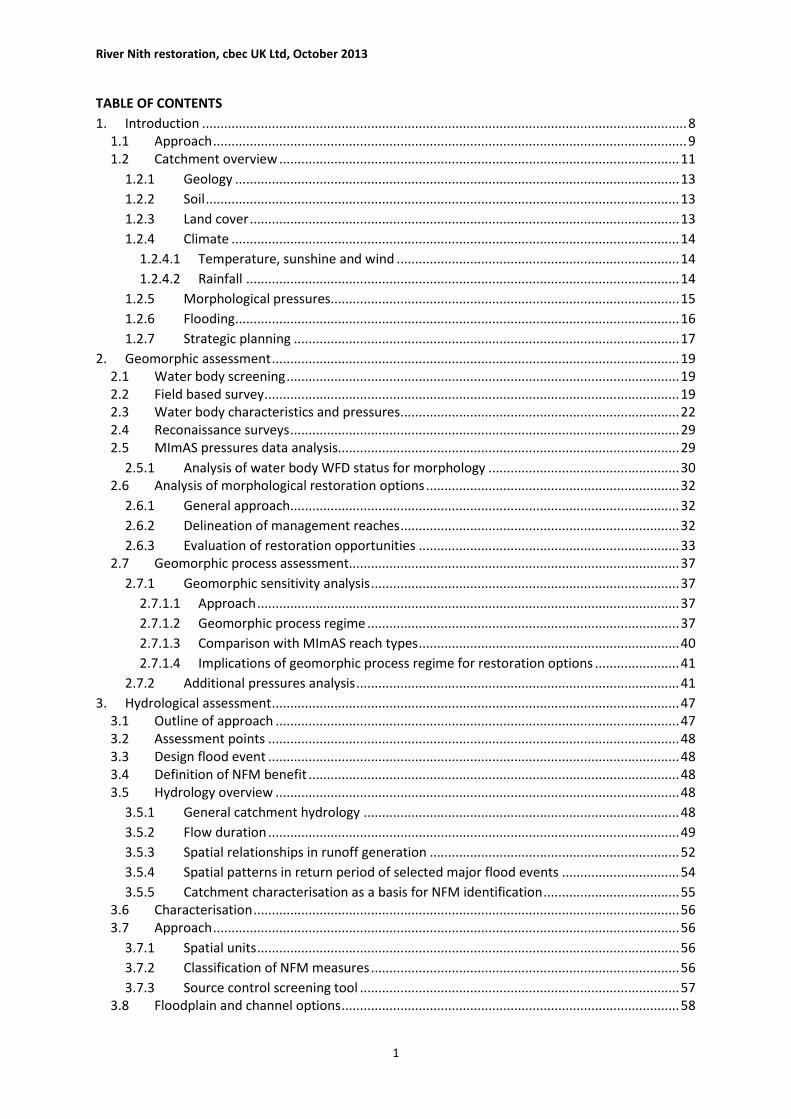
TABLE OF CONTENTS
1. Introduction .................................................................................................................................... 8 1.1 Approach ................................................................................................................................. 9 1.2 Catchment overview ............................................................................................................. 11
1.2.1 Geology ......................................................................................................................... 13
1.2.2 Soil ................................................................................................................................. 13
1.2.3 Land cover ..................................................................................................................... 13
1.2.4 Climate .......................................................................................................................... 14
1.2.4.1 Temperature, sunshine and wind ............................................................................. 14
1.2.4.2 Rainfall ...................................................................................................................... 14
1.2.5 Morphological pressures............................................................................................... 15
1.2.6 Flooding ......................................................................................................................... 16
1.2.7 Strategic planning ......................................................................................................... 17
2. Geomorphic assessment ............................................................................................................... 19 2.1 Water body screening ........................................................................................................... 19 2.2 Field based survey ................................................................................................................. 19 2.3 Water body characteristics and pressures ............................................................................ 22 2.4 Reconaissance surveys .......................................................................................................... 29 2.5 MImAS pressures data analysis............................................................................................. 29
2.5.1 Analysis of water body WFD status for morphology .................................................... 30 2.6 Analysis of morphological restoration options ..................................................................... 32
2.6.1 General approach .......................................................................................................... 32
2.6.2 Delineation of management reaches ............................................................................ 32
2.6.3 Evaluation of restoration opportunities ....................................................................... 33 2.7 Geomorphic process assessment.......................................................................................... 37
2.7.1 Geomorphic sensitivity analysis .................................................................................... 37
2.7.1.1 Approach ................................................................................................................... 37
2.7.1.2 Geomorphic process regime ..................................................................................... 37
2.7.1.3 Comparison with MImAS reach types ....................................................................... 40
2.7.1.4 Implications of geomorphic process regime for restoration options ....................... 41
2.7.2 Additional pressures analysis ........................................................................................ 41
3. Hydrological assessment ............................................................................................................... 47 3.1 Outline of approach .............................................................................................................. 47 3.2 Assessment points ................................................................................................................ 48 3.3 Design flood event ................................................................................................................ 48 3.4 Definition of NFM benefit ..................................................................................................... 48 3.5 Hydrology overview .............................................................................................................. 48
3.5.1 General catchment hydrology ...................................................................................... 48
3.5.2 Flow duration ................................................................................................................ 49
3.5.3 Spatial relationships in runoff generation .................................................................... 52
3.5.4 Spatial patterns in return period of selected major flood events ................................ 54
3.5.5 Catchment characterisation as a basis for NFM identification ..................................... 55 3.6 Characterisation .................................................................................................................... 56 3.7 Approach ............................................................................................................................... 56
3.7.1 Spatial units ................................................................................................................... 56
3.7.2 Classification of NFM measures .................................................................................... 56
3.7.3 Source control screening tool ....................................................................................... 57 3.8 Floodplain and channel options ............................................................................................ 58

River Nith restoration, cbec UK Ltd, October 2013
2
3.9 Options assessment .............................................................................................................. 58 3.10 Data summary ....................................................................................................................... 66
3.10.1 DTM ............................................................................................................................... 67
3.10.2 Landcover ...................................................................................................................... 67
3.10.3 Section 20 data ............................................................................................................. 67
3.10.4 Rainfall .......................................................................................................................... 68
3.10.5 River flow ...................................................................................................................... 68
3.10.6 The need for an intermediate screening approach ...................................................... 68 3.11 Screening process ................................................................................................................. 69 3.12 Option assessment ................................................................................................................ 70 3.13 Local scale assessment .......................................................................................................... 70 3.14 Catchment scale assessment ................................................................................................ 70 3.15 Discussion .............................................................................................................................. 74
3.15.1 Negative benefit from embankment removal .............................................................. 74
3.15.2 Set back vs. full removal? .............................................................................................. 74
3.15.3 Source control measures .............................................................................................. 74
4. Stakeholder engagement .............................................................................................................. 76 4.1 Introduction .......................................................................................................................... 76 4.2 Methods ................................................................................................................................ 76
4.2.1 Provision of summary material and introductory meetings ......................................... 76
4.2.2 Stakeholder workshop .................................................................................................. 76
4.2.3 Wider awareness raising with land managers .............................................................. 77 4.3 Stakeholder consultation of options ..................................................................................... 77
5. Multi-criteria analysis of options .................................................................................................. 79 5.1 Integration of WFD and NFM options and initial screening ................................................. 79 5.2 Scoring of MCA criteria ......................................................................................................... 84
5.2.1 WFD status for morphology .......................................................................................... 84
5.2.2 Natural flood management ........................................................................................... 84
5.2.3 Environmental criteria .................................................................................................. 84
5.2.3.1 Impact on nationally designated protected areas .................................................... 84
5.2.3.2 Surrounding habitat creation potential .................................................................... 84
5.2.3.3 Potential to mitigate diffuse pollution ...................................................................... 85
5.2.3.4 Potential to address livestock poaching ................................................................... 85
5.2.4 Socio-economic criteria ................................................................................................ 85
5.2.4.1 Impact on critical infrastructure ............................................................................... 85
5.2.4.2 Potential to create recreational infrastructure ......................................................... 86
5.2.4.3 Awareness raising potential ...................................................................................... 86 5.3 Weighting and calculation of final score ............................................................................... 87 5.4 MCA results ........................................................................................................................... 87
6. Final assessment of options .......................................................................................................... 90 6.1 Factors considered ................................................................................................................ 90
6.1.1 Estimated cost ............................................................................................................... 90
6.1.2 Impact on surrounding land and assets ........................................................................ 91
6.1.3 Stakeholder feedback ................................................................................................... 91
6.1.4 Benefit to local morphology.......................................................................................... 92 6.2 Prioritisation method ............................................................................................................ 92 6.3 Outcome of final assessment ................................................................................................ 92
7. Summary and recommendations .................................................................................................. 96

River Nith restoration, cbec UK Ltd, October 2013
3
7.1 Summary of findings ............................................................................................................. 96
7.1.1 Geomorphological ......................................................................................................... 96
7.1.2 Hydrological .................................................................................................................. 96
7.1.3 Multi-criteria analysis and subsequent assessment ..................................................... 97 7.2 Assessment of methodology ................................................................................................. 97
7.2.1 Morphological assessment ........................................................................................... 97
7.2.2 NFM assessment ........................................................................................................... 98
7.2.2.1 Overall Approach ...................................................................................................... 98
7.2.2.2 Quantification and Prioritisation .............................................................................. 99
7.2.3 Integration of morphological and NFM options and MCA process .............................. 99
7.2.4 Stakeholder engagement process ............................................................................... 100
7.2.4.1 Liaison with organisational stakeholders ................................................................ 100
7.2.4.2 Stakeholder workshop ............................................................................................ 100
7.2.4.3 Landowner engagement ......................................................................................... 101
7.2.4.4 Recommendations for future stakeholder communication within the Nith .......... 101
8. References .................................................................................................................................. 102
9. List of preparers .......................................................................................................................... 103 LIST OF FIGURES
Figure 1.1 Flow chart illustrating the stages of work in the project ..................................................... 11
Figure 1.2 Overview of the Nith catchment .......................................................................................... 12
Figure 1.3 Monthly average daily rainfall for gauging sites in the Nith catchment .............................. 14
Figure 1.4 Annual Precipitation time series for Eliock gauging site ...................................................... 15
Figure 1.5 PVAs and WFD morphology status (2011 classification) ..................................................... 18
Figure 2.1 Surveyed water bodies......................................................................................................... 20
Figure 2.2 Significant weirs recorded in the Nith catchment - A: Crichope Linn; B: Laggan Burn; C:
Pennyland Burn. .................................................................................................................................... 23
Figure 2.3 WFD status for morphology for surveyed water bodies ...................................................... 31
Figure 2.4 Geomorphic process regime ................................................................................................ 39
Figure 2.5 Examples of reaches with high process intensity – A: Nith main stem near Thornhill; B:
Nith downstream of Pennyland Burn confluence; C: Pennyland Burn; D: Crichope Linn .................... 40
Figure 2.6 Bank protection and croys in reaches with a geomorphic process intensity greater than 20
.............................................................................................................................................................. 43
Figure 2.7 Examples of hard bank protection impacting on geomorphic process on the Nith main
stem: A: near Thornhill; B: near Dumfries ............................................................................................ 44
Figure 2.8 Croy impacting on geomorphic process on the Nith main stem near Closeburn ................ 44
Figure 2.9 Locations of livestock pressure on banks ............................................................................ 45
Figure 2.10 Effects of livestock poaching on channel banks - A: Nith Dumfries to Sanquhar; B:
Pennyland Burn. .................................................................................................................................... 46
Figure 3.1 Schematic of approach to prioritise NFM measures in the pilot catchment. ...................... 47
Figure 3.2 Flow duration curve for several Nith gauges, scaled by catchment area ............................ 49
Figure 3.3 Flow duration curves, scaled by catchment area, for gauging stations located on the Nith
main stem. ............................................................................................................................................ 51
Figure 3.4 Annual flow record for the Nith at Friars Carse ................................................................... 51
Figure 3.5 Annual flow record for the Nith at Hall Bridge and Drumlanrig .......................................... 52
River Nith restoration, cbec UK Ltd, October 2013
4
Figure 3.6 Gauge correlation for matched annual maximum events – Friars Carse and Hall Bridge ... 53
Figure 3.7 Gauge correlation for matched annual maximum events – Scar Water and Cluden Water53
Figure 3.8 Gauge correlation for matched annual maximum events – Drumlanrig and Friars Carse .. 53
Figure 3.9 NFM option screening process ............................................................................................ 69
Figure 5.1 River Nith restoration reaches – upper Nith ........................................................................ 81
Figure 5.2 River Nith restoration reaches – central Nith ...................................................................... 82
Figure 5.3 River Nith restoration reaches – lower Nith ........................................................................ 83
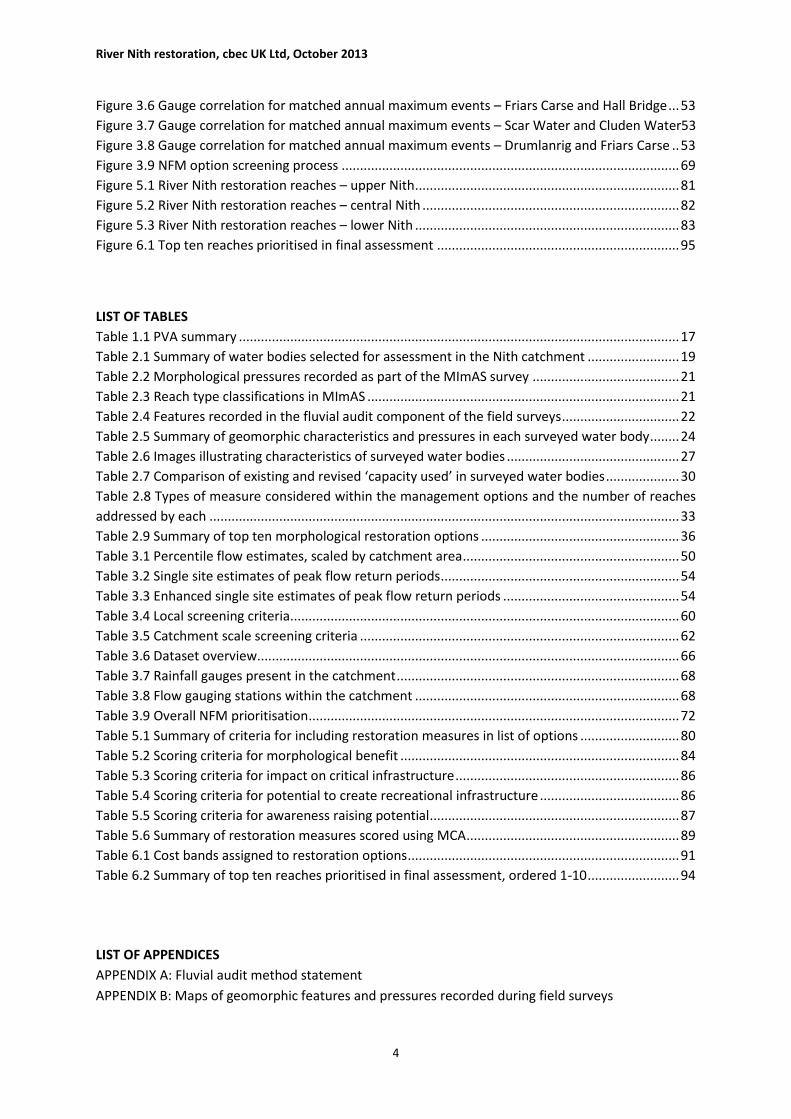
Figure 6.1 Top ten reaches prioritised in final assessment .................................................................. 95 LIST OF TABLES
Table 1.1 PVA summary ........................................................................................................................ 17
Table 2.1 Summary of water bodies selected for assessment in the Nith catchment ......................... 19
Table 2.2 Morphological pressures recorded as part of the MImAS survey ........................................ 21
Table 2.3 Reach type classifications in MImAS ..................................................................................... 21
Table 2.4 Features recorded in the fluvial audit component of the field surveys ................................ 22
Table 2.5 Summary of geomorphic characteristics and pressures in each surveyed water body ........ 24
Table 2.6 Images illustrating characteristics of surveyed water bodies ............................................... 27
Table 2.7 Comparison of existing and revised ‘capacity used’ in surveyed water bodies .................... 30
Table 2.8 Types of measure considered within the management options and the number of reaches
addressed by each ................................................................................................................................ 33
Table 2.9 Summary of top ten morphological restoration options ...................................................... 36
Table 3.1 Percentile flow estimates, scaled by catchment area ........................................................... 50
Table 3.2 Single site estimates of peak flow return periods ................................................................. 54
Table 3.3 Enhanced single site estimates of peak flow return periods ................................................ 54
Table 3.4 Local screening criteria .......................................................................................................... 60
Table 3.5 Catchment scale screening criteria ....................................................................................... 62
Table 3.6 Dataset overview................................................................................................................... 66
Table 3.7 Rainfall gauges present in the catchment ............................................................................. 68
Table 3.8 Flow gauging stations within the catchment ........................................................................ 68
Table 3.9 Overall NFM prioritisation ..................................................................................................... 72
Table 5.1 Summary of criteria for including restoration measures in list of options ........................... 80
Table 5.2 Scoring criteria for morphological benefit ............................................................................ 84
Table 5.3 Scoring criteria for impact on critical infrastructure ............................................................. 86
Table 5.4 Scoring criteria for potential to create recreational infrastructure ...................................... 86
Table 5.5 Scoring criteria for awareness raising potential .................................................................... 87
Table 5.6 Summary of restoration measures scored using MCA .......................................................... 89
Table 6.1 Cost bands assigned to restoration options .......................................................................... 91
Table 6.2 Summary of top ten reaches prioritised in final assessment, ordered 1-10 ......................... 94
LIST OF APPENDICES
APPENDIX A: Fluvial audit method statement
APPENDIX B: Maps of geomorphic features and pressures recorded during field surveys

River Nith restoration, cbec UK Ltd, October 2013
5
APPENDIX C: Reconnaissance survey findings
APPENDIX D: Morphological restoration options
APPENDIX E: Geomorphic process assessment
APPENDIX F: Potential NFM measures
APPENDIX G: Maps of catchment characteristics used in NFM assessment
APPENDIX H: Catchment photographs relating to NFM assessment
APPENDIX I: Modelling methodology used for NFM assessment
APPENDIX J: NFM assessment results
APPENDIX K: Multi-criteria analysis results
APPENDIX L: Final assessment of options
APPENDIX M: Reach summary sheets
APPENDIX N: List of datasets used
River Nith restoration, cbec UK Ltd, October 2013
6
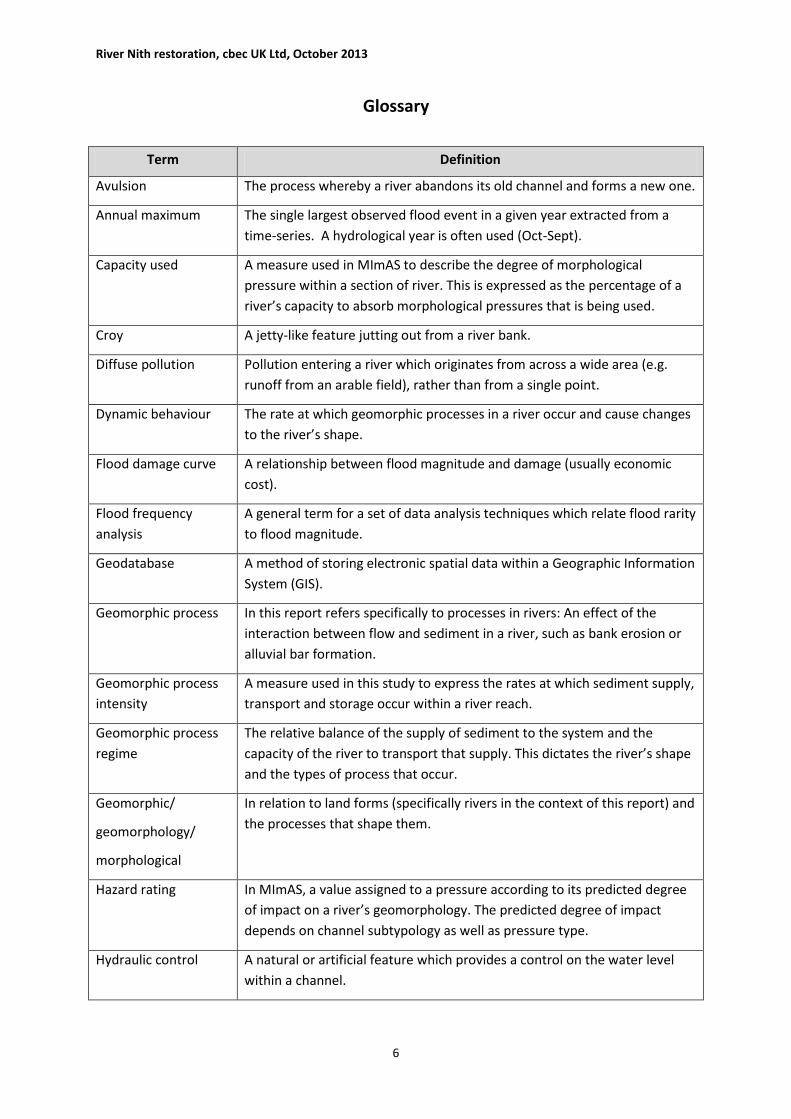
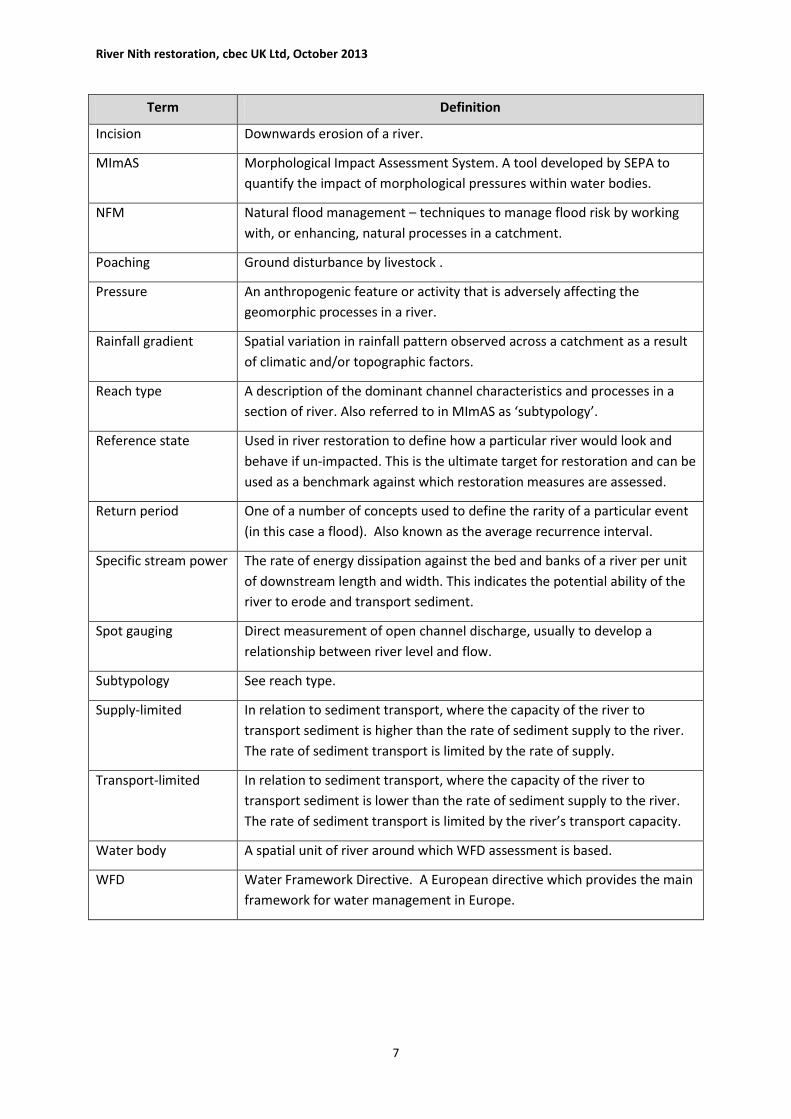
Glossary
Term Definition
Avulsion The process whereby a river abandons its old channel and forms a new one.
Annual maximum The single largest observed flood event in a given year extracted from a
time-series. A hydrological year is often used (Oct-Sept).
Capacity used A measure used in MImAS to describe the degree of morphological
pressure within a section of river. This is expressed as the percentage of a
river’s capacity to absorb morphological pressures that is being used.
Croy A jetty-like feature jutting out from a river bank.
Diffuse pollution Pollution entering a river which originates from across a wide area (e.g.
runoff from an arable field), rather than from a single point.
Dynamic behaviour The rate at which geomorphic processes in a river occur and cause changes
to the river’s shape.
Flood damage curve A relationship between flood magnitude and damage (usually economic
cost).
Flood frequency
analysis
A general term for a set of data analysis techniques which relate flood rarity
to flood magnitude.
Geodatabase A method of storing electronic spatial data within a Geographic Information
System (GIS).
Geomorphic process In this report refers specifically to processes in rivers: An effect of the
interaction between flow and sediment in a river, such as bank erosion or
alluvial bar formation.
Geomorphic process
intensity
A measure used in this study to express the rates at which sediment supply,
transport and storage occur within a river reach.
Geomorphic process
regime
The relative balance of the supply of sediment to the system and the
capacity of the river to transport that supply. This dictates the river’s shape
and the types of process that occur.
Geomorphic/
geomorphology/
morphological
In relation to land forms (specifically rivers in the context of this report) and
the processes that shape them.
Hazard rating In MImAS, a value assigned to a pressure according to its predicted degree
of impact on a river’s geomorphology. The predicted degree of impact
depends on channel subtypology as well as pressure type.
Hydraulic control A natural or artificial feature which provides a control on the water level
within a channel.
River Nith restoration, cbec UK Ltd, October 2013
7
Term Definition
Incision Downwards erosion of a river.
MImAS Morphological Impact Assessment System. A tool developed by SEPA to
quantify the impact of morphological pressures within water bodies.
NFM Natural flood management – techniques to manage flood risk by working
with, or enhancing, natural processes in a catchment.
Poaching Ground disturbance by livestock .
Pressure An anthropogenic feature or activity that is adversely affecting the
geomorphic processes in a river.
Rainfall gradient Spatial variation in rainfall pattern observed across a catchment as a result
of climatic and/or topographic factors.
Reach type A description of the dominant channel characteristics and processes in a
section of river. Also referred to in MImAS as ‘subtypology’.
Reference state Used in river restoration to define how a particular river would look and
behave if un-impacted. This is the ultimate target for restoration and can be
used as a benchmark against which restoration measures are assessed.
Return period One of a number of concepts used to define the rarity of a particular event
(in this case a flood). Also known as the average recurrence interval.
Specific stream power The rate of energy dissipation against the bed and banks of a river per unit
of downstream length and width. This indicates the potential ability of the
river to erode and transport sediment.
Spot gauging Direct measurement of open channel discharge, usually to develop a
relationship between river level and flow.
Subtypology See reach type.
Supply-limited In relation to sediment transport, where the capacity of the river to
transport sediment is higher than the rate of sediment supply to the river.
The rate of sediment transport is limited by the rate of supply.
Transport-limited In relation to sediment transport, where the capacity of the river to
transport sediment is lower than the rate of sediment supply to the river.
The rate of sediment transport is limited by the river’s transport capacity.
Water body A spatial unit of river around which WFD assessment is based.
WFD Water Framework Directive. A European directive which provides the main
framework for water management in Europe.
River Nith restoration, cbec UK Ltd, October 2013
8
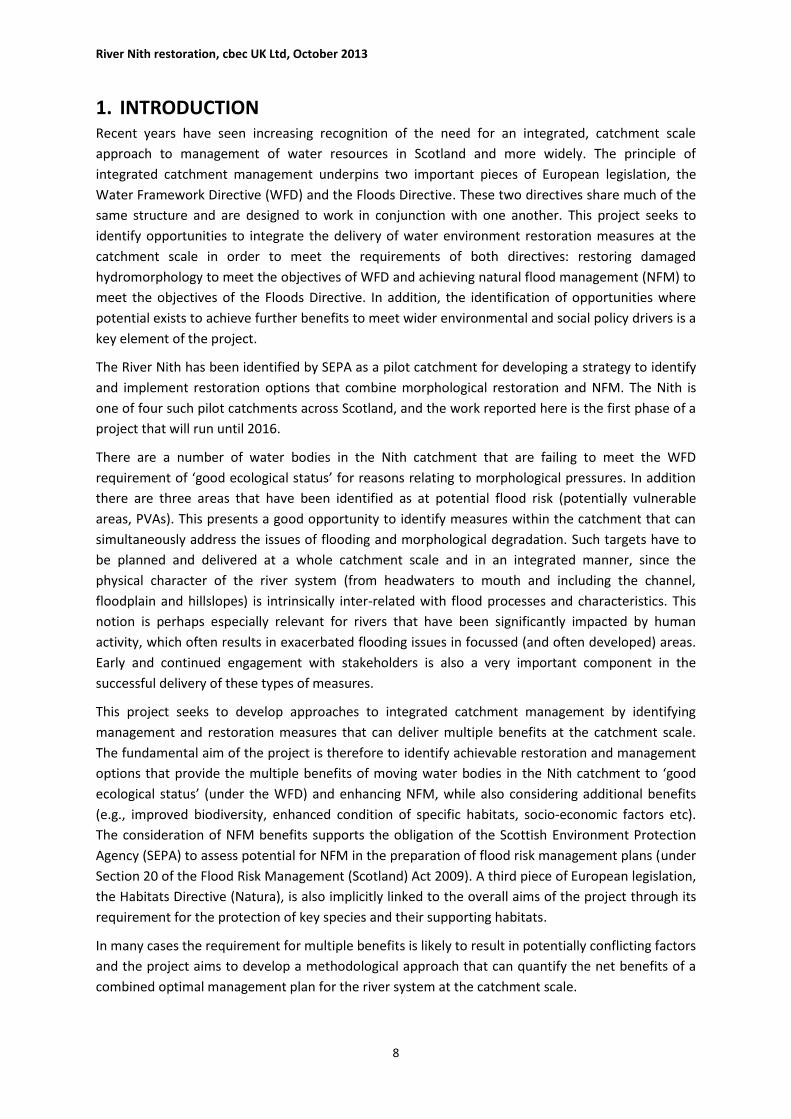
1. INTRODUCTION Recent years have seen increasing recognition of the need for an integrated, catchment scale
approach to management of water resources in Scotland and more widely. The principle of
integrated catchment management underpins two important pieces of European legislation, the
Water Framework Directive (WFD) and the Floods Directive. These two directives share much of the
same structure and are designed to work in conjunction with one another. This project seeks to
identify opportunities to integrate the delivery of water environment restoration measures at the
catchment scale in order to meet the requirements of both directives: restoring damaged
hydromorphology to meet the objectives of WFD and achieving natural flood management (NFM) to
meet the objectives of the Floods Directive. In addition, the identification of opportunities where
potential exists to achieve further benefits to meet wider environmental and social policy drivers is a
key element of the project.
The River Nith has been identified by SEPA as a pilot catchment for developing a strategy to identify
and implement restoration options that combine morphological restoration and NFM. The Nith is
one of four such pilot catchments across Scotland, and the work reported here is the first phase of a
project that will run until 2016.
There are a number of water bodies in the Nith catchment that are failing to meet the WFD
requirement of ‘good ecological status’ for reasons relating to morphological pressures. In addition
there are three areas that have been identified as at potential flood risk (potentially vulnerable
areas, PVAs). This presents a good opportunity to identify measures within the catchment that can
simultaneously address the issues of flooding and morphological degradation. Such targets have to
be planned and delivered at a whole catchment scale and in an integrated manner, since the
physical character of the river system (from headwaters to mouth and including the channel,
floodplain and hillslopes) is intrinsically inter-related with flood processes and characteristics. This
notion is perhaps especially relevant for rivers that have been significantly impacted by human
activity, which often results in exacerbated flooding issues in focussed (and often developed) areas.
Early and continued engagement with stakeholders is also a very important component in the
successful delivery of these types of measures.
This project seeks to develop approaches to integrated catchment management by identifying
management and restoration measures that can deliver multiple benefits at the catchment scale.
The fundamental aim of the project is therefore to identify achievable restoration and management
options that provide the multiple benefits of moving water bodies in the Nith catchment to ‘good
ecological status’ (under the WFD) and enhancing NFM, while also considering additional benefits
(e.g., improved biodiversity, enhanced condition of specific habitats, socio-economic factors etc).
The consideration of NFM benefits supports the obligation of the Scottish Environment Protection
Agency (SEPA) to assess potential for NFM in the preparation of flood risk management plans (under
Section 20 of the Flood Risk Management (Scotland) Act 2009). A third piece of European legislation,
the Habitats Directive (Natura), is also implicitly linked to the overall aims of the project through its
requirement for the protection of key species and their supporting habitats.
In many cases the requirement for multiple benefits is likely to result in potentially conflicting factors
and the project aims to develop a methodological approach that can quantify the net benefits of a
combined optimal management plan for the river system at the catchment scale.
River Nith restoration, cbec UK Ltd, October 2013
9
1.1 APPROACH The project takes a whole river (catchment-scale) approach that considers the detrimental physical
modifications to geomorphic and flood generation/propagation (i.e., hydrologic) processes over a
range of timescales. By linking this to strategic planning and working closely with stakeholders, we
stand a much better chance of both improving the quality of the water environment and reducing
flood risk. In order to work effectively at the catchment scale, the project uses a spatially nested
methodology whereby data synthesis and interpretation at broad scales are used to inform and
direct the assessment of process at relatively high spatial resolutions. In turn this ensures that
individual interventions at specific sites are designed so that they will be integrated into the long-
term, catchment-wide vision for the river. These ‘process based’ interventions will contribute to
more natural system physical (geomorphic) and flood (hydrologic) functioning and ensure that the
benefits can be maintained with minimal intervention over the long term. A further fundamental
principle is that re-establishing the natural physical functioning of the river will also result in the
improvement in the extent and quality of the ecology/ habitat which, in turn, will lead to a general
improvement in the condition of its biota.
The initial stages of the study are concerned with developing a detailed understanding of the
geomorphic and hydrological processes operating within the River Nith system and on
understanding the artificial impacts to physical process and on the natural flood regime. This
information is used as the basis for development of morphological restoration and NFM options.
These options are then integrated and assessed in terms of their various benefits and costs, using
multi-criteria analysis (MCA) to form prioritised multi-benefit restoration options. The restoration
options put forward are of sufficient detail to allow an objective prioritisation of potential
restoration opportunities across the catchment. However, in depth stakeholder engagement with
land owners and land managers will be critical in order to understand the feasibility of the potential
options and willingness to proceed to implementation. The best environmental options may be the
least acceptable from a social or economic perspective due to the impact on existing land use. This
extensive engagement with land owners/managers comprises phase 2 of the overall project.
Furthermore, detailed, site specific assessments will be required before any projects could proceed
to implementation.
The objectives of the work are as follows:
Compile existing spatial geomorphic data, including data on morphological pressures, into a
GIS and supplement with further field surveys to provide a catchment-scale dataset.
Analyse the nature and distribution of morphological pressures and identify opportunities
for morphological restoration.
Develop an understanding of system-scale geomorphic process and use this information to
help determine physically appropriate morphological restoration options.
Use hydraulic modelling to identify potential locations for NFM within the Nith catchment
and quantify the potential reduction in flooding severity from undertaking NFM measures at
these locations.
Integrate the morphological restoration and NFM opportunities to produce a series of
potential interventions and assess these in terms of benefits to morphology, NFM and
additional factors.

River Nith restoration, cbec UK Ltd, October 2013
10
Provide a series of prioritised restoration options across the Nith catchment that will help
restore water bodies to good ecological status and also deliver a quantifiable reduction in
downstream flood risk through NFM.
Use stakeholder engagement throughout the process to ensure that options take into
account their needs and views, and to determine where opportunities to work with
stakeholders to carry out restoration work may exist.
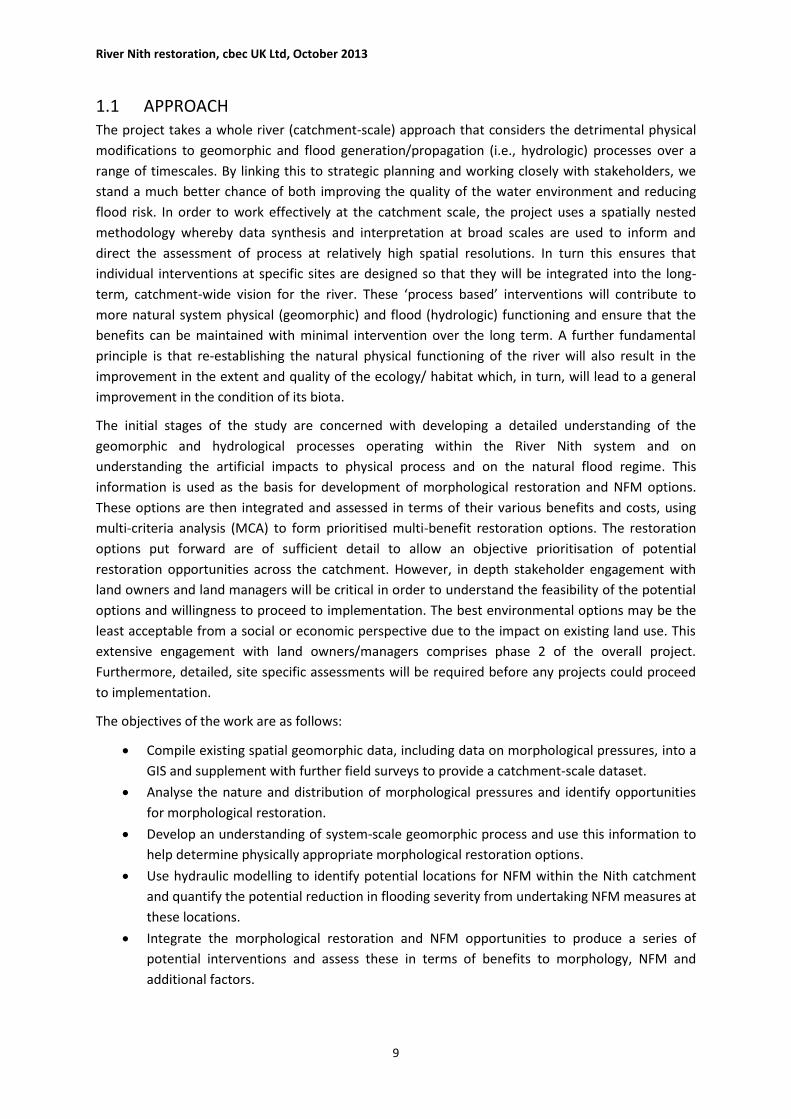
A flow chart mapping out the various stages in the project is shown in Figure 1.1.
This report sets out the approach taken and the information generated at each step of the study, to
show how the resulting restoration options were arrived at. The geomorphic/WFD component of the
assessment is described in Section 2, the hydrological component in Section 3 and stakeholder
engagement in Section 4. Section 5 describes the multi-criteria analysis process used to score and
rank options according to their multiple benefits. Section 6 describes the final prioritisation of
options. A summary of the recommended actions, together with methodological recommendations,
is provided in Section 7.
River Nith restoration, cbec UK Ltd, October 2013
11
Figure 1.1 Flow chart illustrating the stages of work in the project
1.2 CATCHMENT OVERVIEW This section provides an overview of the catchment characteristics, derived from a brief literature
and data review, to give context to the following sections of the report.
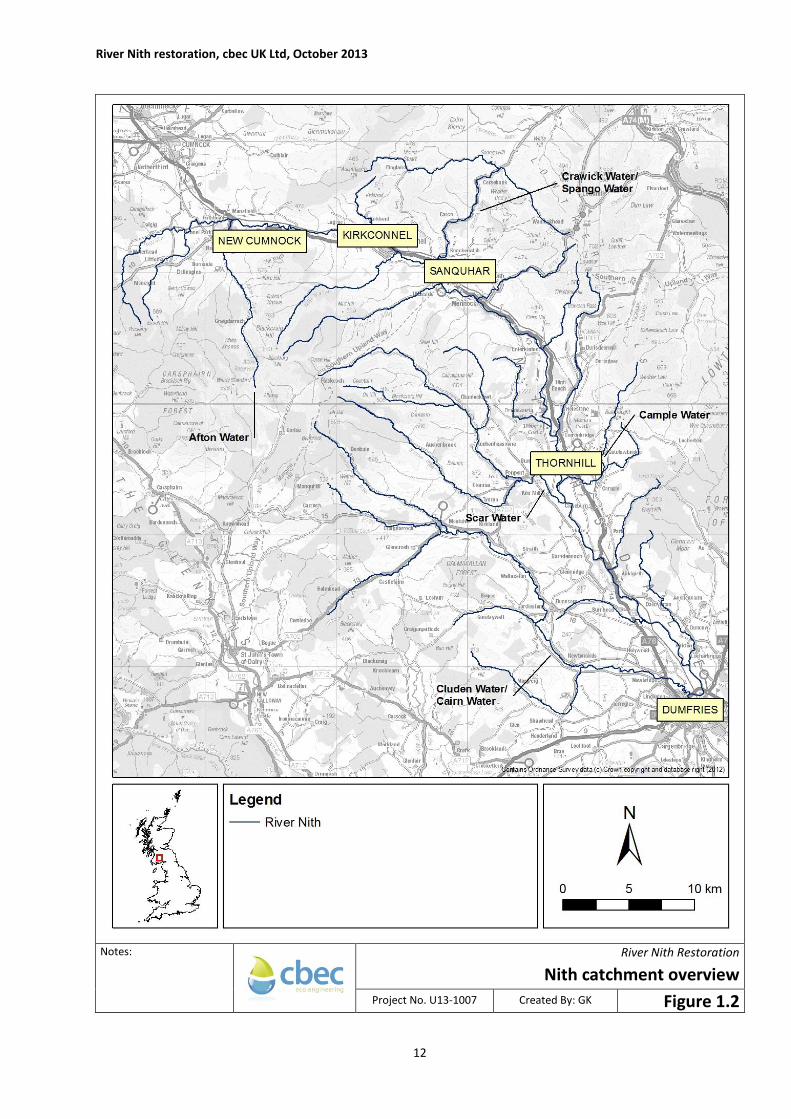
The River Nith is the largest river in south west Scotland, its catchment covering an area of
approximately 1,230 km2. The Nith rises in the hills of East Ayrshire, an area known for its industrial
landscape and coal mining. The catchment extends east to the Lowther Hills and south to the Solway
Firth, into which the Nith discharges (Figure 1.2). At the lowest gauging station in the catchment
(Nith at Friars Carse) mean flow between 1959 and 2012 was 27.9 m3 s-1 (CEH, 2013). Appendix G
shows the location of SEPA’s river gauging stations and raingauges.
Exp
ert
jud
gem
en
t
Short list of
ranked restoration
opportunities
Multi-Criteria
Analysis
Identification and
evaluation of NFM
opportunities
Identification and
evaluation of
morphological restoration
opportunities
Hydrological
assessment
WFD & morphology
assessments
Evaluation of
ecological
benefits /
constraints
Evaluation of
socio-economic
benefits /
constraints
River Nith restoration, cbec UK Ltd, October 2013
12
Notes:
River Nith Restoration
Nith catchment overview
Project No. U13-1007 Created By: GK Figure 1.2

River Nith restoration, cbec UK Ltd, October 2013
13
1.2.1 Geology
The bedrock geology is a mix of sandstones, mudstone and breccias with some coal measures and
granite, comprising the Hawick Rock, Gala Group, Kirkcolm Formation, Stewartry Group and Scottish
Coal Measures Group.
Glacial and fluvio-glacial deposits (till, sand and gravels) are evident in coastal lowlands and in the
south of the catchment. Glacial gravels are still extracted to the north of Dumfries. Subsequently
alluvium has been laid down by rivers and is evident in much of the catchment and peat has
accumulated as lowland raised bogs and blanket bog in upland areas (many of these areas are now
designated).
There is a nationally important aquifer in the Permian sandstone under Dumfries and a smaller
aquifer also in Permian sedimentary rocks under Thornhill.
Fissure flow dominates in these aquifers which as a result have high yields. The Dumfries aquifer is
considered one of the most important and exploited in Scotland, with water being extracted for
public potable supply, industry and private consumption.
The groundwater within the Dumfries aquifer has been found to have elevated levels of nitrate and
therefore the region between Thornhill and Dumfries has been designated as a Nitrate and Nitrate
Vulnerable Zones (NVZs) to help protect this valuable and vulnerable water resource.
1.2.2 Soil
The soils are dominated by Brown Earths, Peats and Non-calcareous Mineral Gleys generally
reflecting the geology and surface process. The sandstones, silts and shales in upland areas in the
north of the catchment (the Southern Uplands) have eroded to form thin and poor soils with
occasional nutrient rich flushes.
The soil map (Appendix G) confirms that semi-confined peats and raised moss peats occur in upland
areas around the watershed of the catchment. Blanket peats are limited to the south east of the
catchment.
Freely drained brown earths and humus-iron podzols with some subalpine podzols are prevalent in
valley bottoms and in particular the floodplain of main Nith.
The Hydrology of Soil Types (HOST) is highly relevant to this study as it is a classification based on
conceptual models of the processes that occur in the soil and, where appropriate, the substrate. The
resulting scheme has 29 categories and is available as a 1 km grid.
1.2.3 Land cover
The Land Cover Map for the Nith catchment can be seen in Appendix G showing the proportion of
each land cover type for the catchment. The catchment is predominately rural, with the dominant
land cover types for the catchment being improved grassland, acid grasslands, coniferous woodland,
heather grasslands and arable and horticulture. The dominant land cover type for the north of the
catchment is dominated by acid grasslands, and the south of the catchment by improved grassland
and arable and horticulture.
River Nith restoration, cbec UK Ltd, October 2013
14
1.2.4 Climate
1.2.4.1 Temperature, sunshine and wind
The climate of the catchment is heavily influenced by the Gulf Stream which is reflected by the small
temperature range of about 9oC. July and August are the warmest months in the region with mean
daily maxima ranging from about 14 °C on the highest ground to more than 18 °C in lower elevations
to the south.
Wind strength and direction are associated with the passage of deep Atlantic depressions close to or
across the region. Depressions are generally stronger in winter. The predominant wind directions are
from the south and south-west during the passage of a depression.
1.2.4.2 Rainfall
The catchment has Standard Average Annual Rainfall (SAAR 1961-90) of 1,429 mm. This varies
spatially across the catchment as can be seen by the rainfall contour map shown in Appendix G. The
pattern of SAAR across the catchment is influenced by the dominant wind direction and the relief of
the catchment with higher rainfall totals in the upper Nithsdale (1,600 – 2,000 mm) and lower
rainfall totals at the coast (1,000 mm).
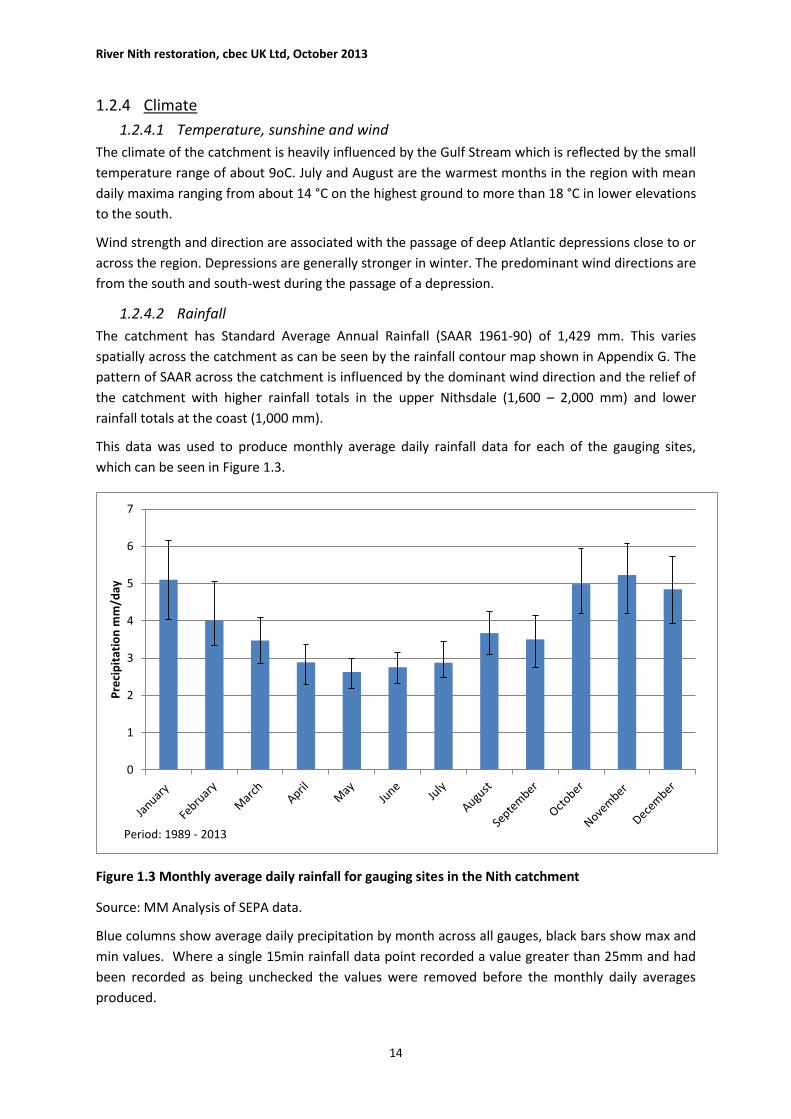
This data was used to produce monthly average daily rainfall data for each of the gauging sites,
which can be seen in Figure 1.3.
Figure 1.3 Monthly average daily rainfall for gauging sites in the Nith catchment
Source: MM Analysis of SEPA data.
Blue columns show average daily precipitation by month across all gauges, black bars show max and
min values. Where a single 15min rainfall data point recorded a value greater than 25mm and had
been recorded as being unchecked the values were removed before the monthly daily averages
produced.
0
1
2
3
4
5
6
7
Pre
cip
itat
ion
mm
/day
Period: 1989 - 2013

River Nith restoration, cbec UK Ltd, October 2013
15
The wettest months are November (6.1 to 4.2 mm/day) and January (3.2 to 2.3 mm/day). Of the five
sites Craigdarroch is the wettest with an average daily rainfall total of 4.5 mm/day and
Gatelawbridge the driest with an average daily total rainfall total of 3.1 mm/day.
The records reflect the rainfall gradient as shown in Appendix G. Craigdarroch is located in the upper
reaches of the Cairn Water some 4 km west of Moniaive at an elevation of approximately 160 m
while Gatelawbridge is located in the east of the catchment some 2.8 km east of Thornhill at an
elevation of 120 m.
Of the five rainfall gauge site Eliock has the longest record, with recorded data from August 1985 to
March 2013, a time series plot of annual precipitation data is shown in Figure 1.4. This shows that
there is variation in yearly precipitation. The change near the start of the period is due to a period of
missing data between 1/12/1986 and 02/06/1987.
Figure 1.4 Annual Precipitation time series for Eliock gauging site
Source: MM Analysis of SEPA Data.
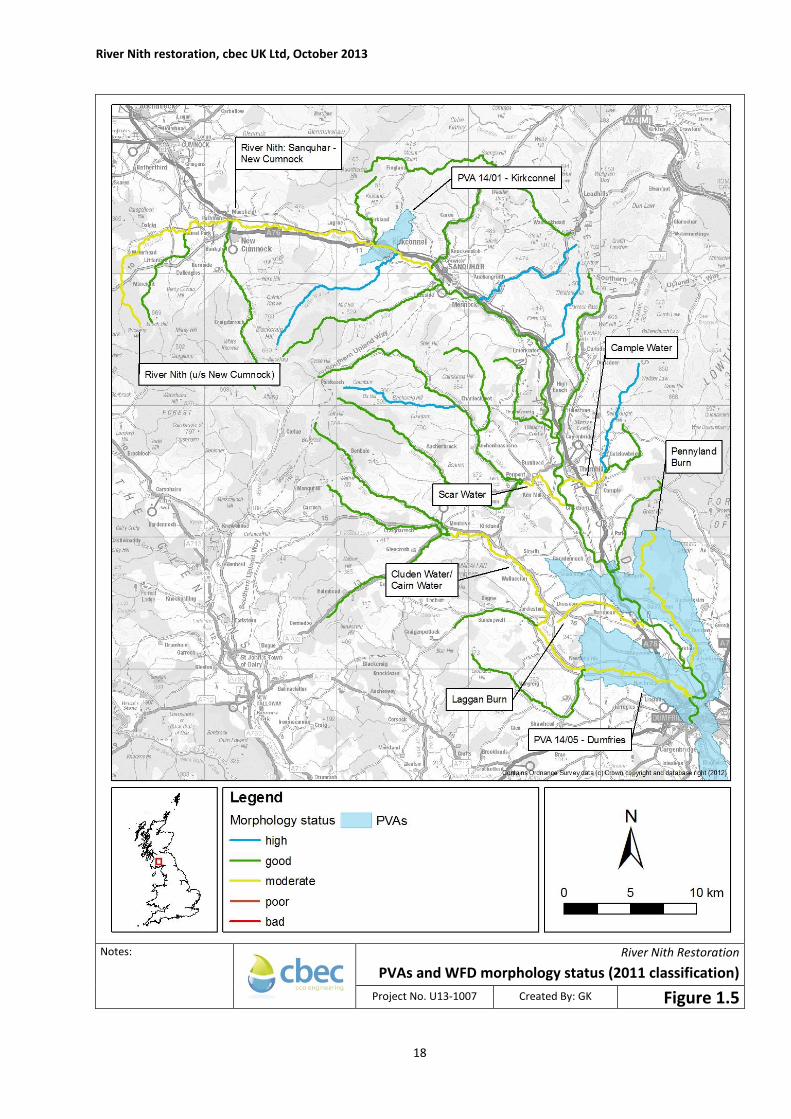
1.2.5 Morphological pressures
Pressures on the morphology and associated physical processes of rivers within the Nith catchment
are widespread, with seven water bodies predicted to be below ‘good ecological status’ in terms of
morphology in July 2011 (Figure 1.5) (further water body downgrades were recommended following
the field surveys carried out in this project). Significant pressures include embankments and, to a
lesser extent, realignment, which have typically been constructed to reclaim and protect agricultural
land. Opencast coal mining in the upper part of the catchment, around New Cumnock, has had a
profound impact on the landscape and hydrological processes. The upper Nith to the west of New
Cumnock (Nith upstream of New Cumnock water body) has been diverted three times (in 2000, 2004
and 2012), with a further diversion is planned for 2014, to allow mining to take place. Lead mining in
the north east of the catchment, around Wanlockhead has also impacted the physical process of
0
200
400
600
800
1000
1200
1400
1600
1800
2000
19
85
19
87
19
89
19
91
19
93
19
95
19
97
19
99
20
01
20
03
20
05
20
07
20
09
20
11
An
nu
al R
ain
fall
(mm
)
Year
River Nith restoration, cbec UK Ltd, October 2013
16
tributaries of the Nith. Morphological pressures in the Nith catchment are discussed in detail in
Section 2.
1.2.6 Flooding
There is a long history of flooding in many areas within the Nith catchment. Much of this is
documented in the Whitesands Flood Risk Appraisal and is summarised here.
The town centre of Dumfries is flooded regularly with a frequency of more than once per year.
Extreme events been recorded in 1962, 1977 and 1982. More recently in January 2013 parts of the
town centre experienced flooding after heavy rain melted snow causing the river to breach its banks,
flooding hundreds of acres of farmland, and several pubs and shops1. A number of communities are
at risk from flooding which includes; communities of Kirkconnel and Kellohom, Dumfries town and
Dumfries coastal communities with total estimated annual average damages of £4 - £5.39 million
(Invitation to tender for restoration and flood management project no.1, River Nith, Tender Ref.
R12100PUR).
In December 2006, Jacobs were commissioned by Dumfries and Galloway Council to undertake a
Flood Risk Appraisal (FRA) of the Nith catchment to enable Dumfries and Galloway Council to make
an informed decision about the appropriate level of flood mitigation works required to tackle the
effects of flooding at the Whitesands, Greensands and Mill Green.
The report looked at a number of flood mitigation options including: online and offline upstream
storage and land use management, construction of an upstream dam, direct defences, local
demountable defences and combinations of these options. Jacobs recommended the
implementation of a combined system, allowing the breaching of existing embankments between
Friars Carse and Dalscone and the construction of direct defences in Dumfries town centre.
While the FRA took a catchment approach to managing flood risk, the study was focussed on
flooding in the Whitesands, Greensands and Mill Green areas and took no account of flooding
elsewhere in the catchment or linkages with morphology and other environmental factors.
Following the enactment of the Flood Management (Scotland) Act 2009 SEPA carried out a National
Flood Risk Assessment (NFRA). The purpose being to identify Potentially Vulnerable Areas (PVAs)
that would then be subjected to further study and ultimately leading to flood management plans.
There are two potentially vulnerable areas (PVAs) within the Nith catchment (Table 1.1, Figure 1.5).
The smallest of the two PVAs (14/01) is located near Kirkconnel, Dumfries and Galloway. It covers an
area of 6.22 km2, with 15% of the land cover urban, 57% agriculture and 27% forestry. A number of
residential properties are at risk, with infrequent reports of flooding in the area between 1932 and
2006, and estimated weighted annual average damages of £280,000 - £330,000. Within this PVA
there is already some form of flood defence (SEPA, Local Plan Districts and PVA). SEPA report that
the area is at risk from surface water and fluvial (i.e. river) flooding (12% and 88% respectively).
The second PVA is located in the Dumfries area (14/05); it covers an area of 115.96 km2, with 7% of
the land cover being urban, 74% agriculture and 15% forestry. There is potential risk to a large
number of residential properties, minor transport links, high grade agriculture land, limited risk to
1 http://www.heraldscotland.com/news/home-news/flooding-hotspot-hit-again-as-snow-melts.20022291

River Nith restoration, cbec UK Ltd, October 2013
17
less resilient environmental designated areas and to extensive areas of sensitive designated sites.
Reports of flooding in the area are infrequent with estimated weighted annual average damages
£4,070,000 - £5,390,000. Within the PVA there is currently no form of flood defence (SEPA, Local
Plan Districts and PVA). SEPA report that the known sources of flooding are surface water (19%),
coastal (15%) and fluvial (66%).
Table 1.1 PVA summary
PVA* Area Predominant land cover
Weighted annual damages Predominant source of flooding
14/01-Kirkconnel 6.22 km2 Agriculture £280,000-£330,000 Fluvial
14/05-Dumfries 115.96 km2 Agriculture £4,070,000 - £5,390,000 Fluvial
*Further details available at http://www.sepa.org.uk/flooding/flood_risk_management/national_flood_risk_assessment/datasheets.aspx
1.2.7 Strategic planning
There is now a strategic framework for managing the catchment in a way that reflects the economic,
social and environmental value of the Nith Catchment. This includes:
The River Nith Catchment Management Plan
The Dumfries and Galloway Local Biodiversity Action Plan (LBAP)
The Natural Heritage Futures for Western Southern Uplands and Inner Solway
The River Nith Catchment Fishery Management Plan
The Solway Tweed River Basin Management Plan
Dumfries and Galloway Structure Plan
River Nith restoration, cbec UK Ltd, October 2013
18
Notes:
River Nith Restoration
PVAs and WFD morphology status (2011 classification)
Project No. U13-1007 Created By: GK Figure 1.5
River Nith restoration, cbec UK Ltd, October 2013
19
2. GEOMORPHIC ASSESSMENT This section covers the element of the project that addresses the morphological pressures within the
Nith catchment. The initial sub-sections below describe the geomorphic characterisation and
quantification of morphological pressures within the Nith. This leads on to identification of
restoration opportunities and assessment of their potential benefits in terms of improvements to
WFD status for morphology. In the last sub-section catchment-scale analysis of geomorphic process
is used to give a greater understanding of system functioning. This provides further process-based
information to support the selection of geomorphically appropriate and effective restoration
options.
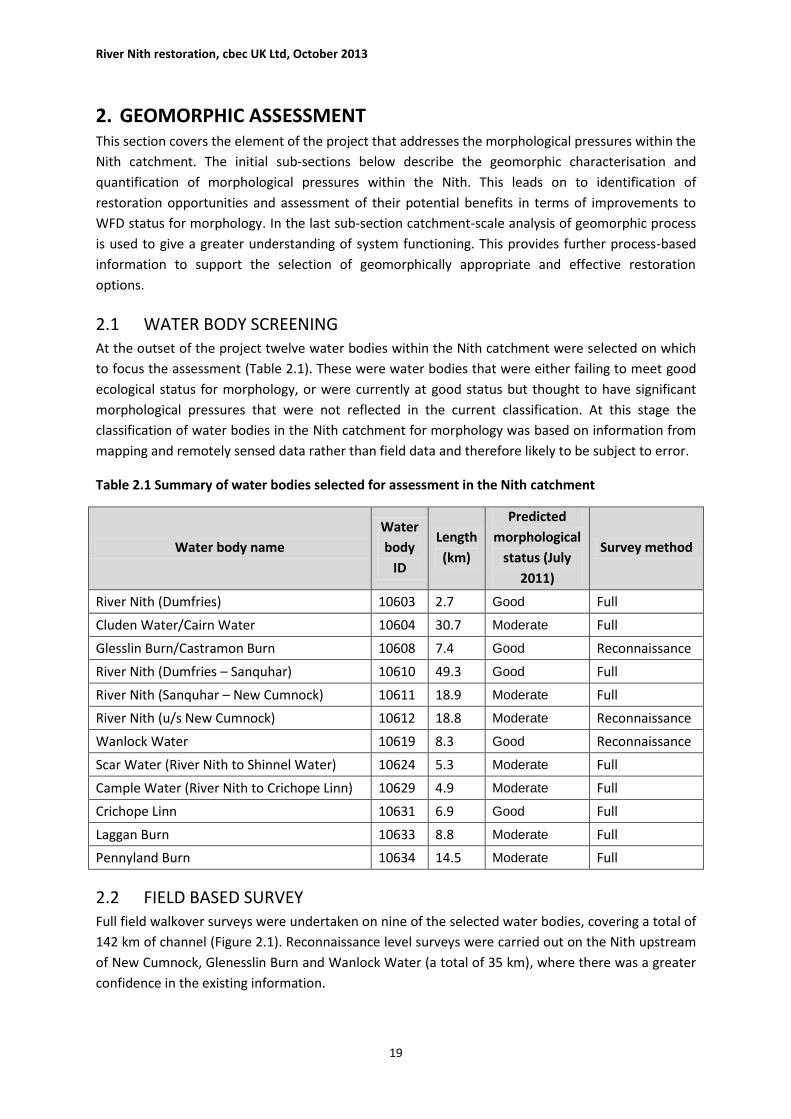
2.1 WATER BODY SCREENING At the outset of the project twelve water bodies within the Nith catchment were selected on which
to focus the assessment (Table 2.1). These were water bodies that were either failing to meet good
ecological status for morphology, or were currently at good status but thought to have significant
morphological pressures that were not reflected in the current classification. At this stage the
classification of water bodies in the Nith catchment for morphology was based on information from
mapping and remotely sensed data rather than field data and therefore likely to be subject to error.
Table 2.1 Summary of water bodies selected for assessment in the Nith catchment
Water body name
Water
body
ID
Length
(km)
Predicted
morphological
status (July
2011)
Survey method
River Nith (Dumfries) 10603 2.7 Good Full
Cluden Water/Cairn Water 10604 30.7 Moderate Full
Glesslin Burn/Castramon Burn 10608 7.4 Good Reconnaissance
River Nith (Dumfries – Sanquhar) 10610 49.3 Good Full
River Nith (Sanquhar – New Cumnock) 10611 18.9 Moderate Full
River Nith (u/s New Cumnock) 10612 18.8 Moderate Reconnaissance
Wanlock Water 10619 8.3 Good Reconnaissance
Scar Water (River Nith to Shinnel Water) 10624 5.3 Moderate Full
Cample Water (River Nith to Crichope Linn) 10629 4.9 Moderate Full
Crichope Linn 10631 6.9 Good Full
Laggan Burn 10633 8.8 Moderate Full
Pennyland Burn 10634 14.5 Moderate Full
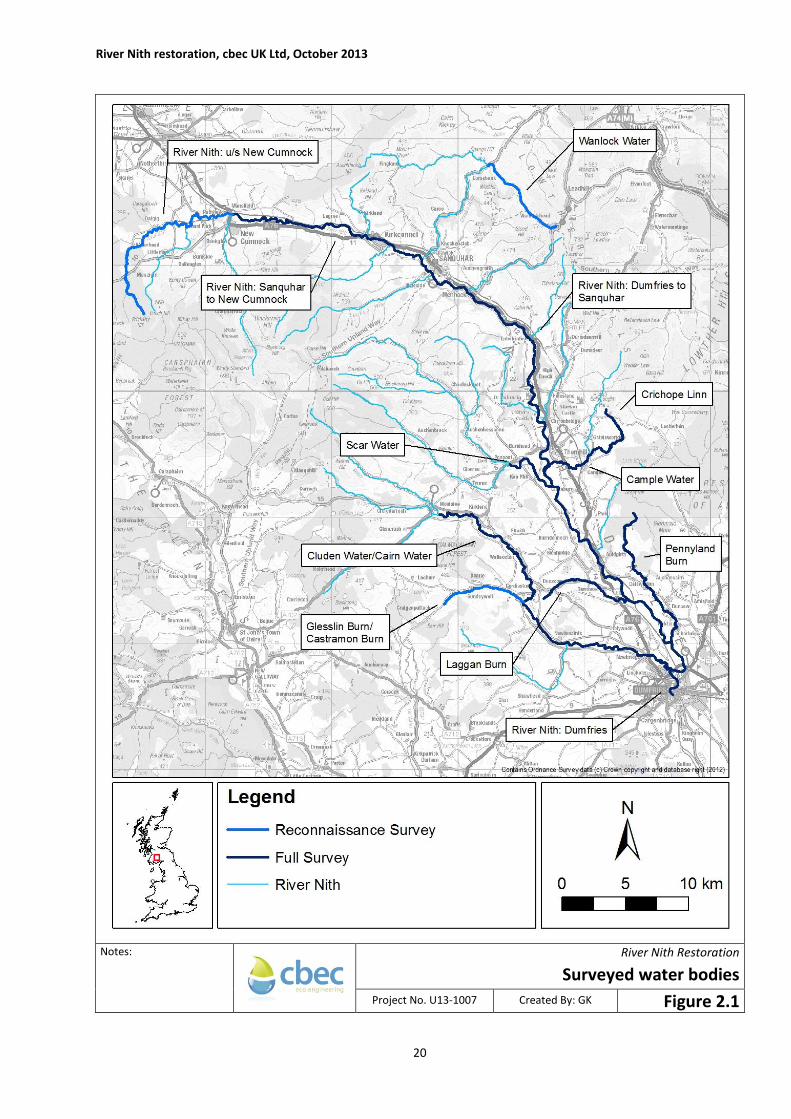
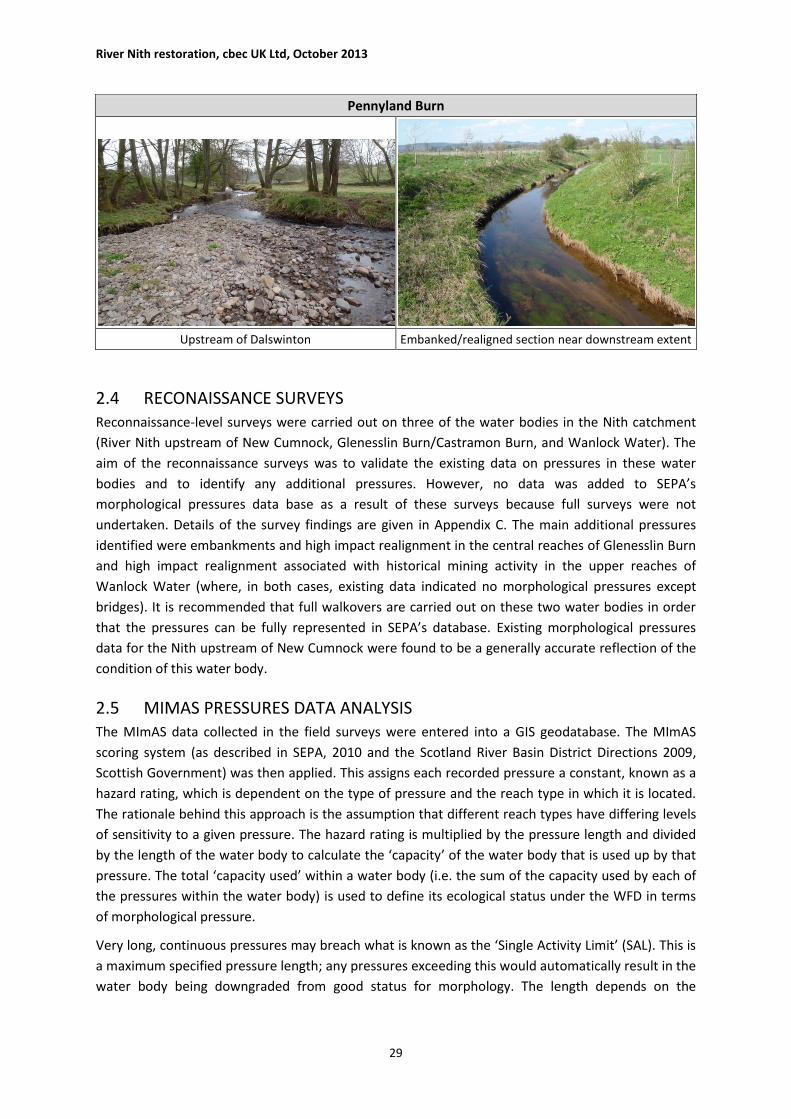
2.2 FIELD BASED SURVEY Full field walkover surveys were undertaken on nine of the selected water bodies, covering a total of
142 km of channel (Figure 2.1). Reconnaissance level surveys were carried out on the Nith upstream
of New Cumnock, Glenesslin Burn and Wanlock Water (a total of 35 km), where there was a greater
confidence in the existing information.
River Nith restoration, cbec UK Ltd, October 2013
20
Notes:
River Nith Restoration
Surveyed water bodies
Project No. U13-1007 Created By: GK Figure 2.1
River Nith restoration, cbec UK Ltd, October 2013
21
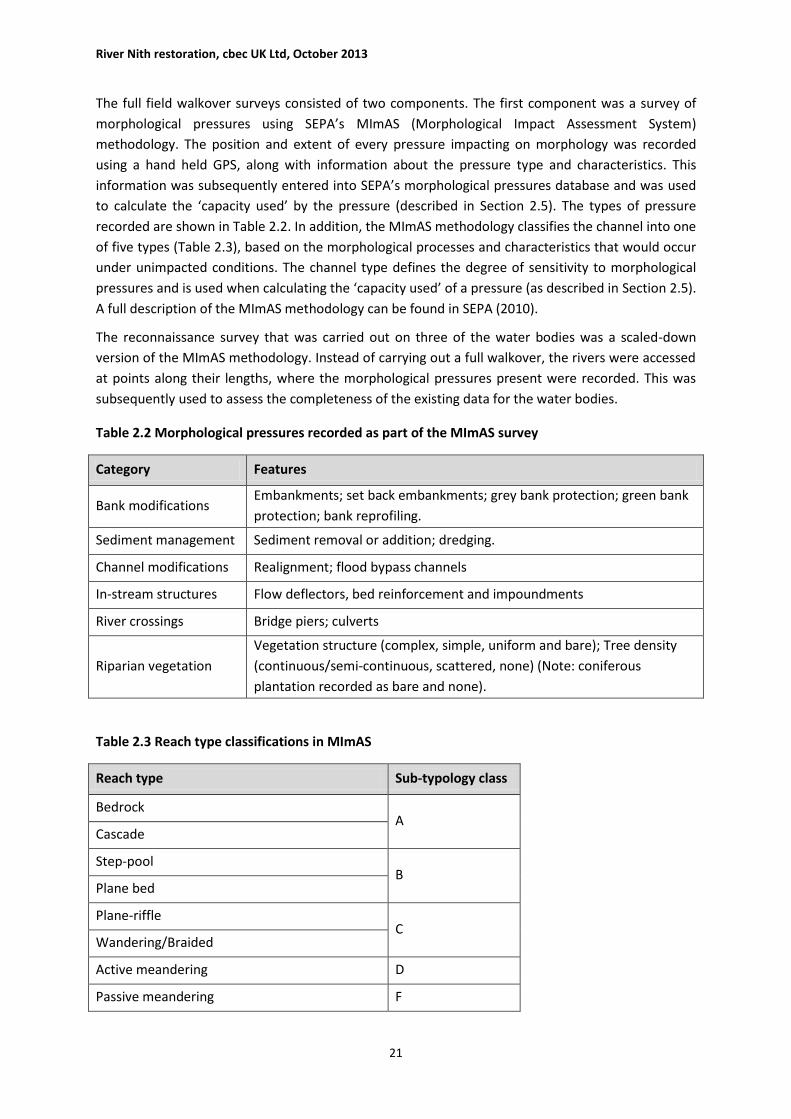
The full field walkover surveys consisted of two components. The first component was a survey of
morphological pressures using SEPA’s MImAS (Morphological Impact Assessment System)
methodology. The position and extent of every pressure impacting on morphology was recorded
using a hand held GPS, along with information about the pressure type and characteristics. This
information was subsequently entered into SEPA’s morphological pressures database and was used
to calculate the ‘capacity used’ by the pressure (described in Section 2.5). The types of pressure
recorded are shown in Table 2.2. In addition, the MImAS methodology classifies the channel into one
of five types (Table 2.3), based on the morphological processes and characteristics that would occur
under unimpacted conditions. The channel type defines the degree of sensitivity to morphological
pressures and is used when calculating the ‘capacity used’ of a pressure (as described in Section 2.5).
A full description of the MImAS methodology can be found in SEPA (2010).
The reconnaissance survey that was carried out on three of the water bodies was a scaled-down
version of the MImAS methodology. Instead of carrying out a full walkover, the rivers were accessed
at points along their lengths, where the morphological pressures present were recorded. This was
subsequently used to assess the completeness of the existing data for the water bodies.
Table 2.2 Morphological pressures recorded as part of the MImAS survey
Category Features
Bank modifications Embankments; set back embankments; grey bank protection; green bank
protection; bank reprofiling.
Sediment management Sediment removal or addition; dredging.
Channel modifications Realignment; flood bypass channels
In-stream structures Flow deflectors, bed reinforcement and impoundments
River crossings Bridge piers; culverts
Riparian vegetation
Vegetation structure (complex, simple, uniform and bare); Tree density
(continuous/semi-continuous, scattered, none) (Note: coniferous
plantation recorded as bare and none).
Table 2.3 Reach type classifications in MImAS
Reach type Sub-typology class
Bedrock A
Cascade
Step-pool B
Plane bed
Plane-riffle C
Wandering/Braided
Active meandering D
Passive meandering F
River Nith restoration, cbec UK Ltd, October 2013
22
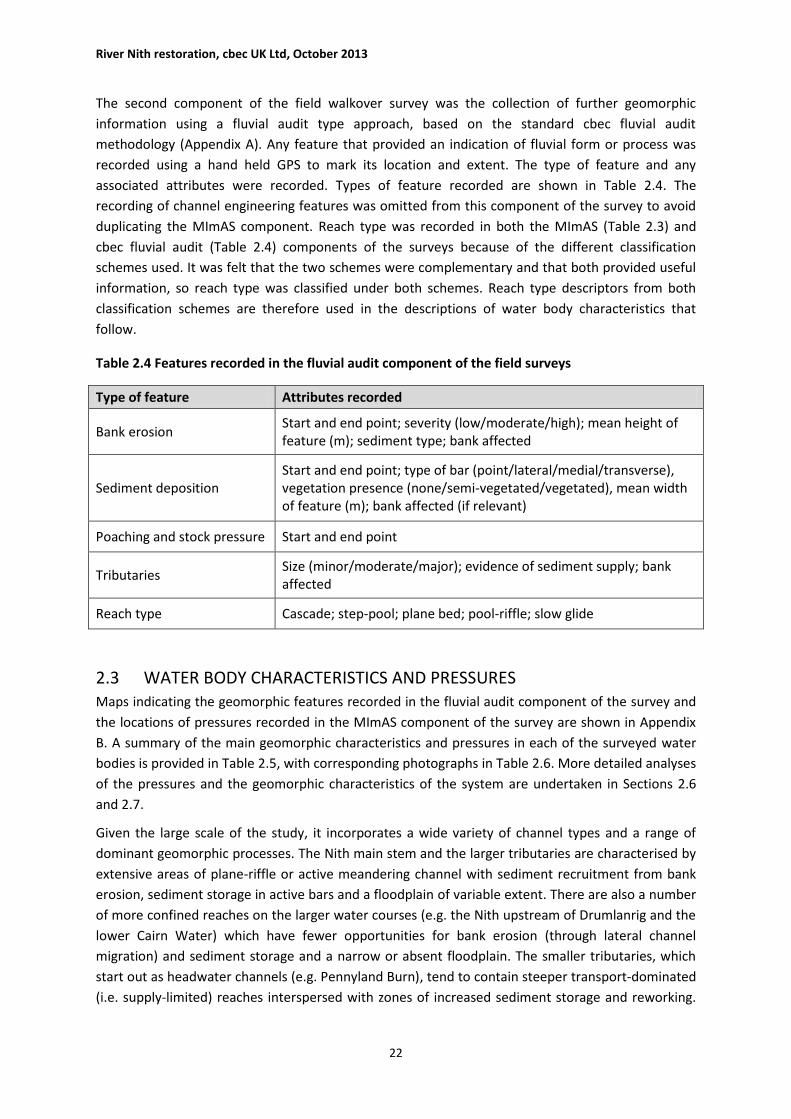
The second component of the field walkover survey was the collection of further geomorphic
information using a fluvial audit type approach, based on the standard cbec fluvial audit
methodology (Appendix A). Any feature that provided an indication of fluvial form or process was
recorded using a hand held GPS to mark its location and extent. The type of feature and any
associated attributes were recorded. Types of feature recorded are shown in Table 2.4. The
recording of channel engineering features was omitted from this component of the survey to avoid
duplicating the MImAS component. Reach type was recorded in both the MImAS (Table 2.3) and
cbec fluvial audit (Table 2.4) components of the surveys because of the different classification
schemes used. It was felt that the two schemes were complementary and that both provided useful
information, so reach type was classified under both schemes. Reach type descriptors from both
classification schemes are therefore used in the descriptions of water body characteristics that
follow.
Table 2.4 Features recorded in the fluvial audit component of the field surveys
Type of feature Attributes recorded
Bank erosion Start and end point; severity (low/moderate/high); mean height of feature (m); sediment type; bank affected
Sediment deposition Start and end point; type of bar (point/lateral/medial/transverse), vegetation presence (none/semi-vegetated/vegetated), mean width of feature (m); bank affected (if relevant)
Poaching and stock pressure Start and end point
Tributaries Size (minor/moderate/major); evidence of sediment supply; bank affected
Reach type Cascade; step-pool; plane bed; pool-riffle; slow glide
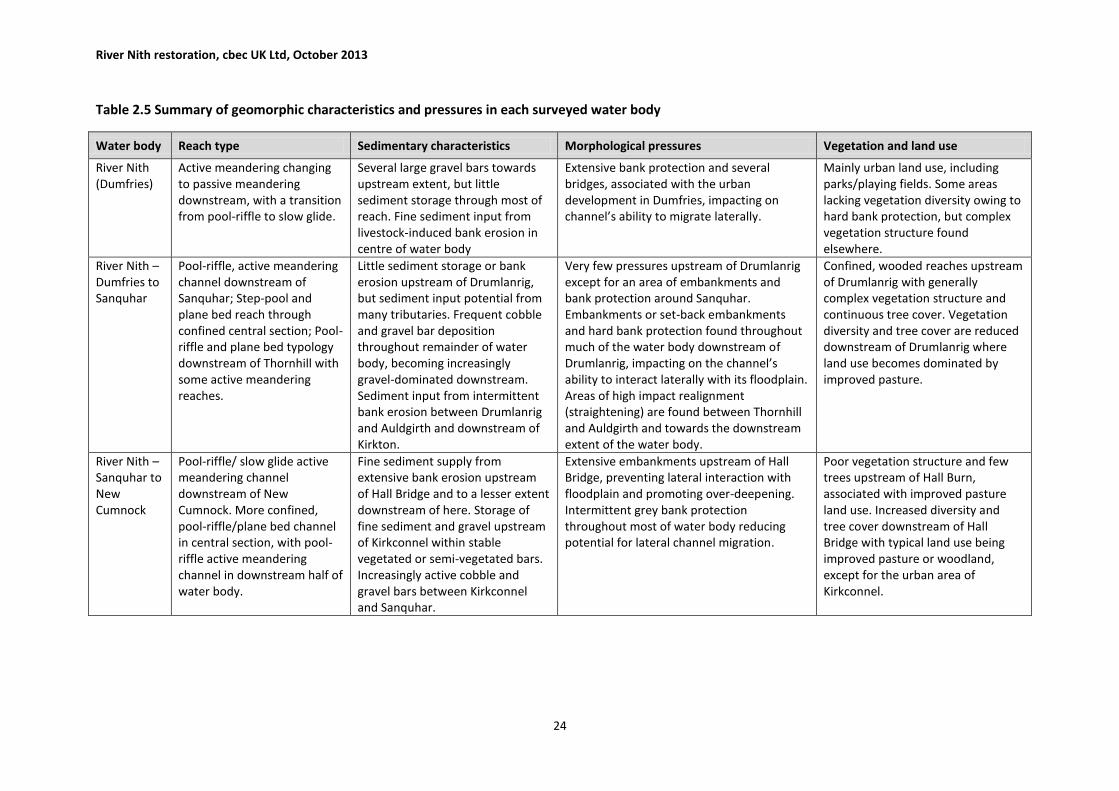
2.3 WATER BODY CHARACTERISTICS AND PRESSURES Maps indicating the geomorphic features recorded in the fluvial audit component of the survey and
the locations of pressures recorded in the MImAS component of the survey are shown in Appendix
B. A summary of the main geomorphic characteristics and pressures in each of the surveyed water
bodies is provided in Table 2.5, with corresponding photographs in Table 2.6. More detailed analyses
of the pressures and the geomorphic characteristics of the system are undertaken in Sections 2.6
and 2.7.
Given the large scale of the study, it incorporates a wide variety of channel types and a range of
dominant geomorphic processes. The Nith main stem and the larger tributaries are characterised by
extensive areas of plane-riffle or active meandering channel with sediment recruitment from bank
erosion, sediment storage in active bars and a floodplain of variable extent. There are also a number
of more confined reaches on the larger water courses (e.g. the Nith upstream of Drumlanrig and the
lower Cairn Water) which have fewer opportunities for bank erosion (through lateral channel
migration) and sediment storage and a narrow or absent floodplain. The smaller tributaries, which
start out as headwater channels (e.g. Pennyland Burn), tend to contain steeper transport-dominated
(i.e. supply-limited) reaches interspersed with zones of increased sediment storage and reworking.

River Nith restoration, cbec UK Ltd, October 2013
23
There is typically a distinct change in form and process when the tributary reaches the much lower
gradient of the Nith floodplain.
It is evident that embankments are a prevalent pressure in the lower half of the Nith main stem as
well as parts of all other surveyed water bodies. Hard bank protection is also widespread and often
tends to be associated with embankments. Together, these types of pressure have the effect of
preventing the channel interacting laterally with its floodplain. Bank protection reduces the ability of
the channel to erode its banks and migrate laterally, also lowering sediment recruitment rates.
Realignment and straightening were less widespread than embankments, but was found, typically in
combination with embankments, on several reaches of the lower Nith, as well as on Laggan Burn,
Pennyland Burn, Cample Water, Crichope Linn and Cairn Water.
Weirs were not widespread and most recorded were low and having little impact on morphology.
Many of the recorded weirs were associated with old mills and were situated in naturally steeper,
bedrock controlled reaches. Three weirs were found to be having a significant impact on geomorphic
process by creating a barrier to the passage of sediment and/or altering upstream propagation of
incision. These were situated on Pennyland Burn, Laggan Burn and Crichope Linn (Figure 2.2).
Figure 2.2 Significant weirs recorded in the Nith catchment - A: Crichope Linn; B: Laggan Burn; C: Pennyland Burn.
A B
A
C
A
River Nith restoration, cbec UK Ltd, October 2013
24
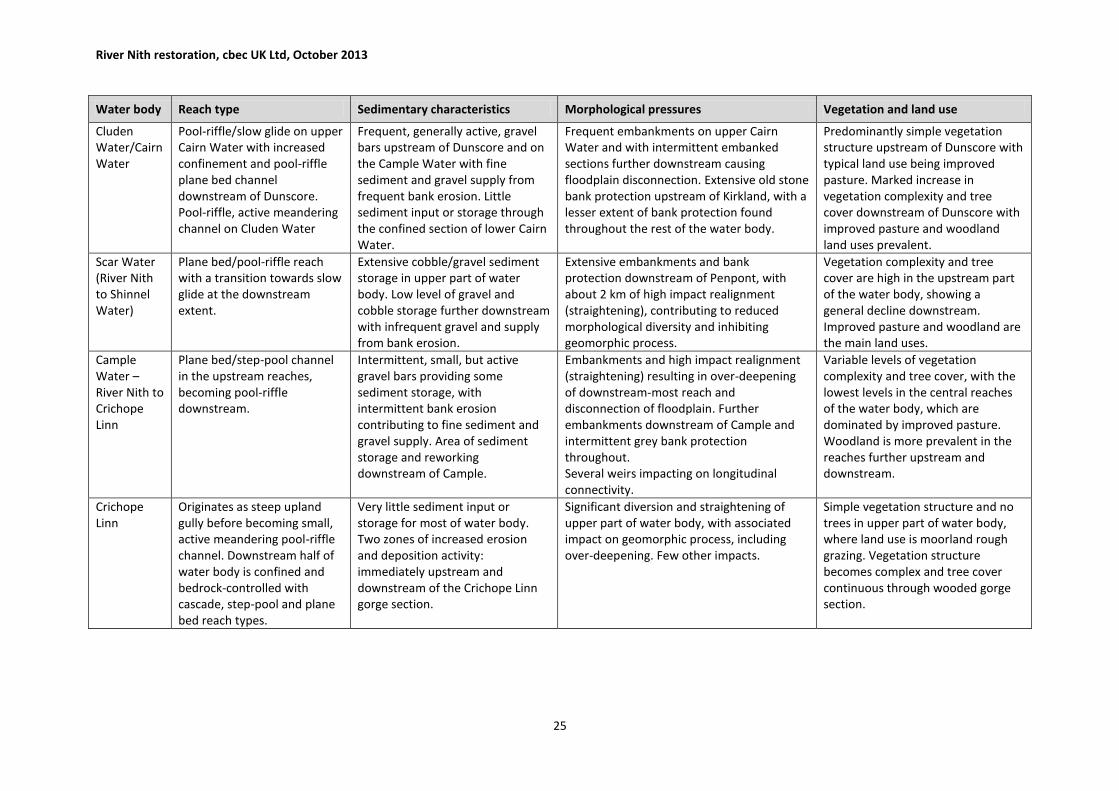
Table 2.5 Summary of geomorphic characteristics and pressures in each surveyed water body
Water body Reach type Sedimentary characteristics Morphological pressures Vegetation and land use
River Nith (Dumfries)
Active meandering changing to passive meandering downstream, with a transition from pool-riffle to slow glide.
Several large gravel bars towards upstream extent, but little sediment storage through most of reach. Fine sediment input from livestock-induced bank erosion in centre of water body
Extensive bank protection and several bridges, associated with the urban development in Dumfries, impacting on channel’s ability to migrate laterally.
Mainly urban land use, including parks/playing fields. Some areas lacking vegetation diversity owing to hard bank protection, but complex vegetation structure found elsewhere.
River Nith – Dumfries to Sanquhar
Pool-riffle, active meandering channel downstream of Sanquhar; Step-pool and plane bed reach through confined central section; Pool-riffle and plane bed typology downstream of Thornhill with some active meandering reaches.
Little sediment storage or bank erosion upstream of Drumlanrig, but sediment input potential from many tributaries. Frequent cobble and gravel bar deposition throughout remainder of water body, becoming increasingly gravel-dominated downstream. Sediment input from intermittent bank erosion between Drumlanrig and Auldgirth and downstream of Kirkton.
Very few pressures upstream of Drumlanrig except for an area of embankments and bank protection around Sanquhar. Embankments or set-back embankments and hard bank protection found throughout much of the water body downstream of Drumlanrig, impacting on the channel’s ability to interact laterally with its floodplain. Areas of high impact realignment (straightening) are found between Thornhill and Auldgirth and towards the downstream extent of the water body.
Confined, wooded reaches upstream of Drumlanrig with generally complex vegetation structure and continuous tree cover. Vegetation diversity and tree cover are reduced downstream of Drumlanrig where land use becomes dominated by improved pasture.
River Nith – Sanquhar to New Cumnock
Pool-riffle/ slow glide active meandering channel downstream of New Cumnock. More confined, pool-riffle/plane bed channel in central section, with pool-riffle active meandering channel in downstream half of water body.
Fine sediment supply from extensive bank erosion upstream of Hall Bridge and to a lesser extent downstream of here. Storage of fine sediment and gravel upstream of Kirkconnel within stable vegetated or semi-vegetated bars. Increasingly active cobble and gravel bars between Kirkconnel and Sanquhar.
Extensive embankments upstream of Hall Bridge, preventing lateral interaction with floodplain and promoting over-deepening. Intermittent grey bank protection throughout most of water body reducing potential for lateral channel migration.
Poor vegetation structure and few trees upstream of Hall Burn, associated with improved pasture land use. Increased diversity and tree cover downstream of Hall Bridge with typical land use being improved pasture or woodland, except for the urban area of Kirkconnel.
River Nith restoration, cbec UK Ltd, October 2013
25
Water body Reach type Sedimentary characteristics Morphological pressures Vegetation and land use
Cluden Water/Cairn Water
Pool-riffle/slow glide on upper Cairn Water with increased confinement and pool-riffle plane bed channel downstream of Dunscore. Pool-riffle, active meandering channel on Cluden Water
Frequent, generally active, gravel bars upstream of Dunscore and on the Cample Water with fine sediment and gravel supply from frequent bank erosion. Little sediment input or storage through the confined section of lower Cairn Water.
Frequent embankments on upper Cairn Water and with intermittent embanked sections further downstream causing floodplain disconnection. Extensive old stone bank protection upstream of Kirkland, with a lesser extent of bank protection found throughout the rest of the water body.
Predominantly simple vegetation structure upstream of Dunscore with typical land use being improved pasture. Marked increase in vegetation complexity and tree cover downstream of Dunscore with improved pasture and woodland land uses prevalent.
Scar Water (River Nith to Shinnel Water)
Plane bed/pool-riffle reach with a transition towards slow glide at the downstream extent.
Extensive cobble/gravel sediment storage in upper part of water body. Low level of gravel and cobble storage further downstream with infrequent gravel and supply from bank erosion.
Extensive embankments and bank protection downstream of Penpont, with about 2 km of high impact realignment (straightening), contributing to reduced morphological diversity and inhibiting geomorphic process.
Vegetation complexity and tree cover are high in the upstream part of the water body, showing a general decline downstream. Improved pasture and woodland are the main land uses.
Cample Water – River Nith to Crichope Linn
Plane bed/step-pool channel in the upstream reaches, becoming pool-riffle downstream.
Intermittent, small, but active gravel bars providing some sediment storage, with intermittent bank erosion contributing to fine sediment and gravel supply. Area of sediment storage and reworking downstream of Cample.
Embankments and high impact realignment (straightening) resulting in over-deepening of downstream-most reach and disconnection of floodplain. Further embankments downstream of Cample and intermittent grey bank protection throughout. Several weirs impacting on longitudinal connectivity.
Variable levels of vegetation complexity and tree cover, with the lowest levels in the central reaches of the water body, which are dominated by improved pasture. Woodland is more prevalent in the reaches further upstream and downstream.
Crichope Linn
Originates as steep upland gully before becoming small, active meandering pool-riffle channel. Downstream half of water body is confined and bedrock-controlled with cascade, step-pool and plane bed reach types.
Very little sediment input or storage for most of water body. Two zones of increased erosion and deposition activity: immediately upstream and downstream of the Crichope Linn gorge section.
Significant diversion and straightening of upper part of water body, with associated impact on geomorphic process, including over-deepening. Few other impacts.
Simple vegetation structure and no trees in upper part of water body, where land use is moorland rough grazing. Vegetation structure becomes complex and tree cover continuous through wooded gorge section.

River Nith restoration, cbec UK Ltd, October 2013
26
Water body Reach type Sedimentary characteristics Morphological pressures Vegetation and land use
Laggan Burn Sections of slow glide/pool-riffle alternating with steeper, pool-riffle/plane bed reaches.
Small alluvial bars and areas of bank erosion found intermittently throughout most of water body, but overall levels of sediment storage and supply are low.
High impact realignment (straightening) of channel through wetland area upstream of Dunscore. Embanked and realigned reach between A76 road bridge and Nith confluence causing over deepened channel and preventing lateral connectivity with floodplain.
Overall moderate levels of vegetation complexity and tree cover, but with marked variations throughout the water body. Improved pasture is the dominant land use, with areas of woodland.
Pennyland Burn
Upper section of water body dominated by step-pool and pool-riffle reach types. Sudden transition to slow glide/pool-riffle as burn flows onto the Nith floodplain.
Moderately high sediment storage in small but frequent active gravel bars upstream of Dalswinton. Little storage downstream of here. Sediment supply from bank erosion found throughout most of water body, but increasing downstream.
In reach downstream of Dalswinton channel realigned to edge of floodplain and embanked, causing over deepening and preventing lateral interaction with floodplain. Realignment/straightening and embankments with associated over deepening and floodplain disconnection between Kirkton and Nith confluence. Intermittent grey bank protection downstream of Dalswinton. Large weir acting as significant sediment and fish barrier upstream of Dalswinton.
Coniferous forestry and rough pasture in upper reaches with poor vegetation structure and little tree cover. Increased woodland in central reaches is associated with increased vegetation complexity and tree cover. Lower reaches are dominated by improved pasture and a corresponding reduction in vegetation complexity and tree cover.

River Nith restoration, cbec UK Ltd, October 2013
27
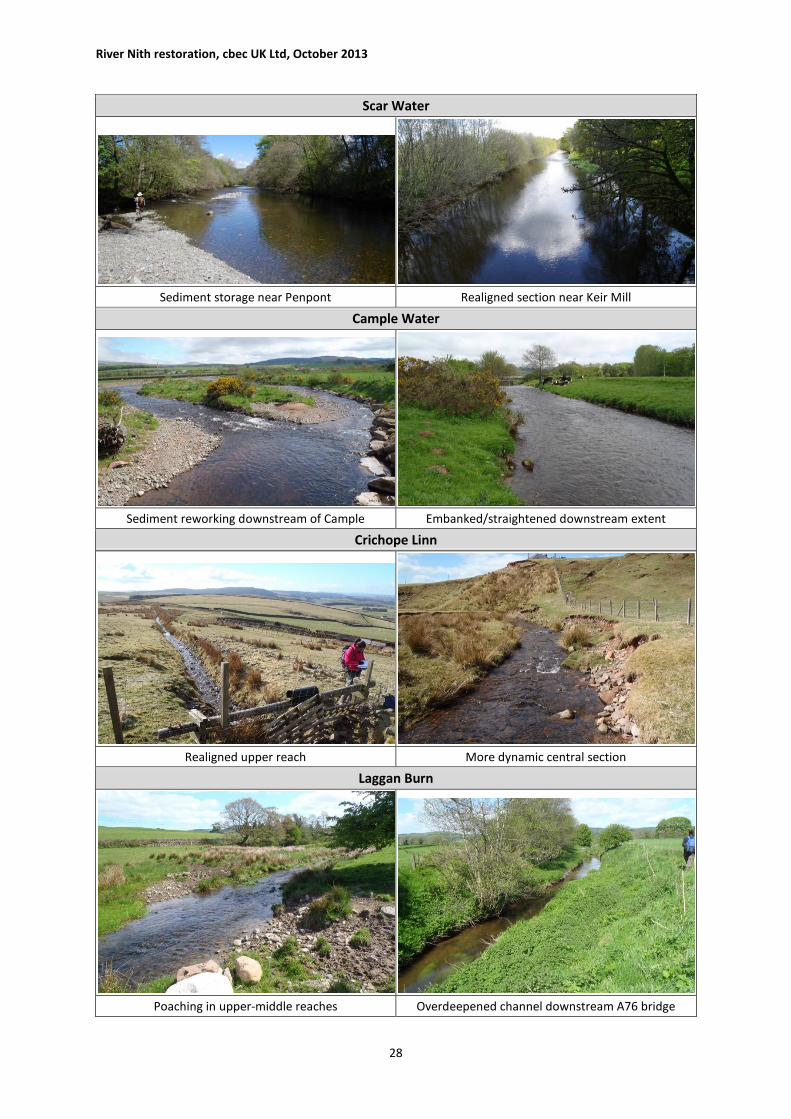
Table 2.6 Images illustrating characteristics of surveyed water bodies
River Nith (Dumfries)
Towards upstream extent Towards downstream extent
River Nith, Dumfries – Sanquhar
Confined section upstream Drumlanrig Bank protection downstream of Thornhill
River Nith, Sanquhar to New Cumnock
Embanked section upstream Hall Bridge Upstream Kirkconnel
Cluden Water/Cairn Water
Upper Cairn Water Central Cluden Water
River Nith restoration, cbec UK Ltd, October 2013
28
Scar Water
Sediment storage near Penpont Realigned section near Keir Mill
Cample Water
Sediment reworking downstream of Cample Embanked/straightened downstream extent
Crichope Linn
Realigned upper reach More dynamic central section
Laggan Burn
Poaching in upper-middle reaches Overdeepened channel downstream A76 bridge
River Nith restoration, cbec UK Ltd, October 2013
29
Pennyland Burn
Upstream of Dalswinton Embanked/realigned section near downstream extent
2.4 RECONAISSANCE SURVEYS Reconnaissance-level surveys were carried out on three of the water bodies in the Nith catchment
(River Nith upstream of New Cumnock, Glenesslin Burn/Castramon Burn, and Wanlock Water). The
aim of the reconnaissance surveys was to validate the existing data on pressures in these water
bodies and to identify any additional pressures. However, no data was added to SEPA’s
morphological pressures data base as a result of these surveys because full surveys were not
undertaken. Details of the survey findings are given in Appendix C. The main additional pressures
identified were embankments and high impact realignment in the central reaches of Glenesslin Burn
and high impact realignment associated with historical mining activity in the upper reaches of
Wanlock Water (where, in both cases, existing data indicated no morphological pressures except
bridges). It is recommended that full walkovers are carried out on these two water bodies in order
that the pressures can be fully represented in SEPA’s database. Existing morphological pressures
data for the Nith upstream of New Cumnock were found to be a generally accurate reflection of the
condition of this water body.
2.5 MIMAS PRESSURES DATA ANALYSIS The MImAS data collected in the field surveys were entered into a GIS geodatabase. The MImAS
scoring system (as described in SEPA, 2010 and the Scotland River Basin District Directions 2009,
Scottish Government) was then applied. This assigns each recorded pressure a constant, known as a
hazard rating, which is dependent on the type of pressure and the reach type in which it is located.
The rationale behind this approach is the assumption that different reach types have differing levels
of sensitivity to a given pressure. The hazard rating is multiplied by the pressure length and divided
by the length of the water body to calculate the ‘capacity’ of the water body that is used up by that
pressure. The total ‘capacity used’ within a water body (i.e. the sum of the capacity used by each of
the pressures within the water body) is used to define its ecological status under the WFD in terms
of morphological pressure.
Very long, continuous pressures may breach what is known as the ‘Single Activity Limit’ (SAL). This is
a maximum specified pressure length; any pressures exceeding this would automatically result in the
water body being downgraded from good status for morphology. The length depends on the
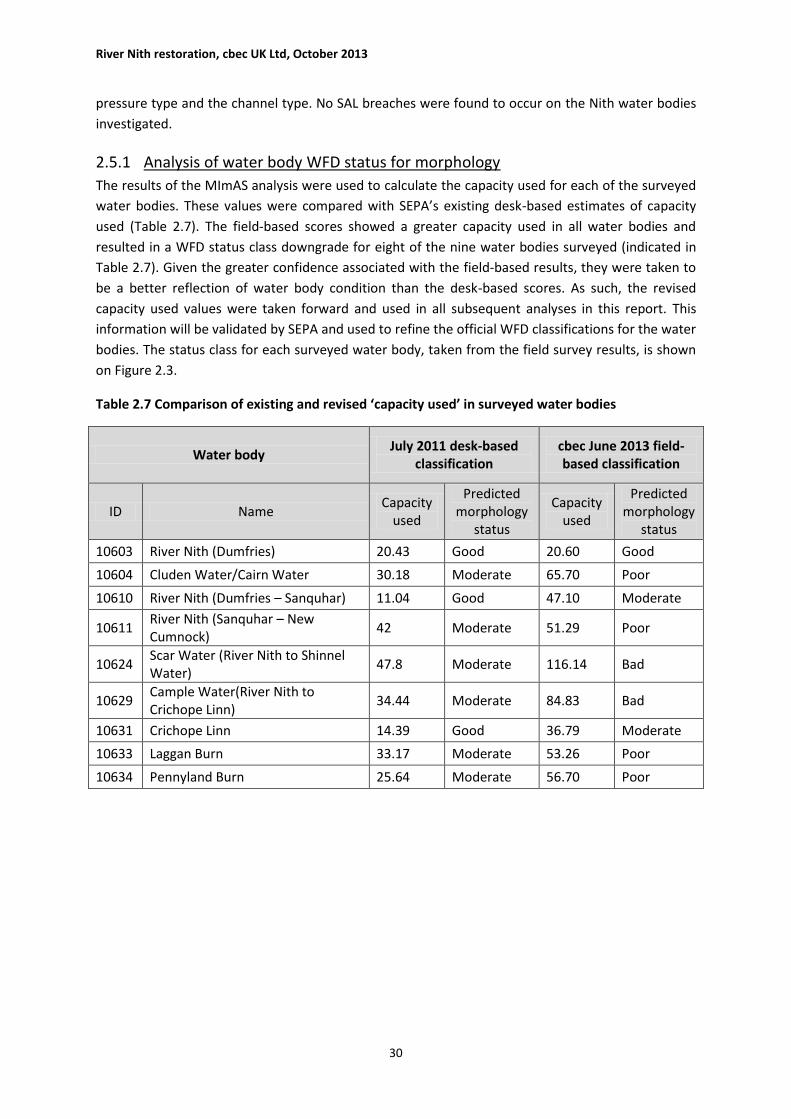
River Nith restoration, cbec UK Ltd, October 2013
30
pressure type and the channel type. No SAL breaches were found to occur on the Nith water bodies
investigated.
2.5.1 Analysis of water body WFD status for morphology
The results of the MImAS analysis were used to calculate the capacity used for each of the surveyed
water bodies. These values were compared with SEPA’s existing desk-based estimates of capacity
used (Table 2.7). The field-based scores showed a greater capacity used in all water bodies and
resulted in a WFD status class downgrade for eight of the nine water bodies surveyed (indicated in
Table 2.7). Given the greater confidence associated with the field-based results, they were taken to
be a better reflection of water body condition than the desk-based scores. As such, the revised
capacity used values were taken forward and used in all subsequent analyses in this report. This
information will be validated by SEPA and used to refine the official WFD classifications for the water
bodies. The status class for each surveyed water body, taken from the field survey results, is shown
on Figure 2.3.
Table 2.7 Comparison of existing and revised ‘capacity used’ in surveyed water bodies
Water body July 2011 desk-based
classification cbec June 2013 field-based classification
ID Name Capacity
used
Predicted morphology
status
Capacity used
Predicted morphology
status
10603 River Nith (Dumfries) 20.43 Good 20.60 Good
10604 Cluden Water/Cairn Water 30.18 Moderate 65.70 Poor
10610 River Nith (Dumfries – Sanquhar) 11.04 Good 47.10 Moderate
10611 River Nith (Sanquhar – New Cumnock)
42 Moderate 51.29 Poor
10624 Scar Water (River Nith to Shinnel Water)
47.8 Moderate 116.14 Bad
10629 Cample Water(River Nith to Crichope Linn)
34.44 Moderate 84.83 Bad
10631 Crichope Linn 14.39 Good 36.79 Moderate
10633 Laggan Burn 33.17 Moderate 53.26 Poor
10634 Pennyland Burn 25.64 Moderate 56.70 Poor

River Nith restoration, cbec UK Ltd, October 2013
31
Notes:
Proposed revised WFD status based on field survey results
River Nith Restoration
WFD status for morphology for surveyed water bodies
Project No. U13-1007 Created By: GK Figure 2.3
River Nith restoration, cbec UK Ltd, October 2013
32
2.6 ANALYSIS OF MORPHOLOGICAL RESTORATION OPTIONS
2.6.1 General approach
The initial list of restoration options to address WFD morphological pressures was developed based
on analysis of the pressures using the MImAS methodology. Given that the MImAS total ‘capacity
used’ is used to define the ecological status of a water body under the WFD (in terms of
morphological pressure), using MImAS as a basis for assessing and prioritising restoration options
provides a straightforward approach in terms of the definition of their degree of improvement to
WFD-related criteria. The water body ‘River Nith - Dumfries’ was not included in the analysis of
restoration options because it is already at good status for morphology. All eight other surveyed
water bodies are at less than good status, so were considered.
2.6.2 Delineation of management reaches
The MImAS analysis of the morphological pressures database was used to evaluate the capacity used
by each individual pressure in each water body under consideration. Each individual pressure
provides an opportunity for restoration and release of capacity. However, a total of 770 pressures,
not including riparian vegetation loss, were recorded in the database for these water bodies. Many
of these features represent sub-divisions of the same pressure (e.g. an embankment), or one of
several discrete pressure types present in the same reach (e.g. a series of croys). Treating each
pressure as a separate restoration option would result in a large number of fragmented and spatially
discontinuous options that would be difficult to assess further and inefficient to implement.
Instead, spatial analysis of pressures and their locations relative to each other was used to develop
restoration options that included multiple adjacent or coinciding pressures at a spatial scale deemed
manageable for restoration work. Logical groupings and divisions of pressures were used to form a
series of management reaches. These were reaches in which pressures contributing significantly to
water body capacity used were situated, and are therefore locations where opportunities for
improvement to water body status exist. The advantages of using this approach are:
The focus on locations where significant improvements can be attained (often by addressing
multiple pressures)
Very long pressures can be broken into lengths that may be more appropriate for
restoration.
The delineation of management reaches was carried out based on expert judgement, informed by
the spatial analysis of pressure locations. The locations of pressures, as recorded in SEPA’s
morphological pressures database, were displayed within a GIS of the Nith. Visual analysis was used
to identify spatial groupings of pressures within each water body. This information was combined
with visual assessments of maps, aerial imagery and geomorphic data for each water body to locate
other features which may be important in delineating management reaches, (e.g. locations of farms,
settlements, or changes to geomorphic reach types). The information was used to determine lengths
of channel within which a series of pressures could be addressed through restoration. These
management reaches were typically between one and four kilometres in length. A total of 31
management reaches were delineated. Details of management reaches are provided in Appendix D.
It is envisaged that the boundaries of those management reaches taken forward to further appraisal

River Nith restoration, cbec UK Ltd, October 2013
33
might be altered in light of more detailed analysis, but the current divisions provide a useful basis for
initial assessment of options.
2.6.3 Evaluation of restoration opportunities
Within each of the 31 management reaches, the capacity that could be released by addressing each
of the various types of pressure was calculated. The total capacity that could be released by
addressing all the pressures included was also calculated (certain types of pressure were excluded
from the analysis, as described below). These calculations are shown in Appendix D. In addition to
complete restoration of high impact realignment (HIR) and complete removal of embankments, the
options of changing high impact realignment to low impact realignment (LIR) and setting back
embankments were also considered. These options would release less capacity, but the option may
be more compatible with existing land use (therefore more acceptable to land managers) and may
be associated with a lower cost of implementation.
Some rules were developed to ensure consistency and as a first order screening to prevent
unmanageable numbers of options:
Reaches were only included where there was the opportunity to release more than 2%
capacity.
Riparian vegetation loss was generally very insignificant in terms of its capacity used and was
therefore only included as an option for those reaches where it released more than 1%
capacity.
Set back embankments have a very low hazard rating within MImAS and therefore
contribute very little to capacity used. As such, their removal was not considered in any of
the options. Indeed, as mentioned above, they are proposed as a potential restoration
option to replace embankments situated closer to the channel banks.
Bridges also typically have a very low hazard rating. Large bridges with a higher hazard rating
are likely to be carrying important infrastructure. Therefore removal of bridges was also
omitted from any option.
The types of pressure that were considered are summarised in Table 2.8.
Table 2.8 Types of measure considered within the management options and the number of reaches addressed by each
Restoration option Number of reaches addressed
Remove embankments 26
Set-back embankments 26
Mitigate high impact realignment 14
Alter high impact realignment to low impact realignment 14
Remove bank protection 9
Remove croys 0
Remove weirs 3
Remove culverts 3
Restore vegetation 2
River Nith restoration, cbec UK Ltd, October 2013
34
For each management reach identified there were a number of sub-options, reflecting the multiple
pressures typically found in each reach. Options ranged from addressing one or more of the types of
pressure to full restoration. Table D2 (Appendix D) indicates the capacity released from addressing
each type of pressure, therefore showing the measures that will have the greatest benefit to WFD
status. The information in Appendix D can also be used to determine the capacity released by
implementing combinations of options or sub-options. Information about each individual pressure
and its capacity used is available in GIS format through SEPA’s morphological pressures database, to
enable the end user to interrogate the data and determine how the pressures within each reach
make up the overall capacity used.
Options were assessed based on the capacity released and whether or not they released sufficient
capacity to improve the WFD ecological status class of the water body. These are coloured in the
Table D2 to indicate the reaches where opportunity to improve water body status exists. Options are
differentiated according to whether status is improved to ‘good’, by two status classes (but not to
good), or by one status class (but not to good). Water bodies that are currently close to the upper
boundary of their status class therefore provide more restoration opportunities that will lead to a
WFD classification upgrade.
Owing to the fact that a water body’s capacity used is calculated as a function of its length, water
body length is significant in determining the capacity released by a given restoration action. The
water bodies addressed here vary in length between 5 and 50 km. A given pressure would use up
more capacity in a shorter water body than a longer one, meaning that mitigation of this pressure
would result in a greater improvement to WFD status in the shorter water body. Shorter water
bodies are, therefore, likely to provide more restoration opportunities that will lead to a WFD
classification upgrade. Evidence of this can be seen by the fact that a high proportion of the lowest
scoring options are in one of the two longest water bodies (Cairn/Cluden Water and Nith from
Dumfries to Sanquhar, 31 and 49 km long, respectively). It should be recognised that, because of this
bias, restoration options in Cairn/Cluden Water and the Nith from Dumfries to Sanquhar are likely to
have greater benefit to local morphology than is accounted for by their scores. A factor was included
in the final assessment of options (Section 6) to mitigate for this bias. However, it is recommended
that in future iterations of this process, the bias is accounted for at an earlier stage (e.g. within the
initial ranking of morphological restoration options or the MCA)
Table 2.9 summarises the top ten morphological restoration options, based on whether the option
results in an improvement in WFD status class and on the overall capacity released. The option on
the Nith main stem between Sanquhar and New Cumnock would improve water body status from
poor to good and is therefore highly favourable. This option involves extensive embankment
removal over several kilometres of water course and may be difficult to implement fully. However,
given that the option has the potential to release 41% capacity, while only 26.3% additional capacity
is required to reach good status in this water body, even removal of a proportion of embankments in
the reach would bring the water body up to, or close to, good status. This option is discussed further
in Section 5, following the multi-criteria analysis of benefits.
An option to mitigate high impact realignment on the upper reaches of Crichope Linn would also
result in improvement of water body status to good. The measure would involve returning the
channel from its current ditch-like condition to a more natural state, probably a bog. Improvement
in riparian vegetation would also be required as part of the option. Options on the downstream

River Nith restoration, cbec UK Ltd, October 2013
35
section of Scar Water and on the lower Cample Water are also highly favourable options in terms of
WFD because they improve status for morphology by two classes. Both would involve re-
meandering of a straightened watercourse (i.e., restoring from HIR), together with embankment
removal, to allow reconnection with the floodplain.
All of the highest scoring options listed in Table 2.9 involve either removal of embankments or
mitigation of high impact realignment, while seven of the top ten involve both actions. They are all,
therefore, likely to require modification of the channel margins, as well as the active channel itself.
In some water bodies there are a number of measures, or combinations of measures, that lead to
the same WFD benefit. The subsequent multi-criteria analysis of options (Section 5), which considers
NFM potential and other important factors (e.g., biodiversity, socio-economic factors etc.), will be
used to objectively differentiate between these measures. Following the MCA, stakeholder feedback
and other information regarding the practicalities of implementation will be used as a final level of
assessment of option favourability.
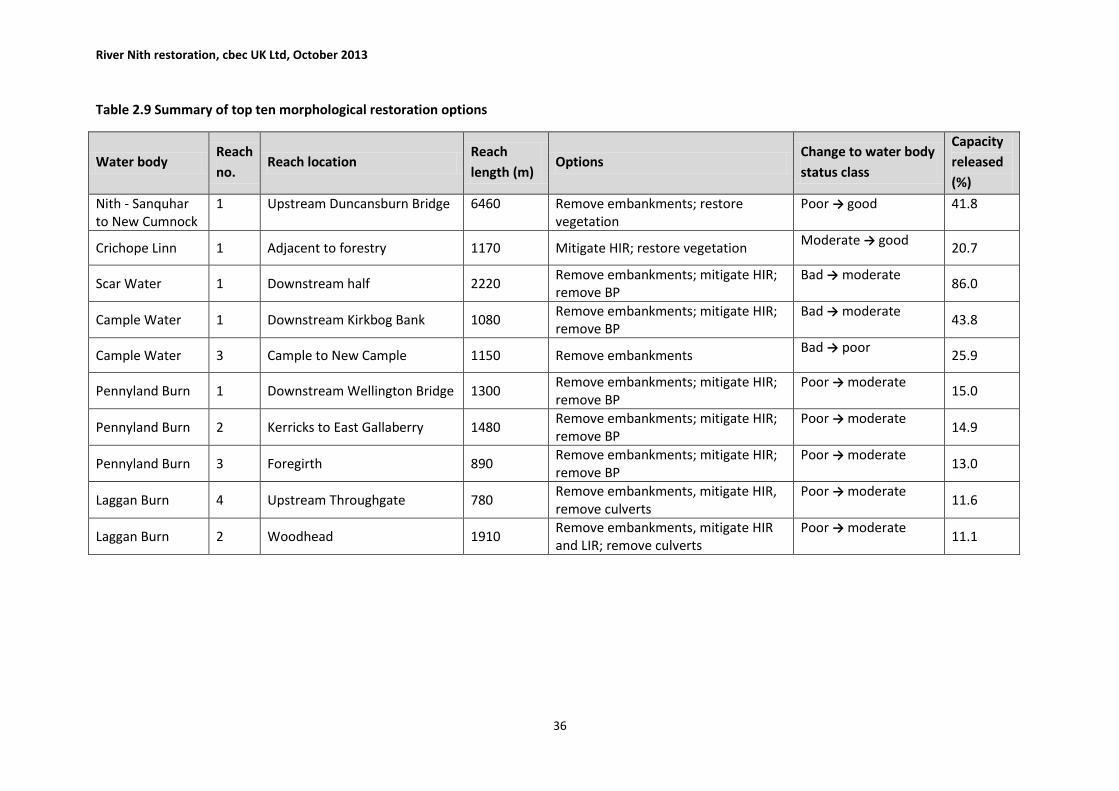
River Nith restoration, cbec UK Ltd, October 2013
36
Table 2.9 Summary of top ten morphological restoration options
Water body Reach
no. Reach location
Reach
length (m) Options
Change to water body
status class
Capacity
released
(%)
Nith - Sanquhar to New Cumnock
1 Upstream Duncansburn Bridge 6460 Remove embankments; restore vegetation
Poor → good 41.8
Crichope Linn 1 Adjacent to forestry 1170 Mitigate HIR; restore vegetation Moderate → good
20.7
Scar Water 1 Downstream half 2220 Remove embankments; mitigate HIR; remove BP
Bad → moderate 86.0
Cample Water 1 Downstream Kirkbog Bank 1080 Remove embankments; mitigate HIR; remove BP
Bad → moderate 43.8
Cample Water 3 Cample to New Cample 1150 Remove embankments Bad → poor
25.9
Pennyland Burn 1 Downstream Wellington Bridge 1300 Remove embankments; mitigate HIR; remove BP
Poor → moderate 15.0
Pennyland Burn 2 Kerricks to East Gallaberry 1480 Remove embankments; mitigate HIR; remove BP
Poor → moderate 14.9
Pennyland Burn 3 Foregirth 890 Remove embankments; mitigate HIR; remove BP
Poor → moderate 13.0
Laggan Burn 4 Upstream Throughgate 780 Remove embankments, mitigate HIR, remove culverts
Poor → moderate 11.6
Laggan Burn 2 Woodhead 1910 Remove embankments, mitigate HIR and LIR; remove culverts
Poor → moderate 11.1
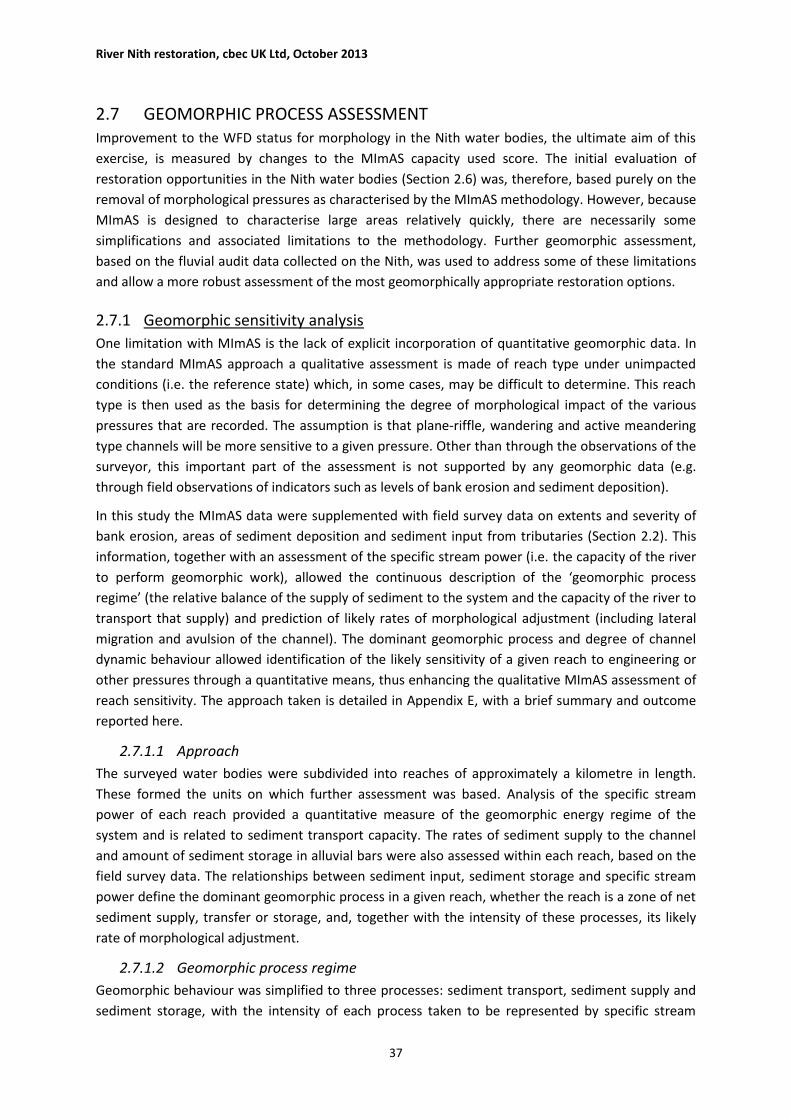
River Nith restoration, cbec UK Ltd, October 2013
37
2.7 GEOMORPHIC PROCESS ASSESSMENT Improvement to the WFD status for morphology in the Nith water bodies, the ultimate aim of this
exercise, is measured by changes to the MImAS capacity used score. The initial evaluation of
restoration opportunities in the Nith water bodies (Section 2.6) was, therefore, based purely on the
removal of morphological pressures as characterised by the MImAS methodology. However, because
MImAS is designed to characterise large areas relatively quickly, there are necessarily some
simplifications and associated limitations to the methodology. Further geomorphic assessment,
based on the fluvial audit data collected on the Nith, was used to address some of these limitations
and allow a more robust assessment of the most geomorphically appropriate restoration options.
2.7.1 Geomorphic sensitivity analysis
One limitation with MImAS is the lack of explicit incorporation of quantitative geomorphic data. In
the standard MImAS approach a qualitative assessment is made of reach type under unimpacted
conditions (i.e. the reference state) which, in some cases, may be difficult to determine. This reach
type is then used as the basis for determining the degree of morphological impact of the various
pressures that are recorded. The assumption is that plane-riffle, wandering and active meandering
type channels will be more sensitive to a given pressure. Other than through the observations of the
surveyor, this important part of the assessment is not supported by any geomorphic data (e.g.
through field observations of indicators such as levels of bank erosion and sediment deposition).
In this study the MImAS data were supplemented with field survey data on extents and severity of
bank erosion, areas of sediment deposition and sediment input from tributaries (Section 2.2). This
information, together with an assessment of the specific stream power (i.e. the capacity of the river
to perform geomorphic work), allowed the continuous description of the ‘geomorphic process
regime’ (the relative balance of the supply of sediment to the system and the capacity of the river to
transport that supply) and prediction of likely rates of morphological adjustment (including lateral
migration and avulsion of the channel). The dominant geomorphic process and degree of channel
dynamic behaviour allowed identification of the likely sensitivity of a given reach to engineering or
other pressures through a quantitative means, thus enhancing the qualitative MImAS assessment of
reach sensitivity. The approach taken is detailed in Appendix E, with a brief summary and outcome
reported here.
2.7.1.1 Approach
The surveyed water bodies were subdivided into reaches of approximately a kilometre in length.
These formed the units on which further assessment was based. Analysis of the specific stream
power of each reach provided a quantitative measure of the geomorphic energy regime of the
system and is related to sediment transport capacity. The rates of sediment supply to the channel
and amount of sediment storage in alluvial bars were also assessed within each reach, based on the
field survey data. The relationships between sediment input, sediment storage and specific stream
power define the dominant geomorphic process in a given reach, whether the reach is a zone of net
sediment supply, transfer or storage, and, together with the intensity of these processes, its likely
rate of morphological adjustment.
2.7.1.2 Geomorphic process regime
Geomorphic behaviour was simplified to three processes: sediment transport, sediment supply and
sediment storage, with the intensity of each process taken to be represented by specific stream

River Nith restoration, cbec UK Ltd, October 2013
38
power, sediment input index and sediment storage index, respectively. The dominant geomorphic
process in each reach was derived from the relative magnitudes of these three values. In addition,
the combined magnitude of the three values was calculated for each reach, to provide a measure of
‘geomorphic process intensity’. This indicates the overall level of geomorphic activity in the reach
and was used as an indication of channel dynamic behaviour. In other studies (cbec, 2012) this has
been shown to be significantly related to independent data on measured historical rates of lateral
channel migration, perhaps the most obvious symptom of dynamic geomorphic activity.
The dominant geomorphic process and the geomorphic process intensity together provide a
quantitative description of the nature of geomorphic behaviour across the River Nith system. This is
depicted in map form in Figure 2.4, which indicates zones of sediment supply, transfer and storage,
together with the degree of channel dynamic behaviour or stability (i.e. geomorphic process
intensity).
The most dynamic reaches in the system are those with combinations of high values for all three
parameters (sediment storage, supply and transport). On the Nith main stem, the areas with the
highest process intensity include the reach adjacent to Sanquhar, reaches between Drumlanrig and
Thornhill and reaches around the Pennyland Burn confluence (near Dumfries). These are all reaches
characterised by high levels of sediment storage and reworking (Figure 2.5 A, B). An area of high
process intensity can also be found within the confined section of the Nith main stem near
Enterkinfoot. This represents a localised area of sediment storage within a zone of high specific
stream power. Reaches towards the upper extents of Pennyland Burn and Crichope Linn tributaries
also have high process intensities. These also represent zones of increased sediment storage and
reworking between steeper, transport-dominated reaches (Figure 2.5 C, D).
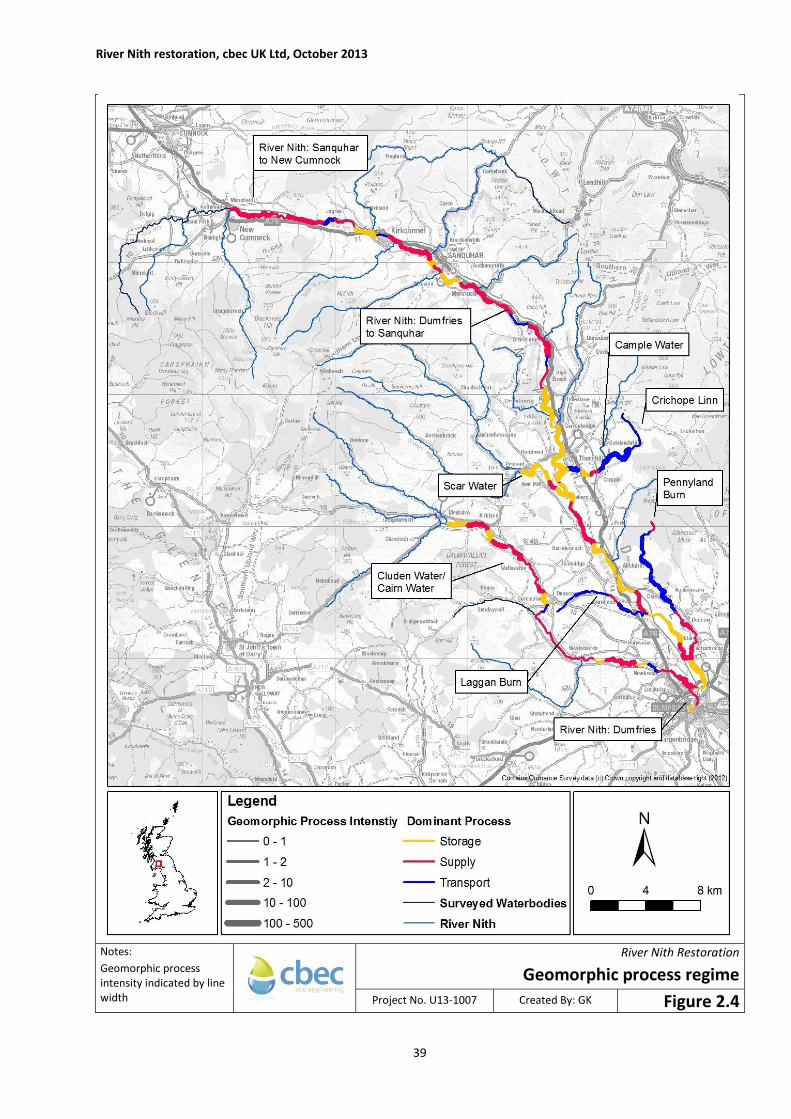
River Nith restoration, cbec UK Ltd, October 2013
39
Notes:
Geomorphic process intensity indicated by line width
River Nith Restoration
Geomorphic process regime
Project No. U13-1007 Created By: GK Figure 2.4
River Nith restoration, cbec UK Ltd, October 2013
40
Figure 2.5 Examples of reaches with high process intensity – A: Nith main stem near Thornhill; B: Nith downstream of Pennyland Burn confluence; C: Pennyland Burn; D: Crichope Linn
2.7.1.3 Comparison with MImAS reach types
The geomorphic process intensity calculated above was taken to represent the degree of channel
sensitivity. The values of process intensity for each reach were compared with the reach type
classification under MImAS (used as a surrogate of channel sensitivity in the MImAS methodology) to
determine whether spatial patterns of sensitivity were comparable. Detail of the comparison can be
found in Appendix E.
There was found to be little relationship between geomorphic process intensity and MImAS
subtypology, except for MImAS type F (passive meandering) channels, which have a very low process
intensity compared with all other channel types. The dominant geomorphic process was found to
relate better to the MImAS subtypologies. MImAS type A (bedrock/cascade) channels tended to be
more dominated by sediment supply and transport with lower levels of storage, as might be
expected given the typically high stream powers associated with these types of channel. MImAS type
B (step pool or plane bed) channels showed a very strong tendency to be transport-dominated.
MImAS type C and D (plane-riffle, wandering/braided and active meandering) channels tended to be
dominated by sediment supply processes, but also have relatively high levels of sediment storage,
consistent with the meandering and bar formation tendencies in these channel types. MImAS type F
(passive meandering) channels were also dominated by sediment supply (although overall levels of
supply are low, as indicated by the low process intensity values).
A
A
B
A
C
A
D
A
River Nith restoration, cbec UK Ltd, October 2013
41
The poor relationship between MImAS subtypologies and geomorphic process intensity indicates
that the two parameters are not providing the same measure of reach sensitivity to morphological
pressures. As such it is suggested that the geomorphic process intensity provides a useful additional
measure of sensitivity, to be used on top of MImAS, to further support assessment of restoration
options.
2.7.1.4 Implications of geomorphic process regime for restoration options
Geomorphic process intensity, or dynamic behaviour, provides an indication of the likely sensitivity
of the system to change (e.g. during a large-scale flood event), as well as the sensitivity of the system
to modifications. Engineering or land use modifications on dynamic reaches are likely to have a
greater impact on geomorphic process and form than those on less dynamic, more stable reaches,
because of the greater propensity of the channel to react in the more dynamic reaches.
Understanding of the dominant process in a reach is also important for assessing the likely impacts
(local and ex-situ) of engineering and land use pressures, as well as determining the geomorphic
response to restoration interventions and allowing suitable restoration options to be developed.
The quantification of the geomorphic process regime presented here provides a basis for identifying
optimal, process-based restoration interventions and ensuring that any proposed restoration
interventions are appropriate within the context of the entire system, as well as at the reach scale. It
is considered that the quantitative data used here provides a necessary level of assessment, in
addition to (and complementary to) the MImAS assessment. However, in order to highlight the
benefit for WFD objectives as clearly as possible, the results of this geomorphic analysis were not
incorporated into the WFD score in the MCA: the WFD score therefore reflects solely the WFD
benefit. Nevertheless, the results of the geomorphological analysis should be used to identify any
options that are not suitable for subsequent implementation at the option design stage.
In this study geomorphic sensitivity was incorporated as a factor within the final assessment of
options, following MCA. However, in future iterations of the MCA process, it is recommended that
the geomorphological dynamics are used to determine the suitability of a measure, and that this
process could be used as another part of the MCA to devise an overall ‘WFD Score’, comprised of (a)
a score describing potential benefit for WFD objectives and (b) a score describing how effective the
measure might be based on an understanding of geomorphological dynamics.
2.7.2 Additional pressures analysis
In MImAS pressures are assigned a hazard rating, which is dependent on the pressure type and the
reach type in which it is located. The hazard rating is then multiplied by the pressure length to
determine its impact. The broad-scale application of MImAS is such that these hazard ratings must
be simple. However, observations on the Nith indicated that in some cases hard bank protection or
croys were having a far more significant impact on geomorphic process than the hazard rating would
suggest. In addition, livestock poaching on channel banks was found to be a significant impact on
bank form and stability in many reaches, but could not be accounted for in MImAS, because it is not
included as a type of pressure within the methodology.
Locations where grey bank protection and croys coincided with reaches with a geomorphic process
intensity of greater than 20 (i.e. sensitive reaches) were plotted on a map (Figure 2.6). This shows
locations where bank protection is likely to be having a particularly severe impact on geomorphic
process. These include the reaches of the Nith main stem between Drumlanrig and just downstream

River Nith restoration, cbec UK Ltd, October 2013
42
of Thornhill (Figure 2.7, Figure 2.8), reaches at the top of the Cairn Water, the lower Scar Water and
the Nith main stem just downstream of the Pennyland Burn confluence.

River Nith restoration, cbec UK Ltd, October 2013
43
Notes:
River Nith Restoration
Bank protection and croys in reaches with a geomorphic process intensity greater than 20
Project No. U13-1007 Created By: GK Figure 2.6
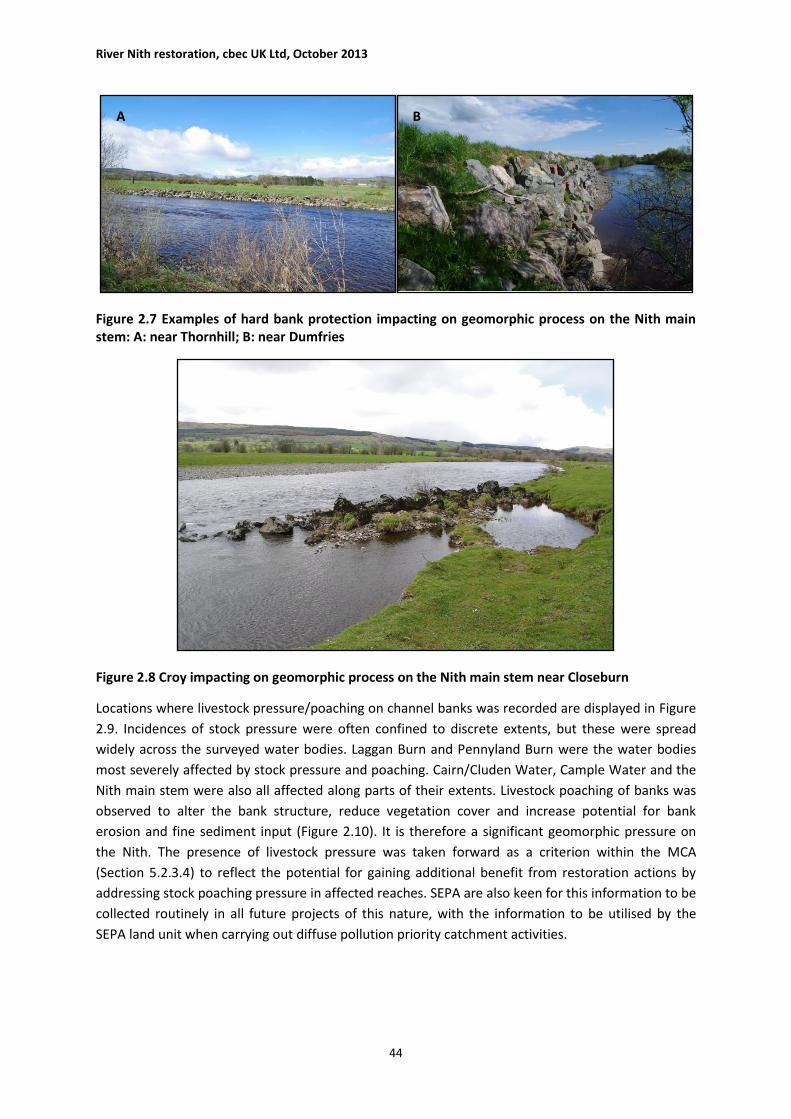
River Nith restoration, cbec UK Ltd, October 2013
44
Figure 2.7 Examples of hard bank protection impacting on geomorphic process on the Nith main stem: A: near Thornhill; B: near Dumfries
Figure 2.8 Croy impacting on geomorphic process on the Nith main stem near Closeburn
Locations where livestock pressure/poaching on channel banks was recorded are displayed in Figure
2.9. Incidences of stock pressure were often confined to discrete extents, but these were spread
widely across the surveyed water bodies. Laggan Burn and Pennyland Burn were the water bodies
most severely affected by stock pressure and poaching. Cairn/Cluden Water, Cample Water and the
Nith main stem were also all affected along parts of their extents. Livestock poaching of banks was
observed to alter the bank structure, reduce vegetation cover and increase potential for bank
erosion and fine sediment input (Figure 2.10). It is therefore a significant geomorphic pressure on
the Nith. The presence of livestock pressure was taken forward as a criterion within the MCA
(Section 5.2.3.4) to reflect the potential for gaining additional benefit from restoration actions by
addressing stock poaching pressure in affected reaches. SEPA are also keen for this information to be
collected routinely in all future projects of this nature, with the information to be utilised by the
SEPA land unit when carrying out diffuse pollution priority catchment activities.
A
A
B
A

River Nith restoration, cbec UK Ltd, October 2013
45
Notes:
River Nith Restoration
Locations of livestock pressure on banks
Project No. U13-1007 Created By: GK Figure 2.9
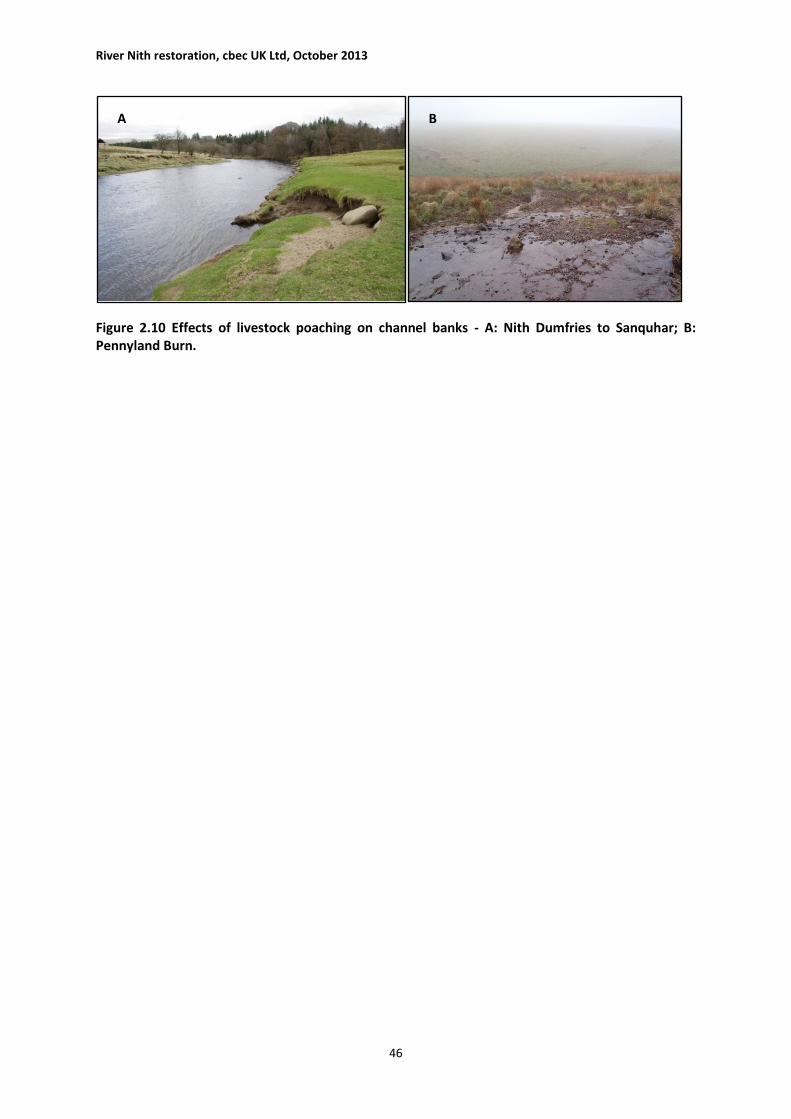
River Nith restoration, cbec UK Ltd, October 2013
46
Figure 2.10 Effects of livestock poaching on channel banks - A: Nith Dumfries to Sanquhar; B: Pennyland Burn.
B
A
A
A
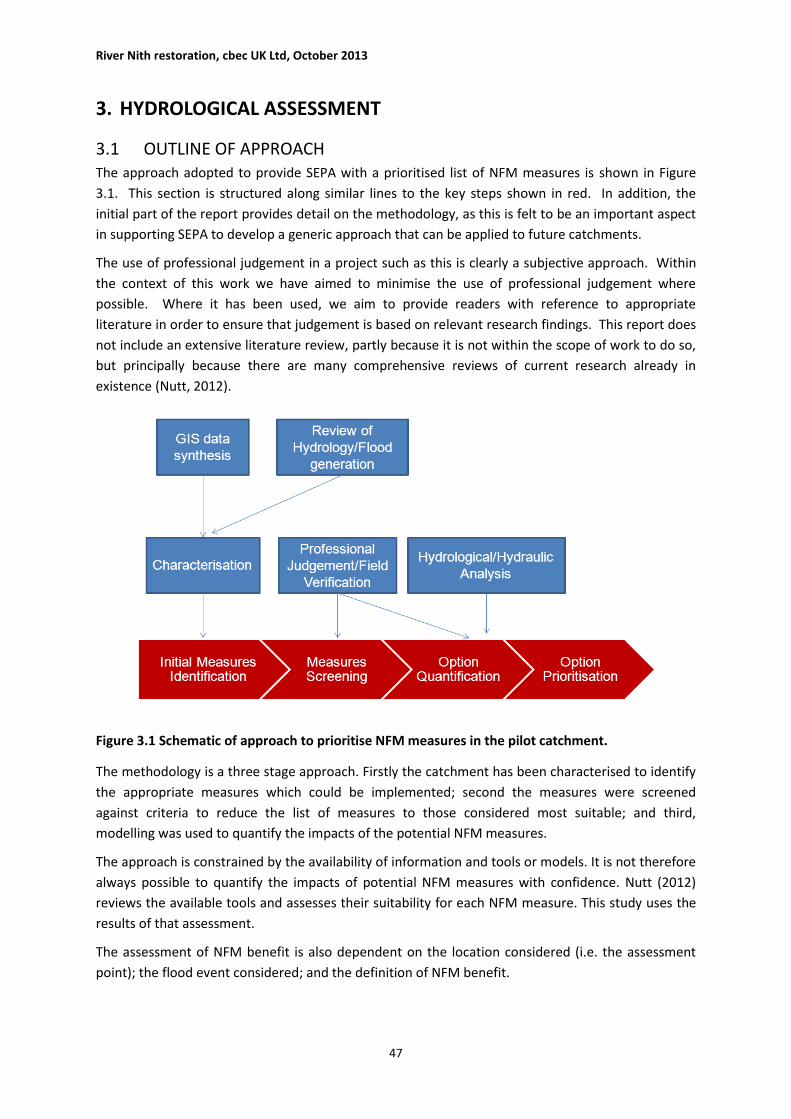
River Nith restoration, cbec UK Ltd, October 2013
47
3. HYDROLOGICAL ASSESSMENT
3.1 OUTLINE OF APPROACH The approach adopted to provide SEPA with a prioritised list of NFM measures is shown in Figure
3.1. This section is structured along similar lines to the key steps shown in red. In addition, the
initial part of the report provides detail on the methodology, as this is felt to be an important aspect
in supporting SEPA to develop a generic approach that can be applied to future catchments.
The use of professional judgement in a project such as this is clearly a subjective approach. Within
the context of this work we have aimed to minimise the use of professional judgement where
possible. Where it has been used, we aim to provide readers with reference to appropriate
literature in order to ensure that judgement is based on relevant research findings. This report does
not include an extensive literature review, partly because it is not within the scope of work to do so,
but principally because there are many comprehensive reviews of current research already in
existence (Nutt, 2012).
Figure 3.1 Schematic of approach to prioritise NFM measures in the pilot catchment.
The methodology is a three stage approach. Firstly the catchment has been characterised to identify
the appropriate measures which could be implemented; second the measures were screened
against criteria to reduce the list of measures to those considered most suitable; and third,
modelling was used to quantify the impacts of the potential NFM measures.
The approach is constrained by the availability of information and tools or models. It is not therefore
always possible to quantify the impacts of potential NFM measures with confidence. Nutt (2012)
reviews the available tools and assesses their suitability for each NFM measure. This study uses the
results of that assessment.
The assessment of NFM benefit is also dependent on the location considered (i.e. the assessment
point); the flood event considered; and the definition of NFM benefit.

River Nith restoration, cbec UK Ltd, October 2013
48
3.2 ASSESSMENT POINTS While any single or group of receptors can be considered as an assessment point it is necessary for
practical reasons to limit the number of points. This study has considered each PVA as an
assessment point. These areas are the focus of SEPA and Local Authority appraisals and will
therefore benefit NFM measures. The Dumfries PVA being just upstream of the mouth of the Nith
also serves to give a catchment scale assessment of benefits and options.
3.3 DESIGN FLOOD EVENT The method does not use the concept of a design storm as used for flood alleviation schemes as this
a catchment scale study where NFM measures would be widely distributed and effective at different
return periods.
The approach uses the rainfall data to select significant storm events and to use flow records at
gauging stations to establish sub-catchment flows. This approach allows the assessment to be
updated as further flood events become available and increases confidence that the predicted
impacts will be realised in practice.
3.4 DEFINITION OF NFM BENEFIT There is no established approach to defining the benefit of a specific NFM measure. For the purpose
of this study the benefits are assessed at two scales: The scale of each reach/sub-catchment and the
catchment scale (at PVAs). The method can be extended to further assessment points and scales as
required.
To apply the standard approach used for flood alleviation measures by SEPA to identify PVAs, it is
necessary to derive the flood risk at defined receptors or group of receptors. Flood risk is a
combination of flood hazard, damage and vulnerability and flood hazard is calculated from depth of
inundation, velocity and a debris factor.
In the absence of receptor data and flood damage curves, the approach used here is based on flood
hazard, such that the benefit is calculated as a combination of the percentage change in peak flow
and the reduced extent of inundation at each assessment point.
There is therefore, no single benefit value for a given flood event or set of measures. Rather there
will be a set of benefit values at each assessment point and for each flood event. This makes it
possible to gain an understanding of both the local benefit and the catchment scale benefit of a
specific measure or set of measures.
3.5 HYDROLOGY OVERVIEW
3.5.1 General catchment hydrology
The Nith catchment is elongated with an area of 1,200 km2. Generally, the left bank tributaries are
short and steep with stream lengths ranging from about 5 km to 10 km. The largest left bank
tributary is the Crawick Water which joins just upstream of Sanquhar and has a stream length of
about 20km. Further downstream the Cample Water joins just downstream of Thorntonhall and the
Duncow Burn joins upstream of Dumfries.
The right bank tributaries generally have larger catchment areas and stream lengths. The Afton
Water joins at New Cumnock and is influenced by Afton Reservoir, a public water supply reservoir.

River Nith restoration, cbec UK Ltd, October 2013
49
The Scar Water and Cairn Water, which join the Nith between Thornhill and Dumfries, are the largest
tributaries.
There are significant floodplain areas in the middle to lower reaches of the Nith and along the Scar
and Cairn watercourses, although many areas have been disconnected by embankments constructed
in the 1940s.
The gauging station network gives an excellent coverage of the catchment. Waterhead, Dow Craig
and Dalgig represent the catchment upstream of New Cumnock; Hall Bridge gauges the Nith
between New Cumnock and Sanquhar; Drumlanrig gauges the Nith upstream of Thornhill; Capenoch
gauges the Scar Water just upstream of the confluence with the Nith; Friars Carse is located on the
Nith upstream of Dumfries and Fiddlers Ford gauges the Cludden Water upstream of the confluence
with the Nith. Between 1965 and 1981, a gauging station was operational at Afton on the Afton
Water, although was discontinued following the construction of the reservoir.
The reliability of the derived flows varies and that care is required when extrapolating beyond the
largest flow covered by spot gaugings at each gauging site.
SEPA also operate level only gauging sites at Greensands and Whitesands downstream of Dumfries
within the tidal limit of the Nith.
3.5.2 Flow duration
Flow Duration Curves (FDC), which summarise the flow regime, were derived for each record (Figure
3.2 and Table 3.1) for the common period 1991 to 2013. The FDC is a plot of percentage exceedance
versus daily mean flow. For example the flow that is exceeded for 95% of the record period is called
the Q95.
Figure 3.2 Flow duration curve for several Nith gauges, scaled by catchment area

River Nith restoration, cbec UK Ltd, October 2013
50
Table 3.1 Percentile flow estimates, scaled by catchment area
Percentile
(%)
Flow estimate (m3/s/km
2)
Capenoch Dalgig Dow
Craig Drumlanrig
Fiddlers
Ford
Friars
Carse
Hall
Bridge Waterhead
95 0.003 0.002 0.001 0.004 0.003 0.004 0.003 0.002
90 0.004 0.003 0.001 0.005 0.004 0.005 0.004 0.003
70 0.010 0.008 0.004 0.010 0.010 0.011 0.008 0.008
50 0.021 0.016 0.012 0.019 0.019 0.022 0.017 0.017
20 0.063 0.050 0.052 0.060 0.056 0.057 0.061 0.059
10 0.107 0.090 0.107 0.099 0.090 0.090 0.105 0.108
5 0.155 0.137 0.171 0.139 0.129 0.124 0.150 0.165
The FDC at Dow Craig differs quite markedly from the FDCs at the other stations. The river appears
to exhibit a more flashy response, with flows less than Q50 being a smaller proportion of the mean
daily flow than at other stations. However, this catchment has been heavily modified by mining
activities, forestry and channel diversions. In addition, SEPA note that the derived flows are
unreliable due to a poor hydraulic control and the lack of high flow gauging. The flow record for this
station has not therefore been used for further analysis.
The FDC for the main River Nith only reflects the increased floodplain attenuation of flows with
downstream distance.

River Nith restoration, cbec UK Ltd, October 2013
51
Figure 3.3 Flow duration curves, scaled by catchment area, for gauging stations located on the Nith main stem.
The annual record at Friars Carse (Figure 3.4) shows a marked positive trend which is statistically
significant.
Figure 3.4 Annual flow record for the Nith at Friars Carse
This trend is also evident in the records for Drumlanrig and Hall Bridge gauging stations indicating
that this is not driven by systematic changes in the measurement technique or data quality.
0.0
5.0
10.0
15.0
20.0
25.0
30.0
35.0
40.0
45.0
50.0
Me
an D
aily
Flo
w (
m3/s
)

River Nith restoration, cbec UK Ltd, October 2013
52
Figure 3.5 Annual flow record for the Nith at Hall Bridge and Drumlanrig
3.5.3 Spatial relationships in runoff generation
Understanding patterns of runoff generation is essential when assessing the potential for NFM type
measures. Spatial patterns of runoff generation provide a key constraint on the potential
effectiveness of particular measures. Figure 3.6 to Figure 3.8 show the relationship between flow
magnitudes for matched annual maximum events between selected gauges on the Nith. Matching
takes a gauged record for one site, and then filters both it and the correlating gauge based on the
day of the event. The resulting peak flows are normalised by QMED and plotted as shown. The
normalisation allows a comparison between gauges.
This analysis indicates a strong degree of relationship between peak flows at Drumlanrig and peak
flows at Friars Carse. This is to be expected given the relative location of the two gauges on the
main stem of the Nith. A reasonably good relationship is also observed between the Hall Bridge and
Friars Carse gauges (Figure 3.6) and Cluden Water and Scar Water gauges (Figure 3.7).
This indicates that for a significant number of peak flow events, correlating gauges are recording
proportionally consistent high flows. It also indicates that for a large proportion of events there is a
strong relationship between relative flow magnitudes at different gauges. While this might be
expected on the main stem of the Nith, the degree of relationship between the Scar Water and
Cluden Water gauges is interesting, as they are separate tributaries. This indicates that despite their
differing physical characteristics for a significant number of peak flow events, both catchments tend
to respond in a similar way.
The analysis of gauged records in such a way indicates that there are no gauged parts of the
catchment which seem to consistently indicate higher flows. In considering the various sub-
catchments which may contribute to the peak flows observed at Friars Case, no obvious sub-
catchment presents itself as being more or less suitable, relevant to other sub-catchments. This
implication is purely based upon the gauged data.
0
5
10
15
20
25
30M
ean
Dai
ly F
low
(m
3 /s)
255 per. Mov. Avg. (Hall Bridge) Linear (Hall Bridge)
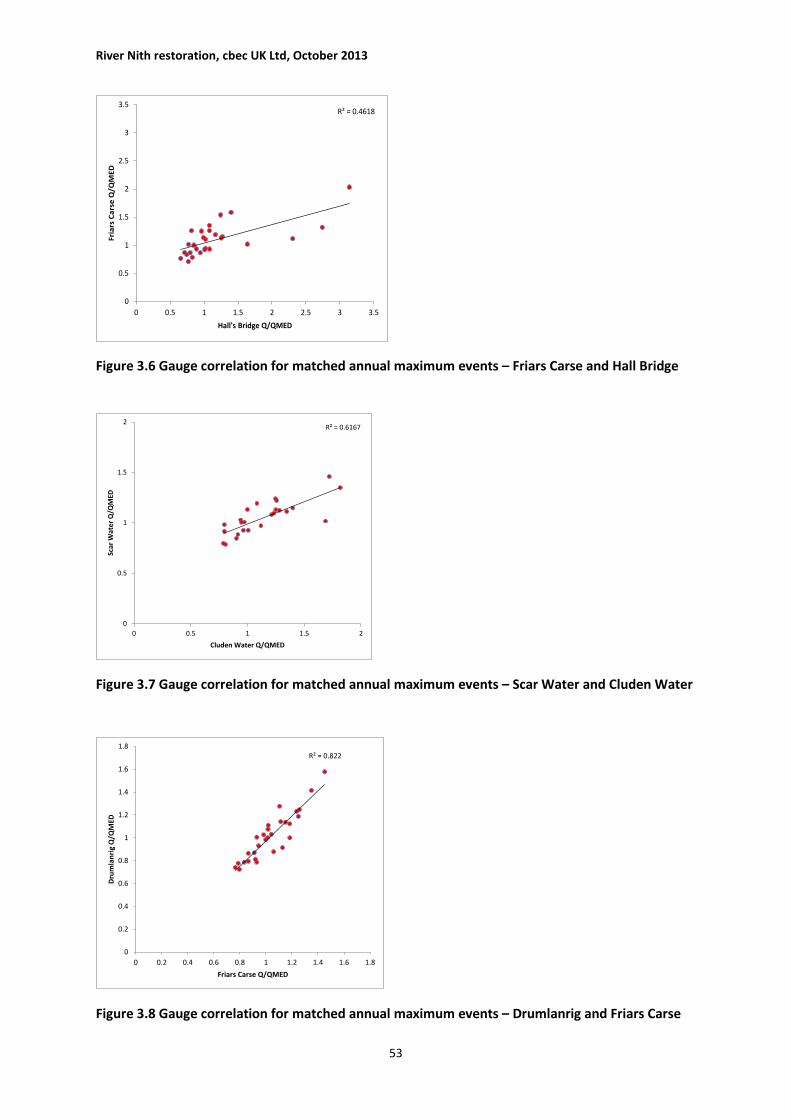
River Nith restoration, cbec UK Ltd, October 2013
53
Figure 3.6 Gauge correlation for matched annual maximum events – Friars Carse and Hall Bridge
Figure 3.7 Gauge correlation for matched annual maximum events – Scar Water and Cluden Water
Figure 3.8 Gauge correlation for matched annual maximum events – Drumlanrig and Friars Carse
R² = 0.4618
0
0.5
1
1.5
2
2.5
3
3.5
0 0.5 1 1.5 2 2.5 3 3.5
Fria
rs C
ars
e Q
/QM
ED
Hall's Bridge Q/QMED
R² = 0.6167
0
0.5
1
1.5
2
0 0.5 1 1.5 2
Scar
Wat
er
Q/Q
MED
Cluden Water Q/QMED
R² = 0.822
0
0.2
0.4
0.6
0.8
1
1.2
1.4
1.6
1.8
0 0.2 0.4 0.6 0.8 1 1.2 1.4 1.6 1.8
Dru
mla
nri
g Q
/QM
ED
Friars Carse Q/QMED
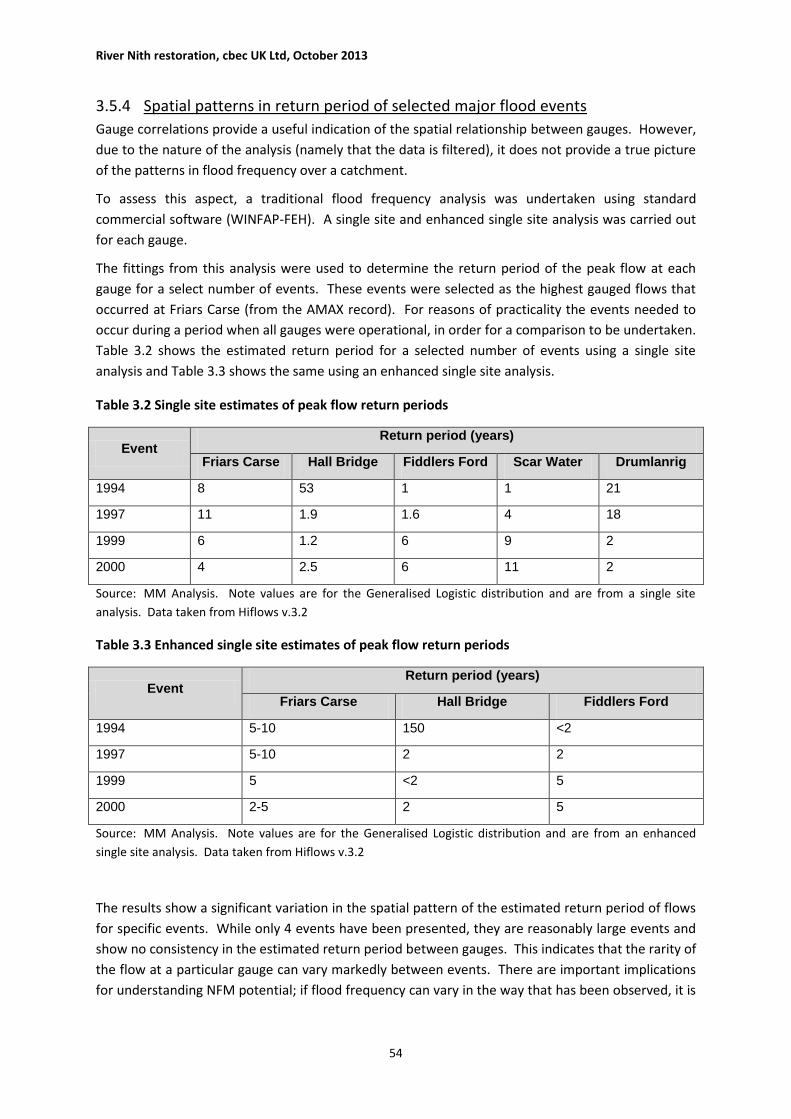
River Nith restoration, cbec UK Ltd, October 2013
54
3.5.4 Spatial patterns in return period of selected major flood events
Gauge correlations provide a useful indication of the spatial relationship between gauges. However,
due to the nature of the analysis (namely that the data is filtered), it does not provide a true picture
of the patterns in flood frequency over a catchment.
To assess this aspect, a traditional flood frequency analysis was undertaken using standard
commercial software (WINFAP-FEH). A single site and enhanced single site analysis was carried out
for each gauge.
The fittings from this analysis were used to determine the return period of the peak flow at each
gauge for a select number of events. These events were selected as the highest gauged flows that
occurred at Friars Carse (from the AMAX record). For reasons of practicality the events needed to
occur during a period when all gauges were operational, in order for a comparison to be undertaken.
Table 3.2 shows the estimated return period for a selected number of events using a single site
analysis and Table 3.3 shows the same using an enhanced single site analysis.
Table 3.2 Single site estimates of peak flow return periods
Event Return period (years)
Friars Carse Hall Bridge Fiddlers Ford Scar Water Drumlanrig
1994 8 53 1 1 21
1997 11 1.9 1.6 4 18
1999 6 1.2 6 9 2
2000 4 2.5 6 11 2
Source: MM Analysis. Note values are for the Generalised Logistic distribution and are from a single site
analysis. Data taken from Hiflows v.3.2
Table 3.3 Enhanced single site estimates of peak flow return periods
Event Return period (years)
Friars Carse Hall Bridge Fiddlers Ford
1994 5-10 150 <2
1997 5-10 2 2
1999 5 <2 5
2000 2-5 2 5
Source: MM Analysis. Note values are for the Generalised Logistic distribution and are from an enhanced
single site analysis. Data taken from Hiflows v.3.2
The results show a significant variation in the spatial pattern of the estimated return period of flows
for specific events. While only 4 events have been presented, they are reasonably large events and
show no consistency in the estimated return period between gauges. This indicates that the rarity of
the flow at a particular gauge can vary markedly between events. There are important implications
for understanding NFM potential; if flood frequency can vary in the way that has been observed, it is
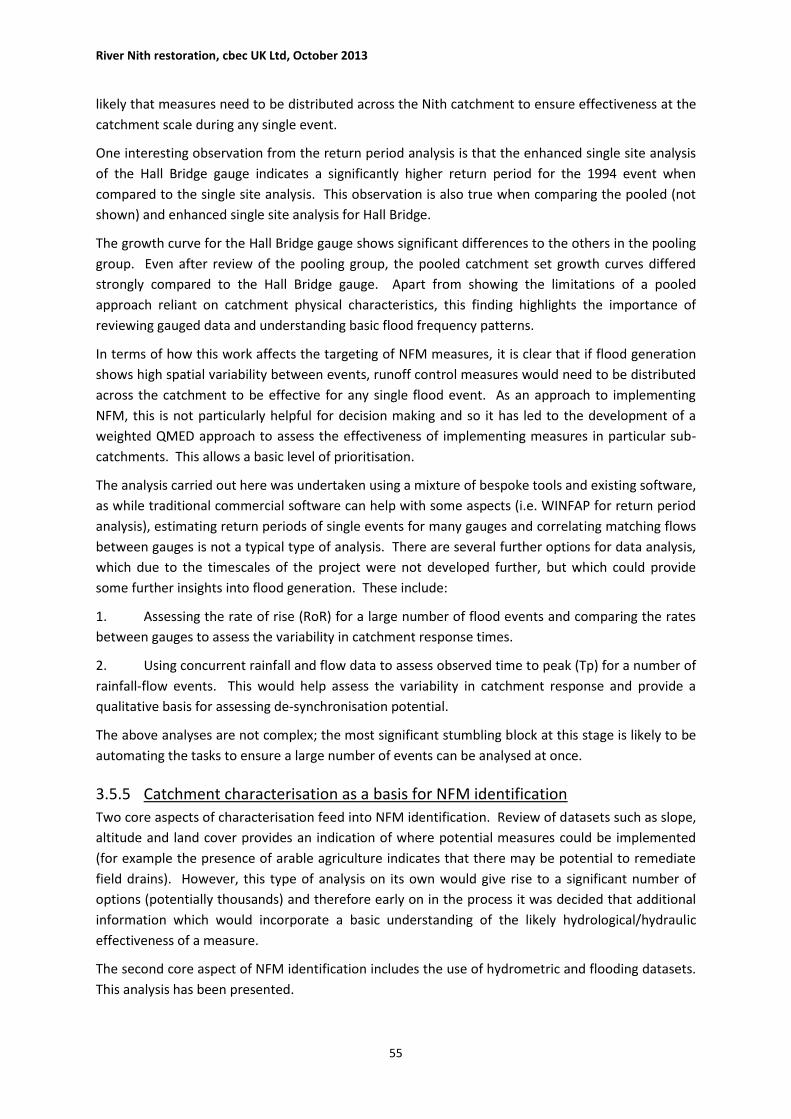
River Nith restoration, cbec UK Ltd, October 2013
55
likely that measures need to be distributed across the Nith catchment to ensure effectiveness at the
catchment scale during any single event.
One interesting observation from the return period analysis is that the enhanced single site analysis
of the Hall Bridge gauge indicates a significantly higher return period for the 1994 event when
compared to the single site analysis. This observation is also true when comparing the pooled (not
shown) and enhanced single site analysis for Hall Bridge.
The growth curve for the Hall Bridge gauge shows significant differences to the others in the pooling
group. Even after review of the pooling group, the pooled catchment set growth curves differed
strongly compared to the Hall Bridge gauge. Apart from showing the limitations of a pooled
approach reliant on catchment physical characteristics, this finding highlights the importance of
reviewing gauged data and understanding basic flood frequency patterns.
In terms of how this work affects the targeting of NFM measures, it is clear that if flood generation
shows high spatial variability between events, runoff control measures would need to be distributed
across the catchment to be effective for any single flood event. As an approach to implementing
NFM, this is not particularly helpful for decision making and so it has led to the development of a
weighted QMED approach to assess the effectiveness of implementing measures in particular sub-
catchments. This allows a basic level of prioritisation.
The analysis carried out here was undertaken using a mixture of bespoke tools and existing software,
as while traditional commercial software can help with some aspects (i.e. WINFAP for return period
analysis), estimating return periods of single events for many gauges and correlating matching flows
between gauges is not a typical type of analysis. There are several further options for data analysis,
which due to the timescales of the project were not developed further, but which could provide
some further insights into flood generation. These include:
1. Assessing the rate of rise (RoR) for a large number of flood events and comparing the rates
between gauges to assess the variability in catchment response times.
2. Using concurrent rainfall and flow data to assess observed time to peak (Tp) for a number of
rainfall-flow events. This would help assess the variability in catchment response and provide a
qualitative basis for assessing de-synchronisation potential.
The above analyses are not complex; the most significant stumbling block at this stage is likely to be
automating the tasks to ensure a large number of events can be analysed at once.
3.5.5 Catchment characterisation as a basis for NFM identification
Two core aspects of characterisation feed into NFM identification. Review of datasets such as slope,
altitude and land cover provides an indication of where potential measures could be implemented
(for example the presence of arable agriculture indicates that there may be potential to remediate
field drains). However, this type of analysis on its own would give rise to a significant number of
options (potentially thousands) and therefore early on in the process it was decided that additional
information which would incorporate a basic understanding of the likely hydrological/hydraulic
effectiveness of a measure.
The second core aspect of NFM identification includes the use of hydrometric and flooding datasets.
This analysis has been presented.
River Nith restoration, cbec UK Ltd, October 2013
56
GIS analysis of land cover, channel morphology, rainfall and topography provides a basic level of
screening to identify suitable locations for measures. The hydrological analysis provides a secondary
screening approach which refines potential measures based upon their predicted hydrological
effectiveness (note that this is separate from quantification) through an understanding of catchment
runoff generation.
The analyses undertaken provided a clear steer on the likely measures to be adopted. Key findings
include:
Current embanked sections of channel represent areas where the main channel is
disconnected from its floodplain and as such may represent an opportunity for NFM.
Hydrological analysis indicates that flood generation shows wide spatial variability between
events and so runoff control measures need to be widely distributed to be effective for any
single event.
GIS data analysis indicates that there are numerous areas where runoff control measures
such as gully tree planting, shelter belts and changing agricultural practices could be
implemented.
Proposed measures and their locations generally agree with what the Section 20 data
indicates and as such provides some confidence that the measures are their locations are
appropriate.
Field visits generally verified what the GIS analysis indicated; for example areas around
Wanlockhead exhibit high grazing pressure on relatively steep slopes.
3.6 CHARACTERISATION Hydrological characterisation is the process whereby the physical and hydrological characteristics of
the catchment are used to quantify the potential for NFM options. It is, in effect, a summary of the
information available for the catchment.
3.7 APPROACH
3.7.1 Spatial units
For source control measures such as drain blocking, wetland creation and land use management in
upland areas, the potential NFM measures are assessed at the sub-catchment scale where the size
of a sub-catchment reflects the scale of available information.
Floodplain and channel restoration type measures (e.g. channel realignment, embankment removal
and floodplain land management) are assessed at a ‘reach scale’, where a reach is based on the
location of tributaries and natural changes in river morphology, as well as the location of important
hydraulic controls such as structures.
While there is no theoretical limit to the scale of a sub-catchment or reach adopted, they do need to
reflect the available information and the practical limitations of modelling each unit.
3.7.2 Classification of NFM measures
A number of classification schemes have been developed to aid the identification of alternative NFM
options. The list of measures established by Halcrow for SEPA (Nutt, 2012) is used for this study (the
full table is reproduced in Appendix F).
River Nith restoration, cbec UK Ltd, October 2013
57
In a broad sense there are three types of measures: source control; runoff control and floodplain /
channel modifications. Examples of source control include reducing grazing pressures and upland
drain blocking; runoff control includes the creation of tree shelter belts and floodplain afforestation;
and floodplain measures include embankment removal and channel realignment.
This division is also useful as it is the natural split in the assessment methodology. Source control
measures are generally assessed using rule-based and hydrological tools, floodplain measures are
assessed using hydraulic models and runoff reduction measures use a combination depending on
whether the location is in the floodplain.
3.7.3 Source control screening tool
Uncertainty is the primary factor in determining the appropriate method for the analysis of
hydrological data. Uncertainty arises due to systematic and random errors in data, assumptions
inherent in the model structure, and errors in calibrating the model parameters.
Data for source control measures is limited to national data such as LCM2007 and HOST, as there are
little if any local observations and a lack of sound tested models. While it is theoretically possible to
implement deterministic rainfall-runoff models (e.g. HEC-HMS or the SCSUH), in practice the
predicted changes in runoff and flow are highly uncertain and unlikely to be detectable.
Halcrow (Now CH2M Hill) reviewed the capability of existing tools to quantify the benefits of Natural
Flood Management measures. The results, reproduced as Appendix F, confirm that there is a lack of
tested methodologies to quantify the impact of source control measures at the catchment scale. This
conclusion is confirmed by CREW (Blanc, J. Wright. G and Arthur S., 2012) and other reports (Sniffer,
2011).
An alternative rule-based method has therefore been developed that uses available information to
assess the potential for a measure to impact on the flood hydrology at the sub-catchment scale and
catchment scales.
The de-synchronisation of tributary flood hydrographs is implicitly accounted for through the use of
a routing model to move water within the catchment (see Section I.4).
Several publications suggest that NFM measures can be used to de-synchronise the flows from
tributary flood hydrographs. For a catchment as large as the Nith variations in storm location and
movement as well as the range of catchment processes lead to no consistent pattern in storm
hydrographs across the catchment.
The approach used in this study accounts for desynchronisation through the use of a recorded storm
event, together with a catchment scale hydraulic model to simulate the timing of tributary flows.
Coastal measures have not been included in this study as the PVAs being assessed are not impacted
by coastal flooding. The use of 2D hydraulic models can be easily extended to coastal zones through
the use of tidal boundaries. The coastal floodplain dynamics are well represented in a 2D model and
the availability of LIDAR for the coastal region south of Dumfries would allow model extension
should coastal flood risk become an issue in future studies.

River Nith restoration, cbec UK Ltd, October 2013
58
3.8 FLOODPLAIN AND CHANNEL OPTIONS Hydraulic models are well established tools for simulating the flow and level in a river channel and
floodplain. Provided that accurate DTM and cross section data are available then these models will
give reliable results when calibrated.
The floodplain is an important factor in determining the catchment scale response of the Nith. The
accurate representation of the dynamics of flow and the interaction between the main channel and
floodplain is necessary to quantify the impact of floodplain measures and source control measures.
It is therefore appropriate to use a 2D model due to the importance of floodplain dynamics and the
availability of a DTM. There are practical limitations to the application of 2D models to such a large
catchment (including the quality of the DTM as well as the time and resource available). Therefore
the methodology combines 2D model domains with a 1D model used to route flow between these
domains and so form an integrated catchment model. The locations of model domains and the
routing schematic are shown in Figure J.1.
This approach allows for 2D domains to be extended and added as alternative reaches are
considered or more detail is required.
3.9 OPTIONS ASSESSMENT Table 3.4 shows the criteria used to quantify the potential of each measure at the local scale. A
factor, based on the criteria, is multiplied by a confidence factor to give the overall factor. The
confidence factor is based on the data and the method. For example, a maximum confidence value
of ‘1’ has been given to measures assessed using hydraulic modelling, good quality DTM (LiDAR) and
local hydrometric data. The confidence factor for measures, such as changing agricultural drainage
has been set to ‘0.5’ as it is based on national low resolution data (LCM) and a simple rule based
method.
Most source control measures have the same overall factor as they rely on the same national data
sets and are assessed using the rule-based method.
The ranges used are based on professional experience and judgement and reflect the uncertainty
typically inherent in hydrological modelling. Naturally, these ranges can be refined as data and
methods improve.
The precise location of source control measures within each sub-catchment has not been defined.
This is because it is not feasible within a high level study, to identify those factors that define the
viability and impact of alternative measures. For example, detailed flow pathways, the depth to
groundwater, soils characteristics and small scale topography. Instead, it is recommended that if
these measures are taken forward for implementation, a more detailed study is carried out to
optimise the location of measures and hence their effectiveness.
A different set of criteria and factors is used at the catchment scale to allow for the attenuation and
variations of flow (Table 3.5). For example, while a specific source control measures may give
significant benefits at the local scale the impact may be lost at the catchment scale.
The significance of source control measures is based on the contribution of the specific sub-
catchment to the flow at the assessment location. This uses a simple QMED ratio to indicate the

River Nith restoration, cbec UK Ltd, October 2013
59
contribution that a specific sub-catchment makes to the QMED at an assessment point. The criteria
for floodplain measures remain the same.
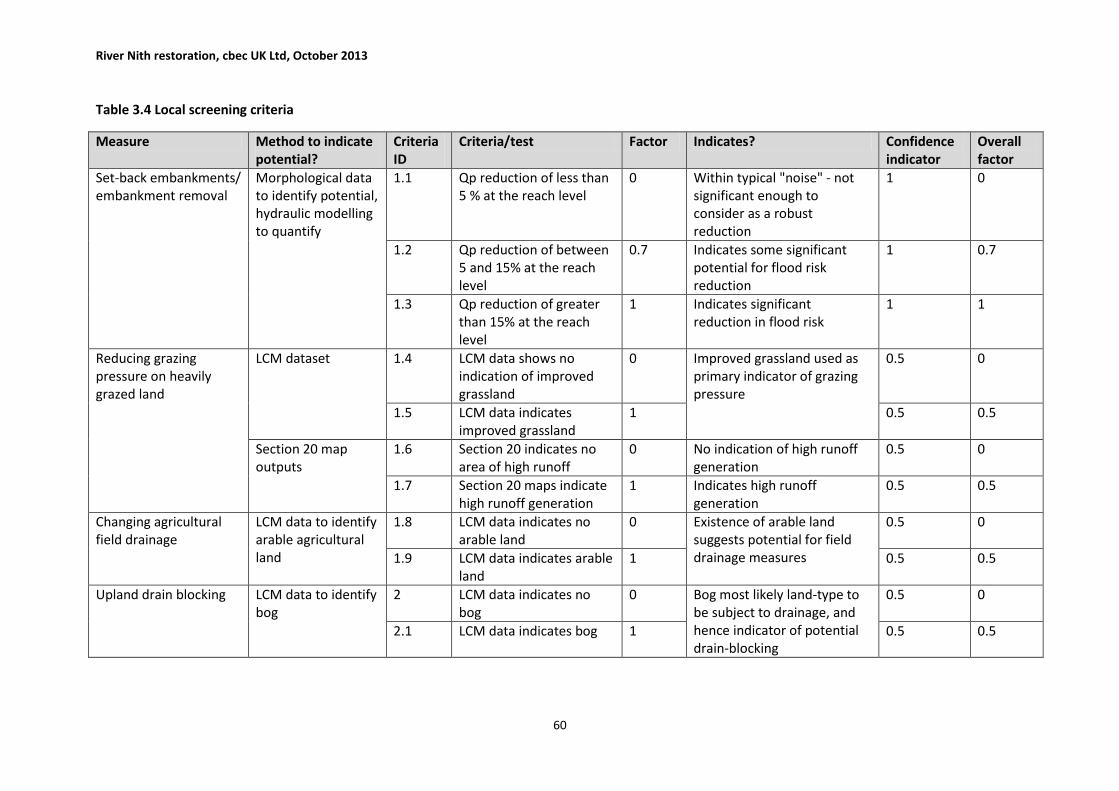
River Nith restoration, cbec UK Ltd, October 2013
60
Table 3.4 Local screening criteria
Measure Method to indicate potential?
Criteria ID
Criteria/test Factor Indicates? Confidence indicator
Overall factor
Set-back embankments/ embankment removal
Morphological data to identify potential, hydraulic modelling to quantify
1.1 Qp reduction of less than 5 % at the reach level
0 Within typical "noise" - not significant enough to consider as a robust reduction
1 0
1.2 Qp reduction of between 5 and 15% at the reach level
0.7 Indicates some significant potential for flood risk reduction
1 0.7
1.3 Qp reduction of greater than 15% at the reach level
1 Indicates significant reduction in flood risk
1 1
Reducing grazing pressure on heavily grazed land
LCM dataset 1.4 LCM data shows no indication of improved grassland
0 Improved grassland used as primary indicator of grazing pressure
0.5 0
1.5 LCM data indicates improved grassland
1 0.5 0.5
Section 20 map outputs
1.6 Section 20 indicates no area of high runoff
0 No indication of high runoff generation
0.5 0
1.7 Section 20 maps indicate high runoff generation
1 Indicates high runoff generation
0.5 0.5
Changing agricultural field drainage
LCM data to identify arable agricultural land
1.8 LCM data indicates no arable land
0 Existence of arable land suggests potential for field drainage measures
0.5 0
1.9 LCM data indicates arable land
1 0.5 0.5
Upland drain blocking LCM data to identify bog
2 LCM data indicates no bog
0 Bog most likely land-type to be subject to drainage, and hence indicator of potential drain-blocking
0.5 0
2.1 LCM data indicates bog 1 0.5 0.5

River Nith restoration, cbec UK Ltd, October 2013
61
Measure Method to indicate potential?
Criteria ID
Criteria/test Factor Indicates? Confidence indicator
Overall factor
Floodplain/Riparian Afforestation
LCM to identify non-wooded floodplain areas
2.2 LCM data indicates woodland area in floodplain
0 Absence of woodland an indicator of potential
0.5 0
2.3 LCM data indicates no woodland in floodplain
1 Absence of woodland an indicator of potential
0.5 0.5
Gully Woodland Planting
Slope 2.4 Extensive areas of flat ground
0 Steep ground indicator of gully potential
0.5 0
2.5 Extensive areas of slope >15 degrees
1 0.5 0.5
Creation of Tree Shelter Belts
Slope 2.6 Extensive areas of flat ground
0 Steep ground indicator of tree shelter belt potential
0.5 0
2.7 Extensive areas of slope >15 degrees
1 0.5 0.5
Drain Blocking/Wetland Restoration
LCM data to identify bog
2.8 LCM data indicates no bog
0 Bog an indicator of wetland, potential for drain blocking
0.5 0
2.9 LCM data indicates bog 1 0.5 0.5
Reducing soil compaction in arable areas, improving soil texture, reducing bare earth in wetter seasons
LCM data to identify arable land/pasture
3 LCM data does not indicate arable land/pasture
0 Arable land/pasture indicator of potentially compacted soils
0.5 0
3.1 LCM data indicates arable land/pasture
1 0.5 0.5
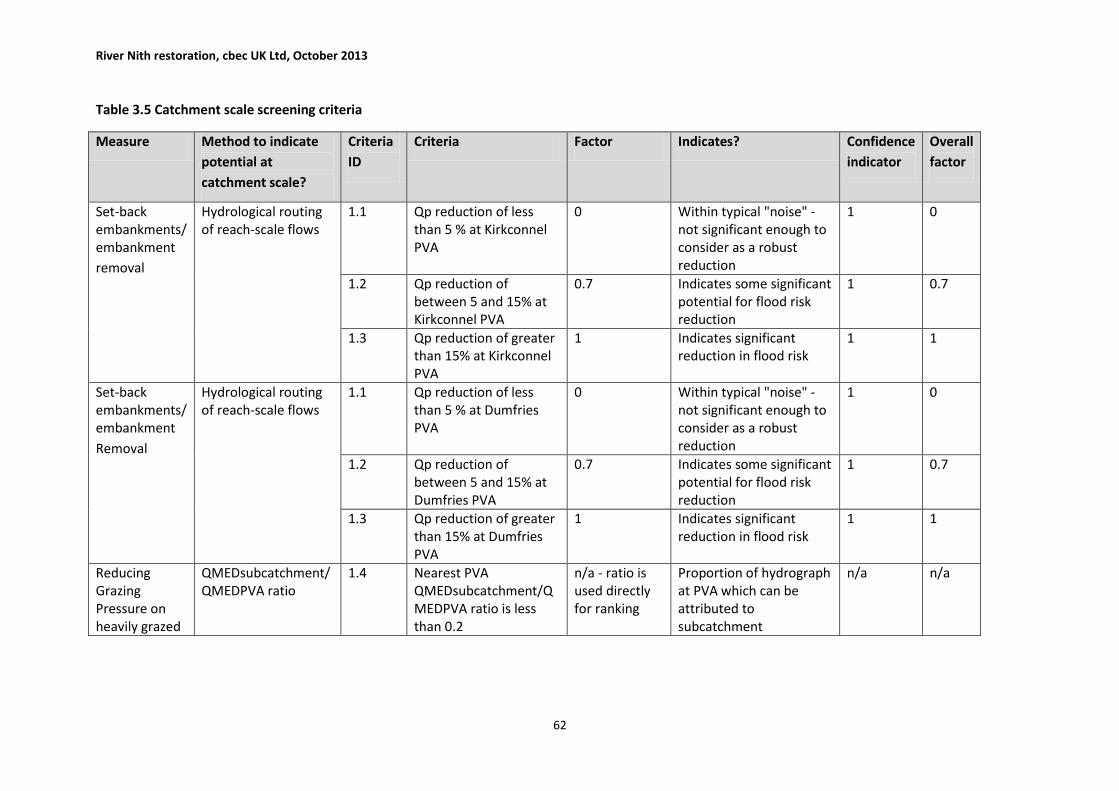
River Nith restoration, cbec UK Ltd, October 2013
62
Table 3.5 Catchment scale screening criteria
Measure Method to indicate
potential at
catchment scale?
Criteria
ID
Criteria Factor Indicates? Confidence
indicator
Overall
factor
Set-back embankments/ embankment
removal
Hydrological routing of reach-scale flows
1.1 Qp reduction of less than 5 % at Kirkconnel PVA
0 Within typical "noise" - not significant enough to consider as a robust reduction
1 0
1.2 Qp reduction of between 5 and 15% at Kirkconnel PVA
0.7 Indicates some significant potential for flood risk reduction
1 0.7
1.3 Qp reduction of greater than 15% at Kirkconnel PVA
1 Indicates significant reduction in flood risk
1 1
Set-back embankments/ embankment
Removal
Hydrological routing of reach-scale flows
1.1 Qp reduction of less than 5 % at Dumfries PVA
0 Within typical "noise" - not significant enough to consider as a robust reduction
1 0
1.2 Qp reduction of between 5 and 15% at Dumfries PVA
0.7 Indicates some significant potential for flood risk reduction
1 0.7
1.3 Qp reduction of greater than 15% at Dumfries PVA
1 Indicates significant reduction in flood risk
1 1
Reducing Grazing Pressure on heavily grazed
QMEDsubcatchment/QMEDPVA ratio
1.4 Nearest PVA QMEDsubcatchment/QMEDPVA ratio is less than 0.2
n/a - ratio is used directly for ranking
Proportion of hydrograph at PVA which can be attributed to subcatchment
n/a n/a
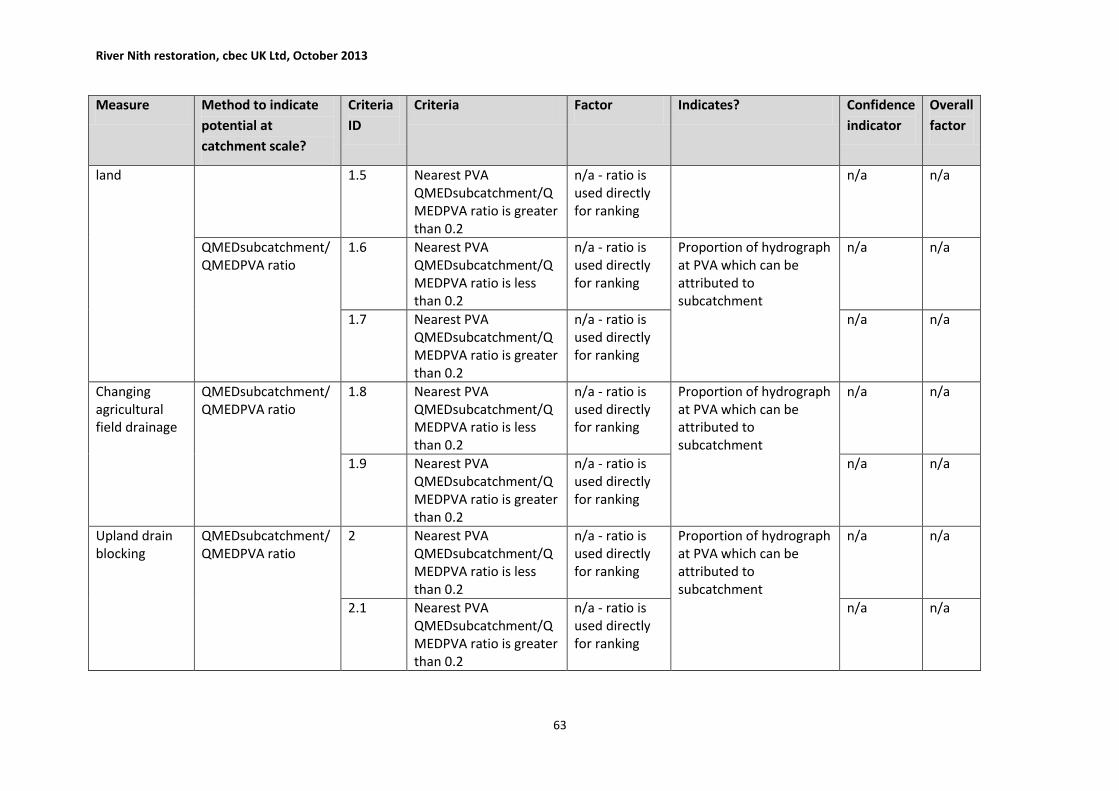
River Nith restoration, cbec UK Ltd, October 2013
63
Measure Method to indicate
potential at
catchment scale?
Criteria
ID
Criteria Factor Indicates? Confidence
indicator
Overall
factor
land 1.5 Nearest PVA QMEDsubcatchment/QMEDPVA ratio is greater than 0.2
n/a - ratio is used directly for ranking
n/a n/a
QMEDsubcatchment/QMEDPVA ratio
1.6 Nearest PVA QMEDsubcatchment/QMEDPVA ratio is less than 0.2
n/a - ratio is used directly for ranking
Proportion of hydrograph at PVA which can be attributed to subcatchment
n/a n/a
1.7 Nearest PVA QMEDsubcatchment/QMEDPVA ratio is greater than 0.2
n/a - ratio is used directly for ranking
n/a n/a
Changing agricultural field drainage
QMEDsubcatchment/QMEDPVA ratio
1.8 Nearest PVA QMEDsubcatchment/QMEDPVA ratio is less than 0.2
n/a - ratio is used directly for ranking
Proportion of hydrograph at PVA which can be attributed to subcatchment
n/a n/a
1.9 Nearest PVA QMEDsubcatchment/QMEDPVA ratio is greater than 0.2
n/a - ratio is used directly for ranking
n/a n/a
Upland drain blocking
QMEDsubcatchment/QMEDPVA ratio
2 Nearest PVA QMEDsubcatchment/QMEDPVA ratio is less than 0.2
n/a - ratio is used directly for ranking
Proportion of hydrograph at PVA which can be attributed to subcatchment
n/a n/a
2.1 Nearest PVA QMEDsubcatchment/QMEDPVA ratio is greater than 0.2
n/a - ratio is used directly for ranking
n/a n/a
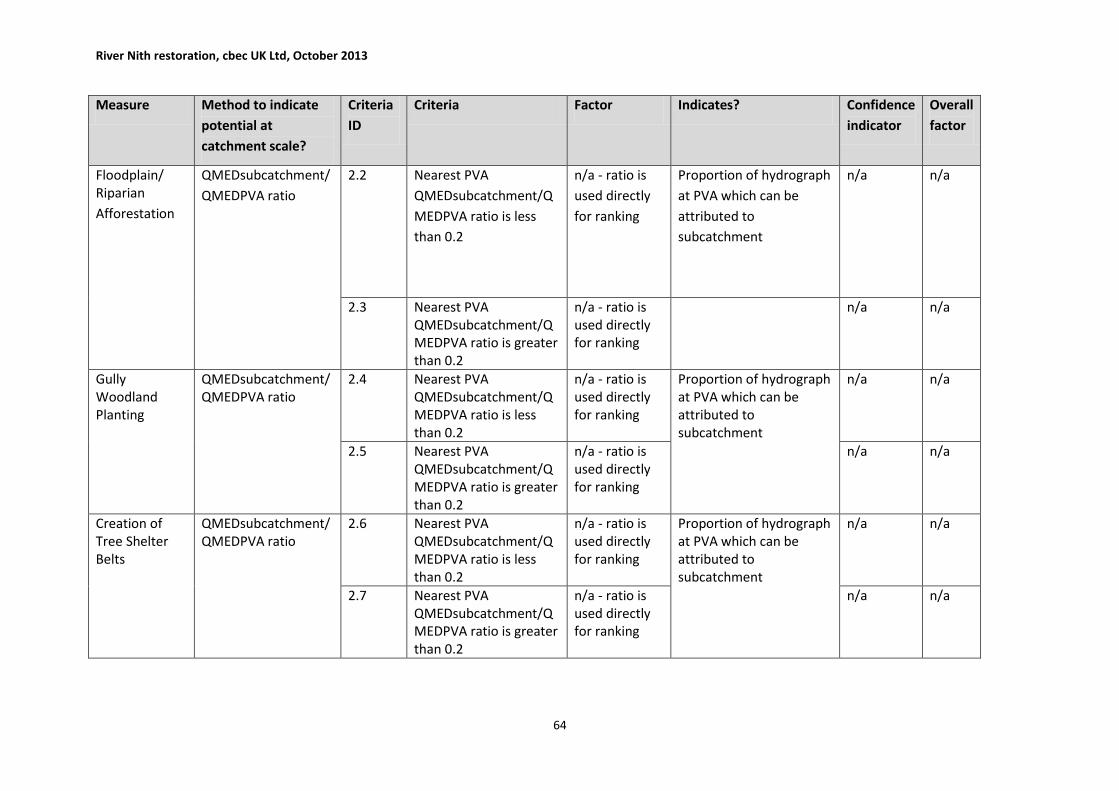
River Nith restoration, cbec UK Ltd, October 2013
64
Measure Method to indicate
potential at
catchment scale?
Criteria
ID
Criteria Factor Indicates? Confidence
indicator
Overall
factor
Floodplain/ Riparian
Afforestation
QMEDsubcatchment/
QMEDPVA ratio
2.2 Nearest PVA
QMEDsubcatchment/Q
MEDPVA ratio is less
than 0.2
n/a - ratio is
used directly
for ranking
Proportion of hydrograph
at PVA which can be
attributed to
subcatchment
n/a n/a
2.3 Nearest PVA QMEDsubcatchment/QMEDPVA ratio is greater than 0.2
n/a - ratio is used directly for ranking
n/a n/a
Gully Woodland Planting
QMEDsubcatchment/QMEDPVA ratio
2.4 Nearest PVA QMEDsubcatchment/QMEDPVA ratio is less than 0.2
n/a - ratio is used directly for ranking
Proportion of hydrograph at PVA which can be attributed to subcatchment
n/a n/a
2.5 Nearest PVA QMEDsubcatchment/QMEDPVA ratio is greater than 0.2
n/a - ratio is used directly for ranking
n/a n/a
Creation of Tree Shelter Belts
QMEDsubcatchment/QMEDPVA ratio
2.6 Nearest PVA QMEDsubcatchment/QMEDPVA ratio is less than 0.2
n/a - ratio is used directly for ranking
Proportion of hydrograph at PVA which can be attributed to subcatchment
n/a n/a
2.7 Nearest PVA QMEDsubcatchment/QMEDPVA ratio is greater than 0.2
n/a - ratio is used directly for ranking
n/a n/a

River Nith restoration, cbec UK Ltd, October 2013
65
Measure Method to indicate
potential at
catchment scale?
Criteria
ID
Criteria Factor Indicates? Confidence
indicator
Overall
factor
Drain Blocking/ Wetland
Restoration
QMEDsubcatchment/
QMEDPVA ratio
2.8 Nearest PVA
QMEDsubcatchment/Q
MEDPVA ratio is less
than 0.2
n/a - ratio is
used directly
for ranking
Proportion of hydrograph
at PVA which can be
attributed to
subcatchment
n/a n/a
2.9 Nearest PVA QMEDsubcatchment/QMEDPVA ratio is greater than 0.2
n/a - ratio is used directly for ranking
n/a n/a
Reducing soil compaction in arable areas, improving soil texture, reducing bare earth in wetter seasons
QMEDsubcatchment/QMEDPVA ratio
3 Nearest PVA QMEDsubcatchment/QMEDPVA ratio is less than 0.2
n/a - ratio is used directly for ranking
Proportion of hydrograph at PVA which can be attributed to subcatchment
n/a n/a
3.1 Nearest PVA QMEDsubcatchment/QMEDPVA ratio is greater than 0.2
n/a - ratio is used directly for ranking
n/a n/a

River Nith restoration, cbec UK Ltd, October 2013
66
3.10 DATA SUMMARY Several datasets have been used to inform a characterisation of the catchment. These include
rainfall, flow and GIS based datasets of landcover and topography (DTM). A full list of the datasets
used to inform the characterisation is given in Table 3.6.
Table 3.6 Dataset overview
Dataset Use Comments
HA79_mer_5m (GEORGE DTM) Sub-catchment identification, hydraulic modelling where no LiDAR exists
Also used to generate slope angle map.
Nith Flow Data Characterisation of catchment flood hydrology/runoff generation and for generating hydraulic model inputs.
See Section 3.5 for more detail on flow records.
Nith Rainfall Data Assessing spatial generation of runoff, storm event time to peak.
See Section 1.2.4.2 for more detail on rainfall records.
LCM 2007 Data Assessing land use for screening options, defining floodplain roughness for hydraulic modelling.
The 25m, 23 class data set was used.
Morphology Data When used in conjunction with the indicative flood map, provides an indication of potential for improving storage.
WFD water bodies classifications
Identification of water bodies current classification and objectives
Scottish Wetlands Inventory Assessing the location of Wetland areas
Time to peak Can be used to identify the syncretisation of sub-catchment.
Flood Risk Management PVAs Identifying the location of PVAs. See Section 1.2.6 for more details on PVAs.
Section 20 screening of opportunity areas for NFM
Runoff potential 250m, Slope roughness 250m and Slope screening 250m.
SAAR Grid Screening potential measures based on runoff generation.
HOST Grid Characterisation of soil type distribution within the catchment.
Indicative Flood Map Can be used to define floodplain extent.
Note when combined with information on morphology, this provides a useful basis for identifying channel based restoration measures.
Whitesands TUFLOW model Not used within this study
River Nith restoration, cbec UK Ltd, October 2013
67
3.10.1 DTM
GEORGE is a composite DTM, based upon several elevation products. The data has a 5m resolution
and uses a combination of LiDAR at 1-2m resolution and NEXTMAP at 5m resolution. Priority is given
to LiDAR where available, with NEXTMAP used to infill gaps. As GEORGE is of a lower resolution than
LiDAR, some of the enhanced definition present in LIDAR is lost as a result of the creation of
GEORGE.
GEORGE is used to provide an overview of elevations within the catchment. Where necessary it has
been used for sub-catchment delineation and for secondary analyses of slope and topography.
Hydraulic modelling made direct recourse to LiDAR because of the enhanced definition it provides,
with NEXMAP used to fill some small gaps.
3.10.2 Landcover
LCM2007 gives land cover information for the entire UK . It classifies land cover using 23 classes
based on the UK Biodiversity Action Plan (BAP) Broad Habitats, with some minor differences.
The data set is based on a created by classifying summer-winter composite images captured by
satellite sensors with 20-30m pixels. The dataset is an update on the 2000 dataset, but still
represents a snap shot in time.
The dataset is particularly useful for characterisation as the benefit of NFM measures is largely
dependent on the potential to change land cover and land management practices.
3.10.3 Section 20 data
Section 20 (S20) of the Flood Risk Management (Scotland) Act of 2009 requires SEPA to ‘SEPA to
assess possible contribution of alteration etc. of natural features and characteristics.’ The
assessment must ‘refer to a map showing where alteration (including enhancement) or restoration
of natural features and characteristics of any river basin or coastal area in the district could
contribute to management of flood risk in the district’.
SEPA has developed an assessment methodology (Nutt, 2012) and a number of datasets which will
be used by SEPA to produce the S20 map. Two datasets made available for this study:
Areas of high runoff generation (A)
Areas of floodplain storage potential (B)
The first provides an index of runoff based on the Environment Agency/JBA method for the
identification of catchments sensitive to land use change (Environment Agency, 2008). The second is
an index of the sensitivity of floodplain attenuation to a change in roughness (the indicative
Increased Storage Potential). Both datasets are based on national data sets and have not been
refined to the specific characteristics of the Nith.
The Section 20 data have been used extensively within this study. The original methodology was
developed to use readily available datasets (Section 20 data were made available some way through
the project) and as such this was the approach taken forward to defining areas where measures
could be located. Future studies would be able to make more use of Section 20 data from the outset
as it is likely this data would be readily available. The use of hydraulic modelling essentially takes a
more refined approach to floodplain storage and so the benefit of using ISP is limited.
River Nith restoration, cbec UK Ltd, October 2013
68
One interesting aspect of the Section 20 data is that the areas highlighted as having high floodplain
storage potential or high runoff generation (See Appendix G) tend to correspond with the areas
where measures are being proposed as part of this study. This indicates that the simple rule based
criteria used to define areas of interest corresponds well with what the Section 20 data identifies
and provides some confidence that the measures being proposed, and the locations, are
appropriate.
3.10.4 Rainfall
There are five SEPA rainfall gauges within the catchment (see Appendix G and Table 3.7). The five
rainfall gauges record 15 minute rainfall data and all cover a period from February 1989 to January
2013.
Table 3.7 Rainfall gauges present in the catchment
No. Name E N Start
115541 Craigdarroch 273942 590947 01/02/89
115562 Eliock 279666 607398 01/08/85
115568 Gatelawbridge 290083 596542 02/01/89
115616 Meadowfoot 286129 613853 01/10/86
115627 Newtonairds 288891 579935 01/11/88
3.10.5 River flow
There are eight SEPA gauging stations located within the Nith catchment (Appendix G and Table 3.8).
Table 3.8 Flow gauging stations within the catchment
No. Name River Area (km2) Start
133149 Capenoch Scar Water 142.0 01/01/88
133183 Dow Craig Beoch Lane 8.89 01/04/91
133155 Fiddlers Ford Cluden Water 238.0 01/01/88
133178 Waterhead Nith 11.8 01/04/99
133152 Dalgig Nith 28.0 01/04/91
133160 Hall Bridge Nith 155.0 01/01/88
133154 Drumlanrig Nith 471.0 01/01/88
133156 Friars Carse Nith 799.0 28/06/57
In all cases 15 minute stage records are converted to flow using an established stage-discharge
relationship. The stations are maintained by SEPA and data for Hall Bridge, Drumlanrig and Friars
Carse are available from the National River Flow Archive (NRFA).
3.10.6 The need for an intermediate screening approach
The characterisation, combined with the list of potential measures, gave a significant number of
possibilities where NFM opportunities existed. As the effectiveness of source control measures at
the catchment scale is still a matter of some debate, little was done as part of the initial
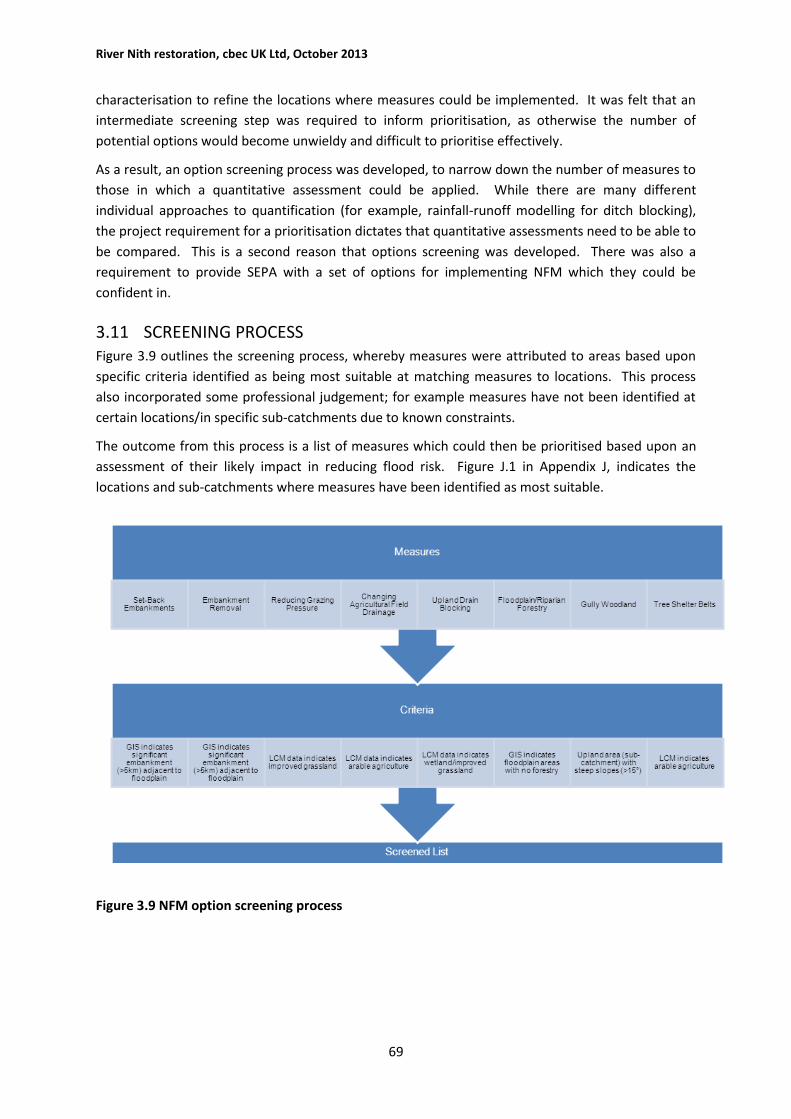
River Nith restoration, cbec UK Ltd, October 2013
69
characterisation to refine the locations where measures could be implemented. It was felt that an
intermediate screening step was required to inform prioritisation, as otherwise the number of
potential options would become unwieldy and difficult to prioritise effectively.
As a result, an option screening process was developed, to narrow down the number of measures to
those in which a quantitative assessment could be applied. While there are many different
individual approaches to quantification (for example, rainfall-runoff modelling for ditch blocking),
the project requirement for a prioritisation dictates that quantitative assessments need to be able to
be compared. This is a second reason that options screening was developed. There was also a
requirement to provide SEPA with a set of options for implementing NFM which they could be
confident in.
3.11 SCREENING PROCESS Figure 3.9 outlines the screening process, whereby measures were attributed to areas based upon
specific criteria identified as being most suitable at matching measures to locations. This process
also incorporated some professional judgement; for example measures have not been identified at
certain locations/in specific sub-catchments due to known constraints.
The outcome from this process is a list of measures which could then be prioritised based upon an
assessment of their likely impact in reducing flood risk. Figure J.1 in Appendix J, indicates the
locations and sub-catchments where measures have been identified as most suitable.
Figure 3.9 NFM option screening process
River Nith restoration, cbec UK Ltd, October 2013
70
3.12 OPTION ASSESSMENT The long list of options presented in Appendix J is used as the starting point for the assessment. The
resources required for the modelling approach dictate that not all areas identified under the
screening approach could be taken forward for assessment. A judgement was then made based on
the length of the proposed measure (for channel based options) and field information to determine
its likely impact (such as topography) and hence appropriateness for modelling.
The results were compared to the field assessment and where necessary the results were adjusted
to reflect variations between the national data sets and local information.
The details on the hydraulic modelling used for option assessment are presented in Appendix I. The
prioritised list of measures is presented in Appendix J, and the weightings used to prioritise options
presented in Section 3.9. Appendix J includes local, catchment and average scores for measures.
The average scores were used in the MCA, as there was no clear reason to prioritise either
catchment or local benefit.
Both local and catchment scale effects are reported. While no direction has been given on where
flood risk effects should be assessed, it is considered that a reduction in flood risk is most useful at
the catchment scale (assuming that catchment-scale assessment points are located in areas of
known flood risk).
3.13 LOCAL SCALE ASSESSMENT Local scale effects are those effects determined from assessment of individual measures at the reach
or sub-catchment scale. Within the Nith, modelling has indicated that there may be a significant
benefit in targeting the reach downstream of New Cumnock, as at the local scale there is a
significant reduction in the modelled peak flow as a result of removing embankments.
All other modelled reaches have indicated increases in flow. The reason for this is considered in
more detail in the discussion below. This is a high level assessment and so the results of the
modelling work should be viewed within this context. Further refinement of embankment removal
options could give rise to a positive effect, although this may require several model iterations and
was not within the scope of this project.
The local impact of source control measures has not been quantified, as it is considered that the
tools available for doing so are not developed enough to have confidence in the results. Moreover,
given the typical location of these measures, it is questionable as to how useful a local reduction in
flood risk is (and therefore they are most usefully assessed at the catchment scale).
3.14 CATCHMENT SCALE ASSESSMENT Catchment scale flood risk impact has been assessed at two separate locations, defined by the PVAs.
A routing model has been used to assess the impact of changes in the upper catchment at the
downstream PVA (Dumfries).
The routing model was only employed where positive effects were observed at the local scale. It is
considered that negative local effects (i.e. increase in flow) would not likely give rise to positive
catchment scale effects, as there is no foreseeable hydraulic reason for this to occur. Should any of
the options giving rise to negative effects be taken forward for further study, it is highly

River Nith restoration, cbec UK Ltd, October 2013
71
recommended that their local impact on flood risk is considered (i.e. the models are extended
downstream and refined).
As with the local scale results, a benefit at the Kirkconnel PVA was observed as a result of measures
implemented just downstream of New Cumnock. This benefit is not realised by the time these flows
arrive at the Thornhill area. This is principally due to the number of significant lateral inflows that
join the main stem of the Nith in the section between Hall Bridge and Thornhill.
As with other local results, no other options have indicated a significant catchment scale benefit in
reducing flood risk. Both the measures assessed around Thornhill and the lower Cairn Water
terminate either within or close to the Dumfries PVA, hence using the methodology a negative local
effect translates into a negative catchment effect.
While sub-catchments have been identified for source control measure implementation, there has
been a deliberate decision not to identify specific locations within these sub-catchments to
implement measures. If source control type measures are to be implemented, then a more detailed
local assessment is recommended, as this is likely to provide more confidence in ensuring the
appropriate placing of measures in relation to observed flow pathways. This work has simple sought
to highlight those sub-catchments where measures are most likely to be effective at the aggregate
scale, based upon a simple hydrometric indicator.
NFM measures and their associated scores are shown in Table 3.9, while further discussion on the
options is provided in Appendix J.
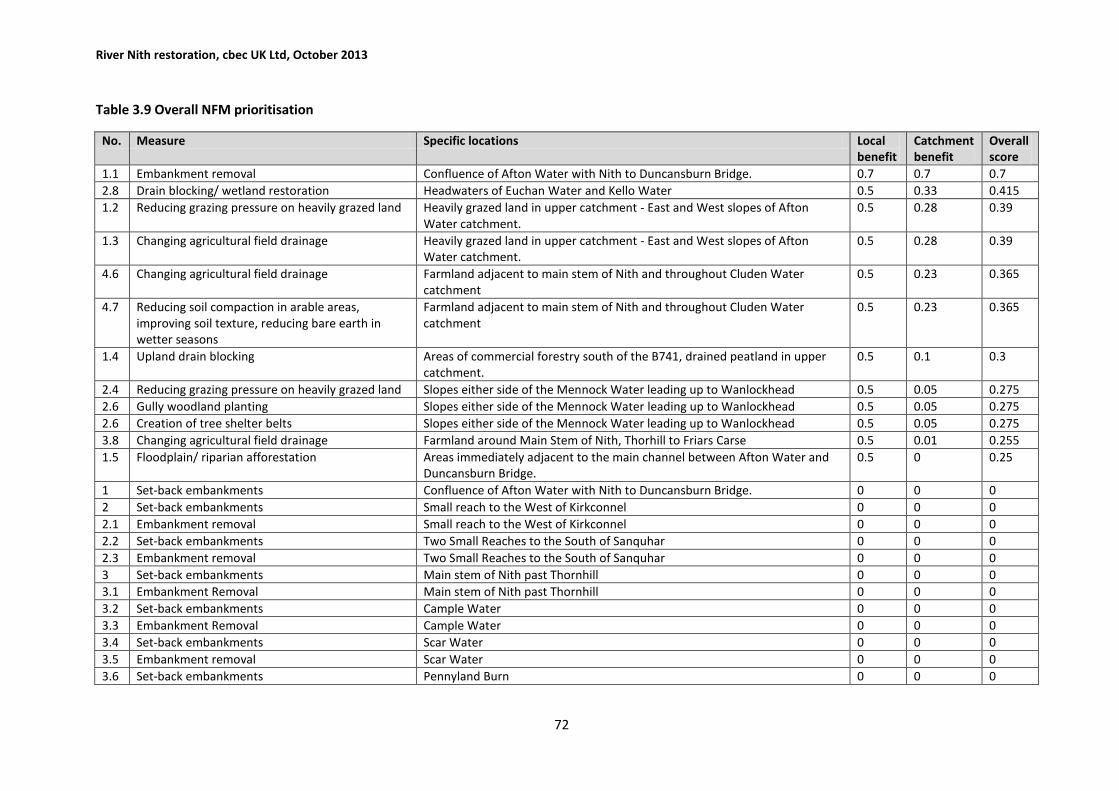
River Nith restoration, cbec UK Ltd, October 2013
72
Table 3.9 Overall NFM prioritisation
No. Measure Specific locations Local benefit
Catchment benefit
Overall score
1.1 Embankment removal Confluence of Afton Water with Nith to Duncansburn Bridge. 0.7 0.7 0.7
2.8 Drain blocking/ wetland restoration Headwaters of Euchan Water and Kello Water 0.5 0.33 0.415
1.2 Reducing grazing pressure on heavily grazed land Heavily grazed land in upper catchment - East and West slopes of Afton Water catchment.
0.5 0.28 0.39
1.3 Changing agricultural field drainage Heavily grazed land in upper catchment - East and West slopes of Afton Water catchment.
0.5 0.28 0.39
4.6 Changing agricultural field drainage Farmland adjacent to main stem of Nith and throughout Cluden Water catchment
0.5 0.23 0.365
4.7 Reducing soil compaction in arable areas, improving soil texture, reducing bare earth in wetter seasons
Farmland adjacent to main stem of Nith and throughout Cluden Water catchment
0.5 0.23 0.365
1.4 Upland drain blocking Areas of commercial forestry south of the B741, drained peatland in upper catchment.
0.5 0.1 0.3
2.4 Reducing grazing pressure on heavily grazed land Slopes either side of the Mennock Water leading up to Wanlockhead 0.5 0.05 0.275
2.6 Gully woodland planting Slopes either side of the Mennock Water leading up to Wanlockhead 0.5 0.05 0.275
2.6 Creation of tree shelter belts Slopes either side of the Mennock Water leading up to Wanlockhead 0.5 0.05 0.275
3.8 Changing agricultural field drainage Farmland around Main Stem of Nith, Thorhill to Friars Carse 0.5 0.01 0.255
1.5 Floodplain/ riparian afforestation Areas immediately adjacent to the main channel between Afton Water and Duncansburn Bridge.
0.5 0 0.25
1 Set-back embankments Confluence of Afton Water with Nith to Duncansburn Bridge. 0 0 0
2 Set-back embankments Small reach to the West of Kirkconnel 0 0 0
2.1 Embankment removal Small reach to the West of Kirkconnel 0 0 0
2.2 Set-back embankments Two Small Reaches to the South of Sanquhar 0 0 0
2.3 Embankment removal Two Small Reaches to the South of Sanquhar 0 0 0
3 Set-back embankments Main stem of Nith past Thornhill 0 0 0
3.1 Embankment Removal Main stem of Nith past Thornhill 0 0 0
3.2 Set-back embankments Cample Water 0 0 0
3.3 Embankment Removal Cample Water 0 0 0
3.4 Set-back embankments Scar Water 0 0 0
3.5 Embankment removal Scar Water 0 0 0
3.6 Set-back embankments Pennyland Burn 0 0 0

River Nith restoration, cbec UK Ltd, October 2013
73
No. Measure Specific locations Local benefit
Catchment benefit
Overall score
3.7 Embankment removal Pennyland Burn 0 0 0
4 Set-back embankments Upper Cairn Water 0 0 0
4.1 Embankment removal Upper Cairn Water 0 0 0
4.2 Set-back embankments Main Stem of Nith from Friars Carse to Dumfries/ Whitesands 0 -1 -0.5
4.3 Embankment removal Main Stem of Nith from Friars Carse to Dumfries/ Whitesands 0 -1 -0.5
4.4 Set-back embankments Lower Cairn Water/Cluden 0 -1 -0.5
4.5 Embankment removal Lower Cairn Water/Cluden 0 -1 -0.5
River Nith restoration, cbec UK Ltd, October 2013
74
3.15 DISCUSSION It is not unexpected that the majority of measures indicate little benefit at the catchment scale.
There is very little literary evidence for catchment scale benefit from many of these measures (this
does not mean that they may not be effective). In addition, there is a lack of empirical evidence, as,
to date, monitoring a large number of disparate measures has not been undertaken in a catchment
the size of the Nith.
The use of a 2D modelling approach has provided insights which would not necessarily be gained
from a more simplified modelling approach. In particular, the approach has indicated that
embankment removal at several locations may increase flood magnitudes.
One of the many advantages of these models is that as non-proprietary software, they can be taken
forward for further refinement of potential measures as well as refining model topography through
the inclusion of improved survey data.
3.15.1 Negative benefit from embankment removal
The mechanism for an increase in downstream flows following embankment removal is thought to
be as a result of embankment removal generating unhindered flowpaths, allowing floodplain flow
back into the channel faster than would occur if the embankments were in place. In these
circumstances, the embankments may act as a dam, preventing water behind the embankment from
returning to the channel and so reducing flows downstream.
3.15.2 Set back vs. full removal?
An early decision was made not to model set back embankments, despite being an option for
morphological/WFD restoration. This is because an early modelling test indicated increased flows
downstream as a result of this scenario. Current embankments show significant variations in
elevation, some as a result of damage or subsidence. Modelling indicates that these embankments
are typically not effective at retaining water; hence there is significant spill onto the floodplain
during an event. When embankments are set back, they are modelled assuming a constant height,
which is much more effective at retaining water (water which would have spilt onto the floodplain
during the baseline scenario). This is therefore considered to be the mechanism whereby set-back
embankments are increasing downstream flows.
3.15.3 Source control measures
There are numerous options for source control measures within the catchment. However, the
effectiveness of these measures is questionable at the catchment scale based upon the findings of
much of the current NFM literature. This does not mean that these measures should not be
implemented, but in providing SEPA with recommendations it is considered inappropriate to
recommend measures in which there is little confidence in their effectiveness.
As research and NFM implementation develops in Scotland, new tools will likely become available
that will allow a more appropriate assessment of these types of measures. It is also worth noting
that absence of evidence for catchment scale effects does not mean evidence of absence of an
effect and so implementation of these measures may still be appropriate, depending upon other
constraints such as funding and stakeholder willingness. In particular, these types of measures may

River Nith restoration, cbec UK Ltd, October 2013
75
increase resilience to climate change and therefore it may be beneficial to implement them, even if
quantification of the likely effect is highly uncertain (or not possible).

River Nith restoration, cbec UK Ltd, October 2013
76
4. STAKEHOLDER ENGAGEMENT
4.1 INTRODUCTION The River Nith has some history of stakeholder engagement, but does not currently have an active
catchment partnership. A Catchment Management Plan was produced by SEPA and other
stakeholders in 2006, in response to a recognised need for co-ordination of whole catchment issues.
The catchment stakeholders no longer meet collectively on a regular basis, but many of them still
work closely together to develop and deliver catchment scale projects in relation to key ‘issues’
identified in the plan. The river has a typical range of stakeholders, including local authorities,
anglers, conservationists and land managers. Flooding in Dumfries in recent years has caused
concern amongst residents and has raised the river’s profile within the local area.
The pilot catchment project within the River Nith therefore needed to inform and engage a range of
stakeholders and provide opportunities for direct discussion where necessary.
4.2 METHODS
4.2.1 Provision of summary material and introductory meetings
A summary of the project was prepared in discussion with SEPA. This summary described the
project’s proposed actions and provided contact details for further information. The summary was
distributed to a wide range of stakeholders, along with an offer to meet to discuss the project in
more detail if required. No stakeholders requested face-to-face meetings, although a number
responded expressing an interest in the final outputs of the project.
As the project team were less familiar with the Nith catchment, an initial site visit took place in late
March. At this time, a meeting was arranged with the Nith District Salmon Fishery Board (NDSFB) to
discuss potential restoration sites within the catchment. This provided the project team with an
opportunity to learn more about specific issues and sites within the Nith. At SEPA’s request, an
introductory meeting was also arranged with one of the landowners within the catchment, who had
already had discussions with SEPA about flood risk management potential on their land.
In June a further introductory meeting was arranged with Dumfries and Galloway Council to gather
additional information on their Whitesands flood risk project. Again, this provided an opportunity for
the project team to gather background information, but it should be noted that all three meetings
were at the request of the contractors, not the stakeholders.
4.2.2 Stakeholder workshop
Although the Nith does not have an extensive history of river restoration projects, a number of
projects have taken place within the catchment. To gather information on the work which has been
undertaken in the past, and to provide further information on the proposed approach for this
project, a half day workshop was organised for stakeholders. All relevant local stakeholders were
invited, focusing particularly on those who could provide detailed knowledge on restoration
activities within the catchment. The meeting was held at the SEPA offices in Dumfries and took place
on June 27th, 2013. Prior to the meeting, the following information was distributed:
A summary of the project
A map highlighting locations of potential restoration sites
River Nith restoration, cbec UK Ltd, October 2013
77
An email providing details of the background information that was sought for these areas
During the workshop, information was collected concerning previous and planned activities within
specific areas of the catchment.
The second section of the workshop focused on the likely Multi-Criteria Analysis (MCA) process to be
used later in the project. Some discussion of potential factors which could be included within the
MCA took place. Some attendees within the group made it clear that they would like to be able to
comment on the MCA process as well as the list of site produced at the end of the process.
Minutes of the workshop, along with the detailed site information, were sent to all the attendees for
checking. No corrections were received from any stakeholders.
4.2.3 Wider awareness raising with land managers
In recognition of the importance of effective engagement with land managers, SEPA developed
catchment-specific postcards for all four catchments involved in the pilot project. Land manager
engagement was especially important in the Nith because of the extensive survey work required.
The aspiration was to circulate postcards to all land managers within the catchment to ensure
everyone was aware before the project started. However, data protection issues prevented access
to the required address information.
The following alternative circulation options were then agreed, which were undertaken between
May and July:
An electronic version of the postcard and a summary of the project were provided to
Scottish Land and Estates, the National Farmers Union for Scotland and Scottish Tenant
Farmers Association to send to their members within the Nith catchment area. This
information was distributed by these organisations by email in mid May 2013.
Contact details from a previous SEPA-led invasive non-native species project were used to
contact landowners on the main stem river.
It was suggested that further address information could be obtained from the Assessors
Office at Dumfries and Galloway Council.
The on-site field survey team carried hard copies of the postcard which could be passed to
land owners they met when on site.
4.3 STAKEHOLDER CONSULTATION OF OPTIONS The ranked listing of potential restoration sites resulting from the MCA (Section 5) was distributed to
stakeholders, along with a document which summarised the approach that was taken for ranking the
sites. Stakeholders were asked to provide feedback on the sites, including:
Any knowledge of previous discussions with landowners
Stakeholder support for the action
Potential delivery mechanisms for implementing the action
The feedback received was used within the final assessment and prioritisation of options (Section 6)
and is summarised on the reach summary sheets for the ten options that the prioritisation process
found to be the most favourable (Appendix M)

River Nith restoration, cbec UK Ltd, October 2013
78
A final presentation of the project’s findings is recommended for the Nith catchment. This will
provide a further opportunity to raise awareness of the project prior to moving to the
implementation stage.
River Nith restoration, cbec UK Ltd, October 2013
79
5. MULTI-CRITERIA ANALYSIS OF OPTIONS Following identification of potential morphological restoration options (Section 2.6) and potential
natural flood management opportunities (Section 3) in the Nith catchment, the two sets of
opportunities were spatially integrated in order to undertake multi-criteria analysis (MCA). Also
incorporated in the MCA was further ecological and socio-economic information that allowed
assessment of the secondary benefits, and any constraints, associated with the restoration options.
MCA was used as a semi-quantitative means of assessing the multiple benefits associated with
undertaking restoration actions at each identified location, and through this to prioritise
opportunities that provided the greatest overall benefit. This section describes the MCA and explains
the rules used to score options for each of the criteria. The results of the MCA are provided in
Appendix K.
5.1 INTEGRATION OF WFD AND NFM OPTIONS AND INITIAL SCREENING The locations of potential WFD restoration and NFM opportunities (Appendix D and Appendix J) as
generated through the initial prioritisation exercise (Sections 2.6 and 3.15), were integrated to
produce a combined list of 36 locations where either one or both issues could be addressed. Any
potential MFM measures in locations that did not have an opportunity for WFD restoration were
removed from the combined list and have been assessed separately in Section 3. The reaches
defined in the analysis of WFD restoration opportunities were used to define the extent of each
restoration opportunity taken forward to the MCA.
An initial screening of the list was undertaken, based on the following rules and assumptions, to
reduce the options to a manageable number for MCA.
Most restoration reaches included several restoration actions to address multiple pressures.
The first assumption was that within a restoration reach all identified restoration actions
would be addressed, where possible, because this would constitute a more cost-effective
approach to achieving benefits. Therefore, each restoration reach in the list represented
one restoration option within the MCA (i.e. different combinations of possible restoration
actions within a reach were not considered).
It was also assumed that it would be preferable for embankments and high impact
realignment (HIR) to be addressed by full removal/mitigation, rather than by changing to set
back embankments/low impact realignment (LIR), so these were the actions that were
addressed in the MCA at this stage. Subsequent, more detailed analysis of the favoured
options may indicate that full removal of embankments or HIR is not feasible due to
adjacent land use, cost or other site-specific issues, in which case the alternative options of
changing to set back embankments/LIR could be considered instead.
A set of rules was used to remove options that were considered to have a minor benefit on
morphological capacity used. These are summarised in Table 5.1. Thresholds were set for
capacity released. Measures that released less capacity than this threshold were excluded
from the list of options. An exception to this was where a measure to address embankments
or in-channel pressures released less capacity than the threshold, but coincided with a
measure to mitigate realignment, as it was assumed mitigation of realignment would also
address embankments and in-channel pressures (e.g. bank protection and croys) as part of
the restoration works. A further exception was where inclusion of the measure allowed
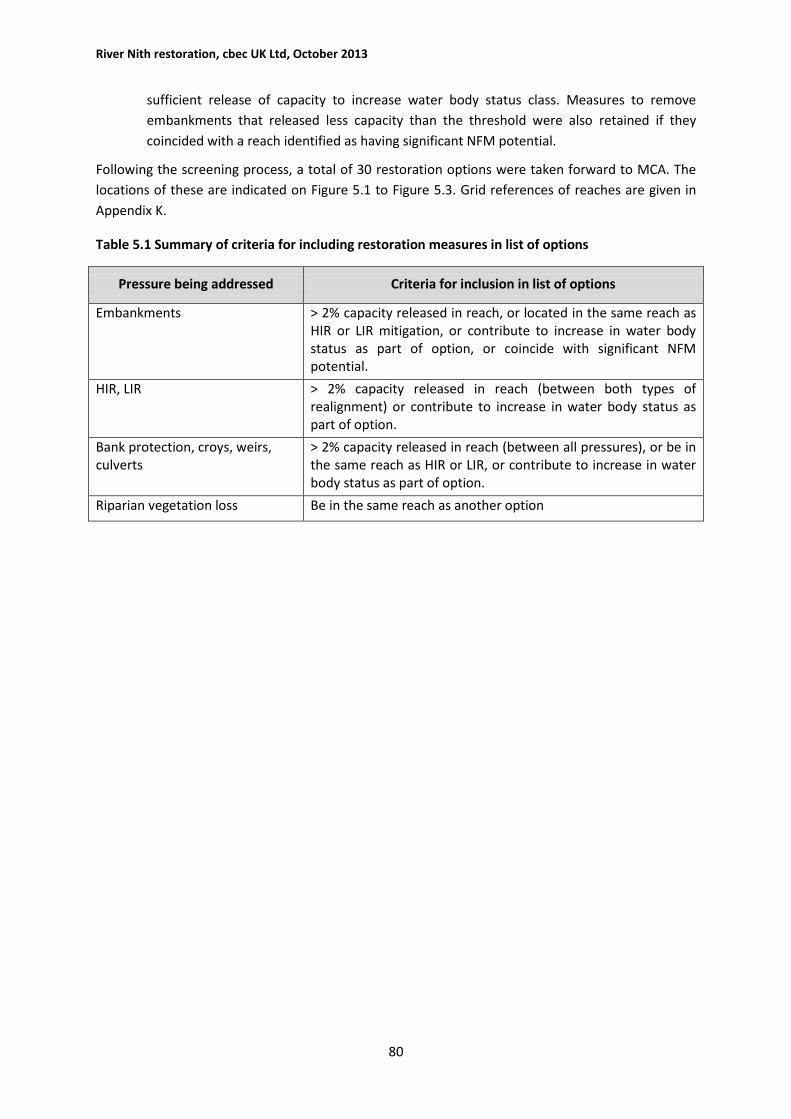
River Nith restoration, cbec UK Ltd, October 2013
80
sufficient release of capacity to increase water body status class. Measures to remove
embankments that released less capacity than the threshold were also retained if they
coincided with a reach identified as having significant NFM potential.
Following the screening process, a total of 30 restoration options were taken forward to MCA. The
locations of these are indicated on Figure 5.1 to Figure 5.3. Grid references of reaches are given in
Appendix K.
Table 5.1 Summary of criteria for including restoration measures in list of options
Pressure being addressed Criteria for inclusion in list of options
Embankments > 2% capacity released in reach, or located in the same reach as HIR or LIR mitigation, or contribute to increase in water body status as part of option, or coincide with significant NFM potential.
HIR, LIR > 2% capacity released in reach (between both types of realignment) or contribute to increase in water body status as part of option.
Bank protection, croys, weirs, culverts
> 2% capacity released in reach (between all pressures), or be in the same reach as HIR or LIR, or contribute to increase in water body status as part of option.
Riparian vegetation loss Be in the same reach as another option
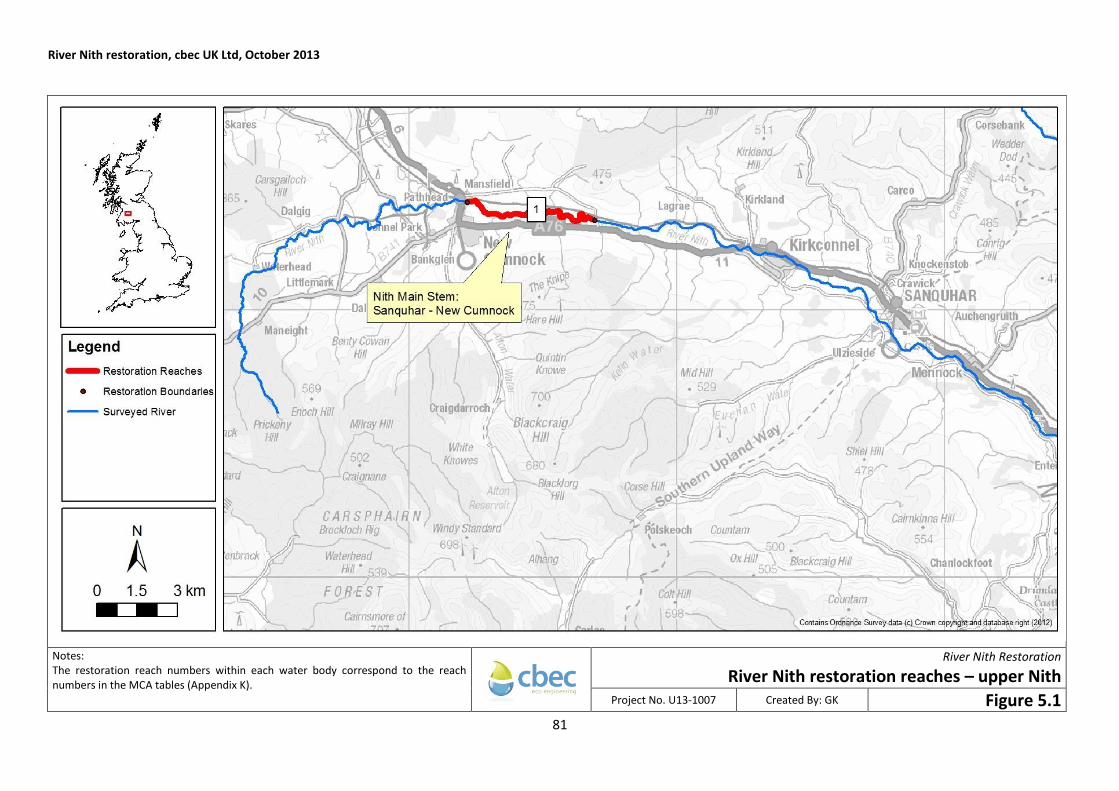
River Nith restoration, cbec UK Ltd, October 2013
81
Notes: The restoration reach numbers within each water body correspond to the reach numbers in the MCA tables (Appendix K).
River Nith Restoration
River Nith restoration reaches – upper Nith
Project No. U13-1007 Created By: GK Figure 5.1
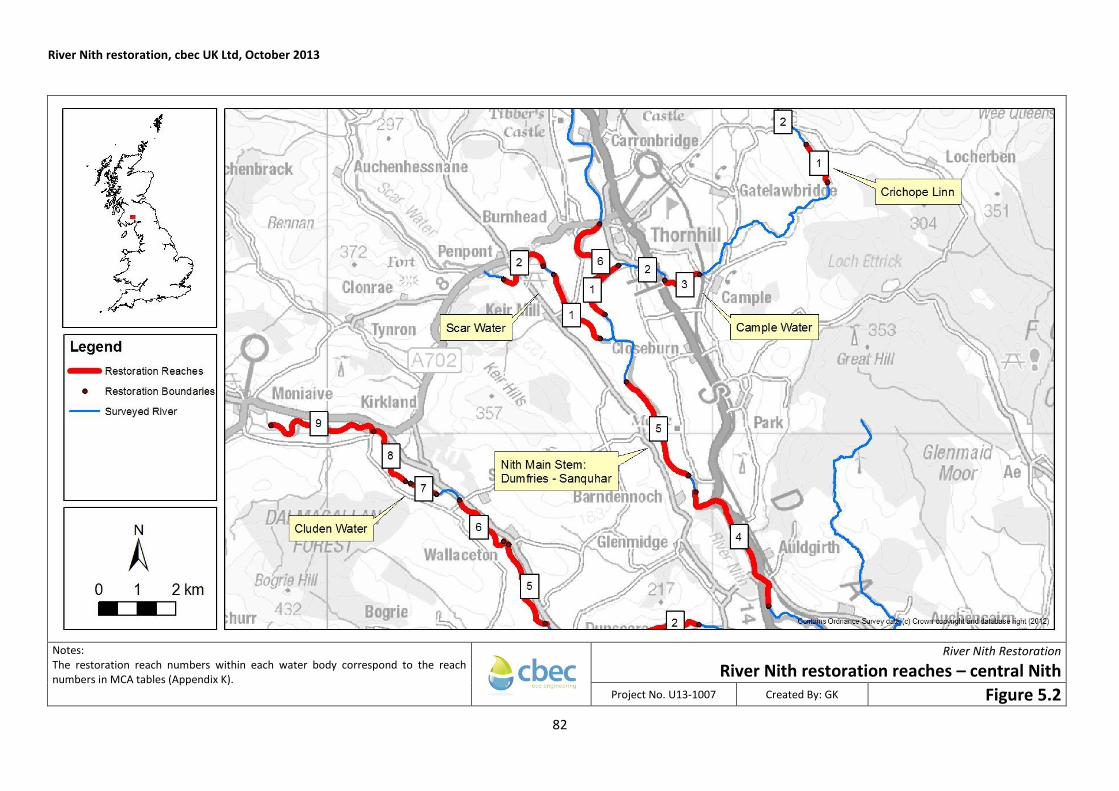
River Nith restoration, cbec UK Ltd, October 2013
82
Notes: The restoration reach numbers within each water body correspond to the reach numbers in MCA tables (Appendix K).
River Nith Restoration
River Nith restoration reaches – central Nith
Project No. U13-1007 Created By: GK Figure 5.2
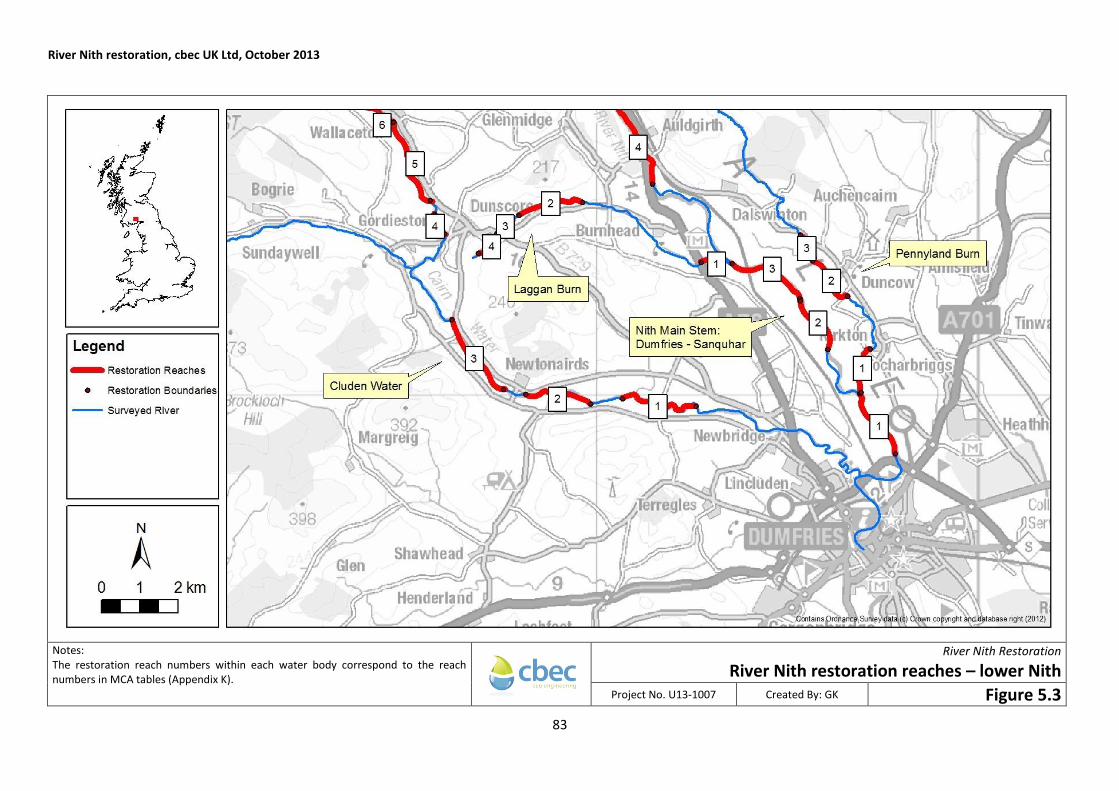
River Nith restoration, cbec UK Ltd, October 2013
83
Notes: The restoration reach numbers within each water body correspond to the reach numbers in MCA tables (Appendix K).
River Nith Restoration
River Nith restoration reaches – lower Nith
Project No. U13-1007 Created By: GK Figure 5.3

River Nith restoration, cbec UK Ltd, October 2013
84
5.2 SCORING OF MCA CRITERIA
5.2.1 WFD status for morphology
The score for the benefit of the option to WFD status for morphology was based whether the option
contributed to an increase in water body WFD status for morphology and on the MImAS percentage
capacity released. The scores assigned are shown in Table 5.2.
Table 5.2 Scoring criteria for morphological benefit
Criterion Score
Improves status to good 1
Improves status by 2 classes 0.75
Improves status by 1 class 0.5
Capacity released Percentage capacity released scaled from 0 to 0.25
5.2.2 Natural flood management
The score for the benefit of the option to NFM was based on the prioritisation scores generated in
the NFM assessment. These are shown in Table 3.9. NFM options that did not coincide with a
morphological restoration option were not included in the MCA, but this does not mean that they
should be excluded from future consideration.
5.2.3 Environmental criteria
Options were scored for various criteria relating to their additional benefits to habitat and ecological
receptors. This assessment was carried out using desk-based information, expert judgment and
existing local knowledge of the project team. Given that there was no scope for undertaking site
visits as part of this assessment, information about site-specific factors was limited. For each
criterion a set of simple rules was used to determine the assigned score. These are described below.
The simple scores reflect the high level, desk-based nature of this assessment.
5.2.3.1 Impact on nationally designated protected areas
Within the Nith catchment there are a number of designated protected areas, including SSSIs and
SPAs. Any reach which is within a protected area would obtain an additional score, for its potential
to deliver multiple benefits. However, none of the identified options impacted on these areas so the
criterion was not considered further.
5.2.3.2 Surrounding habitat creation potential
Sites were scored according to whether they could provide an opportunity to link existing areas of
habitat which were adjacent to the reach. Ideally, this should be done using a habitat network
approach, by modelling the dispersal distances of suitable focal species (in this case, a wetland
species would be most useful) and highlighting where habitat creation/ restoration has the potential
to increase functionally connected areas of habitat. However, no habitat network models have been
produced for the catchment, so an assessment of potential habitat connectivity (and how it could be
enhanced by the proposed restoration actions) had to be made from satellite imagery and SEPA’s
wetland inventory data. Wetland habitats can be difficult to detect accurately on satellite images, so
River Nith restoration, cbec UK Ltd, October 2013
85
only woodland and heathland habitats were used. Generally it is possible to detect the extents of
these habitats on satellite images, although it is not possible to assess the quality of the habitat
block.
The following scores were used (note that there are two types of situation in which a score of 2
would be applied):
1 – limited woodland or heathland habitat adjacent to the restoration reach, therefore limited
potential to increase habitat connectivity
2 – some small areas of woodland or heathland habitat adjacent to the restoration reach, but the
small size of the individual patches means that they have limited quality. There is potential to
connect these habitats during the restoration work, but the overall habitat area created and / or
connected will still be relatively small.
2 – significant areas of woodland or heathland habitat adjacent to the restoration reach, but the
measures proposed are unlikely to create additional habitat and therefore the patches will be likely
to remain separated and overall connectivity will not increase.
3 – significant areas of woodland or heathland habitat adjacent to the restoration reach, and the
restoration work proposed is likely to increase habitat areas and therefore result in additional
connectivity of habitats.
5.2.3.3 Potential to mitigate diffuse pollution
Some restoration measures can also contribute to tackling diffuse pollution issues. To assess the
potential for this within these sites, each reach was considered to establish whether it was failing
WFD water quality standards, using parameters which are most commonly associated with diffuse
pollution (diatoms and phosphorous levels). None of the reaches were failing the relevant water
quality standards. Therefore this criterion was not considered further.
5.2.3.4 Potential to address livestock poaching
Livestock poaching was observed in a number of locations on the Nith during the field surveys. This
pressure is not taken into account by MImAS, but in many cases can result in a significant alteration
to bank form and stability (Section 2.7.2). Reaches in which stock poaching was recorded were given
a score of 2.
5.2.4 Socio-economic criteria
Options were scored using a similar approach to the environmental criteria, based on a set of simple
rules and generally from desk-based information sources Information from stakeholders was used to
provide site-specific information where relevant. For example, this included information on plans to
develop additional recreational resources, or other adjacent opportunities for awareness-raising.
5.2.4.1 Impact on critical infrastructure
Critical infrastructure within the Nith catchment was considered to include all roads, railways,
Scottish Water assets and major housing areas.
Ideally impacts on critical infrastructure should be assessed on a site by site basis. For example, a re-
alignment project may still be possible, even with critical infrastructure within the reach, provided it
is carefully designed. However, in order to take account of the additional constraints that this
presents, sites were scored as shown in Table 5.3.

River Nith restoration, cbec UK Ltd, October 2013
86
Table 5.3 Scoring criteria for impact on critical infrastructure
Score Impact Definition
0 None No critical infrastructure within the reach, or if
critical infrastructure is present, but the measures
proposed are unlikely to impact on it (e.g.
removal of croys is unlikely to impact on a
Scottish Water asset, but realignment could)
-1 Possible Critical infrastructure exists within the reach and
could potentially be impacted by the work.
5.2.4.2 Potential to create recreational infrastructure
Some sites may offer the potential to incorporate recreational infrastructure (paths, community
wetland areas etc.) within their development. Again, this should be assessed in more detail on a site-
by-site basis in discussion with stakeholders. However, in order to highlight potential developments,
scores were assigned as per Table 5.4
Table 5.4 Scoring criteria for potential to create recreational infrastructure
Score Potential Definition
2 Yes, possible Stakeholder comments have shown that there is already interest in
developing / using recreational assets within the reach, or if the reach is
close to an existing recreation asset, or if it is within an area marked for
development within the local plan (where recreational opportunities
could potentially be incorporated in new developments)
0 No, unlikely No stakeholder comments, no existing recreational assets, not within a
development area.
5.2.4.3 Awareness raising potential
Large restoration projects could potentially be used to raise awareness of river restoration actions
and processes. However, not all sites are suitable. Some sites may be too inaccessible, or too far
from existing settlements. It is important that opportunities to tell local communities about the work
are taken up. To account for the potential to use a site for awareness raising, the following scores
were used (Table 5.5).
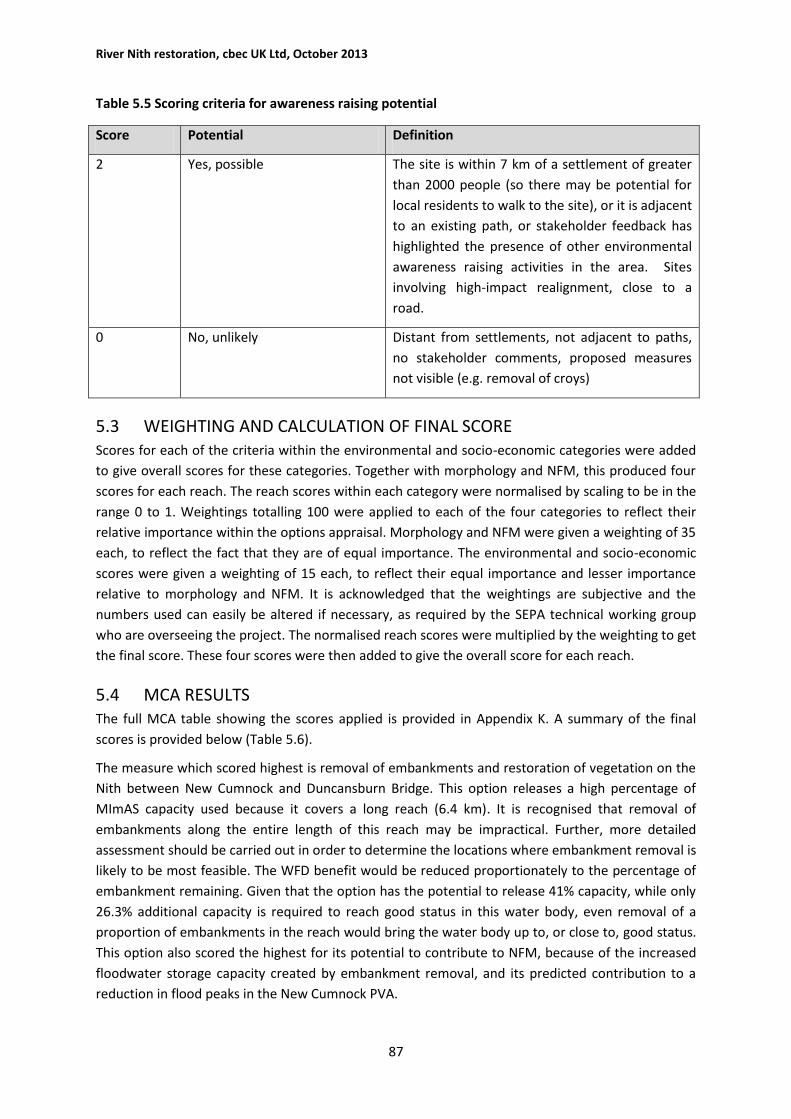
River Nith restoration, cbec UK Ltd, October 2013
87
Table 5.5 Scoring criteria for awareness raising potential
Score Potential Definition
2 Yes, possible The site is within 7 km of a settlement of greater
than 2000 people (so there may be potential for
local residents to walk to the site), or it is adjacent
to an existing path, or stakeholder feedback has
highlighted the presence of other environmental
awareness raising activities in the area. Sites
involving high-impact realignment, close to a
road.
0 No, unlikely Distant from settlements, not adjacent to paths,
no stakeholder comments, proposed measures
not visible (e.g. removal of croys)
5.3 WEIGHTING AND CALCULATION OF FINAL SCORE Scores for each of the criteria within the environmental and socio-economic categories were added
to give overall scores for these categories. Together with morphology and NFM, this produced four
scores for each reach. The reach scores within each category were normalised by scaling to be in the
range 0 to 1. Weightings totalling 100 were applied to each of the four categories to reflect their
relative importance within the options appraisal. Morphology and NFM were given a weighting of 35
each, to reflect the fact that they are of equal importance. The environmental and socio-economic
scores were given a weighting of 15 each, to reflect their equal importance and lesser importance
relative to morphology and NFM. It is acknowledged that the weightings are subjective and the
numbers used can easily be altered if necessary, as required by the SEPA technical working group
who are overseeing the project. The normalised reach scores were multiplied by the weighting to get
the final score. These four scores were then added to give the overall score for each reach.
5.4 MCA RESULTS The full MCA table showing the scores applied is provided in Appendix K. A summary of the final
scores is provided below (Table 5.6).
The measure which scored highest is removal of embankments and restoration of vegetation on the
Nith between New Cumnock and Duncansburn Bridge. This option releases a high percentage of
MImAS capacity used because it covers a long reach (6.4 km). It is recognised that removal of
embankments along the entire length of this reach may be impractical. Further, more detailed
assessment should be carried out in order to determine the locations where embankment removal is
likely to be most feasible. The WFD benefit would be reduced proportionately to the percentage of
embankment remaining. Given that the option has the potential to release 41% capacity, while only
26.3% additional capacity is required to reach good status in this water body, even removal of a
proportion of embankments in the reach would bring the water body up to, or close to, good status.
This option also scored the highest for its potential to contribute to NFM, because of the increased
floodwater storage capacity created by embankment removal, and its predicted contribution to a
reduction in flood peaks in the New Cumnock PVA.
River Nith restoration, cbec UK Ltd, October 2013
88
Other options which scored highly all included mitigation of HIR and embankment removal, because
of the large influence of these pressures on capacity used. These included one reach on the main
stem Nith (upstream of Auldgirth), together with reaches on Cample Water, Scar Water and
Pennyland Burn tributaries. All these high-scoring tributary reaches are located at the downstream
extents of the tributaries, where they have been realigned and embanked as they flow across the
Nith valley.
It is notable that all options on Cluden/Cairn water scored lowest in the MCA. This is because none
of the options in the water body result in improved WFD status, several of the reaches have few
additional environmental and socio-economic benefits and removal of embankments in the lower
Cairn Water was predicted to result in increased flood risk downstream (giving rise to a low NFM
score). Part of the reason that options in Cairn/Cluden Water water body have low morphology
scores is the bias in the MImAS scoring system, relating to water body length (discussed in Section
2.6.3). The other long water body (Nith from Dumfries to Sanquhar) also suffers a similar bias, with
many options towards the bottom of the list. However, options on this water body score higher than
Cairn/Cluden water because they generally have higher environmental and socio-economic scores.
This bias is addressed in the final assessment of options (Section 6), where a local morphological
benefit is taken into account.
It is recognised that option feasibility will be affected by a number of factors that were not included
in the MCA. A final assessment and prioritisation of options, taking into account cost, constraints and
other benefits/opportunities was carried out following the MCA, in order to produce a ranked list of
options based on benefits and practicalities of implementation. This is reported in Section 6.
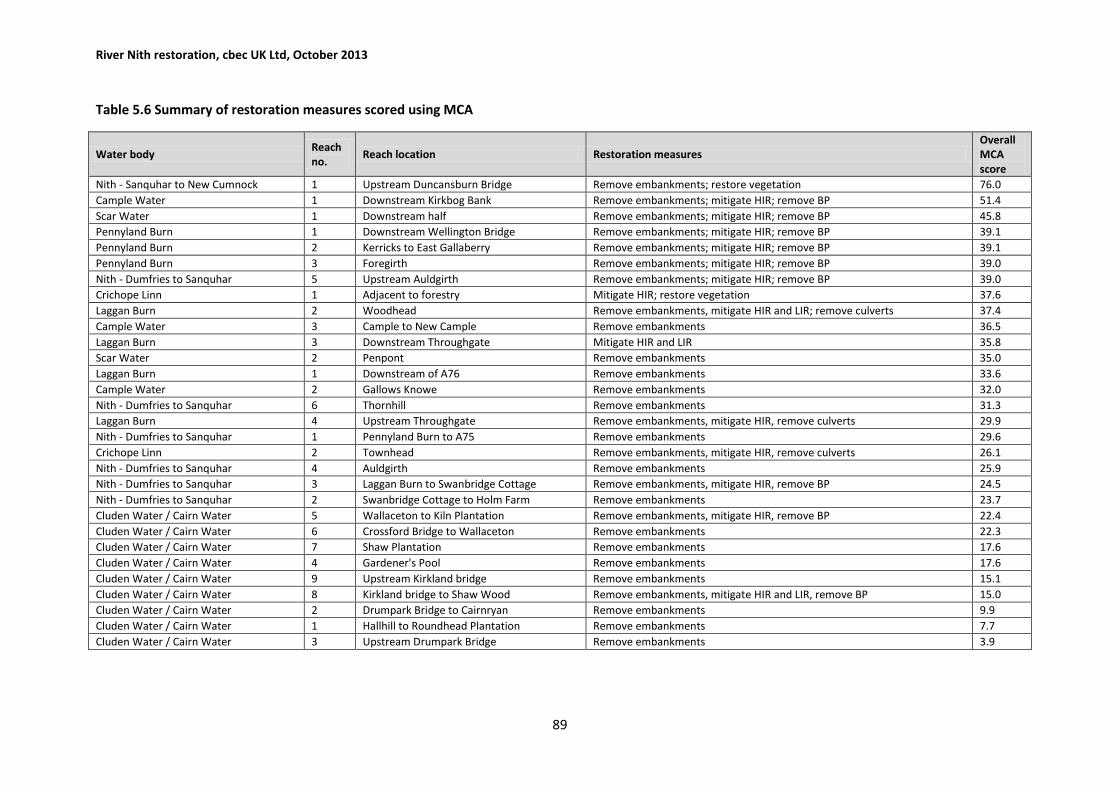
River Nith restoration, cbec UK Ltd, October 2013
89
Table 5.6 Summary of restoration measures scored using MCA
Water body Reach no.
Reach location Restoration measures Overall MCA score
Nith - Sanquhar to New Cumnock 1 Upstream Duncansburn Bridge Remove embankments; restore vegetation 76.0
Cample Water 1 Downstream Kirkbog Bank Remove embankments; mitigate HIR; remove BP 51.4
Scar Water 1 Downstream half Remove embankments; mitigate HIR; remove BP 45.8
Pennyland Burn 1 Downstream Wellington Bridge Remove embankments; mitigate HIR; remove BP 39.1
Pennyland Burn 2 Kerricks to East Gallaberry Remove embankments; mitigate HIR; remove BP 39.1
Pennyland Burn 3 Foregirth Remove embankments; mitigate HIR; remove BP 39.0
Nith - Dumfries to Sanquhar 5 Upstream Auldgirth Remove embankments; mitigate HIR; remove BP 39.0
Crichope Linn 1 Adjacent to forestry Mitigate HIR; restore vegetation 37.6
Laggan Burn 2 Woodhead Remove embankments, mitigate HIR and LIR; remove culverts 37.4
Cample Water 3 Cample to New Cample Remove embankments 36.5
Laggan Burn 3 Downstream Throughgate Mitigate HIR and LIR 35.8
Scar Water 2 Penpont Remove embankments 35.0
Laggan Burn 1 Downstream of A76 Remove embankments 33.6
Cample Water 2 Gallows Knowe Remove embankments 32.0
Nith - Dumfries to Sanquhar 6 Thornhill Remove embankments 31.3
Laggan Burn 4 Upstream Throughgate Remove embankments, mitigate HIR, remove culverts 29.9
Nith - Dumfries to Sanquhar 1 Pennyland Burn to A75 Remove embankments 29.6
Crichope Linn 2 Townhead Remove embankments, mitigate HIR, remove culverts 26.1
Nith - Dumfries to Sanquhar 4 Auldgirth Remove embankments 25.9
Nith - Dumfries to Sanquhar 3 Laggan Burn to Swanbridge Cottage Remove embankments, mitigate HIR, remove BP 24.5
Nith - Dumfries to Sanquhar 2 Swanbridge Cottage to Holm Farm Remove embankments 23.7
Cluden Water / Cairn Water 5 Wallaceton to Kiln Plantation Remove embankments, mitigate HIR, remove BP 22.4
Cluden Water / Cairn Water 6 Crossford Bridge to Wallaceton Remove embankments 22.3
Cluden Water / Cairn Water 7 Shaw Plantation Remove embankments 17.6
Cluden Water / Cairn Water 4 Gardener's Pool Remove embankments 17.6
Cluden Water / Cairn Water 9 Upstream Kirkland bridge Remove embankments 15.1
Cluden Water / Cairn Water 8 Kirkland bridge to Shaw Wood Remove embankments, mitigate HIR and LIR, remove BP 15.0
Cluden Water / Cairn Water 2 Drumpark Bridge to Cairnryan Remove embankments 9.9
Cluden Water / Cairn Water 1 Hallhill to Roundhead Plantation Remove embankments 7.7
Cluden Water / Cairn Water 3 Upstream Drumpark Bridge Remove embankments 3.9

River Nith restoration, cbec UK Ltd, October 2013
90
6. FINAL ASSESSMENT OF OPTIONS The MCA undertaken in Section 5 was based purely on the merits of each option in terms of its
benefit to geomorphology, natural flood management, environmental and socio-economic factors.
This approach was intended to ensure that options were initially ranked based on their maximum
potential benefit. No consideration was made of other factors which, in reality, will have an
important bearing on the practicalities of option implementation. These other factors, such as cost
and stakeholder co-operation, are discussed below and were used to provide a ‘reality check’ to the
prioritised list of options. The highest priority options once these additional factors had been taken
into account were then determined. This check includes an element of expert judgement and,
therefore, subjectivity. The assumptions and rules used to assess options are outlined below in order
to ensure that the process taken is as repeatable and objective as possible.
While it is acknowledged that certain works in certain areas may potentially have significant impacts
on the associated fisheries, the level of assessment undertaken here was insufficient to allow
evaluation of the degree of impact and whether positive or negative. As such, this factor was not
included in the assessment, but it is strongly recommended that the potential impact on fisheries of
the options identified is assessed and considered when options are taken forward to detailed
consultation/design.
6.1 FACTORS CONSIDERED The additional factors considered in the final assessment stage and the method of assessment are
described below.
6.1.1 Estimated cost
Cost is likely to be an important factor in determining the feasibility of an option. The addition of this
factor allowed assessment of those options that provide the greatest benefit, relative to their cost,
providing a means of differentiating between options with similar levels of benefit. Given the large
number of unknowns about the implementation of each option, there is a large degree of
uncertainty about the likely cost. Each option was, therefore, assigned one of five categories of
estimated cost (Table 6.1).
The costs were determined based on the length of river to be modified, the nature of the works and
the size of the channel. The channel size was divided into three categories, based on catchment
area. Within each size category a standard cost per kilometre for each main type of work (e.g. re-
meandering, embankment removal, removal of bank protection), was applied. It was assumed that
works would be more expensive in larger channels. The estimated cost includes the stages of further
detailed restoration design, ground works and associated site supervision. It does not take into
account the value of surrounding land, the possible interference with infrastructure or costs
associated with implementing a monitoring programme. The first two of these factors were
considered separately in the ‘reality check’ assessment.
It is possible that unknown, site-specific factors may cause a significant increase in cost. For example,
it has been assumed that when removing embankments, all material can be disposed of on-site. If,
for some reason, off-site disposal of materials was required, this could cause a significant increase in
cost. Furthermore, detailed site investigations that would be required prior to the implementation of
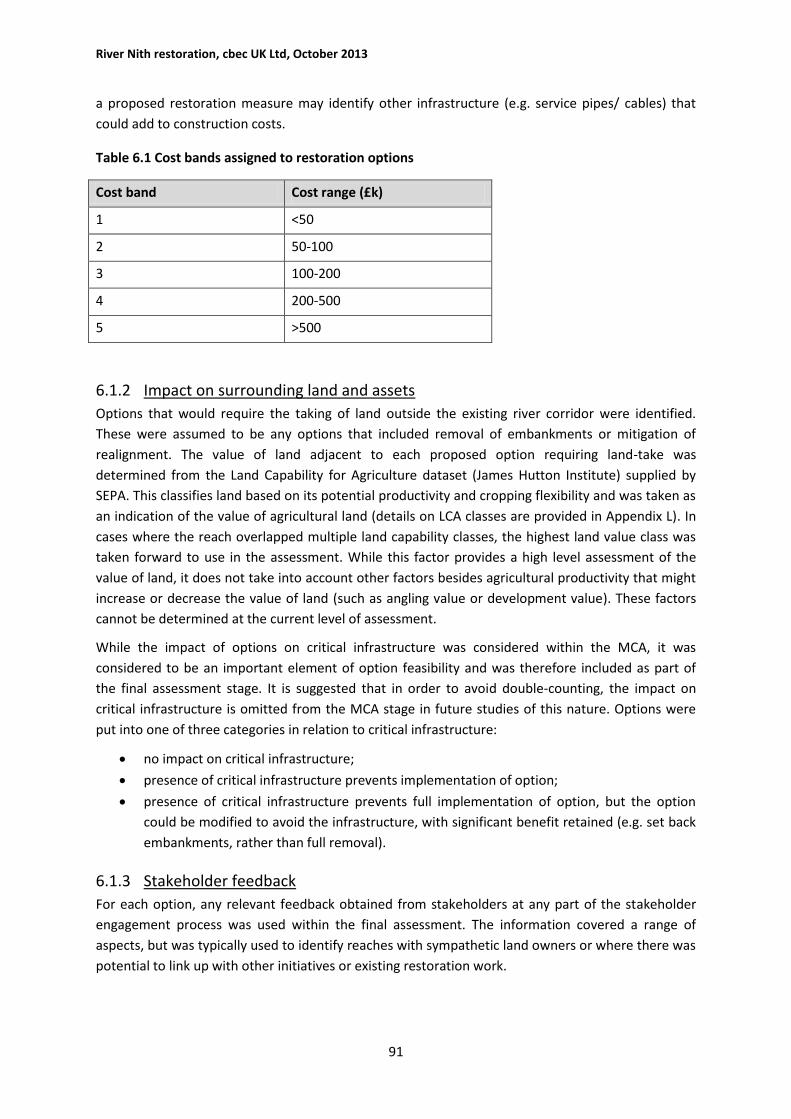
River Nith restoration, cbec UK Ltd, October 2013
91
a proposed restoration measure may identify other infrastructure (e.g. service pipes/ cables) that
could add to construction costs.
Table 6.1 Cost bands assigned to restoration options
Cost band Cost range (£k)
1 <50
2 50-100
3 100-200
4 200-500
5 >500
6.1.2 Impact on surrounding land and assets
Options that would require the taking of land outside the existing river corridor were identified.
These were assumed to be any options that included removal of embankments or mitigation of
realignment. The value of land adjacent to each proposed option requiring land-take was
determined from the Land Capability for Agriculture dataset (James Hutton Institute) supplied by
SEPA. This classifies land based on its potential productivity and cropping flexibility and was taken as
an indication of the value of agricultural land (details on LCA classes are provided in Appendix L). In
cases where the reach overlapped multiple land capability classes, the highest land value class was
taken forward to use in the assessment. While this factor provides a high level assessment of the
value of land, it does not take into account other factors besides agricultural productivity that might
increase or decrease the value of land (such as angling value or development value). These factors
cannot be determined at the current level of assessment.
While the impact of options on critical infrastructure was considered within the MCA, it was
considered to be an important element of option feasibility and was therefore included as part of
the final assessment stage. It is suggested that in order to avoid double-counting, the impact on
critical infrastructure is omitted from the MCA stage in future studies of this nature. Options were
put into one of three categories in relation to critical infrastructure:
no impact on critical infrastructure;
presence of critical infrastructure prevents implementation of option;
presence of critical infrastructure prevents full implementation of option, but the option
could be modified to avoid the infrastructure, with significant benefit retained (e.g. set back
embankments, rather than full removal).
6.1.3 Stakeholder feedback
For each option, any relevant feedback obtained from stakeholders at any part of the stakeholder
engagement process was used within the final assessment. The information covered a range of
aspects, but was typically used to identify reaches with sympathetic land owners or where there was
potential to link up with other initiatives or existing restoration work.
River Nith restoration, cbec UK Ltd, October 2013
92
6.1.4 Benefit to local morphology
As discussed above, the scoring of options based on their capacity released, introduced bias because
of the influence of water body length on scores. In order to account for this, the factor of local
morphological benefit was considered. The benefit to local morphology was calculated as total
capacity released by the option multiplied by water body length. Options were then grouped into
one of five classes based on these values.
In addition, a factor was included to account for the findings of the geomorphic process assessment
(Section 2.7). The value of geomorphic process intensity provides an indication of the degree of
channel morphological activity. This was used to indicate the likely sensitivity of the channel to
morphological pressures, based on the assumption that a more active channel will be more sensitive
to interventions and therefore that processes in these reaches will be more impacted for a given
level of pressure. Options were grouped into five sensitivity classes based on the highest geomorphic
process intensity value found within the reach.
It is recommended that in future studies of this nature, the scores for geomorphic sensitivity and
local morphological benefit are incorporated into the MCA, rather than being incorporated at this
stage.
6.2 PRIORITISATION METHOD An expert judgement approach was used to assess options in terms of the various factors outlined
above, as well as the MCA score, in order to come up with a final ranking. The ranking that resulted
from the MCA was only changed where the additional factors were deemed to outweigh any
difference in MCA score between candidate restoration options. This typically occurred where two
or more options had MCA scores within one or two points but greater relative differences in
estimated cost, local morphological benefit or stakeholder support. For example, where two options
were separated by one MCA point, but the lower ranked option had a significantly lower estimated
cost, this option would be moved above the initially higher ranked option (assuming other factors
under consideration were similar).
It is recognised that this approach contains an element of subjectivity. In order to maintain
transparency, the information used within the final prioritisation is provided in Appendix L.
6.3 OUTCOME OF FINAL ASSESSMENT A table indicating the additional factors assessed for each of the options is shown in Appendix L.
Some options have been completely ruled out because they are considered unfeasible (generally in
relation to existing infrastructure. In consideration of both the MCA score, and the additional
factors, the ten options that are most favourable are shown in Table 6.2 and Figure 6.1. Reach
summary sheets, which provide more information about each of these options, are found in
Appendix M. The top ten options are those which will provide the greatest (morphological/ NFM/
environmental/ socio-economic) benefit, as well as having favourable conditions for
implementation.
The ranking given here provides a starting point for determining which options to take forward.
However, options that do not fall into the top ten should not be completely ruled out. It was not
within the scope of this study to take all site specific factors into account. There are likely to be
other, currently unknown factors that may influence the implementation of options. These factors

River Nith restoration, cbec UK Ltd, October 2013
93
may become apparent when options are taken forward to more detailed appraisal/design and may
alter the degree of favourability of certain options.
A further factor that was not considered in the ranking was the relative locations of options. From an
ecological and physical process perspective, there is likely to be a disproportionately greater benefit
attained from restoring several adjacent reaches, compared with restoring single reaches dispersed
through the catchment. By restoring several adjacent reaches, system functioning at larger scales
will be addressed, which will enhance recovery at the reach scale, thus providing greater overall
benefit. Depending on the priorities for restoration outcomes, it may be prudent to select a lower
ranked reach for restoration if it adjoins another reach that has also been selected, allowing
continuous restoration of a longer length of river.
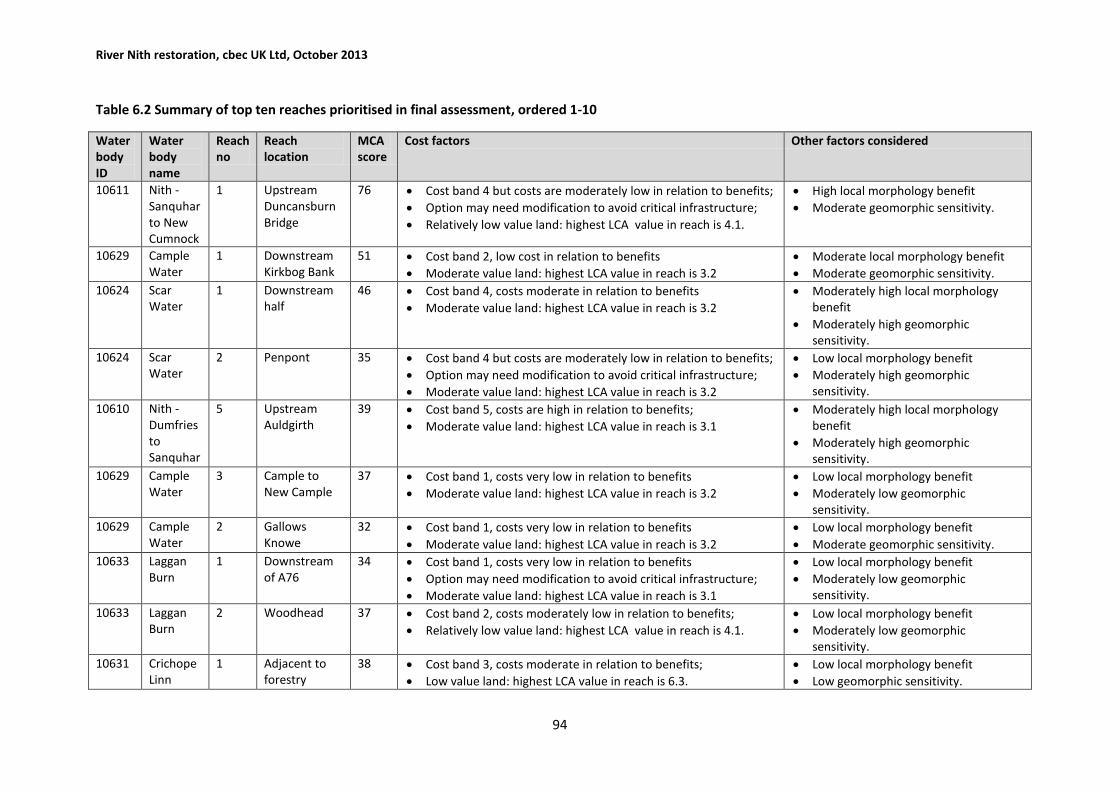
River Nith restoration, cbec UK Ltd, October 2013
94
Table 6.2 Summary of top ten reaches prioritised in final assessment, ordered 1-10
Water body ID
Water body name
Reach no
Reach location
MCA score
Cost factors Other factors considered
10611 Nith - Sanquhar to New Cumnock
1 Upstream Duncansburn Bridge
76 Cost band 4 but costs are moderately low in relation to benefits;
Option may need modification to avoid critical infrastructure;
Relatively low value land: highest LCA value in reach is 4.1.
High local morphology benefit
Moderate geomorphic sensitivity.
10629 Cample Water
1 Downstream Kirkbog Bank
51 Cost band 2, low cost in relation to benefits
Moderate value land: highest LCA value in reach is 3.2
Moderate local morphology benefit
Moderate geomorphic sensitivity.
10624 Scar Water
1 Downstream half
46 Cost band 4, costs moderate in relation to benefits
Moderate value land: highest LCA value in reach is 3.2
Moderately high local morphology benefit
Moderately high geomorphic sensitivity.
10624 Scar Water
2 Penpont 35 Cost band 4 but costs are moderately low in relation to benefits;
Option may need modification to avoid critical infrastructure;
Moderate value land: highest LCA value in reach is 3.2
Low local morphology benefit
Moderately high geomorphic sensitivity.
10610 Nith - Dumfries to Sanquhar
5 Upstream Auldgirth
39 Cost band 5, costs are high in relation to benefits;
Moderate value land: highest LCA value in reach is 3.1
Moderately high local morphology benefit
Moderately high geomorphic sensitivity.
10629 Cample Water
3 Cample to New Cample
37 Cost band 1, costs very low in relation to benefits
Moderate value land: highest LCA value in reach is 3.2
Low local morphology benefit
Moderately low geomorphic sensitivity.
10629 Cample Water
2 Gallows Knowe
32 Cost band 1, costs very low in relation to benefits
Moderate value land: highest LCA value in reach is 3.2
Low local morphology benefit
Moderate geomorphic sensitivity.
10633 Laggan Burn
1 Downstream of A76
34 Cost band 1, costs very low in relation to benefits
Option may need modification to avoid critical infrastructure;
Moderate value land: highest LCA value in reach is 3.1
Low local morphology benefit
Moderately low geomorphic sensitivity.
10633 Laggan Burn
2 Woodhead 37 Cost band 2, costs moderately low in relation to benefits;
Relatively low value land: highest LCA value in reach is 4.1.
Low local morphology benefit
Moderately low geomorphic sensitivity.
10631 Crichope Linn
1 Adjacent to forestry
38 Cost band 3, costs moderate in relation to benefits;
Low value land: highest LCA value in reach is 6.3.
Low local morphology benefit
Low geomorphic sensitivity.
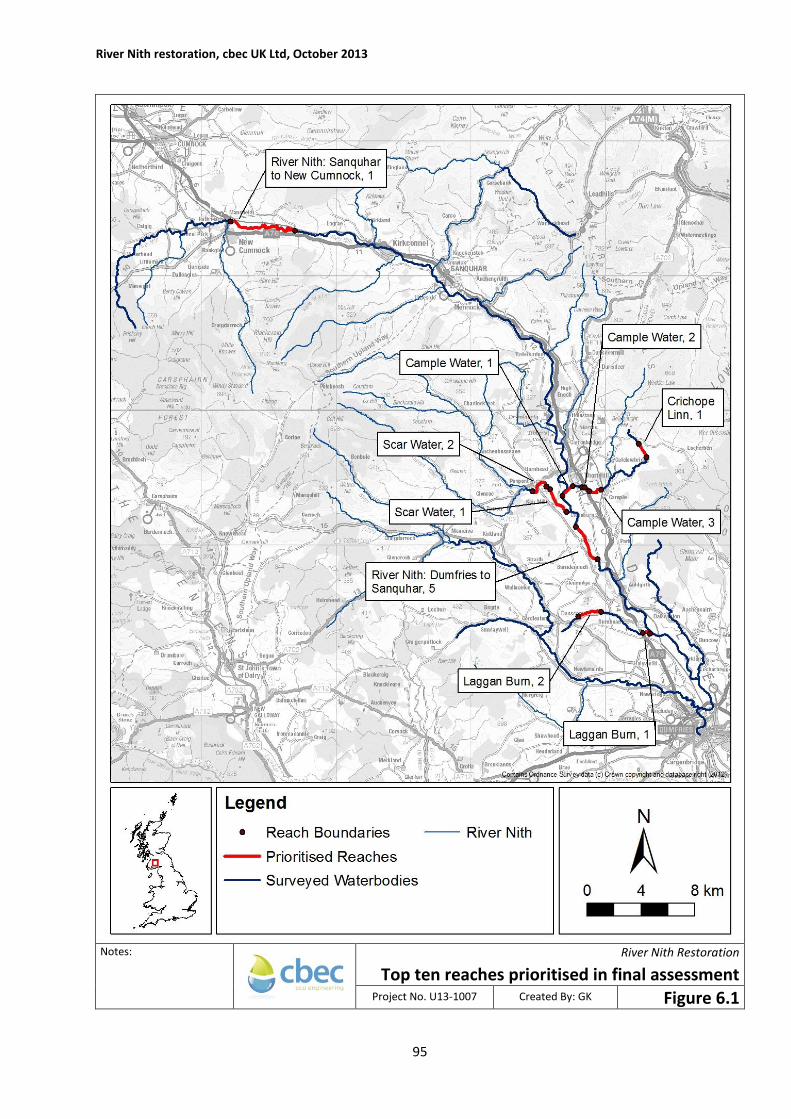
River Nith restoration, cbec UK Ltd, October 2013
95
Notes:
River Nith Restoration
Top ten reaches prioritised in final assessment Project No. U13-1007 Created By: GK Figure 6.1
River Nith restoration, cbec UK Ltd, October 2013
96
7. SUMMARY AND RECOMMENDATIONS This report documents the development and application of a new approach to catchment-scale
restoration assessment, which aims to identify measures that can address multiple issues,
specifically morphological restoration and natural flood management. Given that this is a pilot study,
this section first summarises the principal outcomes of the assessment, before providing a critique
of the adopted methodology. It is intended that the critique will allow the methods to be refined and
developed into an approach that can be applied to other catchments in Scotland.
7.1 SUMMARY OF FINDINGS
7.1.1 Geomorphological
Assessment of morphological restoration opportunities was carried out using the MImAS
methodology because of its direct link to WFD status for morphology. However, additional data
were collected in a fluvial audit and were used to further analyse the geomorphic process regime
within the catchment. Key findings of this element of the work include:
1. Embankments, often with associated hard bank protection, are a prevalent pressure in
the lower half of the Nith main stem as well as parts of all other surveyed water bodies
and have the effect of preventing the channel interacting laterally with its floodplain.
2. Realignment and straightening were less widespread than embankments, but were
found, typically in combination with embankments, on several reaches of the lower Nith,
as well as on Laggan Burn, Pennyland Burn, Cample Water, Crichope Linn and Cairn
Water.
3. The highest scoring options (in terms of WFD benefit) were found in Scar Water, Cample
Water and the Nith from Sanquhar to New Cumnock water bodies and typically included
a combination of embankment removal and mitigation of high impact realignment.
4. It should be recognised that the scoring system is biased against the Nith from Dumfries
to Sanquhar and Cairn/Cluden Water water bodies because of their greater lengths.
Restoration options in these water bodies are likely to have greater benefit to local
morphology than is accounted for by their scores.
5. Fluvial audit data were used to provide a supplementary quantitative assessment of
reach-scale geomorphic sensitivity to pressures across the catchment. This provides
additional information to ensure that the chosen restoration options are appropriate to
the local and catchment-scale geomorphic context.
7.1.2 Hydrological
There are numerous pressures within the Nith, from agriculture, urbanisation and mining. These
give rise to a number of opportunities for NFM implementation. This study has sought to identify
those measures in which SEPA can have confidence, and to quantify the likely effects of
implementing these measures.
There are a number of key conclusions which can be drawn from the assessment carried out. These
are:
1. A number of opportunities exist for the implementation of source control measures.
The extent to which these will be effective at an appropriate scale is questionable, as
River Nith restoration, cbec UK Ltd, October 2013
97
there is little empirical evidence for significant effects. Further studies may be able to
optimise the location of source control measures depending upon the strategy adopted
for their implementation. As such, these measures have been given lower priority
within this study.
2. The Nith exhibits significant pressures from bank modification. This gives rise to
opportunities to re-naturalise the channel, primarily through embankment removal.
3. Modelling has indicated that in several circumstances, embankment removal/set-back is
not always beneficial to flood risk. This issue has been identified on the Cairn Water and
Thornhill area (including Scar Water/Cample Water).
4. Modelling has indicated benefits to flood risk may be realisable as a result of
implementing measures on an embanked section of channel just downstream of New
Cumnock. Modelling indicates that this has a net positive effect on the PVA at
Kirkconnel.
5. Hydrometric analysis has revealed significant variations in the typical magnitude of flows
originating from sub-catchments for different storm events. This indicates that
measures are likely to be required on a catchment wide basis to consistently reduce
catchment scale flood risk from any single event.
7.1.3 Multi-criteria analysis and subsequent assessment
The MCA provided a transparent means of scoring and assessing the multiple benefits of each
option, allowing an overall score to be determined, which could then be used to assess the
combined merits of each option relative to others. Further information relating to costs, constraints,
further benefits and opportunities was used, in conjunction with the MCA score, to undertake a final
assessment and prioritization of options. The top option overall was removal of embankments
between New Cumnock and Duncansburn, which scored highly in terms of improvement to WFD
status and NFM potential. The lower reaches of Scar Water and Cample Water, reaches on Laggan
Burn, as well as a reach on the Nith main stem near Auldgirth, also scored highly overall.
7.2 ASSESSMENT OF METHODOLOGY
7.2.1 Morphological assessment
The morphological assessment was intended to identify physical pressures within the catchment and
develop a catchment scale restoration strategy to address these. However, the ultimate aim of the
assessment was to determine where works could be carried out that would improve the status of a
water body for morphology under the WFD. As such, the assessment was entirely based around the
MImAS classification scheme since this is the methodology used to determine the morphological
status of water bodies in Scotland. Some of the limitations of using MImAS to develop a catchment-
scale morphological restoration strategy have been discussed already (Sections 2.6.3 and 2.7.1.4)
and are reiterated here.
MImAS assigns scores to morphological pressures, based on their ‘hazard rating’ (which is not site-
specific), in order to calculate the total capacity used within each water body. This then determines
the water body’s status for morphology, with a lower capacity used leading to a more favourable
status class. If morphological restoration is simply seen as measures to improve WFD status for
morphology then it will be focused on removing pressures that have the greatest impact on MImAS
capacity used within a water body, as has been the case in this study (following guidance from

River Nith restoration, cbec UK Ltd, October 2013
98
SEPA). MImAS provides a convenient, quantitative measure of morphological improvement
(although its underpinnings are based in subjective assessments) associated with restoration
options, which has the appearance of being transparent and is simple to feed into the MCA.
However, there are limitations to the quantification of morphological pressures in MImAS (discussed
to some extent in Section 2), such that reliance purely on this methodology does not allow the
development of a fully process-based restoration strategy.
Under the MImAS-based approach, the specific impacts to geomorphic process from a particular
pressure are not assessed. The likely degree of impact is implicitly assumed from the calculated
capacity used. No consideration, beyond reach type classification, is given to geomorphic process.
This makes it impossible to determine the locations where restoration will have the greatest benefit
to process or to determine geomorphically appropriate solutions for an impacted reach (e.g.
restoration of a more natural sediment supply regime by removing bank protection).
It is recommended that a more appropriate approach to generating a catchment-scale, process-
based restoration plan would be to follow the standard fluvial audit approach, which has proved to
be successful in many previous studies. The fluvial audit-based approach is used to gain an
understanding of geomorphic process at the catchment scale, using quantitative data to determine
the sediment transport regime within the catchment. Data collected as part of the fluvial audit are
then used to identify the significant impacts to morphological process across the system. The use of
historical mapping data or ‘reference’ reaches helps to identify changes that have occurred as a
result of human pressures. Once these impacts are known, options to restore geomorphic process
can be developed. The strong process-based foundation of the approach allows for a high degree of
confidence that recommended actions will achieve the desired effects at the local scale.
It is recommended that in future studies a process-based fluvial audit type assessment should form a
significant part of the appraisal of morphological restoration options (perhaps in tandem with
MImAS) and should contribute to scores of options within the MCA.
7.2.2 NFM assessment
7.2.2.1 Overall Approach
The use of a stepped approach is considered to be beneficial in highlighting assumptions regarding
the effectiveness and appropriateness of measures between the characterisation, screening and
assessment process. Key findings on the overall methodology are as follows:
1. This methodology has assessed changes in peak flow at identified receptors for a specific
observed event. While quantification uses the most objective method available, the results and
prioritisation are highly dependent upon where flood risk is assessed and the flood event used for
testing. If quantification is to be pursued as part of future work, then guidance needs to be
developed on where flood risk is to be assessed, how it is to be assessed and for which event (s) it is
to be assessed. Literature evidence suggests most NFM style measures are only effective at lower
return periods and so it is recommended that future assessments are based upon a greater number
of real events including low return period storms.
2. There is an inherent conflict between specifying the location of measures and the extent to
which they can be assessed for effectiveness using current tools. This approach has identified
several sub-catchments in which implementing measures may be beneficial. It is likely that future
tools will improve confidence in the impact that source control measures have. For this reason, high
River Nith restoration, cbec UK Ltd, October 2013
99
level studies should not identify detailed source control measures unless there are tools or methods
that allow them to do so with confidence.
3. Consideration should be given to the confidence in the prioritisation of measures; for
example is it appropriate to prioritise some methods with an uncertain outcome over others which
have a slightly less beneficial;, but more certain outcome? A lack of quantitative evidence for
benefit does not mean there will be no benefit, but there are likely to be implications as a result of
the lack of evidence (for example it may be more difficult to persuade stakeholders to adopt
uncertain measures) which should be considered in prioritisation.
4. The selection of the hydraulic model is important for flooplain processes. Where the
interaction between channel and floodplain is important (e.g. to model the effect of embankment
modifications) then a linked 1D/2D model is necessary.
7.2.2.2 Quantification and Prioritisation
Our approach has been to use a linked 1D-2D model to quantify and hence prioritise options. This is
a computationally intensive approach, but has significant benefits in terms of the detail that can be
modelled. Other significant findings that are considered to be of use to SEPA are as follows.
1. Limited topographic survey can provide enhanced confidence in the use of remotely sensed
data, but in areas where only poor elevation products are available (i.e. NEXTMAP), there is much
lower confidence in the results and hence the resultant prioritisation. While the pilot projects are
high level studies, due consideration needs to be given to the uncertainty inherent in the available
data as this can directly influence the model results and hence prioritisation.
2. 2D models provide an effective basis on which to assess channel based measures, providing
benefits that are not easily (or efficiently) realisable from 1D or rainfall-runoff style approaches. 2D
models are not so capable of dealing with source control measures, but can use the output from
more appropriate tools to accurately assess flood risk.
3. Testing the effectiveness of measures against observed events is key if an understanding of
catchment scale effects is required. There is a necessary simplification required in modelling, but the
analysis of gauged data in combination with FEH is considered to be an appropriate middle ground.
7.2.3 Integration of morphological and NFM options and MCA process
In terms of its general approach, it is considered that the MCA process is as robust as any method
can be to determine the relative effects of disparate factors on the prioritisation of restoration
options. The specific approach taken in this project, based on the guidance from SEPA, was to
investigate morphological restoration and NFM options separately and then integrate the two sets
of measures to determine where opportunities for multiple benefits exist, with equal weighting
given to NFM and morphology.
One issue with this approach was the mismatch in appropriate scales of assessment between the
two types of measures. NFM measures typically must be implemented over a large spatial scale in
order to have a measurable benefit to flood hydrograph attenuation. Morphological restoration is
generally implemented at smaller spatial scales because of the scale at which pressures typically
occur and the high costs associated with large-scale restoration. In addition, the differences in the
nature of benefits and methods for quantifying these between the two types of measures makes it
very difficult to directly compare them against each other (i.e. what degree of morphological
River Nith restoration, cbec UK Ltd, October 2013
100
improvement and predicted flood risk reduction would be considered equal in terms of benefits?). In
this study scores for the two types of measure have been scaled relative to the maximum and
minimum scores identified within the catchment. However, if applied more widely, this approach
does not allow for a consistent scoring of options between catchments. The scores for morphology
and NFM are calculated relative to the overall potential for morphological restoration and NFM
within the catchment and this is likely to vary greatly between catchments.
In theory, the approach of giving equal weighting to NFM and morphology objectives may result in
the prioritisation of options that, while giving a high combined score, do not represent a particularly
beneficial option for either NFM or morphology individually. In particular, this approach is not
appropriate to the planning of NFM. Measures to benefit NFM should not be chosen partly on the
weighting of WFD benefit.
Based on the experience of undertaking this study, we suggest that a better approach would be to
focus on either NFM or morphological restoration as the primary objective, with the other type of
measure assessed as a secondary benefit. Initial assessment would be based purely on the primary
objective, to determine a ranked set of options. Assessment of secondary benefits could then be
focused on these locations, to allow differentiation between options that were very similar in terms
of their benefit to the primary objective. This would allow for a more targeted and efficient
approach, and a more robust scoring system. It is recognised that the focus of any future studies of
this nature would be dependent on policy drivers and strategic management decisions.
In most of the morphological restoration and NFM options assessed in this study, the spatial extent
of the option is an important factor in determining the level of benefit it would deliver. The nature of
pressures within a catchment is such that options necessarily range in spatial scale. In cases where
the linear extent of continuous pressures was considered too long to be addressed within a single
restoration action, the section was broken into two or more restoration reaches, in some cases quite
arbitrarily. The MCA scoring system used gives a bias towards large-scale options because of their
greater potential benefits. However, these large-scale options are more likely to be very costly and
logistically difficult to implement as a whole.
7.2.4 Stakeholder engagement process
7.2.4.1 Liaison with organisational stakeholders
In general, stakeholders within the Nith catchment were supportive of the proposed work and
interested in the outcomes of the project. However, most stakeholders were busy with their own
activities and whilst they were happy to receive information about the project, they did not
necessarily want to have regular updates or take part in face-to-face meetings. This should be noted
when planning future stakeholder engagement. It is important to recognise that the stakeholder
should drive the type of consultation that takes place, rather than the project dictating what sort of
consultation is suitable for the stakeholder. If the stakeholder wants to meet face to face and chat
through aspects of the project in detail, this should be accommodated, but it should not be routinely
expected or required.
7.2.4.2 Stakeholder workshop
This appeared to be an effective use of time and was positively received by most attendees. It is
possible that much of the information provided could have been gathered from stakeholders
River Nith restoration, cbec UK Ltd, October 2013
101
individually, but this would have reduced the networking and discussion element, which seemed to
help stakeholders as they prompted each other.
7.2.4.3 Landowner engagement
Effective landowner engagement is key to this type of work and action must be taken to resolve the
data protection issues around obtaining address information for landowners. The vision, both from
SEPA and cbec/Walking The Talk, was to contact landowners with background information at the
outset of the project, prior to survey work, which would have been a more courteous and
appropriate approach. The inability to obtain the necessary address information meant that this was
a significant negative in the development of the project, both in terms of increasing the amount of
time required to deliver the project and in reducing the effectiveness of communication. It is
strongly recommended that efforts are made to establish a mechanism by which address data can
be made available for legitimate project uses. Any other communication method is at best
piecemeal (for example, using the NFUS and Scottish Land & Estate organisations, who can only pass
information onto their members) and at worst, can appear divisive.
7.2.4.4 Recommendations for future stakeholder communication within the Nith
1. Organisational stakeholders within the Nith are interested in the project, but do not
necessarily want to commit time to face-to-face meetings unless they have clear outcomes.
Introductory and general information provision meetings are not necessarily an effective use
of people’s time. It is therefore important that this level of engagement is offered to
stakeholders, but not routinely expected. Stakeholders should be given the opportunity to
decide how much or how little engagement they want to undertake, rather than this being
decided for them.
2. Mechanisms for contacting landowners within river reaches should be established, in order
that effective, targeted communication can be used where necessary.
3. Provision of information through local media channels would help to raise awareness of the
project, although it must be accepted that once information is released to the media, it is no
longer under direct control and may be used in a different manner to that which was
originally intended.

River Nith restoration, cbec UK Ltd, October 2013
102
8. REFERENCES BGS (2013), Geology of Britain Viewer, http://mapapps.bgs.ac.uk/geologyofbritain/home.html
Blanc, J. Wright. G and Arthur S. (2012), Natural Flood Management knowledge system: Part 2 – The
effect of NFM features on the desynchronising of flood peaks at a catchment scale. CREW report.
Available online at: http://www.crew.ac.uk/projects/natural-flood-management. CREW.
Blanc, J., Arthur,S. and Beevers, L. (2012), Natural Flood Management (NFM) Knowledge System:
Part 3 - The effect of land drainage on flood risk and farming practice, Final Report. CREW.
cbec (2012), River Till Restoration Strategy, report to Tweed Forum.
CEH (2013), National River Flow Archive, http://www.ceh.ac.uk/data/nrfa/
Environment Agency (2008), Delivery of Making Space for Water, The role of land use and land
management in delivering flood risk management, Final Report.
Environment Agency (2008) Delivery of Making Space for Water, HA6 Catchment Scale Land-Use
Management and HA7 Land Management Practices – Identification of catchments sensitive to land
use change, Final Report,
(http://archive.defra.gov.uk/environment/flooding/documents/manage/catchments.pdf)
JBA Consulting. (2005), Natural Flood Storage and Extreme Flood Events. Scottish Executive.
Nutt, N., (2012), Methods to screen and quantify natural flood management effects, Scottish
Environmental Protection Agency and Forestry Commission Scotland.
O'Connell, E., Ewen, J., O'Donnell, G., & Quinn, P. (2007), Is there a link between agricultural land-
use management and flooding? Hydrology and Earth Systems Science, 11(1) 96-107.
SEPA (2010), MImAS – Morphology pressure survey (MPS) guidance. Procedure ES-Ecol-P-WFD004.
Shaw, E., Beven, K.J., Chappell, N.A. and Lamb, R. (2011), Hydrology In Practice, Spon Press.
Sniffer (2011), Natural Flood Management Implementation-Learning from Practice Workshop
Report.
The Scotland River Basin District (Surface Water Typology Environmental Standards, Condition Limits
and Groundwater Threshold Values) Directions 2009,
http://www.scotland.gov.uk/Resource/Doc/298071/0092869.pdf

River Nith restoration, cbec UK Ltd, October 2013
103
9. LIST OF PREPARERS
Carolyn Mills (cbec)
Hamish Moir (cbec)
Jamie Ledingham (Mott MacDonald)
Tim Jolley (Mott MacDonald)
Tamsin Morris (Walking the Talk)

Restoration Specialists for Freshwater and Coastal Environments
www.cbecoeng.co.uk
T/F: 01975 564 492
� ood risk | river restoration | di� use pollution control | � sheries management | hydropower support
cbec eco-engineering UK Ltd3 Aberdeen Road, Alford Aberdeenshire, AB33 8ED
Company Number: SC385000 | VAT Number: GB111101405