Embed Size (px)
Citation preview
234
Introduction
The Waldhuni River is a small River originating at Kakola hills, Kakola Lake near Ambernath and unites with Ulhas River near Kalyan. Its total length is 31.8km. The river is so much polluted that it is now referred to as Waldhuni Nallah. It flows through thickly populated area of Ambernath, Ulhasnagar and Vithalwadi and is severely polluted due to domestic and industrial sewage. Patil et al(2012) have observed that due to rapid urbanization and industrialization there has been increasing stress of rivers giving rise to water pollution and environmental deterioration. Water was primarily used for domestic needs such as drinking, cooking, washing, bathing etc. But due to industrial and urban development,
requirement of water is increased. Good quality of water with high Dissolved oxygen, low BOD and COD, minimum salts dissolved in it is required for living beings. The quality of water is dependent on physical, chemical and biological parameters (Jena et al, 2013).Rapid release of municipal and industrial sewage severely decreases aquatic environment. Major sources of water pollution are from municipal water, industrial water, agricultural water, sewage water, etc. Polluted water may contain suspended solids, dissolved inorganic compounds, nitrogen and phosphorous compounds, animal wastes, toxic chemicals, insecticides, pesticides, medical waste, toxic heavy
Physico-chemical assessment of Waldhuni River Ulhasnagar (Thane, India): A case study
D.S. Pardeshi and ShardaVaidya*
SMT. C H M College Ulhasnagar (Thane), India *Corresponding author
ISSN: 2347-3215 Volume 3 Number 4 (April-2015) pp. 234-248 www.ijcrar.com
A B S T R A C T
The contamination of rivers,streams, lakes and underground water by chemical substances which are harmful to living beings is regarded as water pollution.The physico-chemical parameters of the water body are affected by its pollution. The changes in these parameters indicate the quality of water. Hence such parameters of WaldhuniRiver were studied and analyzed for a period of two years during May2010to April2012. The analysis was done for the parameters such as Temperature, pH, Dissolved Oxygen (DO), Biological Oxygen Demand (BOD), Chemical Oxygen Demand (COD), Carbon dioxide, Total Hardness, Calcium, Magnesium, T S, TDS, &TSS. The results are indicated in the present paper.
KEYWORDS
Physico-chemical assessment, water body, Temperature, pH, Dissolved Oxygen (DO), Biological Oxygen Demand (BOD), Chemical Oxygen Demand (COD)
235
metals and biological pollutants such as pathogenic bacteria, fungi, protozoa, viruses, parasitic worms, etc.(Aggarwal and Arora, 2012).
The increasing industrialization and urbanization all over the world has resulted in pollution of water and in deterioration of its quality. Traditional customs and habits along with the release of domestic waste water, agricultural run-offs and industrial effluents have resulted in deterioration of water quality and loss of its potability. This has also led to the deterioration of groundwater due to the percolation of pollutants under the soil/ground. (Aggarwal and Arora, 2012).
Fresh water is essential for agriculture, industry and human beings and animals. The sources of fresh water on the earth are limited. Without adequate quantity and quality of fresh water sustainable development will not be possible (Kumar, 1997, Mahananda, 2005). Since fresh water resources are getting deteriorated day-by-day at a very faster rate, water quality is a global problem (Mahananda, 2005). The healthy aquatic ecosystem is dependent on the biological diversity and is reflected by its physico-chemical characteristics (Venkatesharaju et al, 2010). Microorganisms are widely distributed in nature and diversity of microorganisms may be used as an indicator for organic pollution. (Andrew, 2012).
Materials and Methods
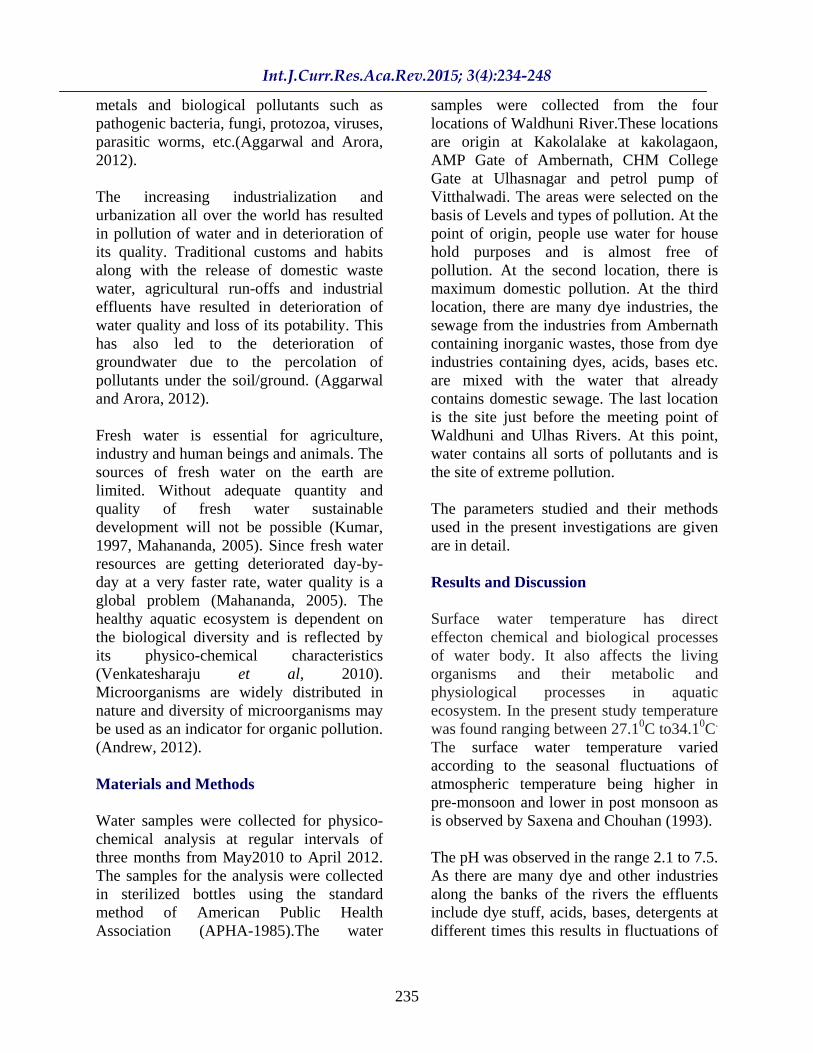
Water samples were collected for physico-chemical analysis at regular intervals of three months from May2010 to April 2012. The samples for the analysis were collected in sterilized bottles using the standard method of American Public Health Association (APHA-1985).The water
samples were collected from the four locations of Waldhuni River.These locations are origin at Kakolalake at kakolagaon, AMP Gate of Ambernath, CHM College Gate at Ulhasnagar and petrol pump of Vitthalwadi. The areas were selected on the basis of Levels and types of pollution. At the point of origin, people use water for house hold purposes and is almost free of pollution. At the second location, there is maximum domestic pollution. At the third location, there are many dye industries, the sewage from the industries from Ambernath containing inorganic wastes, those from dye industries containing dyes, acids, bases etc. are mixed with the water that already contains domestic sewage. The last location is the site just before the meeting point of Waldhuni and Ulhas Rivers. At this point, water contains all sorts of pollutants and is the site of extreme pollution.
The parameters studied and their methods used in the present investigations are given are in detail.
Results and Discussion
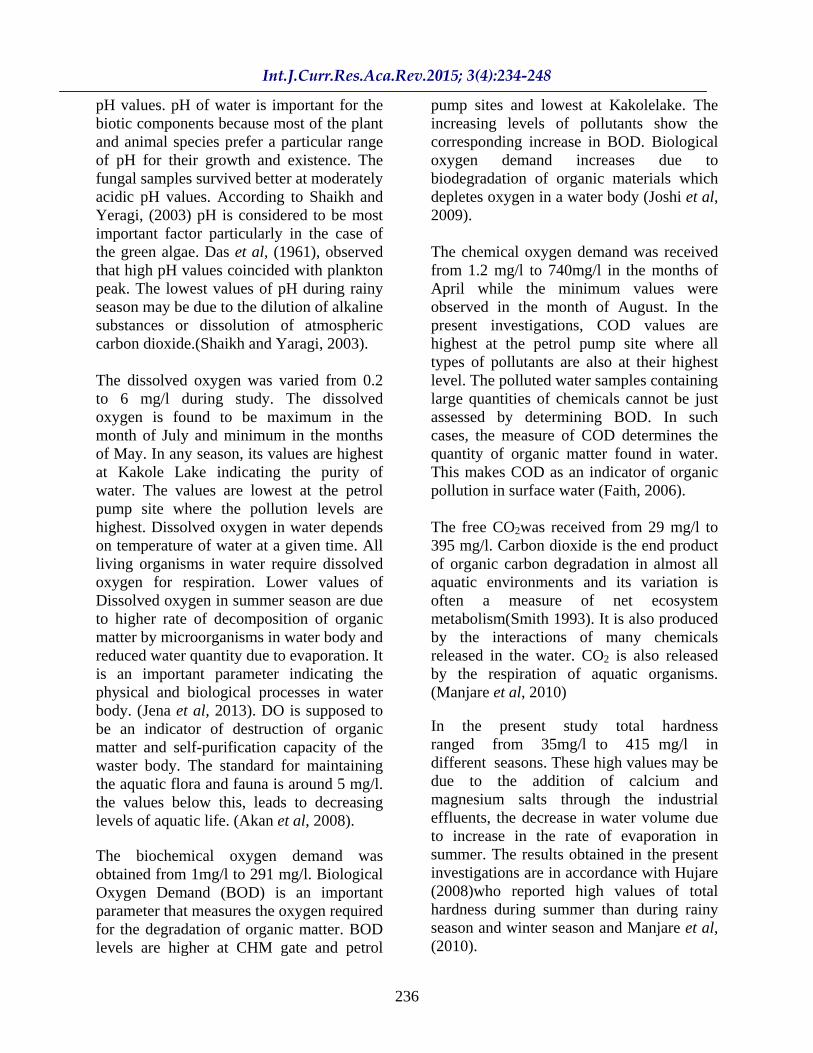
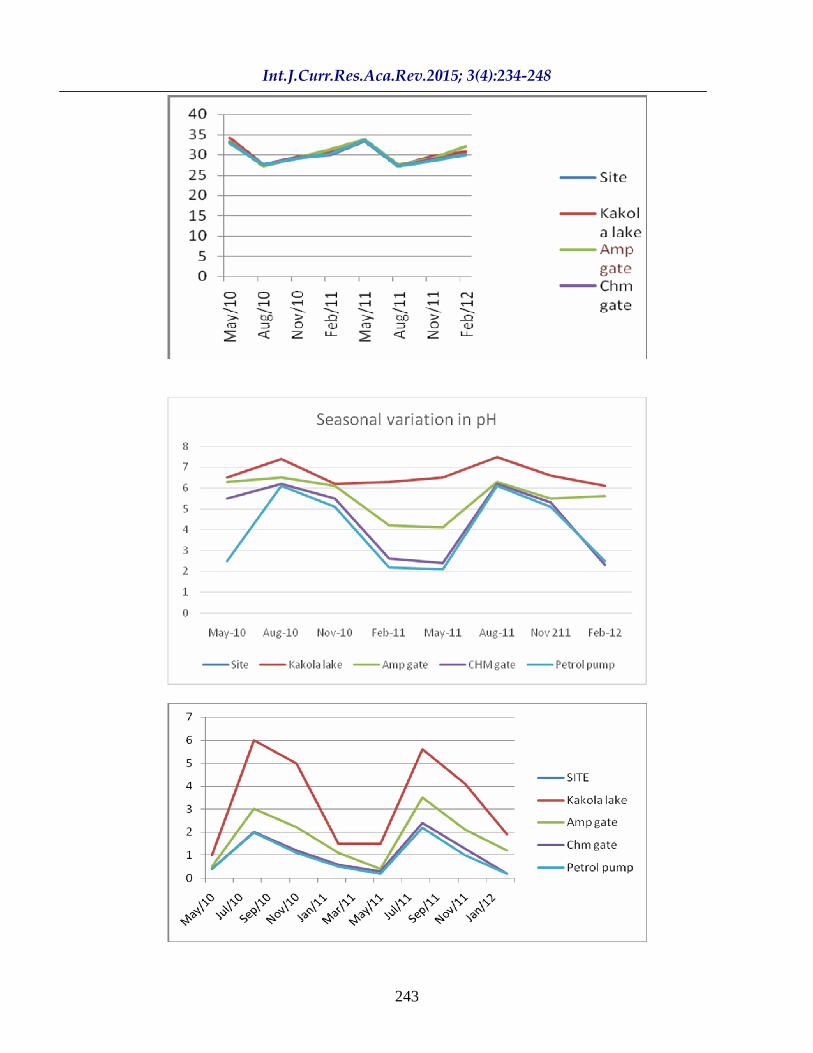
Surface water temperature has direct effecton chemical and biological processes of water body. It also affects the living organisms and their metabolic and physiological processes in aquatic ecosystem. In the present study temperature was found ranging between 27.10C to34.10C.
The surface water temperature varied according to the seasonal fluctuations of atmospheric temperature being higher in pre-monsoon and lower in post monsoon as is observed by Saxena and Chouhan (1993).
The pH was observed in the range 2.1 to 7.5. As there are many dye and other industries along the banks of the rivers the effluents include dye stuff, acids, bases, detergents at different times this results in fluctuations of
236
pH values. pH of water is important for the biotic components because most of the plant and animal species prefer a particular range of pH for their growth and existence. The fungal samples survived better at moderately acidic pH values. According to Shaikh and Yeragi, (2003) pH is considered to be most important factor particularly in the case of the green algae. Das et al, (1961), observed that high pH values coincided with plankton peak. The lowest values of pH during rainy season may be due to the dilution of alkaline substances or dissolution of atmospheric carbon dioxide.(Shaikh and Yaragi, 2003).
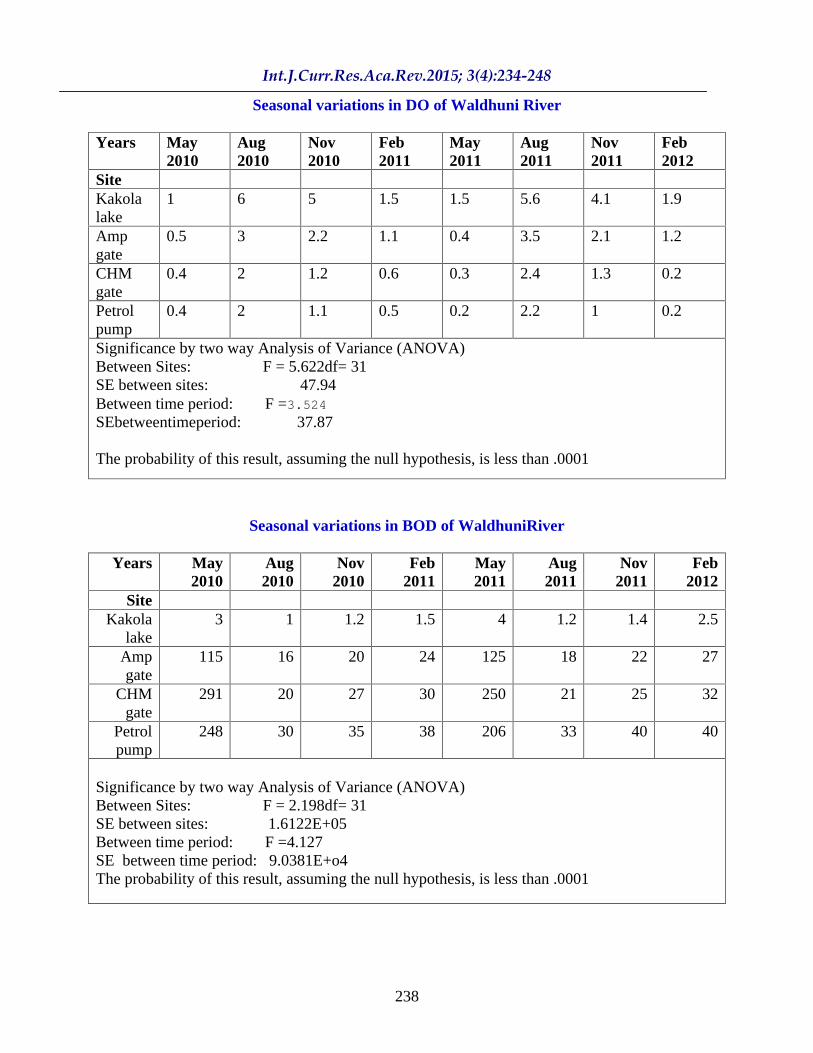
The dissolved oxygen was varied from 0.2 to 6 mg/l during study. The dissolved oxygen is found to be maximum in the month of July and minimum in the months of May. In any season, its values are highest at Kakole Lake indicating the purity of water. The values are lowest at the petrol pump site where the pollution levels are highest. Dissolved oxygen in water depends on temperature of water at a given time. All living organisms in water require dissolved oxygen for respiration. Lower values of Dissolved oxygen in summer season are due to higher rate of decomposition of organic matter by microorganisms in water body and reduced water quantity due to evaporation. It is an important parameter indicating the physical and biological processes in water body. (Jena et al, 2013). DO is supposed to be an indicator of destruction of organic matter and self-purification capacity of the waster body. The standard for maintaining the aquatic flora and fauna is around 5 mg/l. the values below this, leads to decreasing levels of aquatic life. (Akan et al, 2008).
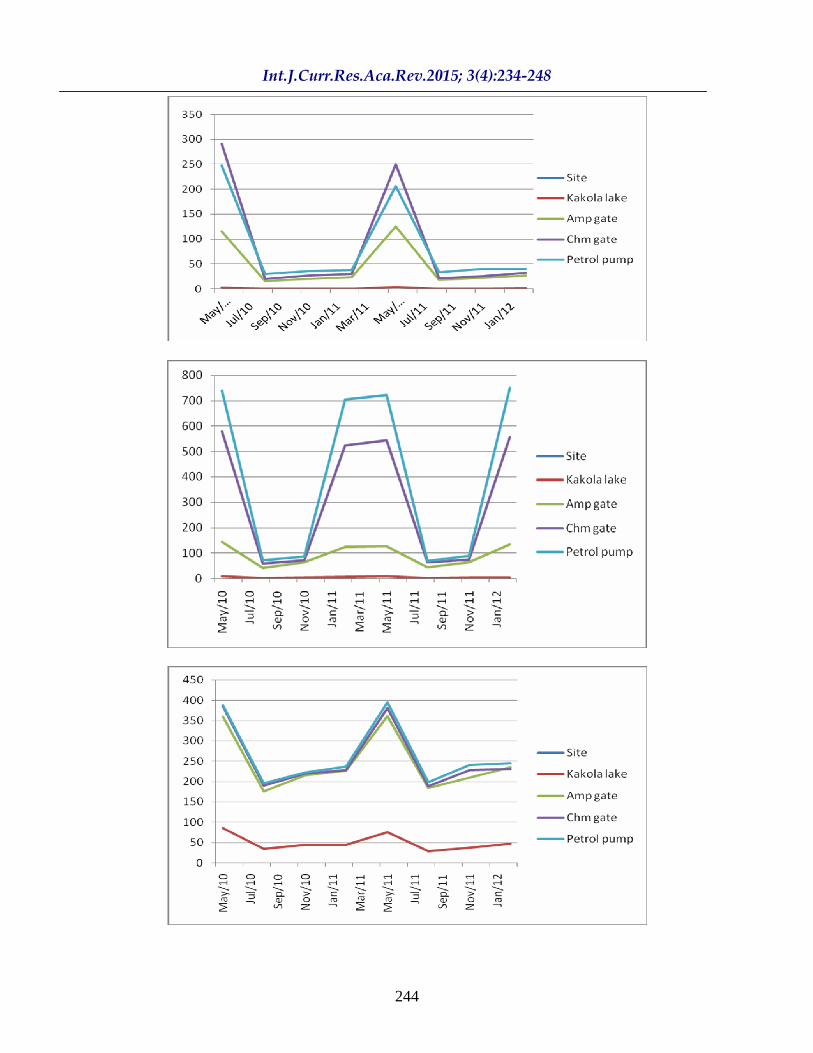
The biochemical oxygen demand was obtained from 1mg/l to 291 mg/l. Biological Oxygen Demand (BOD) is an important parameter that measures the oxygen required for the degradation of organic matter. BOD levels are higher at CHM gate and petrol
pump sites and lowest at Kakolelake. The increasing levels of pollutants show the corresponding increase in BOD. Biological oxygen demand increases due to biodegradation of organic materials which depletes oxygen in a water body (Joshi et al, 2009).
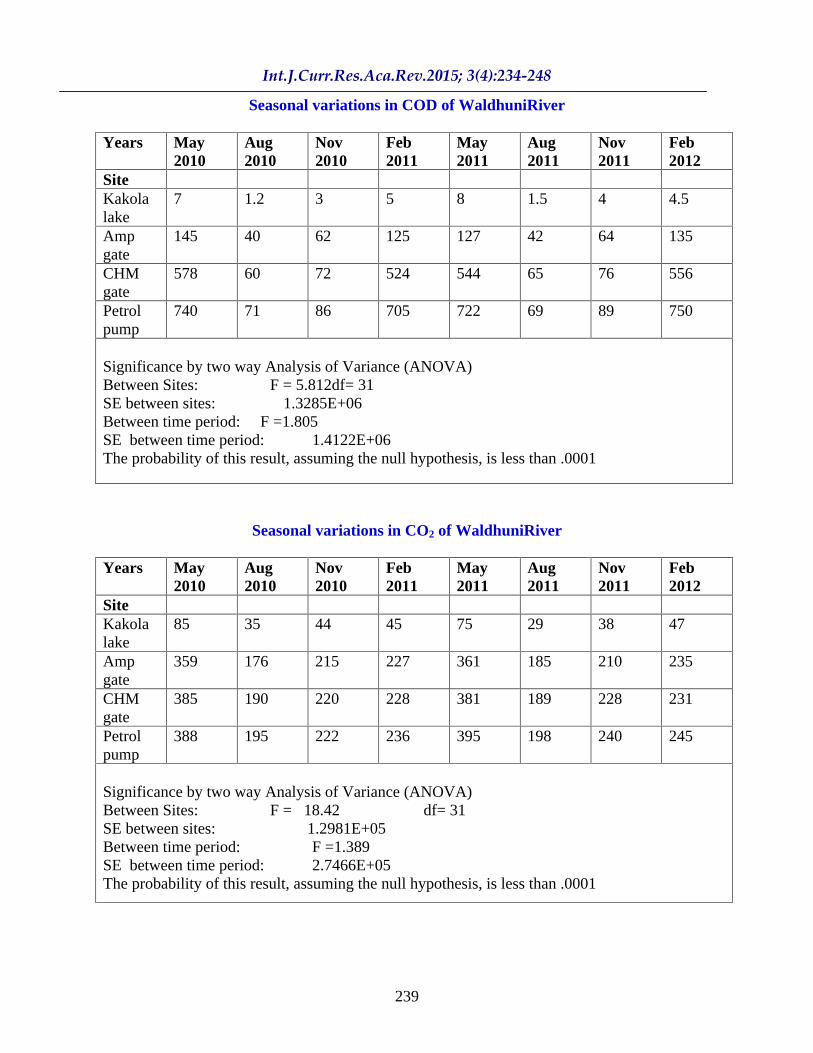
The chemical oxygen demand was received from 1.2 mg/l to 740mg/l in the months of April while the minimum values were observed in the month of August. In the present investigations, COD values are highest at the petrol pump site where all types of pollutants are also at their highest level. The polluted water samples containing large quantities of chemicals cannot be just assessed by determining BOD. In such cases, the measure of COD determines the quantity of organic matter found in water. This makes COD as an indicator of organic pollution in surface water (Faith, 2006).
The free CO2was received from 29 mg/l to 395 mg/l. Carbon dioxide is the end product of organic carbon degradation in almost all aquatic environments and its variation is often a measure of net ecosystem metabolism(Smith 1993). It is also produced by the interactions of many chemicals released in the water. CO2 is also released by the respiration of aquatic organisms. (Manjare et al, 2010)
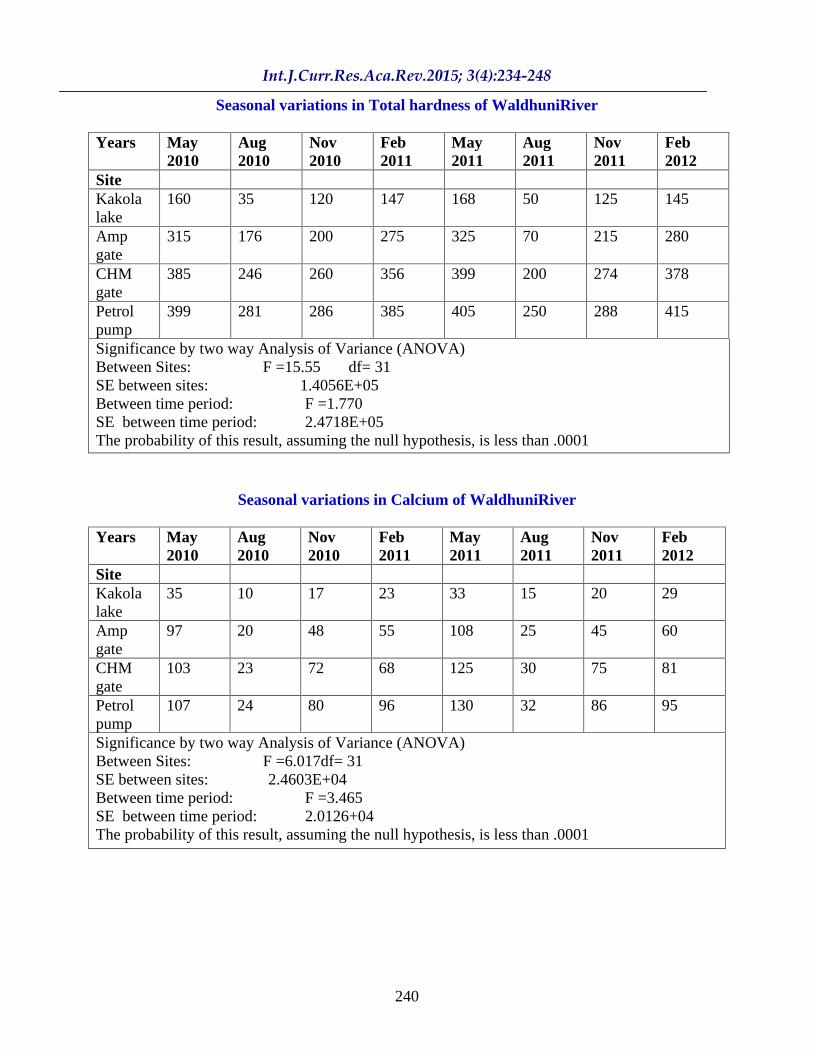
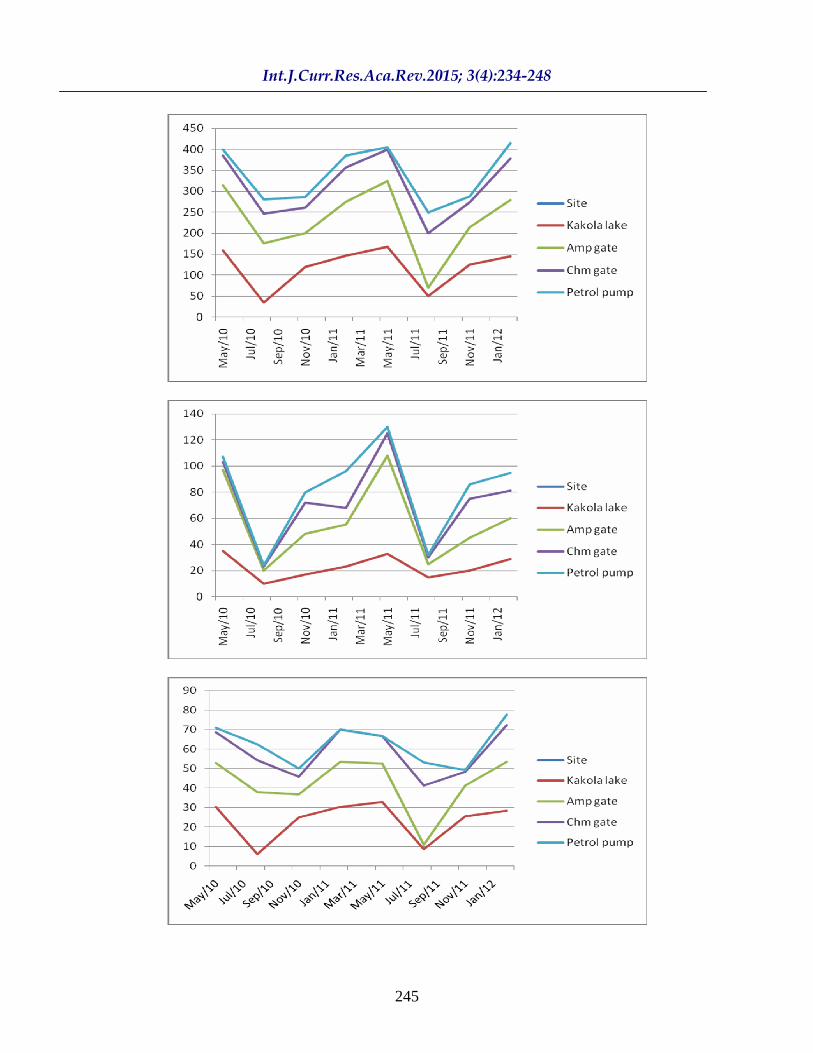
In the present study total hardness ranged from 35mg/l to 415 mg/l in different seasons. These high values may be due to the addition of calcium and magnesium salts through the industrial effluents, the decrease in water volume due to increase in the rate of evaporation in summer. The results obtained in the present investigations are in accordance with Hujare (2008)who reported high values of total hardness during summer than during rainy season and winter season and Manjare et al, (2010).
237
Parameters and methods for water samples
Sr. No. Parameters of water analysis Methods 1 pH Potentiometric 2 DO Azide modification 3 BOD Azide modification 4 COD Dichromate reflux 5 Free CO2 Titrimetric 6 Total Hardness Titrimetric 7 Calcium, Magnesium Titrimetric 9 T.S, T.D.S & T.S.S. Classical (Evaporation)
Seasonal variations in temperature of WaldhuniRiver
Years May 2010 Aug 2010 Nov 2010
Feb 2011 May 2011 Aug 2011
Nov 2011
Feb 2012
Site Kakola lake
34.1 27.5 29.5 30.5 33.5 27.2 29.7 30.8 Amp gate 33.4 27.1 29.3 31.4 33.8 27.5 29.1 32.1
CHM gate 33.2 27.4 29.2 30.1 33.5 27.1 28.9 30.1 Petrol pump
32.9 27.5 29.1 30.3 33.7 27.2 28.5 30.1
Table 1. Temperature variation in Waldhuni River. Significance by two way Analysis of Variance (ANOVA) Between Sites: F = 0.1054 df= 31 SE between sites: 168.8 Between time period: F = 102.3 SE between time period: 5.537 The probability of this result, assuming the null hypothesis, is less than .0001
Seasonal variations in pH of Waldhuni River
May2010
Aug2010
Nov2010
Feb2011
May2011
Aug2011
Nov211
Feb2012
Site Kakola lake 6.5 7.4 6.2 6.3 6.5 7.5 6.6 6.1 Amp gate 6.3 6.5 6.1 4.2 4.1 6.3 5.5 5.6 CHM gate 5.5 6.2 5.5 2.6 2.4 6.2 5.3 2.3 Petrolpump 2.5 6.1 5.1 2.2 2.1 6.1 5.1 2.5 Significance by two way Analysis of Variance (ANOVA) Between Sites: F = 6.058 df= 31 SE between sites: 52.07 Between time period: F =2.524 SE between time period: 49.45 The probability of this result, assuming the null hypothesis, is less than .0001
238
Seasonal variations in DO of Waldhuni River
Years May 2010
Aug 2010
Nov 2010
Feb 2011
May 2011
Aug 2011
Nov 2011
Feb 2012
Site Kakola lake
1 6 5 1.5 1.5 5.6 4.1 1.9
Amp gate
0.5 3 2.2 1.1 0.4 3.5 2.1 1.2
CHM gate
0.4 2 1.2 0.6 0.3 2.4 1.3 0.2
Petrol pump
0.4 2 1.1 0.5 0.2 2.2 1 0.2
Significance by two way Analysis of Variance (ANOVA) Between Sites: F = 5.622df= 31 SE between sites: 47.94 Between time period: F =3.524 SEbetweentimeperiod: 37.87
The probability of this result, assuming the null hypothesis, is less than .0001
Seasonal variations in BOD of WaldhuniRiver
Years May 2010
Aug 2010
Nov 2010
Feb 2011
May 2011
Aug 2011
Nov 2011
Feb 2012
Site Kakola
lake 3 1 1.2 1.5 4 1.2 1.4 2.5
Amp gate
115 16 20 24 125 18 22 27
CHM gate
291 20 27 30 250 21 25 32
Petrol pump
248 30 35 38 206 33 40 40
Significance by two way Analysis of Variance (ANOVA) Between Sites: F = 2.198df= 31 SE between sites: 1.6122E+05 Between time period: F =4.127 SE between time period: 9.0381E+o4 The probability of this result, assuming the null hypothesis, is less than .0001
239
Seasonal variations in COD of WaldhuniRiver
Years May 2010
Aug 2010
Nov 2010
Feb 2011
May 2011
Aug 2011
Nov 2011
Feb 2012
Site Kakola lake
7 1.2 3 5 8 1.5 4 4.5
Amp gate
145 40 62 125 127 42 64 135
CHM gate
578 60 72 524 544 65 76 556
Petrol pump
740 71 86 705 722 69 89 750
Significance by two way Analysis of Variance (ANOVA) Between Sites: F = 5.812df= 31 SE between sites: 1.3285E+06 Between time period: F =1.805 SE between time period: 1.4122E+06 The probability of this result, assuming the null hypothesis, is less than .0001
Seasonal variations in CO2 of WaldhuniRiver
Years May 2010
Aug 2010
Nov 2010
Feb 2011
May 2011
Aug 2011
Nov 2011
Feb 2012
Site Kakola lake
85 35 44 45 75 29 38 47
Amp gate
359 176 215 227 361 185 210 235
CHM gate
385 190 220 228 381 189 228 231
Petrol pump
388 195 222 236 395 198 240 245
Significance by two way Analysis of Variance (ANOVA) Between Sites: F = 18.42 df= 31 SE between sites: 1.2981E+05 Between time period: F =1.389 SE between time period: 2.7466E+05 The probability of this result, assuming the null hypothesis, is less than .0001
240
Seasonal variations in Total hardness of WaldhuniRiver
Years May 2010
Aug 2010
Nov 2010
Feb 2011
May 2011
Aug 2011
Nov 2011
Feb 2012
Site Kakola lake
160 35 120 147 168 50 125 145
Amp gate
315 176 200 275 325 70 215 280
CHM gate
385 246 260 356 399 200 274 378
Petrol pump
399 281 286 385 405 250 288 415
Significance by two way Analysis of Variance (ANOVA) Between Sites: F =15.55 df= 31 SE between sites: 1.4056E+05 Between time period: F =1.770 SE between time period: 2.4718E+05 The probability of this result, assuming the null hypothesis, is less than .0001
Seasonal variations in Calcium of WaldhuniRiver
Years May 2010
Aug 2010
Nov 2010
Feb 2011
May 2011
Aug 2011
Nov 2011
Feb 2012
Site Kakola lake
35 10 17 23 33 15 20 29
Amp gate
97 20 48 55 108 25 45 60
CHM gate
103 23 72 68 125 30 75 81
Petrol pump
107 24 80 96 130 32 86 95
Significance by two way Analysis of Variance (ANOVA) Between Sites: F =6.017df= 31 SE between sites: 2.4603E+04 Between time period: F =3.465 SE between time period: 2.0126+04 The probability of this result, assuming the null hypothesis, is less than .0001
241
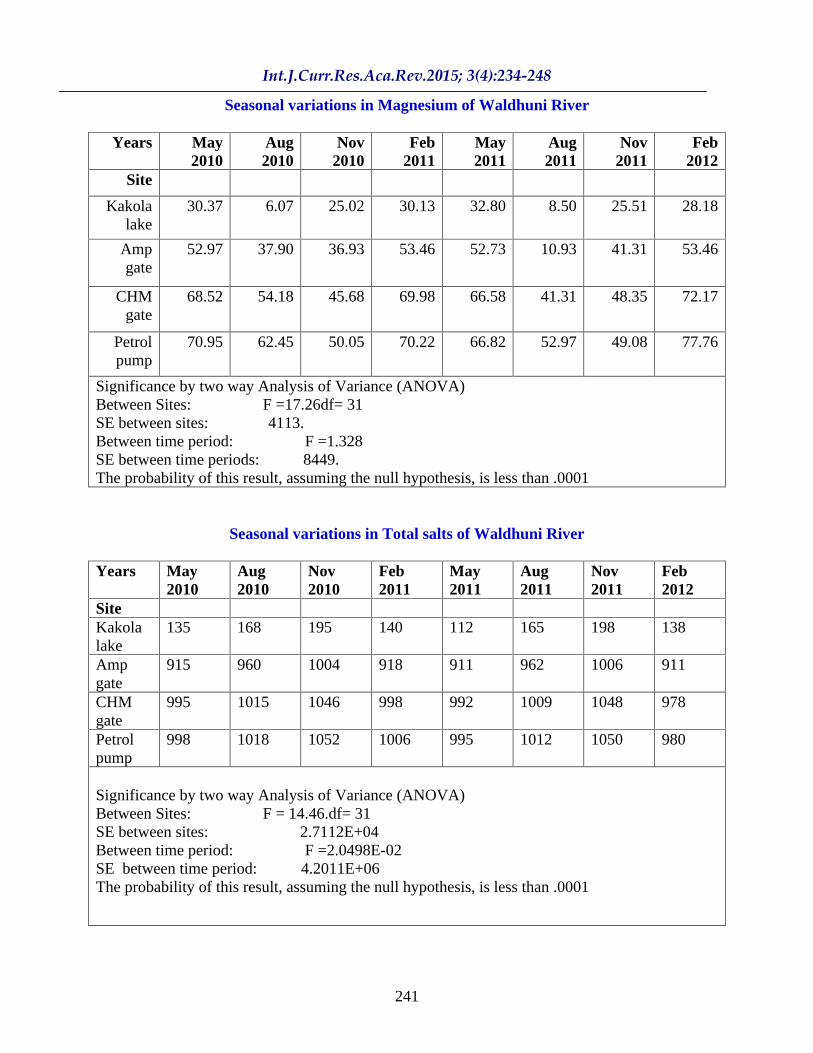
Seasonal variations in Magnesium of Waldhuni River
Years May 2010
Aug 2010
Nov 2010
Feb 2011
May 2011
Aug 2011
Nov 2011
Feb 2012
Site
Kakola lake
30.37 6.07 25.02 30.13 32.80 8.50 25.51 28.18
Amp gate
52.97 37.90 36.93 53.46 52.73 10.93 41.31 53.46
CHM gate
68.52 54.18 45.68 69.98 66.58 41.31 48.35 72.17
Petrol pump
70.95 62.45 50.05 70.22 66.82 52.97 49.08 77.76
Significance by two way Analysis of Variance (ANOVA) Between Sites: F =17.26df= 31 SE between sites: 4113. Between time period: F =1.328 SE between time periods: 8449. The probability of this result, assuming the null hypothesis, is less than .0001
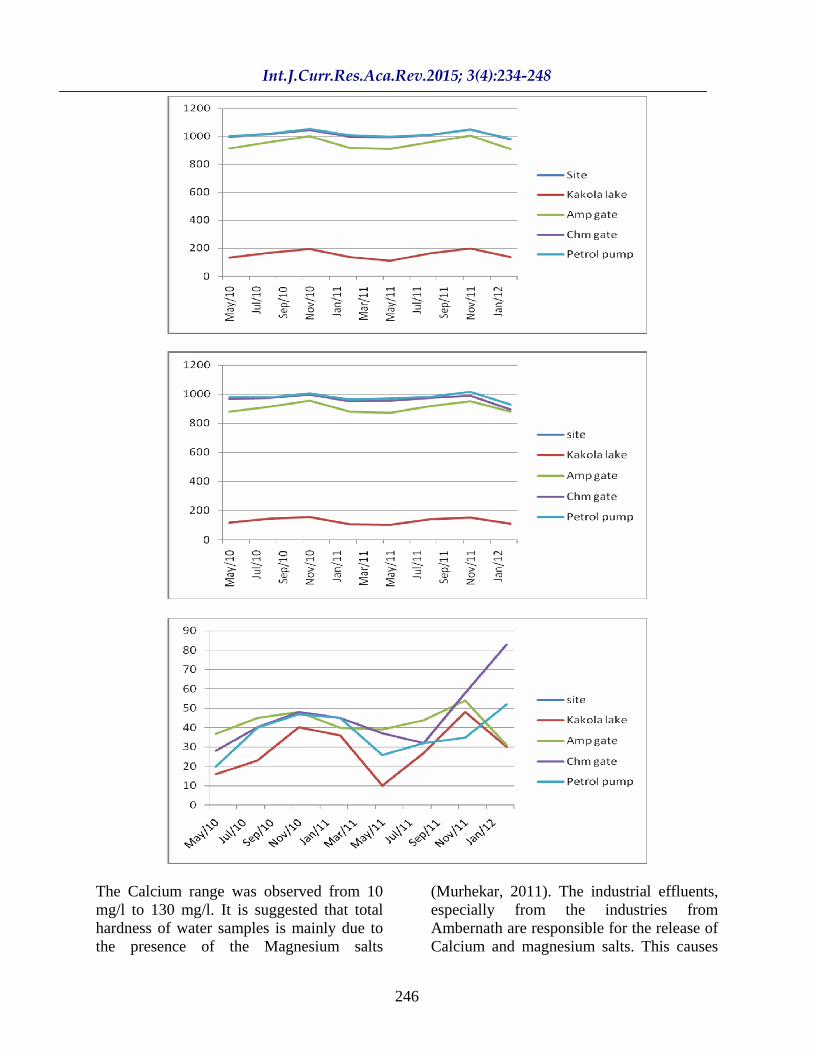
Seasonal variations in Total salts of Waldhuni River
Years May 2010
Aug 2010
Nov 2010
Feb 2011
May 2011
Aug 2011
Nov 2011
Feb 2012
Site Kakola lake
135 168 195 140 112 165 198 138
Amp gate
915 960 1004 918 911 962 1006 911
CHM gate
995 1015 1046 998 992 1009 1048 978
Petrol pump
998 1018 1052 1006 995 1012 1050 980
Significance by two way Analysis of Variance (ANOVA) Between Sites: F = 14.46.df= 31 SE between sites: 2.7112E+04 Between time period: F =2.0498E-02 SE between time period: 4.2011E+06 The probability of this result, assuming the null hypothesis, is less than .0001
242
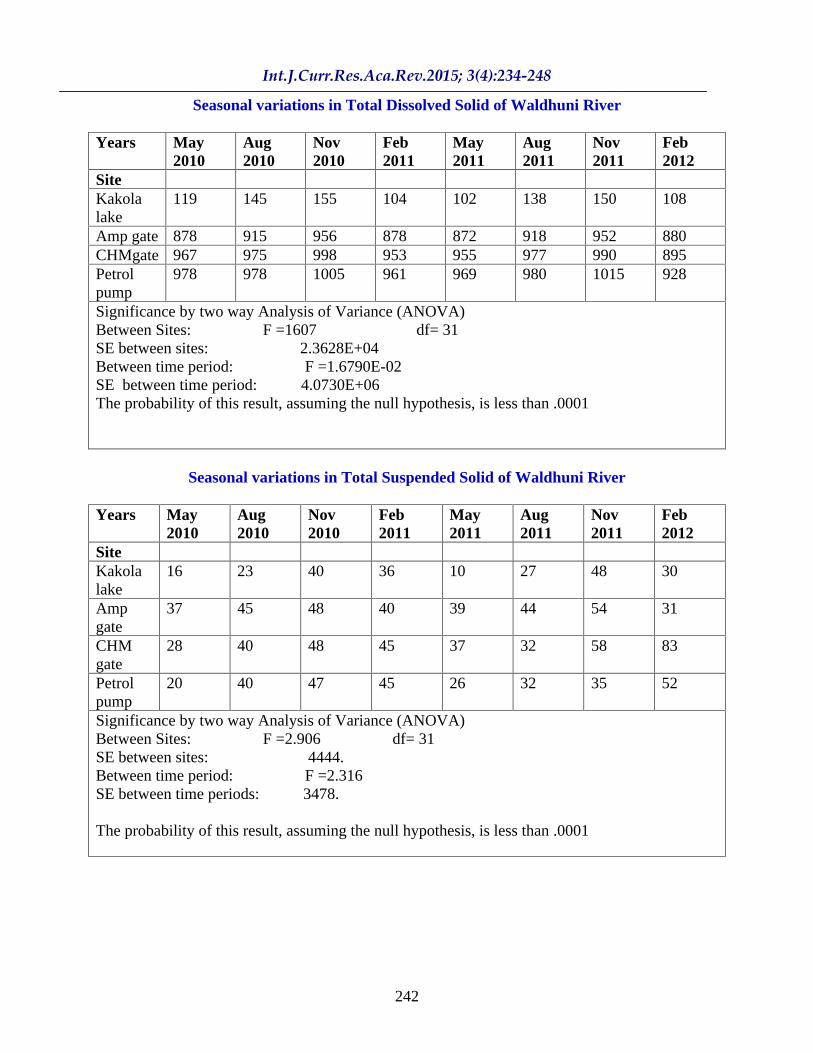
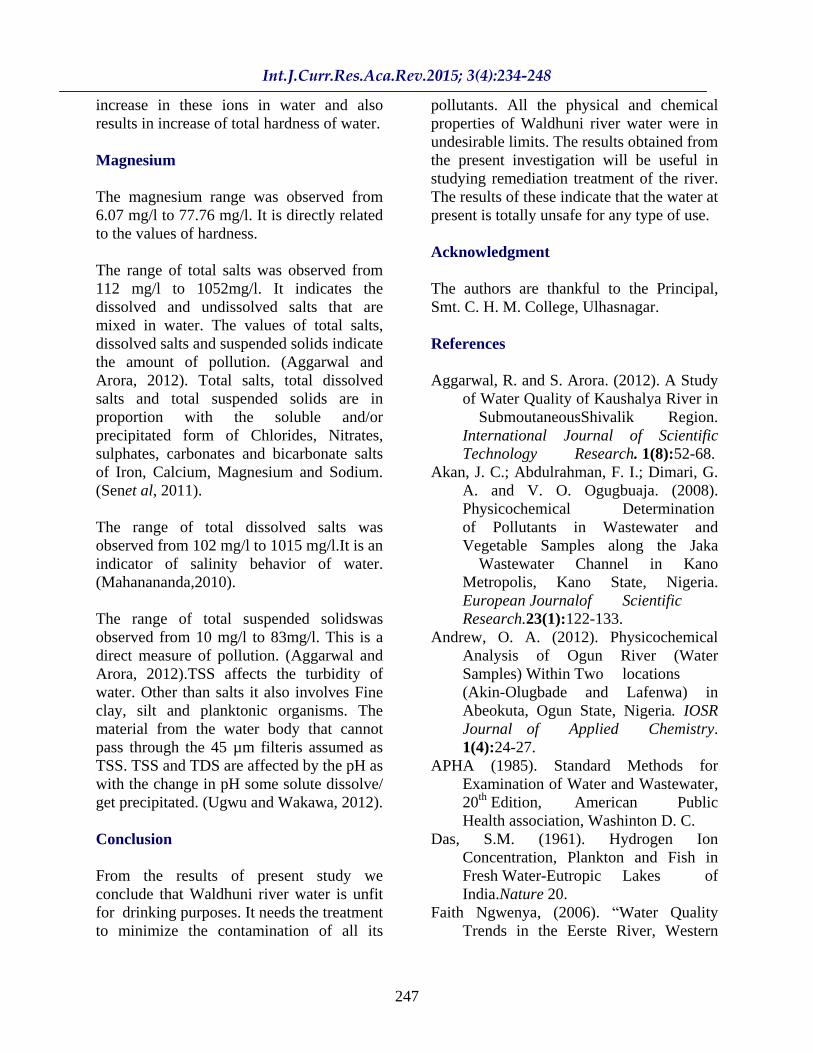
Seasonal variations in Total Dissolved Solid of Waldhuni River
Years May 2010
Aug 2010
Nov 2010
Feb 2011
May 2011
Aug 2011
Nov 2011
Feb 2012
Site Kakola lake
119 145 155 104 102 138 150 108
Amp gate
878 915 956 878 872 918 952 880 CHMgate
967 975 998 953 955 977 990 895 Petrol pump
978 978 1005 961 969 980 1015 928
Significance by two way Analysis of Variance (ANOVA) Between Sites: F =1607 df= 31 SE between sites: 2.3628E+04 Between time period: F =1.6790E-02 SE between time period: 4.0730E+06 The probability of this result, assuming the null hypothesis, is less than .0001
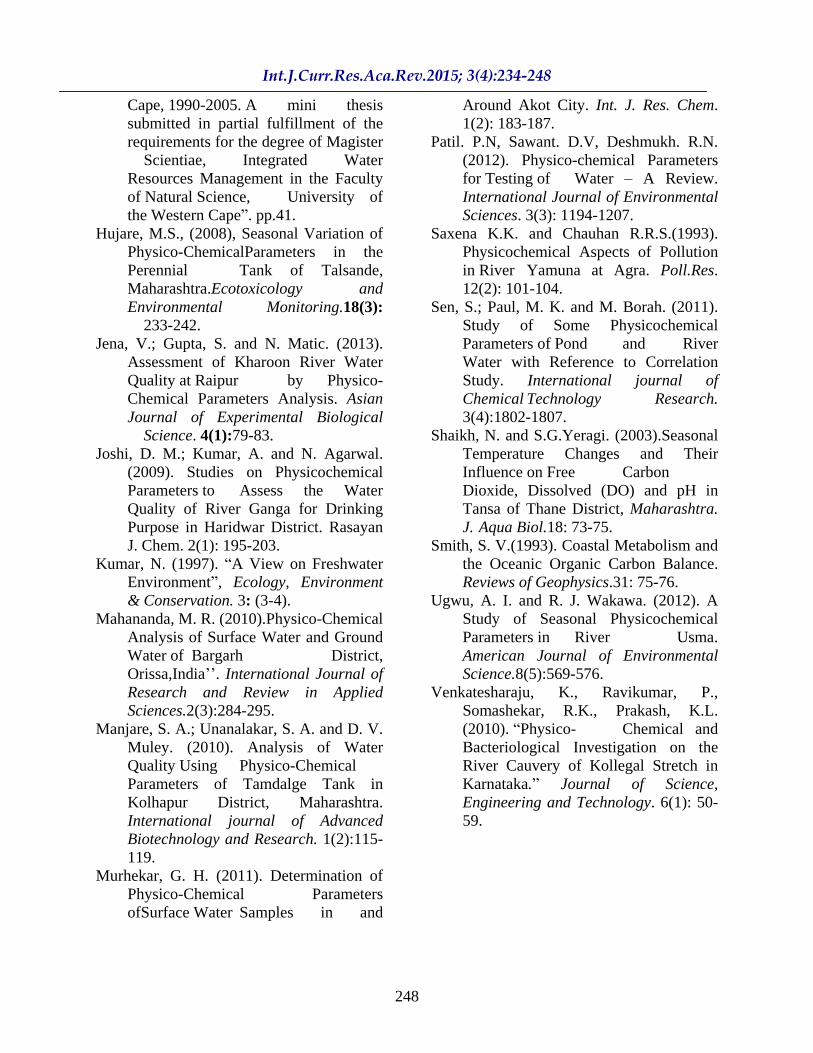
Seasonal variations in Total Suspended Solid of Waldhuni River
Years May 2010
Aug 2010
Nov 2010
Feb 2011
May 2011
Aug 2011
Nov 2011
Feb 2012
Site Kakola lake
16 23 40 36 10 27 48 30
Amp gate
37 45 48 40 39 44 54 31
CHM gate
28 40 48 45 37 32 58 83
Petrol pump
20 40 47 45 26 32 35 52
Significance by two way Analysis of Variance (ANOVA) Between Sites: F =2.906 df= 31 SE between sites: 4444. Between time period: F =2.316 SE between time periods: 3478.
The probability of this result, assuming the null hypothesis, is less than .0001
243
244
245
246
The Calcium range was observed from 10 mg/l to 130 mg/l. It is suggested that total hardness of water samples is mainly due to the presence of the Magnesium salts
(Murhekar, 2011). The industrial effluents, especially from the industries from Ambernath are responsible for the release of Calcium and magnesium salts. This causes
247
increase in these ions in water and also results in increase of total hardness of water.
Magnesium
The magnesium range was observed from 6.07 mg/l to 77.76 mg/l. It is directly related to the values of hardness.
The range of total salts was observed from 112 mg/l to 1052mg/l. It indicates the dissolved and undissolved salts that are mixed in water. The values of total salts, dissolved salts and suspended solids indicate the amount of pollution. (Aggarwal and Arora, 2012). Total salts, total dissolved salts and total suspended solids are in proportion with the soluble and/or precipitated form of Chlorides, Nitrates, sulphates, carbonates and bicarbonate salts of Iron, Calcium, Magnesium and Sodium. (Senet al, 2011).
The range of total dissolved salts was observed from 102 mg/l to 1015 mg/l.It is an indicator of salinity behavior of water. (Mahanananda,2010).
The range of total suspended solidswas observed from 10 mg/l to 83mg/l. This is a direct measure of pollution. (Aggarwal and Arora, 2012).TSS affects the turbidity of water. Other than salts it also involves Fine clay, silt and planktonic organisms. The material from the water body that cannot pass through the 45 µm filteris assumed as TSS. TSS and TDS are affected by the pH as with the change in pH some solute dissolve/ get precipitated. (Ugwu and Wakawa, 2012).
Conclusion
From the results of present study we conclude that Waldhuni river water is unfit for drinking purposes. It needs the treatment to minimize the contamination of all its
pollutants. All the physical and chemical properties of Waldhuni river water were in undesirable limits. The results obtained from the present investigation will be useful in studying remediation treatment of the river. The results of these indicate that the water at present is totally unsafe for any type of use.
Acknowledgment
The authors are thankful to the Principal, Smt. C. H. M. College, Ulhasnagar.
References
Aggarwal, R. and S. Arora. (2012). A Study of Water Quality of Kaushalya River in
SubmoutaneousShivalik Region. International Journal of Scientific Technology Research. 1(8):52-68.
Akan, J. C.; Abdulrahman, F. I.; Dimari, G. A. and V. O. Ogugbuaja. (2008). Physicochemical Determination of Pollutants in Wastewater and Vegetable Samples along the Jaka
Wastewater Channel in Kano Metropolis, Kano State, Nigeria. European Journalof Scientific Research.23(1):122-133.
Andrew, O. A. (2012). Physicochemical Analysis of Ogun River (Water Samples) Within Two locations (Akin-Olugbade and Lafenwa) in Abeokuta, Ogun State, Nigeria. IOSR Journal of Applied Chemistry. 1(4):24-27.
APHA (1985). Standard Methods for Examination of Water and Wastewater, 20th Edition, American Public Health association, Washinton D. C.
Das, S.M. (1961). Hydrogen Ion Concentration, Plankton and Fish in Fresh Water-Eutropic Lakes of India.Nature 20.
Faith Ngwenya, (2006). Water Quality Trends in the Eerste River, Western
248
Cape, 1990-2005. A mini thesis submitted in partial fulfillment of the requirements for the degree of Magister
Scientiae, Integrated Water Resources Management in the Faculty of Natural Science, University of the Western Cape . pp.41.
Hujare, M.S., (2008), Seasonal Variation of Physico-ChemicalParameters in the Perennial Tank of Talsande, Maharashtra.Ecotoxicology and Environmental Monitoring.18(3):
233-242. Jena, V.; Gupta, S. and N. Matic. (2013).
Assessment of Kharoon River Water Quality at Raipur by Physico-Chemical Parameters Analysis. Asian Journal of Experimental Biological
Science. 4(1):79-83. Joshi, D. M.; Kumar, A. and N. Agarwal.
(2009). Studies on Physicochemical Parameters to Assess the Water Quality of River Ganga for Drinking Purpose in Haridwar District. Rasayan J. Chem. 2(1): 195-203.
Kumar, N. (1997). A View on Freshwater Environment , Ecology, Environment & Conservation. 3: (3-4).
Mahananda, M. R. (2010).Physico-Chemical Analysis of Surface Water and Ground Water of Bargarh District, Orissa,India . International Journal of Research and Review in Applied Sciences.2(3):284-295.
Manjare, S. A.; Unanalakar, S. A. and D. V. Muley. (2010). Analysis of Water Quality Using Physico-Chemical Parameters of Tamdalge Tank in Kolhapur District, Maharashtra. International journal of Advanced Biotechnology and Research. 1(2):115-119.
Murhekar, G. H. (2011). Determination of Physico-Chemical Parameters ofSurface Water Samples in and
Around Akot City. Int. J. Res. Chem. 1(2): 183-187.
Patil. P.N, Sawant. D.V, Deshmukh. R.N. (2012). Physico-chemical Parameters for Testing of Water
A Review.
International Journal of Environmental Sciences. 3(3): 1194-1207.
Saxena K.K. and Chauhan R.R.S.(1993). Physicochemical Aspects of Pollution in River Yamuna at Agra. Poll.Res. 12(2): 101-104.
Sen, S.; Paul, M. K. and M. Borah. (2011). Study of Some Physicochemical Parameters of Pond and River Water with Reference to Correlation Study. International journal of Chemical Technology Research. 3(4):1802-1807.
Shaikh, N. and S.G.Yeragi. (2003).Seasonal Temperature Changes and Their Influence on Free Carbon Dioxide, Dissolved (DO) and pH in Tansa of Thane District, Maharashtra. J. Aqua Biol.18: 73-75.
Smith, S. V.(1993). Coastal Metabolism and the Oceanic Organic Carbon Balance. Reviews of Geophysics.31: 75-76.
Ugwu, A. I. and R. J. Wakawa. (2012). A Study of Seasonal Physicochemical Parameters in River Usma. American Journal of Environmental Science.8(5):569-576.
Venkatesharaju, K., Ravikumar, P., Somashekar, R.K., Prakash, K.L. (2010). Physico- Chemical and Bacteriological Investigation on the River Cauvery of Kollegal Stretch in Karnataka.
Journal of Science, Engineering and Technology. 6(1): 50-59.