Embed Size (px)
Citation preview
PHYSIK-DEPARTMENT
Chemical modification of carbon nanotubes for nanocomposite applications
Dissertation
von
Anastasia A. Golosova
TECHNISCHE UNIVERSITÄT MÜNCHEN

TECHNISCHE UNIVERSITÄT MÜNCHEN
Fachgebiet Physik weicher Materie
Chemical modification of carbon nanotubes
for nanocomposite applications
Anastasia A. Golosova
Vollständiger Abdruck der von der Fakultät für Physik der Technischen Universität
München zur Erlangung des akademischen Grades eines
Doktors der Naturwissenschaften (Dr. rer. nat.)
genehmigten Dissertation.
Vorsitzender: Univ.-Prof. Dr. Ralf Metzler
Prüfer der Dissertation: 1. Univ.-Prof. Christine M. Papadakis, Ph.D.
2. Univ.-Prof. Dr. Rainer Jordan, Technische Universität Dresden
Die Dissertation wurde am …12.07.2011… bei der Technischen Universität München eingereicht und durch die Fakultät für Physik am …25.07.2011… angenommen.


Great difficulties are felt at first [in research] and these cannot be overcome except by starting from experiments … and then by conceiving certain hypotheses … But even so, very much hard work remains to be done and one needs not only great perspicacity but often a degree of good fortune.
(Huygens)

Preface
The present dissertation is the result of the project “Functional nanocomposites by directed
assembly”, funded by International Graduate School of Science and Engineering (IGSSE).
IGSSE is a scientific institution of TU München that offers an interdisciplinary and team-
oriented approach to a research. The present work is not an exception. The goals of the
project could only be obtained in close collaboration between polymer chemistry, polymer
physics and materials engineering. The chemical modification of the carbon nanotubes and
its characterization was carried out in the WACKER-Lehrstuhl für Makromolekulare
Chemie, TU München, whereas analysis of the carbon nanotubes’ dispersions in the
Fachegebiet Physik weicher Materie, Physikdepartment, TU München. The preparation and
characterization of the carbon nanotubes/block copolymer nanocomposites was performed
during a three-months research stay at the DTU Nanotech, Technical University of
Denmark.

Abstract
Nanocomposites from carbon nanotubes (CNTs) and anisotropic, nanostructured block
copolymers are expected to have anisotropic mechanical and electrical properties.
However, for efficient incorporation of CNTs into a polymer matrix, a chemical
functionalization of CNTs is required; also, a thorough characterization of their dispersion
ability is of key importance. A straightforward procedure for the covalent modification of
both single-walled and multi-walled CNTs with polymer grafts is presented. Self-initiated
photografting photopolymerization of vinyl monomers (styrene and 4-vinylpyridine) onto
CNTs results in a highly functionalized material with up to 44 wt.% of polymer grafts.
Using small-angle scattering, the effect of the modification of CNTs on their agglomeration
behavior in dilute toluene dispersions was studied. While small-angle X-ray scattering
gives overall information, small-angle neutron scattering together with the use of deuterated
solvents offers the possibility to highlight the polymer shells or the CNTs. The structure of
the CNTs and their agglomerates were modeled as fractal aggregates of homogeneous or
core-shell cylinders for single- and multi-walled CNTs, respectively. This way, the
dispersibility of the CNTs as well as the thickness of the shell formed by the grafted
polymers in dependence on the time of polymerization was characterized. The presence of
the covalently bound polymer was found to significantly improve the dispersion ability of
the CNTs. Improved dispersibility of the polystyrene-modified CNTs was also observed in
a poly(styrene-b-isoprene) diblock copolymer matrix, and it was shown that anisotropic,
nanostructured block copolymer may serve as a 3D template for the directed self-assembly
of the modified CNTs.

Zusammenfassung
In Nanokompositen aus Kohlenstoffnanoröhrchen (CNTs) und anisotropen,
nanostrukturierten Blockcopolymeren werden anisotrope mechanische und elektrische
Eigenschaften erwartet. Um jedoch CNTs in eine Polymermatrix einzubetten, ist eine
chemische Modifikation der CNTs nötig. Ferner ist eine umfassende Charakterisierung ihrer
Dispersionsfähigkeit von größter Wichtigkeit. In dieser Arbeit wird ein einfaches Verfahren
zur kovalenten Modifikation von ein- und mehrwandigen CNTs mit Polymeren aufgezeigt.
Die sogenannte „self-initiated photografting photopolymerization“ von Vinylmonomeren
(Styrol und 4-Vinylpyridin) auf CNTs führt zu funktionalisierten Materialien mit bis zu 44
Gew.% an Propfpolymeren. Mit Röntgen- und Neutronenkleinwinkelstreuung wurde der
Effekt dieser Modifikation der CNTs auf ihr Agglomerationsverhalten in verdünnten
Dispersionen in Toluol untersucht. Kleinwinkelröntgenstreuung ermöglichte hierbei einen
generellen Überblick, wohingegen mit Kleinwinkelneutronenstreuung in Kombination mit
deuterierten Lösungsmitteln die CNTs bzw. deren Polymerbeschichtung selektiv sichtbar
wurde. Die Struktur und die Aggregate der CNTs wurden als fraktale Aggregate, bestehend
aus homogenen bzw. Kern-Schale Zylindern, modelliert. Auf diese Weise konnten das
Dispersionsverhalten der CNTs sowie die Dicke der Beschichtung aus Propfpolymeren in
Abhängigkeit der Polymerisationsdauer bestimmt werden. Zudem zeigte sich, dass die
Dispersionsfähigkeit in Anwesenheit von kovalent gebundenem Polymer deutlich zunahm.
Ferner konnte eine verbesserte Dispersionsfähigkeit für CNTs in einer Poly(Styrol-b-Isopren)
Diblockcopolymermatrix beobachtet werden. Anisotrope, nanostrukturierte Blockcopolymere
könnten also als 3D-Matrix dienen, um eine ausgerichtete Selbstanordnung der modifizierten
CNTs zu ermöglichen.

List of abbreviations
AFM atomic force microscopy
BCP block copolymer
BSE back scattered electrons
CNTs carbon nanotubes
CR Congo red
CVD chemical vapor deposition
D-toluene deuterated toluene
DWCNTs double-walled carbon nanotubes
EDC 1-ethyl-3-(3-dimethylaminopropyl) carbodiimide hydrochloride
ESEM environmental scanning electron microscopy
EtOH ethanol
HD-toluene mixture of protonated/deuterated toluene
HiPCO high pressure carbon monoxide processes
HOPG highly ordered pyrolytic graphite
MeOH methanol
MWCNTs multi-walled carbon nanotubes
MWCNT-PS-1d multi-walled carbon nanotubes covalently modified by polystyrene,
1 day of polymerization
MWCNT-PS-2d multi-walled carbon nanotubes covalently modified by polystyrene,
2 days of polymerization
MWCNT-PS-3d multi-walled carbon nanotubes covalently modified by polystyrene,
3 days of polymerization
MWCNT-P(4VP)-1d multi-walled carbon nanotubes covalently modified by poly(4-
vynile pyridine), 1 day of polymerization
MWCNT-P(4VP)-2d multi-walled carbon nanotubes covalently modified by poly(4-
vynile pyridine), 2 days of polymerization
PDI polydispersity index
PE primary electrons
PhCF3 4-trifluoromethylphenyldiazonium tetrafluoroborate
PhNO2 4-nitrophenyldiazonium tetrafluoroborate
P3HT-b-PS poly(3-hexylthiophene)-b-polystyrene
PMMA polymethylmethacrylate
PPE poly(aryleneethynylene)
PS polystyrene
P(S-b-I) poly(styrene-b-isoprene)
P(4VP) poly(4-vynile pyridine)
RBM radial breathing mode
ROP ring-opening polymerization
RT room temperature
SAM self-assembled monolayer
SAN poly(styrene-co-acrylonotrile)
SANS small-angle neutron scattering
SAS small-angle scattering
SAXS small-angle X-ray scattering
SBS poly(styrene-b-butadiene-b-styrene)
SDS sodium dodecyl sulfate
SE secondary electrons
SEM scanning electron microscopy
SLD scattering length density
SWCNTs single-walled carbon nanotubes
SWCNT-PS-1d single-walled carbon nanotubes covalently modified by polystyrene,
1 day of polymerization
SWCNT-PS-2d single-walled carbon nanotubes covalently modified by polystyrene,
2 days of polymerization
SWCNT-PS-3d single-walled carbon nanotubes covalently modified by polystyrene,
3 days of polymerization
SWCNT-P(4VP)-1d single-walled carbon nanotubes covalently modified by poly(4-
vynile pyridine), 1 day of polymerization
SWCNT-P(4VP)-2d single-walled carbon nanotubes covalently modified by poly(4-
vynile pyridine), 2 days of polymerization
TEM transmission electron microscopy
TGA thermo-gravimetric analysis

THF tetrahydrofuran
UNCD ultrananocristalline diamond
USANS ultrasmall-angle neutron scattering
Table of contents
1 INTRODUCTION ........................................................................................................................ 1
2 BACKGROUND ......................................................................................................................... 5
2.1 Carbon nanotubes: Discovery, structure, properties ................................................................. 5
2.1.1 Discovery ............................................................................................................................. 5
2.1.2 Structure ............................................................................................................................. 7
2.1.3 Physical properties ............................................................................................................12
2.1.4 Synthesis of CNTs ..............................................................................................................15
2.2 CNT/polymer nanocomposites: Ways to manipulate the CNTs for their improved dispersion
in the matrix ...................................................................................................................................17
2.3. General approaches for functionalization of CNTs .................................................................23
2.3.1 Noncovalent modification .................................................................................................24
2.3.2 Covalent modification .......................................................................................................27
2.3.3 Covalent modification with polymers ...............................................................................33
3 PURPOSE AND OBJECTIVES ..................................................................................................... 35
4 CHARACTERIZATION METHODS .............................................................................................. 37
4.1 Raman spectroscopy ................................................................................................................38
4.2 Thermo‐gravimetric analysis ....................................................................................................44
4.3 Atomic force microscopy ..........................................................................................................45
4.4 Scanning electron microscopy..................................................................................................48
4.5 Basics of small‐angle scattering ...............................................................................................52
5 CHEMICAL MODIFICATION OF CNTs WITH POLYMERS ............................................................ 61
5.1 State of the art .........................................................................................................................61
5.2 Experimental part .....................................................................................................................67
5.2.1 Materials ...........................................................................................................................67
5.2.2 Modification of CNTs with polymer grafts ........................................................................67
5.3 Results and discussion ..............................................................................................................68
5.3.1 Raman spectroscopy .........................................................................................................69
5.3.2 Thermo‐gravimetric analysis ............................................................................................75
5.3.3 Kinetics of the reaction .....................................................................................................76
5.3.4 Dispersion ability of CNTs .................................................................................................80
5.3.5 pH responsive behavior of the CNTs modified with P(4VP) ..............................................81
5.4 Conclusions ...............................................................................................................................84
6 DISPERSIBILITY OF CNTs: SMALL‐ANGLE SCATTERING STUDY .................................................. 85
6.1 State of the art .........................................................................................................................85
6.2 Experimental part .....................................................................................................................88
6.2.1 Materials ...........................................................................................................................88
6.2.2 Small‐angle X‐ray and neutron scattering experiments ...................................................88
6.3 Results ......................................................................................................................................89
6.3.1 Overview on SAXS and SANS results .................................................................................89
6.3.2 Modeling of SAXS and SANS curves ..................................................................................94
6.3.3 Results and discussion .......................................................................................................97
6.4 Conclusions ............................................................................................................................ 111
7 CNTs/BLOCK COPOLYMER NANOCOMPOSITES...................................................................... 113
7.1 Block copolymers as a matrix for CNT/polymer nanocomposites ........................................ 113
7.2 Experimental part .................................................................................................................. 117
7.2.1 CNT/block copolymer nanocomposite preparation....................................................... 117
7.2.2 Scanning electron microscopy ....................................................................................... 118
7.3 Results and discussion ........................................................................................................... 118
7.3.1 Charge contrast conditions of SEM ................................................................................ 120
7.3.2 Charge contrast imaging of CNT/block copolymer nanocomposites ............................. 124
7.4 Conclusions ............................................................................................................................ 128
8 CONCLUSIONS AND OUTLOOK .............................................................................................. 129
Bibliography ............................................................................................................................ 135
List of publications .................................................................................................................. 155
Acknowledgments ................................................................................................................... 159
1 Introduction
Composite materials, or just composites, are materials made of two or more components
with significantly different physical or chemical properties. Synergism of the combined
components produces material properties that are unavailable from the individual
components. Such an effect was already known in 1500s BC when early Egyptians used a
mixture of mud and straw to create strong and durable buildings [S02]: light and ex facte
fragile straw served as perfect reinforcing filler for a brittle mud.
Recently the most attention of scientific community is attracted by nanocomposites, or
nanoparticle-filled materials, first of all on base of polymers; “nanomaterials”,
“nanocomposites”, “nanotechnology” became fancy words of the 21st century. Why nano
makes the usual thing so attractive?
Zh. I. Alferov defined a nanomaterial as following [A03]: “If upon decrease of volume of
any kind of material in one, two or three dimensions up to the nanometer scale, new
property appears, or this property is characteristic to the group of these objects, then such
an object should be considered as a nanomaterial, and the technology of its production as
well as the further work with it, is a nanotechnology”. Thus, nanomaterial is not simply
another step in the miniaturization of materials; the keywords for it are “nanometer scale”
and “new property” that becomes pronounced only when a nanometer scale is reached. The
factors that make the properties of nanomaterials to differ significantly from the ones of the
larger particles of the same material are the quantum effects and the increased relative
2 Chapter 1. Introduction surface to volume ratio. These factors cause change or enhance such properties as
reactivity, optical, mechanical or electrical characteristics. Moreover, it is also widely
believed that transfer of the nanoparticles properties to the composite material might be
very efficient due to their high surface to volume ratio, and, thus, the nano-sized particles,
when loaded for example into the polymer matrices, unlike macro- or micro-fillers, have a
potential to push the properties of the polymer to extreme values. That is why
nanocomposites, have recently received a growing scientific and commercial interest
[HHO+06, TLC05, BMT05].
Carbon nanotubes (CNTs) play an important role in the context of nanomaterials because of
their exceptional combination of physical properties [RTM04]. However, despite the
numerous attempts to transfer fully their properties to the polymer nanocomposite, most of
them meet the failure due to difficulties to distribute the particles individually and
homogeneously within the matrix. Another challenge, which arises due to smooth and
relatively unreactive surface of CNTs, is to generate a strong bonding between CNTs and
the matrix necessary for good overall composite performance. To solve these problems,
both physical and chemical methods for modification of CNTs surface and for
incorporation of them into matrix were suggested. However, whereas physical routes
usually are not efficient enough in terms of dispersion stability and load transfer between
the fillers and the polymer matrix, chemical methods often require complex multi-step
chemical treatment of CNTs, often with aggressive reagents destroying the unique 1D
structure, and thus, leading to loss of the CNTs properties.
New strategies need to be developed to tune the surface properties of the CNTs for their
efficient incorporation into the matrix material. Also, in order to optimize the
nanocomposite performance, the appropriate characteristic techniques should be found to
fully describe the behavior of the CNTs in bulk, within the polymer matrix and in liquids
(solvents). These challenging and interdisciplinary tasks, where chemistry and physics meet
together, are the focus problems of the present dissertation.
The thesis is structured as following: The theoretical background and the state of the art in
the field of CNT/polymer nanocomposites, that helps to understand the nature of CNTs,
their unique properties and the problems concerning the CNTs processing, are presented in
the next Chapter. This is followed by the Chapter 3: Purpose and objectives, where the
problems of the present dissertation are defined. In Chapter 4 the description of the
methods applied for characterization of the studied system of CNTs and CNT/polymer
3 nanocomposites are presented. The novel approach for chemical modification of CNTs with
polymer grafts is discussed in Chapter 5, followed by the small-angle scattering study of
the CNTs dispersion ability (Chapter 6). In this Chapter with use of small-angle scattering
techniques we will try to answer the question, if the suggested modification is efficient in
terms of dispersion ability of CNTs, and to analyze the influence of the modification on the
CNTs’ morphology. Chapter 7 is devoted to CNT/block copolymer nanocomposites: first,
the advantages of using phase separated block copolymers instead of homopolymer matrix,
as well as the present progress in the field of CNT/block copolymer nanocomposites, will
be discussed; this is followed by the results of the self-assembly of polystyrene-modified
CNTs into the phase-separated poly(styrene-b-isoprene) block copolymer matrix and of the
SEM characterization of the distribution of the CNTs within the nanocomposite. Finally,
the results of the presented dissertation are concluded in Chapter 8.

4 Chapter 1. Introduction
2 Background
2.1 Carbon nanotubes: Discovery, structure, properties
It may be a pure coincidence, or regular occurrence, but the fact that carbon materials, more
exactly nanomaterials, attract attention of scientific community already for several decades
is unquestionable: 1985 – fullerenes, 1991 – carbon nanotubes, 2010 – graphene. The
present dissertation is devoted to carbon nanotubes, or just CNTs, and in this chapter we try
to find out what makes these particles so unusual and attractive.
2.1.1 Discovery
As noted above, the “epoch” of CNTs starts from 1991, from the famous Nature-
publication by Iijima [I91], where he reported on the formation of “a new type of finite
carbon structures consisting of needle-like tubes” which were accidentally discovered
during electric arc-discharge experiments to produce fullerenes (Fig. 2.1a). From that time
on CNTs play an essential part in manuscript topics for already two decades. The amount of
scientific papers concerning CNTs, their properties, possible application and other aspects
of CNTs is enormous. Many of the articles begin with referring to the Nature-publication as
to the first mention of the CNTs. However, the observed “niddle-like tubes” of carbon were
not as “new” as reported by Iijima, and it is often wrong to consider 1991 as a birth year of
the CNTs. The matter is that in Journal of Physical Chemistry of Russia already in 1952
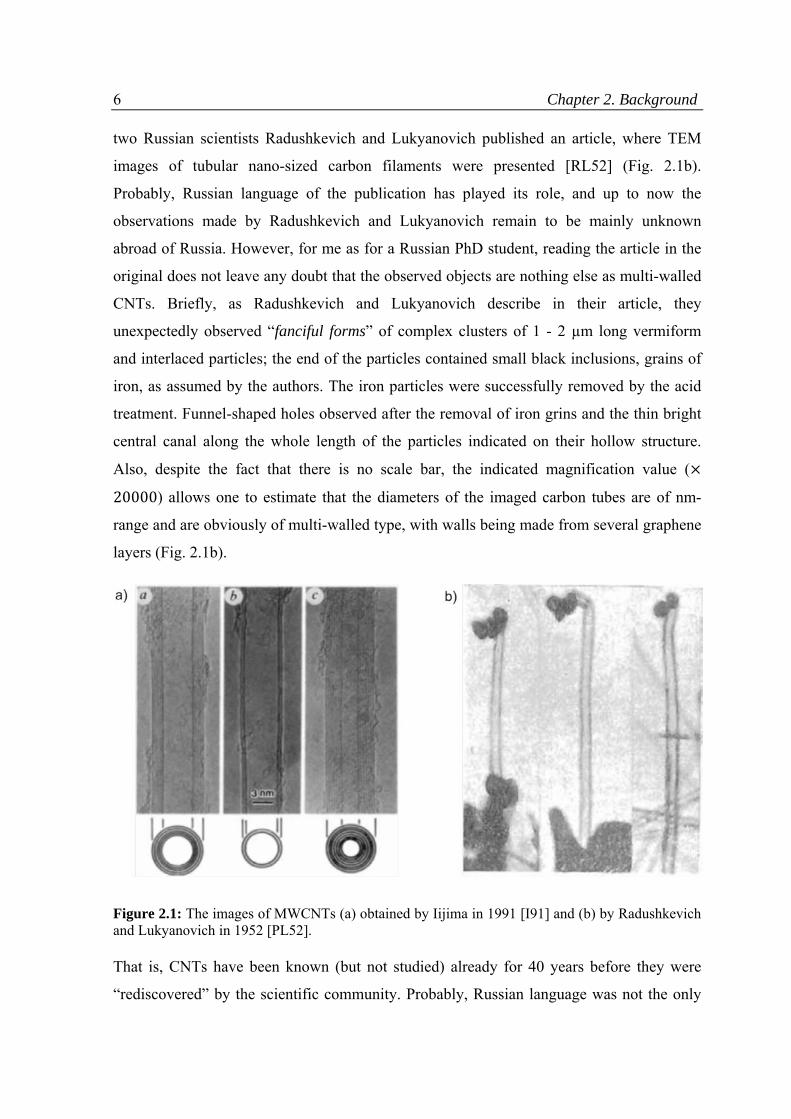
6 Chapter 2. Background two Russian scientists Radushkevich and Lukyanovich published an article, where TEM
images of tubular nano-sized carbon filaments were presented [RL52] (Fig. 2.1b).
Probably, Russian language of the publication has played its role, and up to now the
observations made by Radushkevich and Lukyanovich remain to be mainly unknown
abroad of Russia. However, for me as for a Russian PhD student, reading the article in the
original does not leave any doubt that the observed objects are nothing else as multi-walled
CNTs. Briefly, as Radushkevich and Lukyanovich describe in their article, they
unexpectedly observed “fanciful forms” of complex clusters of 1 - 2 µm long vermiform
and interlaced particles; the end of the particles contained small black inclusions, grains of
iron, as assumed by the authors. The iron particles were successfully removed by the acid
treatment. Funnel-shaped holes observed after the removal of iron grins and the thin bright
central canal along the whole length of the particles indicated on their hollow structure.
Also, despite the fact that there is no scale bar, the indicated magnification value (
20000) allows one to estimate that the diameters of the imaged carbon tubes are of nm-
range and are obviously of multi-walled type, with walls being made from several graphene
layers (Fig. 2.1b).
Figure 2.1: The images of MWCNTs (a) obtained by Iijima in 1991 [I91] and (b) by Radushkevich and Lukyanovich in 1952 [PL52].
That is, CNTs have been known (but not studied) already for 40 years before they were
“rediscovered” by the scientific community. Probably, Russian language was not the only
2.1. Carbon nanotubes: Discovery, structure, properties 7 reason for this delay, as the study could have been continued in Russia as well. We should
also keep in mind that it was 1952; at that time the TEM resolution was limited,
experimental equipment was insufficient, and just the concept of nanoscience had not been
established yet. In any case, it is more correct to consider 1952 as a birth year of multi-
walled CNTs. What concerns the other type of CNTs, single-walled, there are no doubts
that their observation and formation was first reported in the June 17th
issue of Nature in
1993 by two papers submitted independently, one by Iijima and Ichihashi [II93], and the
other one by Bethune et al. [BKV+93].
Thus, already history of CNTs’ discovery suggests us to be accurate in distinguishing the
two main types of CNTs, namely single-walled (SW) and multi-walled (MW). Let us see
what are the structure of CNTs and the differences between SW and MW CNTs.
2.1.2 Structure of CNTs
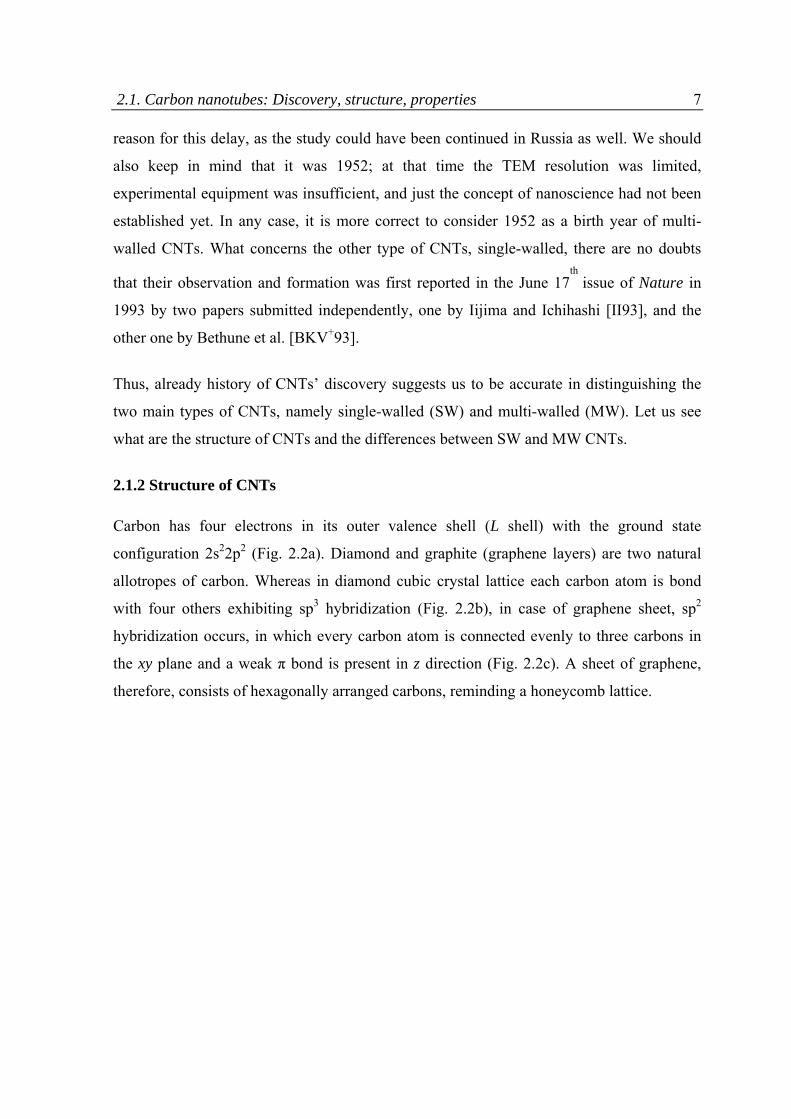
Carbon has four electrons in its outer valence shell (L shell) with the ground state
configuration 2s22p2 (Fig. 2.2a). Diamond and graphite (graphene layers) are two natural
allotropes of carbon. Whereas in diamond cubic crystal lattice each carbon atom is bond
with four others exhibiting sp3 hybridization (Fig. 2.2b), in case of graphene sheet, sp2
hybridization occurs, in which every carbon atom is connected evenly to three carbons in
the xy plane and a weak π bond is present in z direction (Fig. 2.2c). A sheet of graphene,
therefore, consists of hexagonally arranged carbons, reminding a honeycomb lattice.
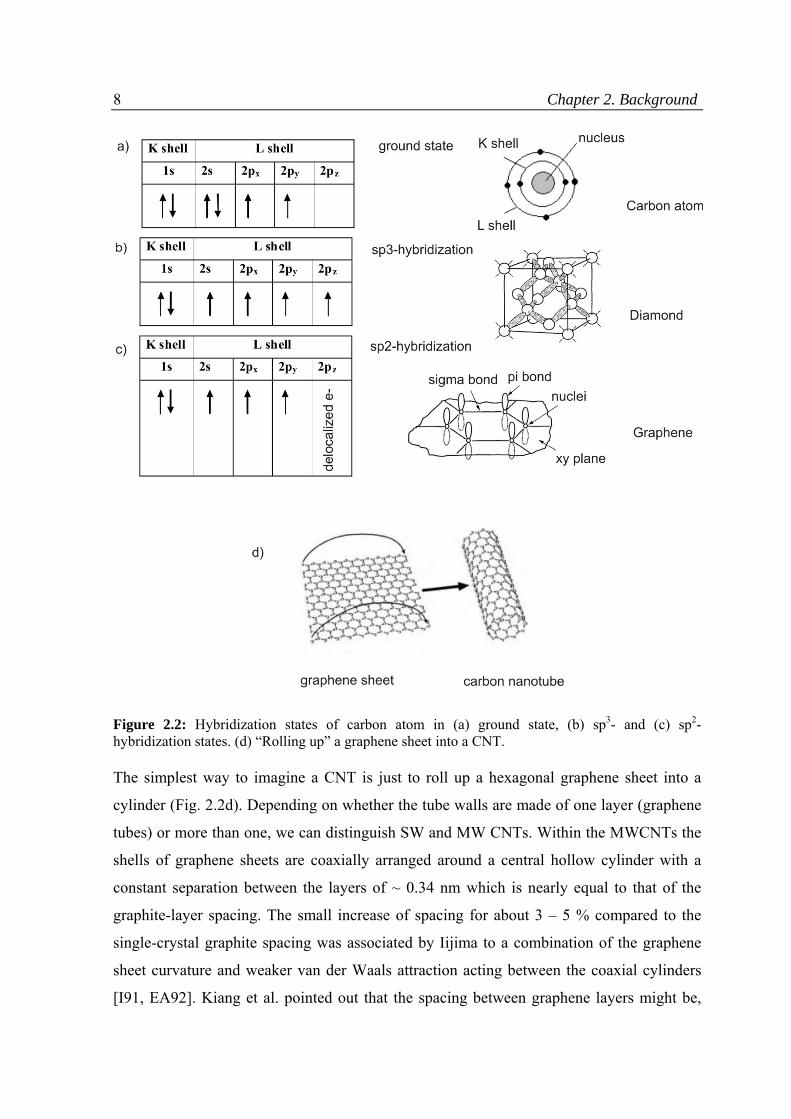
8 Chapter 2. Background
Figure 2.2: Hybridization states of carbon atom in (a) ground state, (b) sp3- and (c) sp2- hybridization states. (d) “Rolling up” a graphene sheet into a CNT.
The simplest way to imagine a CNT is just to roll up a hexagonal graphene sheet into a
cylinder (Fig. 2.2d). Depending on whether the tube walls are made of one layer (graphene
tubes) or more than one, we can distinguish SW and MW CNTs. Within the MWCNTs the
shells of graphene sheets are coaxially arranged around a central hollow cylinder with a
constant separation between the layers of ~ 0.34 nm which is nearly equal to that of the
graphite-layer spacing. The small increase of spacing for about 3 – 5 % compared to the
single-crystal graphite spacing was associated by Iijima to a combination of the graphene
sheet curvature and weaker van der Waals attraction acting between the coaxial cylinders
[I91, EA92]. Kiang et al. pointed out that the spacing between graphene layers might be,
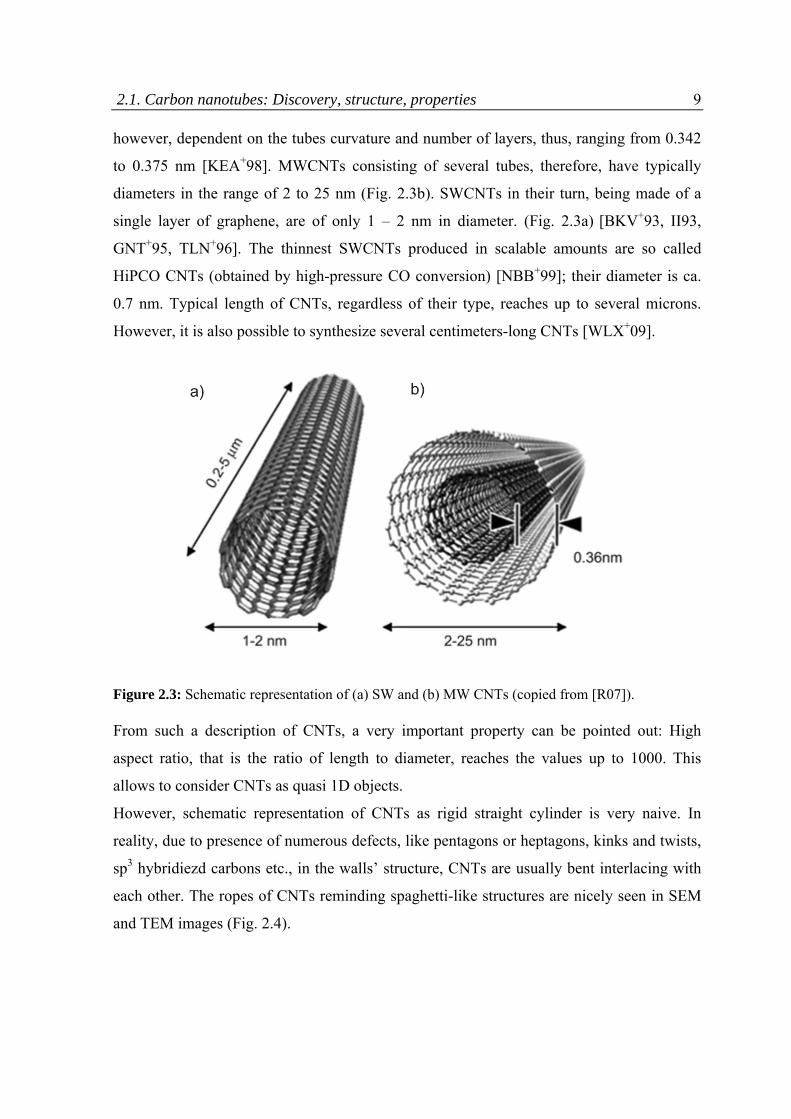
2.1. Carbon nanotubes: Discovery, structure, properties 9 however, dependent on the tubes curvature and number of layers, thus, ranging from 0.342
to 0.375 nm [KEA+98]. MWCNTs consisting of several tubes, therefore, have typically
diameters in the range of 2 to 25 nm (Fig. 2.3b). SWCNTs in their turn, being made of a
single layer of graphene, are of only 1 – 2 nm in diameter. (Fig. 2.3a) [BKV+93, II93,
GNT+95, TLN+96]. The thinnest SWCNTs produced in scalable amounts are so called
HiPCO CNTs (obtained by high-pressure CO conversion) [NBB+99]; their diameter is ca.
0.7 nm. Typical length of CNTs, regardless of their type, reaches up to several microns.
However, it is also possible to synthesize several centimeters-long CNTs [WLX+09].
Figure 2.3: Schematic representation of (a) SW and (b) MW CNTs (copied from [R07]).
From such a description of CNTs, a very important property can be pointed out: High
aspect ratio, that is the ratio of length to diameter, reaches the values up to 1000. This
allows to consider CNTs as quasi 1D objects.
However, schematic representation of CNTs as rigid straight cylinder is very naive. In
reality, due to presence of numerous defects, like pentagons or heptagons, kinks and twists,
sp3 hybridiezd carbons etc., in the walls’ structure, CNTs are usually bent interlacing with
each other. The ropes of CNTs reminding spaghetti-like structures are nicely seen in SEM
and TEM images (Fig. 2.4).
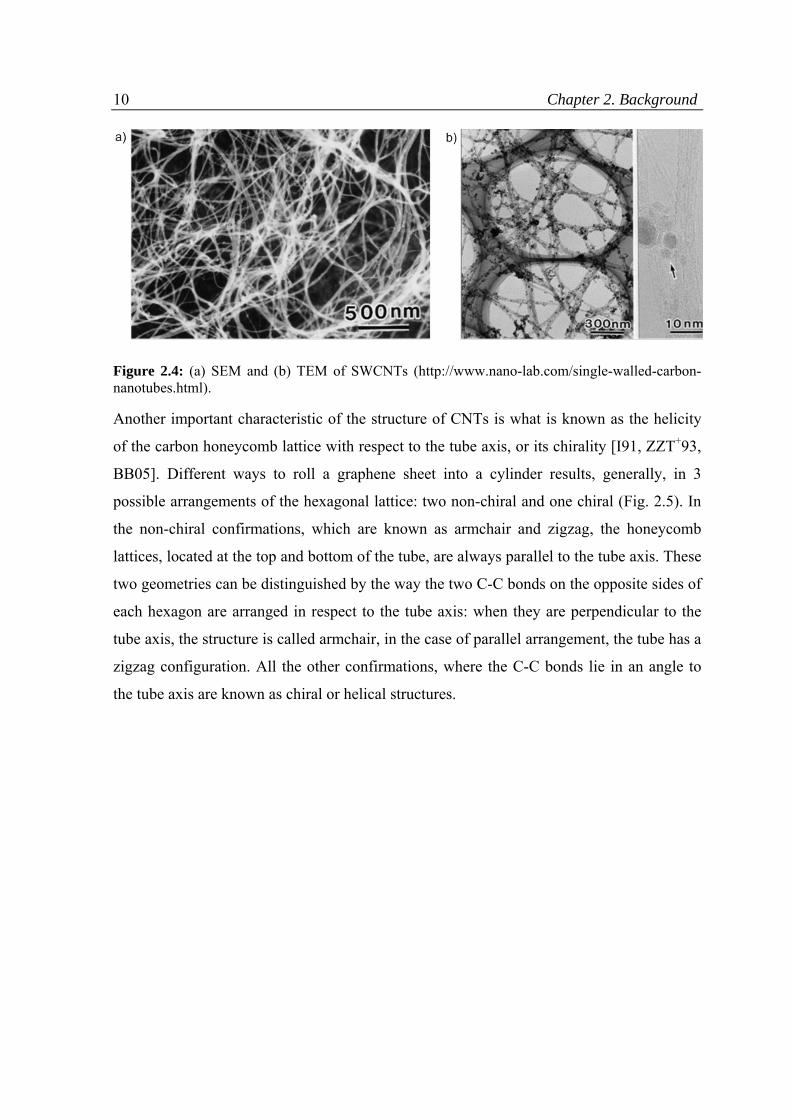
10 Chapter 2. Background
Figure 2.4: (a) SEM and (b) TEM of SWCNTs (http://www.nano-lab.com/single-walled-carbon-nanotubes.html).
Another important characteristic of the structure of CNTs is what is known as the helicity
of the carbon honeycomb lattice with respect to the tube axis, or its chirality [I91, ZZT+93,
BB05]. Different ways to roll a graphene sheet into a cylinder results, generally, in 3
possible arrangements of the hexagonal lattice: two non-chiral and one chiral (Fig. 2.5). In
the non-chiral confirmations, which are known as armchair and zigzag, the honeycomb
lattices, located at the top and bottom of the tube, are always parallel to the tube axis. These
two geometries can be distinguished by the way the two C-C bonds on the opposite sides of
each hexagon are arranged in respect to the tube axis: when they are perpendicular to the
tube axis, the structure is called armchair, in the case of parallel arrangement, the tube has a
zigzag configuration. All the other confirmations, where the C-C bonds lie in an angle to
the tube axis are known as chiral or helical structures.
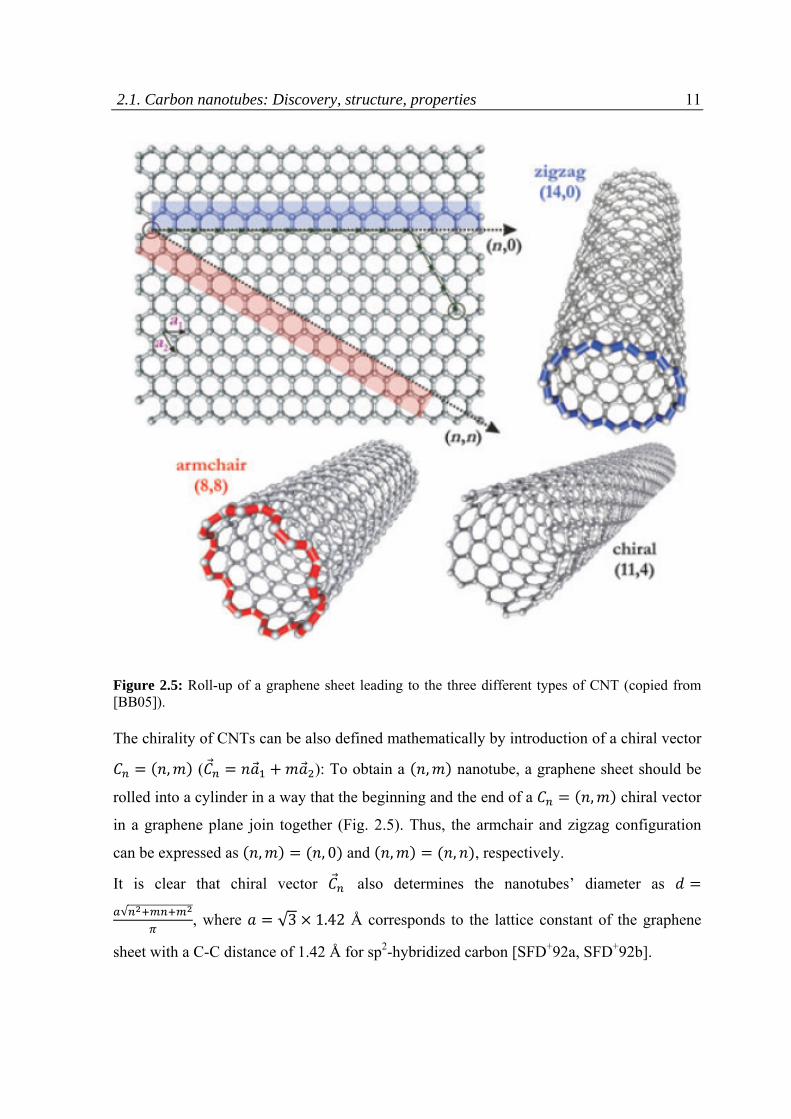
2.1. Carbon nanotubes: Discovery, structure, properties 11
Figure 2.5: Roll-up of a graphene sheet leading to the three different types of CNT (copied from [BB05]).
The chirality of CNTs can be also defined mathematically by introduction of a chiral vector
, ( ): To obtain a , nanotube, a graphene sheet should be
rolled into a cylinder in a way that the beginning and the end of a , chiral vector
in a graphene plane join together (Fig. 2.5). Thus, the armchair and zigzag configuration
can be expressed as , , 0 and , , , respectively.
It is clear that chiral vector also determines the nanotubes’ diameter as
√, where √3 1.42 Å corresponds to the lattice constant of the graphene
sheet with a C-C distance of 1.42 Å for sp2-hybridized carbon [SFD+92a, SFD+92b].
12 Chapter 2. Background Later it will be shown that the chirality and, hence, the diameter of the CNTs have a huge
impact on their electrical properties.
2.1.3 Physical properties of CNTs
“From the point of view of a chemist, a nanotube is a periodic, stiff aromatic
macromolecule approximately the same width as a strand of DNA. From the point of view
of an electrical engineer, it is a nanoscale conductor with properties reminiscent of bulk
metals and semiconductors. From the point of view of a condensed matter physicist, it is a
laboratory for understanding the physics of electrons in one dimension (1D)” [IME10].
Carbon nanotubes indeed are exceptional nanoparticles. The unique arrangement of carbon
atoms in 1D cylinders, where every sp2 hybridized carbon atom connected to others by σ
and π bonding, leads to impressive combination of physical properties [RTM04, SYR05,
MW06]. For instance, the tensile strength of CNTs is with 10 - 500 GPa much higher than
the one of high-strength steel (2 GPa), and their elastic modulus is comparable to the one of
diamond (ca. 1 TPa). At the same time, the CNTs’ hollow structure makes them very light,
with a bulk density of ca. 0.15 g/cm3 and a solid1 density of about 1.30 – 1.70 g/cm3, which
is half the density of aluminum. Moreover, CNTs are thermally stable up to 2800 °C in
vacuum and up to 750 °C in air. Such an enormous thermal stability of CNTs made
Radusckevich and Lukjanovich to think that the filaments, they observed and tried to burn
at 800 °C in air for 1 h in order to understand their origin, consist of ferric carbide [RL52].
Also, CNTs possess a large phonon mean free path way. This results in their high thermal
conductivity, which is theoretically predicted to be 6000 W/(m·K) at room temperature,
thus, nearly double that of the thermal conductivity of diamond (3320 W/(m·K)) [BKT00].
Special consideration should be given to electrical properties of CNTs. The electric current-
carrying capability of CNTs is estimated to be ca. 1 109 Amp/cm2, which is 3 orders of
magnitude higher than the one of copper. However, we should take into account that the
structure of the CNTs, namely the chirality and diameter of the tubes, the number of
graphene layers, has significant implication on their electrical properties. Thus, whereas
graphene is known to be semi-metal, or zero-gap semiconductor, CNTs, though formed of
essentially the same graphene layer (or several of them in case of MWCNTs), are either
1 The bulk density of CNTs is the density of a bundle, or group, of CNTs together; the solid density is the density of just graphene layers of CNTs.
2.1. Carbon nanotubes: Discovery, structure, properties 13 metallic or semiconducting, which is mainly due to different chiral configurations of CNTs.
In the early 1990s such a dependence of conductivity on the chirality and diameter of the
CNTs was theoretically predicted by several groups [HSO92, SFD+92a, SFD+92b]. By the
end of the decade the theoretical predictions were confirmed also experimentally
[WVR+98, OHK+98].
The impact of the CNTs structure on the electrical properties can be understood within
zone-folding approach [RTM04], where the nanotube bands are obtained by cutting the
graphene ones according to the allowed wavevectors. In general, electrical conductivity of a
graphene sheet arises from its hexagonal structure. As it was mentioned above, carbon
atoms in honeycomb lattice exhibit sp2 hybridization, thus along with a strong σ-bond, a
weak π bond is present in the z axis perpendicular to the xy plane (Fig. 2.2c). The free
electrons in the π orbital move within the formed cloud and are no longer local to a single
carbon atom (delocalized), thus, endow the graphene with conductivity. In terms of band
theory, every unit cell of the graphene layer has two π electrons (from carbon atoms A and
B, Fig. 2.6a), which results in appearance of the π valence and π* conduction band in the
electronic band structure [W47, RTM04]. These bands touch each other only at K points in
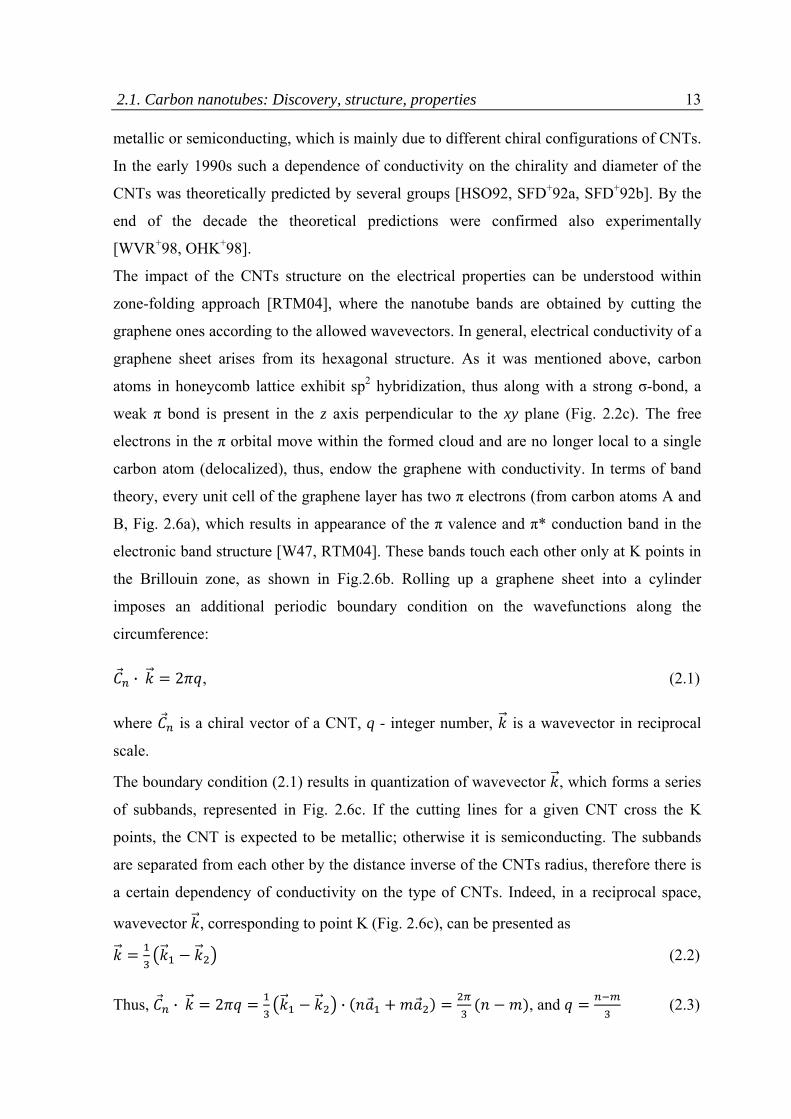
the Brillouin zone, as shown in Fig.2.6b. Rolling up a graphene sheet into a cylinder
imposes an additional periodic boundary condition on the wavefunctions along the
circumference:
· 2 , (2.1)
where is a chiral vector of a CNT, q - integer number, is a wavevector in reciprocal
scale.
The boundary condition (2.1) results in quantization of wavevector , which forms a series
of subbands, represented in Fig. 2.6c. If the cutting lines for a given CNT cross the K
points, the CNT is expected to be metallic; otherwise it is semiconducting. The subbands
are separated from each other by the distance inverse of the CNTs radius, therefore there is
a certain dependency of conductivity on the type of CNTs. Indeed, in a reciprocal space,
wavevector , corresponding to point K (Fig. 2.6c), can be presented as
(2.2)
Thus, · 2 · , and (2.3)

14 Chapter 2. Background (it is taken into account that · 2 ).
That is, CNT is metallic or semiconducting, depending on whether is a multiple of
3 or not [RTM04]. For example, all armchair tubes ( ) are always metallic.
Figure 2.6: (a) The lattice structure of graphene: two atoms per unit cell are labeled A and B (copied from [IM10]). (b) Electronic band structure of graphene. The Fermi level is set to zero. The π valence and π* conduction bands cross at K point of a Brillouin zone (copied from [O06a]). (c) Allowed k lines of a nanotube in a Brillouin zone of graphene (copied from [RTM04]).
However, the consideration of CNTs’ bands as just by cutting the graphene bands is not
completely correct; we should not neglect the curvature of the CNTs, due to which the
rehybridization of π and σ- orbitals occurs, which in its turn lead to a significant change of
electronic band structure [BBS+94, SFD+92a]. The effect of curvature becomes particularly
strong for small-diameter nanotubes. For example, the (5,0) tube is metallic in contrast to
what is expected from zone folding approach [MRT+02].
2.1. Carbon nanotubes: Discovery, structure, properties 15 MWCNTs, composed of several concentric single walled tubes, where each individual tube
can have different chirality, are as a rule semiconductive [RTM04].
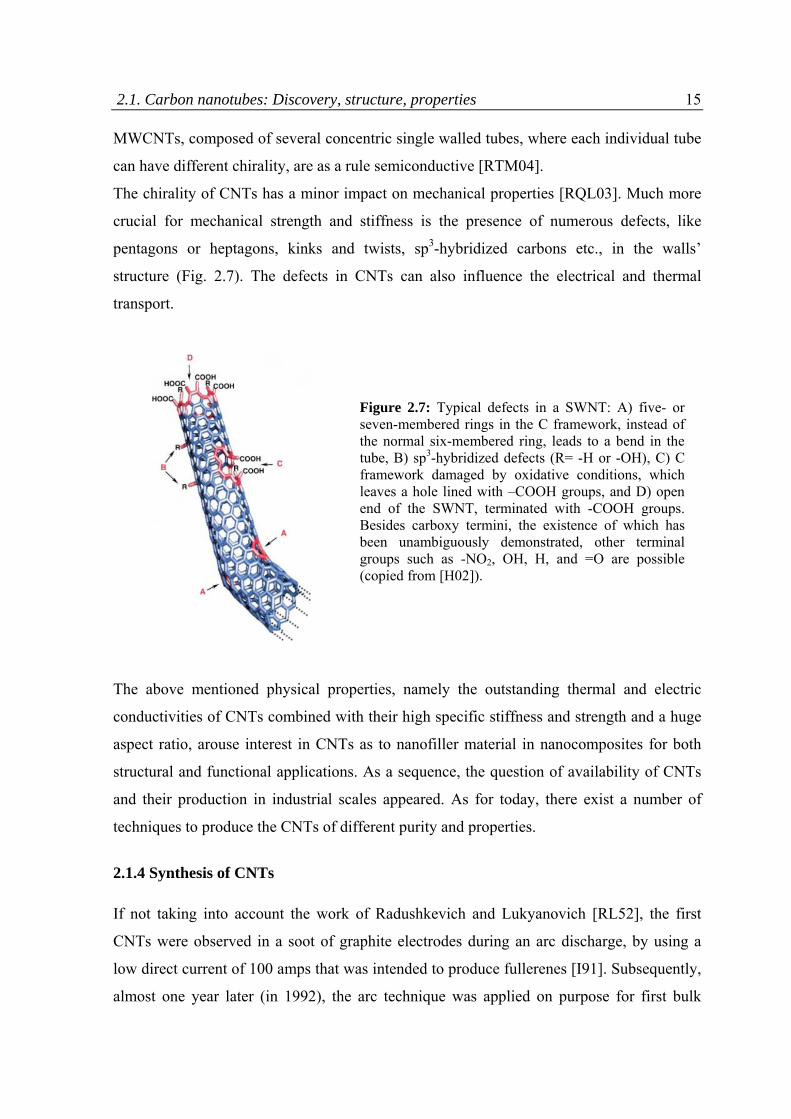
The chirality of CNTs has a minor impact on mechanical properties [RQL03]. Much more
crucial for mechanical strength and stiffness is the presence of numerous defects, like
pentagons or heptagons, kinks and twists, sp3-hybridized carbons etc., in the walls’
structure (Fig. 2.7). The defects in CNTs can also influence the electrical and thermal
transport.
Figure 2.7: Typical defects in a SWNT: A) five- or seven-membered rings in the C framework, instead of the normal six-membered ring, leads to a bend in the tube, B) sp3-hybridized defects (R= -H or -OH), C) C framework damaged by oxidative conditions, which leaves a hole lined with –COOH groups, and D) open end of the SWNT, terminated with -COOH groups. Besides carboxy termini, the existence of which has been unambiguously demonstrated, other terminal groups such as -NO2, OH, H, and =O are possible (copied from [H02]).
The above mentioned physical properties, namely the outstanding thermal and electric
conductivities of CNTs combined with their high specific stiffness and strength and a huge
aspect ratio, arouse interest in CNTs as to nanofiller material in nanocomposites for both
structural and functional applications. As a sequence, the question of availability of CNTs
and their production in industrial scales appeared. As for today, there exist a number of
techniques to produce the CNTs of different purity and properties.
2.1.4 Synthesis of CNTs
If not taking into account the work of Radushkevich and Lukyanovich [RL52], the first
CNTs were observed in a soot of graphite electrodes during an arc discharge, by using a
low direct current of 100 amps that was intended to produce fullerenes [I91]. Subsequently,
almost one year later (in 1992), the arc technique was applied on purpose for first bulk
16 Chapter 2. Background synthesis of CNTs by Ebbesen and Ajayan [EA92]. Thus, an arc discharge process, based
on sublimation of carbon from the negative electrode under high discharge temperature,
was historically the first one in CNTs’ production. By using this method, both SW and MW
CNTs can be produced with the yield of up to 30 wt.%. The much higher yield (70 wt.%) is
obtained by laser ablation, when a pulsed laser vaporizes a graphite target under flowing
atmosphere and high temperature [GNT+95]. Laser ablation produces primarily SWCNTs
with a controllable diameter determined by the reaction temperature. However, this method
is quite expensive. Among other CNTs’ production methods, one should mention a high
pressure carbon monoxide process (HiPCO). It allows to grow very thin (diameter of ca.
0.7 nm) SWCNTs in a gas-phase with carbon monoxide as a carbon source at high
temperature and pressure [NBB+99]. Nevertheless, the most widely used method is
chemical vapor deposition (CVD), which is appropriate for large-scale production of CNTs.
For example, Bayer, one of the biggest suppliers of the CNTs, both SW and MW, uses this
technique. CVD is a well established process, in which a carbon-containing gas is broken
down, freeing the carbon atoms to reform as nanotubes in a presence of a metal catalyst
[TFR+11]. This method is the most promising one for industrial-scale deposition, because
of its low price, high yield (up to 100 %) and capability of growing CNTs directly on a
desired substrate. However, such problems of CVD method like limited control of the
structure and CNTs’ diameters and presence of residual metal catalyst in CNTs’ framework
should be still resolved.
We know now why CNTs are so unique and attractive and learned the ways the CNTs are
produced. Let us see how the unique combination of the physical properties of CNTs could
be transferred onto larger scales, macroscopic materials, which in their turn could find a
direct application in our everyday life. The following subchapter is devoted to
nanocomposites of CNTs and polymers and to the keyword parameters that determine a
successful CNT/polymer nanocomposite.
2.2. CNT/polymer nanocomposites 17
2.2 CNT/polymer nanocomposites: Ways to manipulate the
CNTs for their improved dispersion in the matrix
In general, the importance of polymer composite technology utilizing nanosized filler
material, as determined by Wagner, comes from providing value-added properties not
present in the neat matrix, without sacrificing the matrix’s inherent processibility and
mechanical properties, or by adding excessive weight [WV04].
What exactly makes CNTs to be attractive as a filler material for nanocomposite
applications? To answer this question, let us first understand which properties of filler
particles are advantageous in the view of the best performance of the nanocomposite in
comparison to traditional composites containing micro- and macro-particles.
First of all, size of the filler material influences significantly on composite performance. To
demonstrate the benefit of nanosized particles, Wetzel gave a clear and intuitive illustration
[WHF+02]: For a constant filler content of 3 vol.% of TiO2, within a volume of 50000 µm3,
for example, one finds 2.8 particles with the diameter of 10 µm and a specific surface area
of 0.15 m2/g. In the case of 1 µm large particles, 2860 particles are found, possessing a
surface area of 1.5 m2/g. For a nanocomposite containing 100-nm-diameter particles, the
particle number increases finally to 2.8 million and the surface area to 15 m2/g. Thus, the
smaller particles are used, the larger is the contact area between the filler material and the
matrix, and thus, the more efficient transfer of the properties from fillers to the matrix is
expected.
Also, geometry of the particles is of importance. Thus, for example, aspect ratio of the
nanofillers plays an essential role for reinforcing of the nanocomposite material: When the
aspect ratio is low, impact properties are enhanced by smaller particles, because the larger
ones can act as crack initiation sites; at the same time, high aspect ratio particles are able to
induce large stress concentrations near their edges, and this leads to improved stiffness of
the material [RPM92]. Also, for high aspect ratio particles the percolation threshold is low,
which is advantageous for efficient enhancement of electrical and thermal conductivities of
the nanocomposite.
Certainly, along with geometrical parameters of the fillers, their physical properties, as for
example mechanical, electrical, thermal, etc., should be valuable for the potential
improvement of the matrix characteristics. For this, again, nano-sized particles have an

18 Chapter 2. Background
advantage over micro- and micro-fillers, since many characteristics of the material become
pronounced only when a nanometer scale is reached.
Being light, nanosized 1D particles, with a high aspect ratio and outstanding combination
of physical properties (see Chapter 2.1.2-2.1.3), CNTs, therefore, have a great advantage
over other nanofiller materials. Indeed, potential application of CNTs/polymer
nanocomposites covers a large range of different fields, beginning from electronics and
ending with biomedicine [ESA08, SA08, BSL+08, MZ07]. Endo et al. for instance
presented the smallest working composite gear which was prepared by mixing CNTs into a
molten nylon and then injecting into a tiny mold. The resulted gear, in spite of its tiny
diameter comparable to the one of a human hair, exhibits a high mechanical strength, high
abrasion resistance, and good electrical and thermal conductivities [EHK06]. Someya et al.
demonstrated the possibility to obtain a highly stretchable and conductive SWCNT/polymer
nanocomposite: no mechanical or electrical damage is observed upon uniaxial or biaxial
stretching of the composite material up to 70 % [SNH+08]. Such an elastic conductor
allows construction of electronic integrated circuits, which can be mounted anywhere,
including arbitrary curved surfaces and movable parts, such as the joints of a robot’s arm.
This is also an important step toward production of “intelligent”, highly sensitive artificial
skin. A number of other applications of various CNT/polymer nanocomposites as sensors
or in biomedicine or aerospace fields can be found in literature, as for example in the
review by Mittal [M10].
Nevertheless, despite the huge interest and promising perspectives in the field of
CNT/polymer nanocomposites, in practice, the optimal utilization of CNTs as nanofillers,
when the properties of CNTs are fully preserved and maximally transferred to the polymer
matrix, is rarely realized. The matter is that performance of the nanocomposite significantly
depends on the distribution of the fillers within the matrix: only in the case of homogeneous
dispersion the insufficiency generated by the heterogeneity of the nanocomposite system
can be avoided, and thus, the unique nanocomposite features become efficient [RZZ+01,
R86]. The deagglomeration of the CNTs, at the same time, is known to be challenging: The
structure of CNTs not only endows them with outstanding combination of physical
properties, but makes them very hydrophobic, with a very smooth and chemically inert
surface. The van der Waals attraction between the tubes’ walls like between the graphene
sheets in the structure of the graphite is very efficient. In solvents or polymer matrix the
CNTs form large clusters and agglomerates; being agglomerated, the CNTs not only induce
2.2. CNT/polymer nanocomposites 19 the insufficiency in the nanocomposite, but they also lose their 1D properties. As a result,
the clusters of CNTs behave differently compared to the individual ones. For example,
Song et al. investigated the influence of the dispersion state of CNTs on the electrical,
thermal and mechanical properties of the epoxy nanocomposites [SY05] and concluded that
the different dispersion state of the CNTs strongly reflects on the properties of the
nanocomposite. The nanocomposites containing the poorly dispersed CNTs exhibited
higher storage modulus, loss modulus, and complex viscosity than the ones with the well
dispersed CNTs. Thus, the poorly dispersed CNTs composites have, from a rheological
point of view, a more solid-like behavior. On contrary, significantly improved tensile
strength and elongation at break were measured in the case of good CNTs’ dispersion.
Also, the nanocomposites filled with the well dispersed CNTs yield much higher electrical
and thermal conductivity than the ones embedded with the poorly dispersed CNTs because
the well dispersed CNTs can provide conductive paths efficiently even at lower loading.
Thus, the way the CNTs are distributed within a supporting medium, is indeed crucial for
the fabrication of composites with improved and well defined properties, and certain
conditions for composite preparation should be applied.
In order to overcome van der Waals attraction between CNTs and to disperse them within
the matrix individually and homogeneously, a number of approaches for the fabrication of
CNT/polymer composites have been suggested [CKB+06]. The most important and widely
used ones are:
1) Melt processing of bulk composites: This method involves the melting of the
polymers to form viscous liquids to which CNTs can be added and mixed.
Therefore, melt processing is suitable for polymers that are insoluble in any solvent,
like thermoplastic polymers [CKB+06, SKB06, ZRC+06].
2) Melt processing of composite fibers: CNTs are added to the melts of the polymers,
followed by the formation of CNT/polymer fibers through e.g. the melt-spinning
process [CKB+06, FBS+06].
3) Solution processing of composites: The most common method based on the co-
mixing of the dispersed CNTs (usually modified) and a dissolved polymer in a
suitable solvent before evaporating the solvent to form a composite film. The
dispersion of components in a solvent, mixing, and evaporation are often supported
by mechanical agitation (e.g. ultrasonication, magnetic stirring, shear mixing)
[CKB+06, SAG02, QDA+00].
20 Chapter 2. Background
4) Composites based on thermosets: A thermoset polymer is one that does not melt
when heated such as epoxy resins. The composite in this case is formed from the
mixture of a monomer (usually liquid) and CNTs, which is cured with
crosslinking/catalyzing agents [MLK+06, KSK+06].
5) In-situ polymerization: The polymer macromolecules are directly grafted onto the
walls of CNTs. This technique is often used for insoluble and thermally unstable
polymers which cannot be melt processed. Polymerization occurs directly on the
surface of CNTs [M05, OC06].
Thus, the dispersion of CNTs in composite material broadly falls into two main categories:
mechanical and chemical methods. The mechanical techniques involve physical separation
of the tubes from each other, like high shear mixing or melt processing technologies. The
chemical methods often involve surfactant or chemical treatment of the tube surface, or
polymerization processes in presence of CNTs.
For industrial scale processing, the producing CNT/polymer composites by mixing CNTs
with thermoplastic polymers in the melt state, followed by extrusion or injection molding to
fabricate artifacts in the required form is a more practical and attractive method compared
to chemical ways, which are usually limited to a small number of polymer systems, more
expensive, and laborious. However, the mechanical performance of CNT/polymer
composites often results in insufficient (poor) dispersion and weak interactions between
CNTs and the surrounding matrix [MPH+05, CJK+05]. Thus, for example, when purified
MWCNTs were mixed and dispersed ultrasonically in epoxy resins for the first time by
Schadler et al. [SGA98], Raman response to tension and compression showed poor load
transfer behavior especially under tension. Numerous attempts have been made to improve
the dispersion of CNTs in polymers in melt state. It was shown, for instance, that the
dispersion level can be controlled by shear rates during extrusion [LS07]. SEM and optical
micrographs confirm a significant improvement of the dispersion of pristine MWCNTs in
poly(styrene-b-butadiene-co-butilene-b-styrene) matrix upon increasing the exerted shear
rate from 300 rpm to 1000 rpm, and a homogeneous dispersion was successfully achieved
by using a screw rotation speed of 2000 rpm. Also, the strain-stress behavior was found to
be different for the composites prepared under different shear rates even with the same
MWCNTs loading contents. Thus, a higher screw rotation speed results in better CNT
dispersion in the matrix, leading to improved mechanical properties.
2.2. CNT/polymer nanocomposites 21 However, despite the fact that the dispersion of CNTs within the matrix can be improved by
mechanical processing, still the problem of the weak interactions between CNTs and the
surrounding matrix is actual. Without chemically bonding, load transfer between the CNTs
and the matrix (i.e., across the CNTs/polymer interfaces) due to the atomically smooth
nonreactive CNTs surfaces mainly comes from electrostatic and van der Waals interactions
[LL01], which is not strong enough. As a result, in case of nanocomposites with native
CNTs, nanotubes are typically pulled out from the matrix, rather than fractured and play a
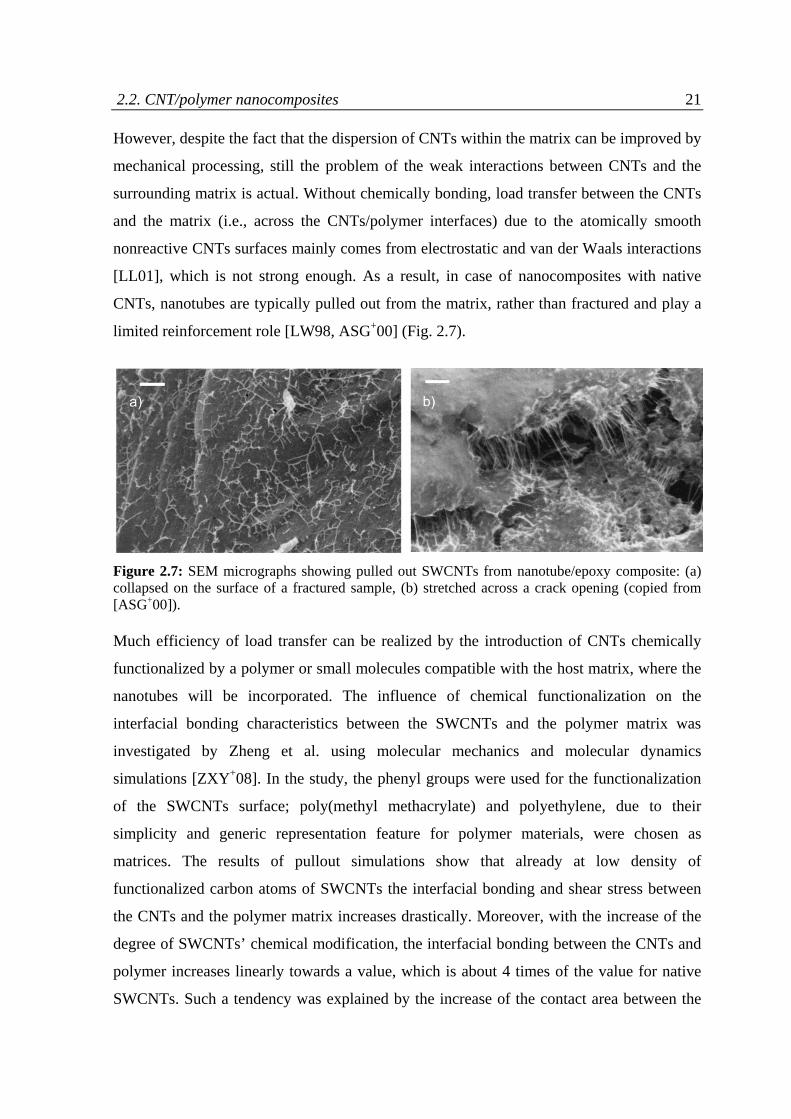
limited reinforcement role [LW98, ASG+00] (Fig. 2.7).
Figure 2.7: SEM micrographs showing pulled out SWCNTs from nanotube/epoxy composite: (a) collapsed on the surface of a fractured sample, (b) stretched across a crack opening (copied from [ASG+00]).
Much efficiency of load transfer can be realized by the introduction of CNTs chemically
functionalized by a polymer or small molecules compatible with the host matrix, where the
nanotubes will be incorporated. The influence of chemical functionalization on the
interfacial bonding characteristics between the SWCNTs and the polymer matrix was
investigated by Zheng et al. using molecular mechanics and molecular dynamics
simulations [ZXY+08]. In the study, the phenyl groups were used for the functionalization
of the SWCNTs surface; poly(methyl methacrylate) and polyethylene, due to their
simplicity and generic representation feature for polymer materials, were chosen as
matrices. The results of pullout simulations show that already at low density of
functionalized carbon atoms of SWCNTs the interfacial bonding and shear stress between
the CNTs and the polymer matrix increases drastically. Moreover, with the increase of the
degree of SWCNTs’ chemical modification, the interfacial bonding between the CNTs and
polymer increases linearly towards a value, which is about 4 times of the value for native
SWCNTs. Such a tendency was explained by the increase of the contact area between the
22 Chapter 2. Background
CNT and polymer matrix with the increase of functionalizaion level. Also, the shear stress
of CNT-polymer interface with weak non-bonded interactions can be increased by about
1000 % with the introduction of a relatively low density ( 5 %) of chemical attachment.
However, the shear stress was found to increase further only weakly with the introduction
of a higher level of functionalization ( 5 %). This was explained by the fact that though
the shear stress could be efficiently increased by successful embedding of the functional
groups into the polymer matrix, which can happen already at a low density of
functionalization, at rather high level of functionalization, some functional groups may only
contact with the other functional groups, and thus, the effective contact surface area
between the functional groups and the polymer matrix couldn’t be strongly increased any
more. This results in a weak increase of the shear stress at higher level of functionalization
( 5 %).
Although the covalent attachments of functional groups onto the surface of the CNTs can
improve significantly the load transfer with the polymer matrix, one might argue that the
functionalization itself might introduce defects to the framework of the CNTs, which can
lower the strength of the nanotube filler. However, some models predict that the change in
the mechanical properties of the CNTs with low level of functionalization ( 10 %) is
negligible [FCB+02]; and a high degree of sidewall functionalization can degrade the
mechanical strength of SWCNTs by only 15 % [GS98].
The enhanced compatibility between the CNTs and the matrix by means of chemical
modification of the CNTs and the effect of functionalization of CNTs on the improvement
of physical (specifically, mechanical and electrical) properties of nanocomposites was
demonstrated experimentally in numerous publications [ZKP+03, WPG05, VSM+03,
CR11]. For example, Zhu et al. showed that the epoxy composites with 1 wt.%
functionalized SWCNTs had a tension strength of 95 MPa and a Young’s modulus of 2632
MPa, showing 18 and 24 % improvements over the epoxy composites with native
SWCNTs, respectively. Improvement of both mechanical and electrical properties of
poly(styrene-co-acrylonitrile) (SAN) by the addition of only 1 wt.% of SAN-grafted
MWCNTs was demonstrated by Choi et al. [CR10]. Very recently, the same group showed
that SAN-modified MWCNTs can even significantly change the physical properties of the
composite of a different polymer, namely of polycarbonate [CR11]. This was attributed to
the enhanced interfacial behavior and better dispersion of MWCNTs in the matrix due to
2.2. CNT/polymer nanocomposites 23 the good miscibility between SAN and polycarbonate. Similarly, Wang et al. prepared SAN
composites containing PMMA-grafted MWCNTs by solution casting from THF [WPG05].
The storage modulus of SAN was increased by up to 90 % upon the addition of PMMA-
grafted MWCNTs with an effective MWCNTs content of 1 wt.%. Also, as compared to
pristine MWCNTs, PMMA-grafted MWCNTs were much more effective in reinforcing
SAN as their dispersion is improved. Significance of the CNTs’ chemical modification
prior their introduction into a host matrix is demonstrated by a number of other examples.
The main message of this subchapter is that the optimal enhancement in the properties of
the CNT/polymer composites can be achieved only if at least several key issues, like
improved CNTs’ dispersion and functionalization of the CNTs’ surface for good adhesion
to the matrix, are resolved. Often, alignment of the nanoparticles within the matrix has also
a significant impact on the nanocomposite properties. This will be discussed in Chapter 7.
In the next chapter we will focus on different methods applied for the surface modification
and/or functionalization of CNTs.
2.3 General approaches for functionalization of carbon
nanotubes
As discussed in the previous section, properties of CNT/polymer nanocomposites are
strongly dependent on the homogeneity of CNTs’ dispersion within matrix. Mechanical
dispersion via extrusion or shear mixing, though fast and nonlaborious, is not very effective
and costly. More elegant and promising are the chemical ways to disperse the CNTs, where
the modification of CNTs with chemical additives is applied. Since in this case the most
common method for CNT/polymer nanocomposite preparation is solution processing, when
both components are separately dissolved in a common solvent, followed by co-mixing and
solution casting, the modification of CNTs pursues two main objects: (i) homogeneous and
stable dispersability of CNTs in solvents, and (ii) good compatibility of them within the
polymer matrix. In this chapter the most common methods of CNTs modification will be
discussed, I will point out on their advantages and disadvantages, and analyze which kind
of modification is the most promising one for the optimal introduction of the modified
CNTs into polymer matrices.
24 Chapter 2. Background Generally, two main approaches for the functionalization of CNTs in order to improve their
surface properties are (i) noncovalent modification, i.e. wrapping and physisorption, and (ii)
covalent, or chemical, attachments.
2.3.1 Noncovalent modification
Typical noncovalent modification includes the encapsulation of CNTs by supramolecular
systems of small molecules like surfactants [ASB+99, OBH+02, MRL+03], or by rigid,
conjugated macromolecules [CSA+05, PÄL+05, WH04, HCS+06], or wrapping by polymers
[CLW+02, KHG+04, SS02, SLG+03, SSN+02, YRS05, SSH+02, ZOA+04, NAK+05].
Surfactants, such as sodium dodecyl sulfate, sodium dodecylbenzenesulfonate, triton and
others, have been widely used to prepare stable CNTs suspensions in water since the report
of Abatemarco and coworkers [ASB+99]. Dispersion in this case mainly occurs due to
hydrophobic/hydrophilic interactions, in which the hydrophobic tail of the surfactant
molecule adsorbs on the surface of CNT bundles, while the hydrophilic head associates
with water molecules for dissolution [IBJ+03, ZIW+04, MSH+03, CZW+01, MRL+03,
SMM+03, BNR+02, YMK04, WZH+04]. As a result of such surfactant molecule
organization, CNTs appear to be either encapsulated within cylindrical micelles [OBE+01],
or covered with hemispherical micelles [IRB+03] or by randomly adsorbed molecules
[YMK04]. However, there is still a lack of experimental evidence supporting this or that
scenario of surfactant adsorption onto the CNTs’ walls. Computer simulations suggest that
the microstructure of the surfactant adsorption significantly depends on the surfactant
concentration, especially at low concentrations [AB08].
In spite of high efficiency of surfactants to form stable dispersions of CNTs in water, there
is a serious disadvantage to utilize surfactant-modified CNTs as filler material in
nanocomposites, namely the insulating behavior of surfactant molecules. The double
dielectric layer formed around the CNT hinders drastically the electrical properties of the
CNTs. For example, presence of surfactants with the 5:1 weight ratio to the amount of
CNTs leads to a significant loss in electrical conductivity (up to 2 orders) compared to the
native CNTs [TSC+10]. Moreover, studies of Geng et al. [GKS+07, GLK+08] showed that
although the surfactant molecules can be washed away to some extent from the
nanocomposite material, it is not possible to remove surfactant completely, and some
2.3. General approaches for functionalization of CNTs 25 remains in the matrix, mainly between the CNT junctions. This degrades the performance
of the composite. Thus, use of surfactants as dispersion agents is questionable.
Another type of physical adsorption of small organic molecules, theoretically predicted by
Zhao et al., occurs due to π-π interactions [ZLH+03], i.e. coupling of π-electrons between
tubes and aromatic molecules. It was shown that this kind of interaction, being much
stronger than weak hydrophobic/hydrophilic stabilization by surfactants, might result in the
modification of the electronic and transport properties of SWCNTs. The π-π interactions
between small aromatic molecules like anthracene and naphthalene and SWNTs were
experimentally confirmed by Star and Rajendra [SHG+03] and Rajendra et al. [RBR+04].
The π-stacking interactions were considered responsible also for the dissolution of CNTs in
water in presence of a rigid, planar and conjugated diazo dye, Congo red (CR) [HCS+06].
Whereas purified CNTs were totally insoluble in water, SWCNTs in presence of CR could
be dissolved in water by vigorous shaking producing a homogeneous black solution. The
maximum solubility was found to be 3.5 mg/mL; the minimum mass ratio of CR to CNTs
that ensures the complete dissolution of SWCNTs is 5:1. It was assumed that CR might be
attached parallel to the sidewall of SWCNTs via π-stacking, forming a large
supramolecular system. The adsorption of CR on SWCNTs not only prevents the
rebundling of SWCNTs via electrostatic interaction, but also supports the stable dispersion
by the solvation of charged groups. The complete elimination of free CR from the mixture
by filtration hardly changed this excellent solubility. However, the complexes of CNTs and
CR lose their solubility completely when dried, presumably due to the π-coupling between
adsorbed CR on SWCNTs. This resembles the slow dissolution of
poly(aryleneethynylene)s (PPE)-SWNTs bucky paper in chloroform [CLW+02]. The
difference between the solubility of dried SWCNTs/CR and SWCNTs/PPE, i.e. the
complete solubility loss of dried SWCNTs/CR and the slow but still existing dissolution of
dried SWCNTs/PPE, authors explained with the different structures of CR and PPE:
Whereas small CR molecules adsorbed on the sidewall of SWCNTs are unable to
effectively separate the adjacent nanotubes from each other and the rebundling of
SWCNTs/CR resembles that of unmodified SWCNTs, PPE can effectively separate
SWCNTs by their long alkyl chains and avoid the direct rebundling of the CNTs [HCS+06].
This example demonstrates the main advantage of using long polymer chains for dispersion
of CNTs rather than small molecules. Also, compared to surfactants, the polymers are
advantageous in terms of further use of the modified CNTs for nanocomposites, where the
26 Chapter 2. Background polymer wraps could improve significantly the compatibility of the CNTs with the matrix.
That is why the noncovalent modification of CNTs with polymers, based on the affinity of
the polymer chains containing aromatic rings in their structure to the surface of pristine
CNTs, became preferential among the other noncovalent modifications of the CNTs.
For the first time a stabilization of the aqueous CNTs dispersions by polystyrene sulfonate
and polyvinylpyrrolidone was shown by the group of O’Cornelly [OBE+01]. Affinity of
bare PS chains to CNTs framework was also found to be robust enough to stabilize the
debundled MWCNTs in solution after vigorous sonication [ZLF+08]. It is worth to mention
a method of noncovalent modification of CNTs suggested by Park et al., that differs from
traditional solution mixing, namely functionaliation of CNTs with PS via emulsion
polymerization [PPK+07]. The process, utilizing a nonionic surfactant (sodium dodecyl
sulfate, SDS) and cationic coupling agent, produces an interesting morphology of PS on
nanotubes consisting of bead-string shaped PS-functionalized MWCNTs or MWCNT-
embedded polymeric particles, when polymer beads are sufficiently large. However, the
study of electrical properties of MWCNTs/PS composites prepared by latex technology
demonstrates that adsorbed SDS molecules, necessary in large amount for successful
emulsion polymerization, blocks off the charge transport through the MWCNTs network
[YLS+07].
Block copolymer systems, such as for example polystyrene-g-(glycidyl methacrylate-co-
styrene) [LZH+06] or poly(styrene-b-isoprene) (P(S-b-I)) [SHM+06], are also widely
utilized for noncovalent modification of CNTs. Similar to the case of homopolymers, the
strategy is based on the affinity of the PS chain to the hydrophobic surface of pristine
CNTs; the second block, in its turn, depending on its chemical nature provides the
solubility of the exfoliated CNTs in a variety of polar and nonpolar organic solvents by
forming a steric barrier or repulsion interaction between polymer-wrapped nanotubes.
Interestingly, Sluzarenko et al. [SHM+06] noted that the direct interaction between the
CNTs and the different blocks is not the most important parameter for stabilization. The
driving force was shown to be the selectivity of the solvent toward the block copolymer and
the degree of polymerization of individual blocks in block copolymer structure. Thus, it
was found for instance that effective stabilization of CNTs with P(S-b-I) diblock copolymer
is obtained when the solvent is good for the largest block; the insoluble one incorporates
the MWCNTs into the core of a hybrid self-assembled micelle. Nevertheless, in most cases
the structure of polymer is a crucial parameter for successful noncovalent modification of
2.3. General approaches for functionalization of CNTs 27 CNTs. With use of molecular dynamic simulations, the intermolecular interaction energies
between CNTs and polymer chains of comparable molecular weight but different monomer
structure, are found to differ by up to a factor of 4 [YKZ05]. The strongest CNT/polymer
interactions were found for conjugated polymers with aromatic rings on the polymer
backbone. Effective coupling between the π-systems of CNTs and conjugating polymers
like polyaniline was experimentally confirmed by several groups [SLM+77, SG02]. Also,
Zou et al. [ZLC+08] demonstrated a generic approach for dispersing both SWCNTs and
MWCNTs using poly(3-hexylthiophene)-b-polystyrene (P3HT-b-PS) conjugated block
copolymers. While the P3HT segment in P3HT-b-PS block copolymer forms a close
contact and interaction with exfoliated CNTs, the PS block was shown to act as protective
and functional layer to provide the CNT with a good solubility and miscibility.
Though physical adsorption or wrapping of the CNTs with polymers or small molecules
minimizes the damage of the intrinsic structure of CNTs, the adhesive energy between the
polymers and the CNTs is not high enough to transfer stress between them [DEF+03].
Therefore, chemical modification, when the chemical additives are covalently bound to the
CNTs surface, becomes the most adaptable pathway to improve the dispersion ability of
CNTs.
2.3.2 Covalent modification
We have already seen that the carbon atoms that comprise the CNTs exhibit sp2
hybridization. Chemical, or covalent, modification of CNTs implies covalent grafting of the
chemical additives onto the CNTs framework with the conversion of sp2 hybridization state
of carbons into sp3. But it is generally accepted that CNTs, as aromatic macromolecules, are
rather chemically inert. Therefore, first of all we need to answer the questions: Are the
CNTs reactive? What kind of chemistry is possible on their framework? How does the
reactivity depend on the type of the CNTs?
All the physical properties of the CNTs are due to their unique structure: the honeycomb
lattice of carbon atoms rolled in a cylinder; the same concerns their chemical properties.
Honeycomb arrangement of carbon atoms, however, is characteristic not only for CNTs but
also for the other two allotropic forms of carbon: fullerenes and graphene. Yet, the
chemical properties are not the same. For example, whereas fullerenes are known to exhibit
quite a high reactivity towards a wide spectrum of molecules [TW93], graphene is almost
chemically inert. The main difference between these two structures is their curvature which
28 Chapter 2. Background influences on the state of the double bonds between the conjugated carbon atoms: graphene
is a plane defect-free honeycomb lattice, whereas fullerenes with the incorporated 5- and 7-
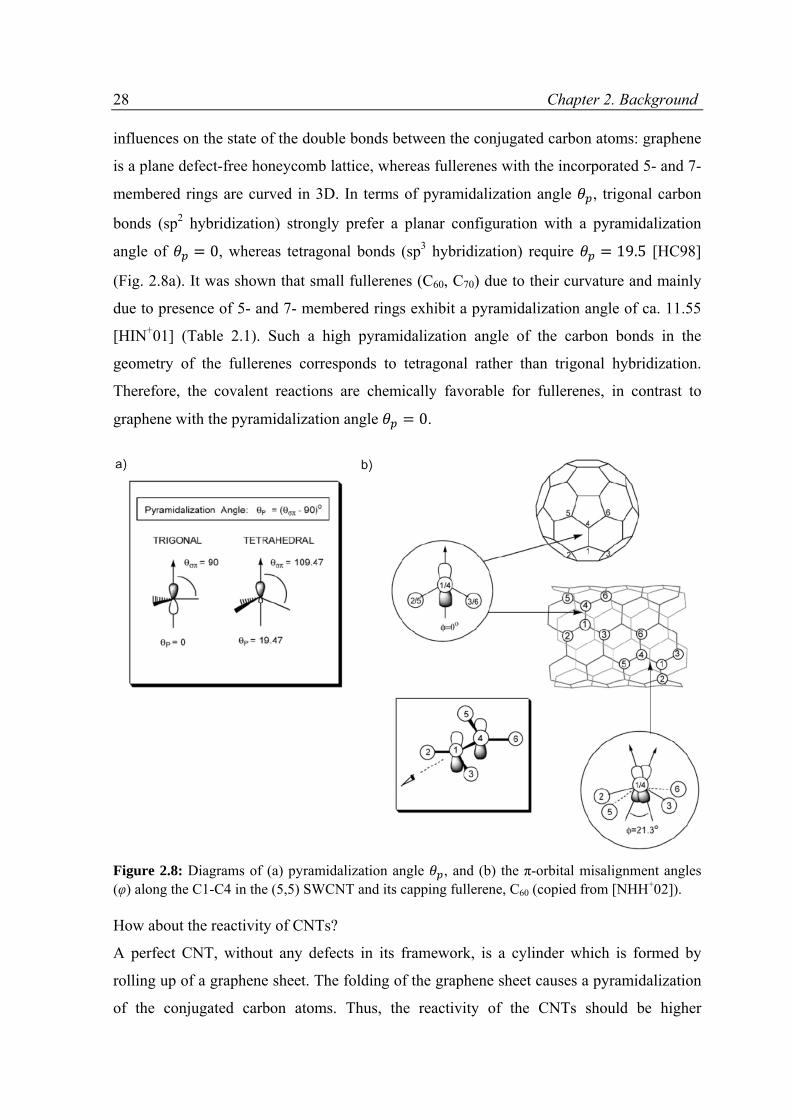
membered rings are curved in 3D. In terms of pyramidalization angle , trigonal carbon
bonds (sp2 hybridization) strongly prefer a planar configuration with a pyramidalization
angle of 0, whereas tetragonal bonds (sp3 hybridization) require 19.5 [HC98]
(Fig. 2.8a). It was shown that small fullerenes (C60, C70) due to their curvature and mainly
due to presence of 5- and 7- membered rings exhibit a pyramidalization angle of ca. 11.55
[HIN+01] (Table 2.1). Such a high pyramidalization angle of the carbon bonds in the
geometry of the fullerenes corresponds to tetragonal rather than trigonal hybridization.
Therefore, the covalent reactions are chemically favorable for fullerenes, in contrast to
graphene with the pyramidalization angle 0.
Figure 2.8: Diagrams of (a) pyramidalization angle , and (b) the π-orbital misalignment angles (φ) along the C1-C4 in the (5,5) SWCNT and its capping fullerene, C60 (copied from [NHH+02]).
How about the reactivity of CNTs?
A perfect CNT, without any defects in its framework, is a cylinder which is formed by
rolling up of a graphene sheet. The folding of the graphene sheet causes a pyramidalization
of the conjugated carbon atoms. Thus, the reactivity of the CNTs should be higher
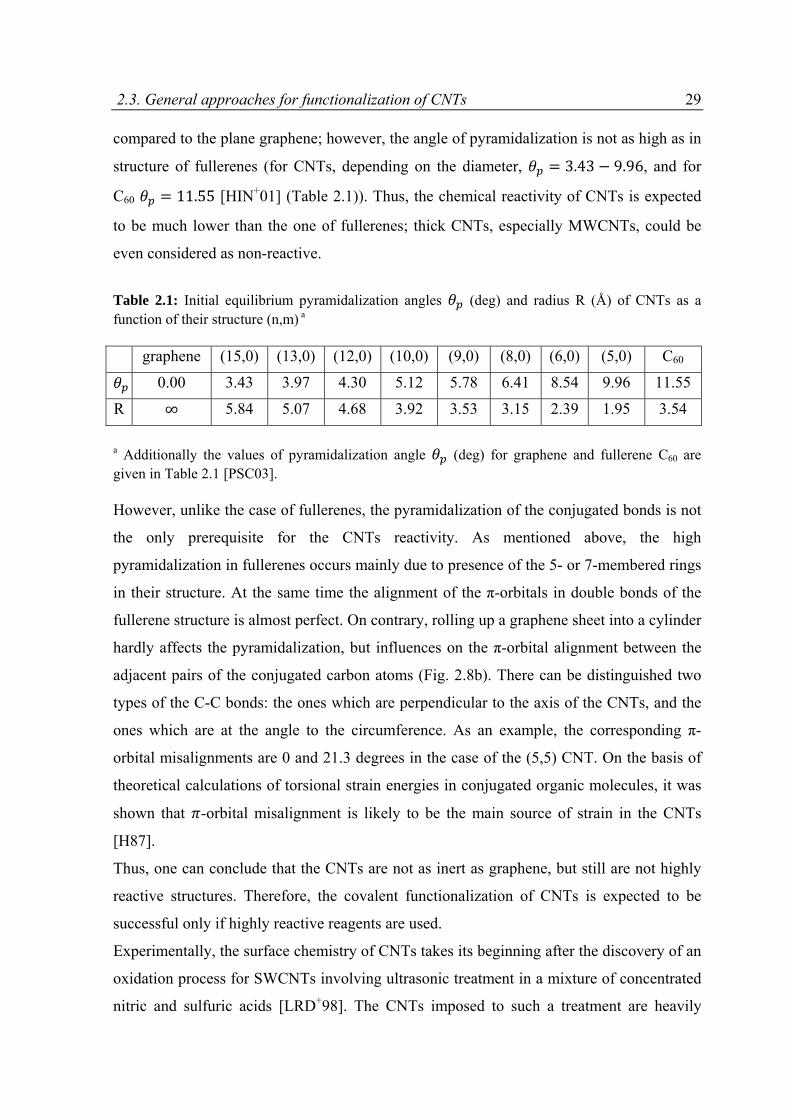
2.3. General approaches for functionalization of CNTs 29 compared to the plane graphene; however, the angle of pyramidalization is not as high as in
structure of fullerenes (for CNTs, depending on the diameter, 3.43 9.96, and for
C60 11.55 [HIN+01] (Table 2.1)). Thus, the chemical reactivity of CNTs is expected
to be much lower than the one of fullerenes; thick CNTs, especially MWCNTs, could be
even considered as non-reactive.
Table 2.1: Initial equilibrium pyramidalization angles (deg) and radius R (Å) of CNTs as a function of their structure (n,m) a
graphene (15,0) (13,0) (12,0) (10,0) (9,0) (8,0) (6,0) (5,0) C60
0.00 3.43 3.97 4.30 5.12 5.78 6.41 8.54 9.96 11.55
R ∞ 5.84 5.07 4.68 3.92 3.53 3.15 2.39 1.95 3.54
a Additionally the values of pyramidalization angle (deg) for graphene and fullerene C60 are given in Table 2.1 [PSC03].
However, unlike the case of fullerenes, the pyramidalization of the conjugated bonds is not
the only prerequisite for the CNTs reactivity. As mentioned above, the high
pyramidalization in fullerenes occurs mainly due to presence of the 5- or 7-membered rings
in their structure. At the same time the alignment of the π-orbitals in double bonds of the
fullerene structure is almost perfect. On contrary, rolling up a graphene sheet into a cylinder
hardly affects the pyramidalization, but influences on the π-orbital alignment between the
adjacent pairs of the conjugated carbon atoms (Fig. 2.8b). There can be distinguished two
types of the C-C bonds: the ones which are perpendicular to the axis of the CNTs, and the
ones which are at the angle to the circumference. As an example, the corresponding π-
orbital misalignments are 0 and 21.3 degrees in the case of the (5,5) CNT. On the basis of
theoretical calculations of torsional strain energies in conjugated organic molecules, it was
shown that -orbital misalignment is likely to be the main source of strain in the CNTs
[H87].
Thus, one can conclude that the CNTs are not as inert as graphene, but still are not highly
reactive structures. Therefore, the covalent functionalization of CNTs is expected to be
successful only if highly reactive reagents are used.
Experimentally, the surface chemistry of CNTs takes its beginning after the discovery of an
oxidation process for SWCNTs involving ultrasonic treatment in a mixture of concentrated
nitric and sulfuric acids [LRD+98]. The CNTs imposed to such a treatment are heavily
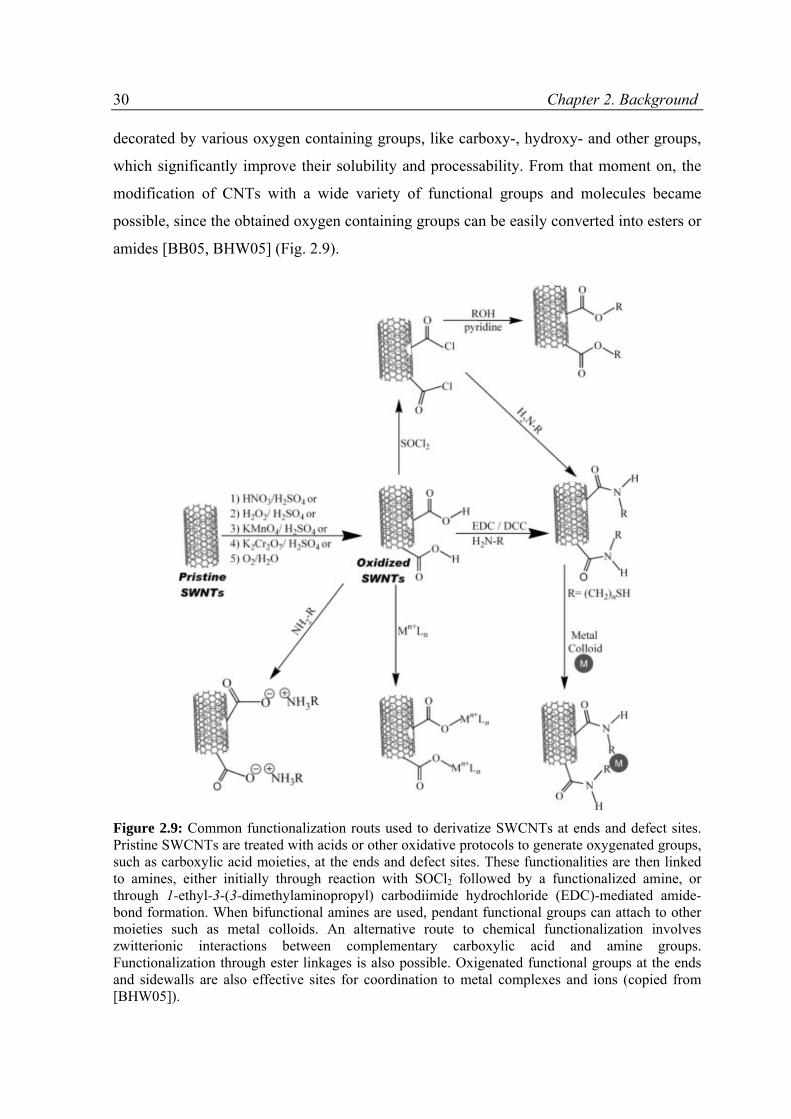
30 Chapter 2. Background decorated by various oxygen containing groups, like carboxy-, hydroxy- and other groups,
which significantly improve their solubility and processability. From that moment on, the
modification of CNTs with a wide variety of functional groups and molecules became
possible, since the obtained oxygen containing groups can be easily converted into esters or
amides [BB05, BHW05] (Fig. 2.9).
Figure 2.9: Common functionalization routs used to derivatize SWCNTs at ends and defect sites. Pristine SWCNTs are treated with acids or other oxidative protocols to generate oxygenated groups, such as carboxylic acid moieties, at the ends and defect sites. These functionalities are then linked to amines, either initially through reaction with SOCl2 followed by a functionalized amine, or through 1-ethyl-3-(3-dimethylaminopropyl) carbodiimide hydrochloride (EDC)-mediated amide-bond formation. When bifunctional amines are used, pendant functional groups can attach to other moieties such as metal colloids. An alternative route to chemical functionalization involves zwitterionic interactions between complementary carboxylic acid and amine groups. Functionalization through ester linkages is also possible. Oxigenated functional groups at the ends and sidewalls are also effective sites for coordination to metal complexes and ions (copied from [BHW05]).
2.3. General approaches for functionalization of CNTs 31 However, the treatment of the CNTs with aggressive concentric acids causes destruction of
the CNTs and results in nanotube fragments with lengths of 100 - 300 nm [YJP+08]. The
shortening of CNTs significantly reduces their aspect ratio. In fact, as noted by A. Hirsch,
“these small nanotubes, 300 nm long and with a diameter of 1.4 nm, contain around 50 000
C atoms in about 25 000 benzene rings, which corresponds to a molecular weight of about
600 000”, which makes them similar to high-molecular-weight polymers [H02].
Correspondingly, the physical properties of shortened CNTs are also expected to be altered
significantly. That is why less aggressive methods for the CNTs activation are of great
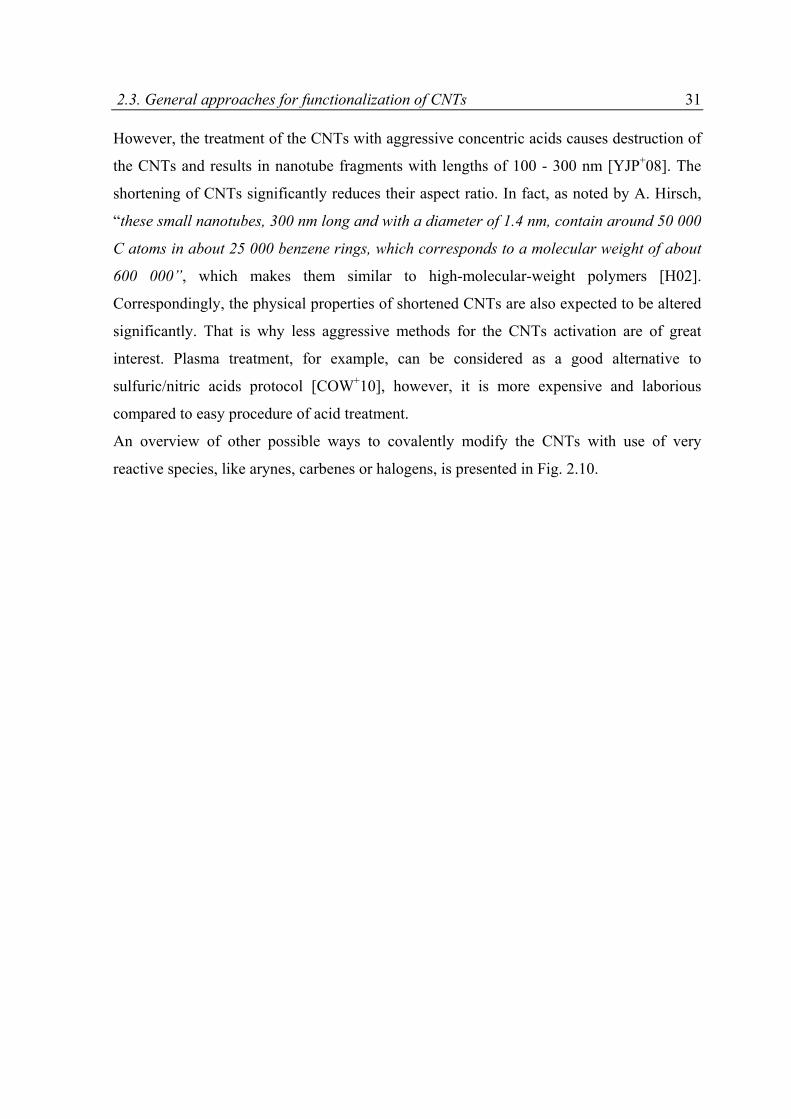
interest. Plasma treatment, for example, can be considered as a good alternative to
sulfuric/nitric acids protocol [COW+10], however, it is more expensive and laborious
compared to easy procedure of acid treatment.
An overview of other possible ways to covalently modify the CNTs with use of very
reactive species, like arynes, carbenes or halogens, is presented in Fig. 2.10.
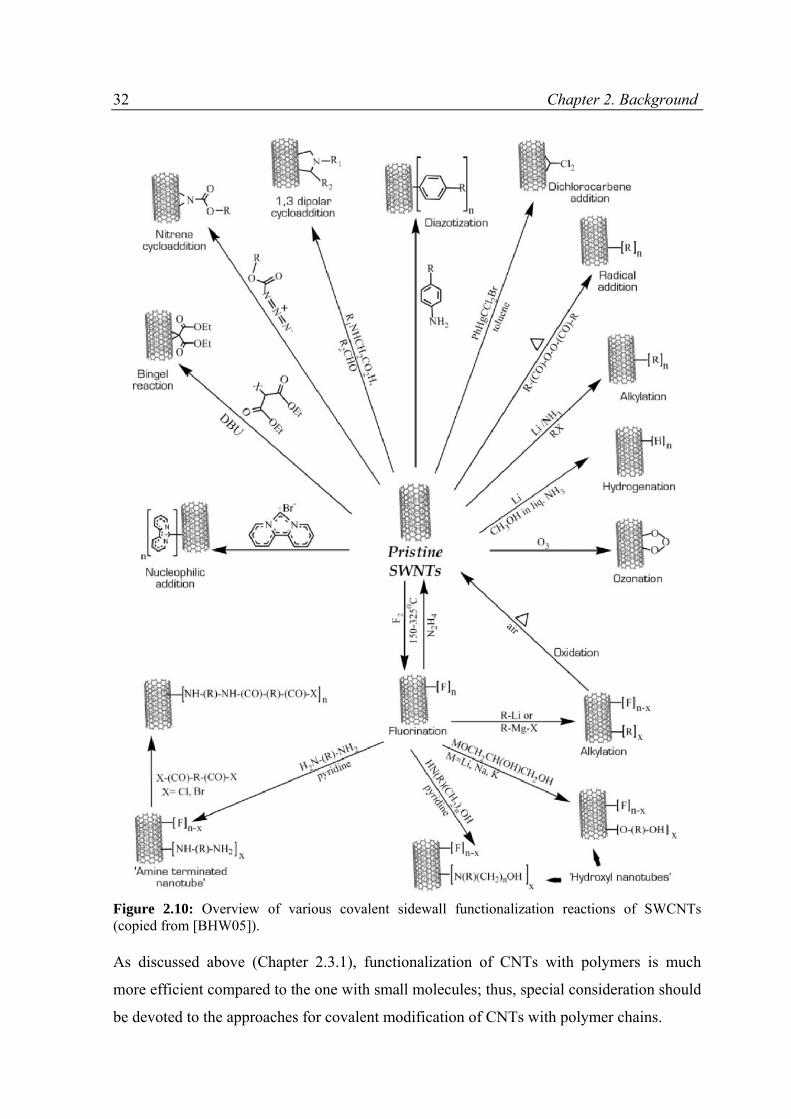
32 Chapter 2. Background
Figure 2.10: Overview of various covalent sidewall functionalization reactions of SWCNTs (copied from [BHW05]).
As discussed above (Chapter 2.3.1), functionalization of CNTs with polymers is much
more efficient compared to the one with small molecules; thus, special consideration should
be devoted to the approaches for covalent modification of CNTs with polymer chains.
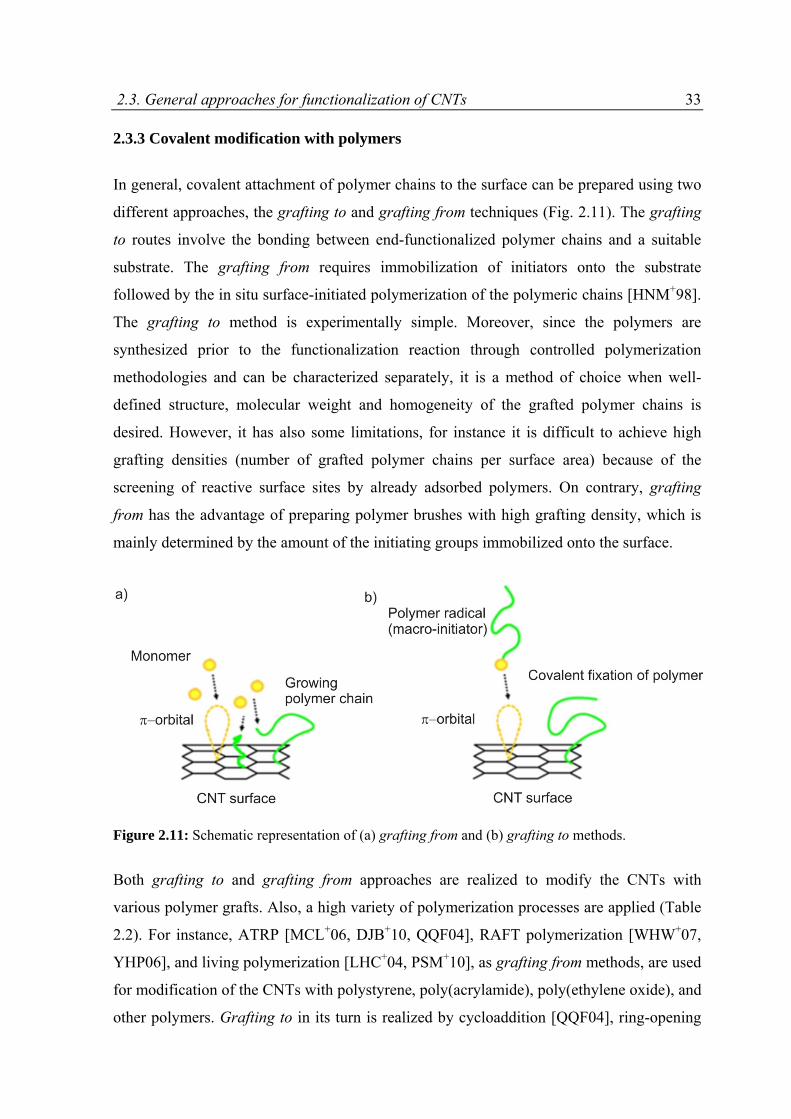
2.3. General approaches for functionalization of CNTs 33 2.3.3 Covalent modification with polymers
In general, covalent attachment of polymer chains to the surface can be prepared using two
different approaches, the grafting to and grafting from techniques (Fig. 2.11). The grafting
to routes involve the bonding between end-functionalized polymer chains and a suitable
substrate. The grafting from requires immobilization of initiators onto the substrate
followed by the in situ surface-initiated polymerization of the polymeric chains [HNM+98].
The grafting to method is experimentally simple. Moreover, since the polymers are
synthesized prior to the functionalization reaction through controlled polymerization
methodologies and can be characterized separately, it is a method of choice when well-
defined structure, molecular weight and homogeneity of the grafted polymer chains is
desired. However, it has also some limitations, for instance it is difficult to achieve high
grafting densities (number of grafted polymer chains per surface area) because of the
screening of reactive surface sites by already adsorbed polymers. On contrary, grafting
from has the advantage of preparing polymer brushes with high grafting density, which is
mainly determined by the amount of the initiating groups immobilized onto the surface.
Figure 2.11: Schematic representation of (a) grafting from and (b) grafting to methods.
Both grafting to and grafting from approaches are realized to modify the CNTs with
various polymer grafts. Also, a high variety of polymerization processes are applied (Table
2.2). For instance, ATRP [MCL+06, DJB+10, QQF04], RAFT polymerization [WHW+07,
YHP06], and living polymerization [LHC+04, PSM+10], as grafting from methods, are used
for modification of the CNTs with polystyrene, poly(acrylamide), poly(ethylene oxide), and
other polymers. Grafting to in its turn is realized by cycloaddition [QQF04], ring-opening
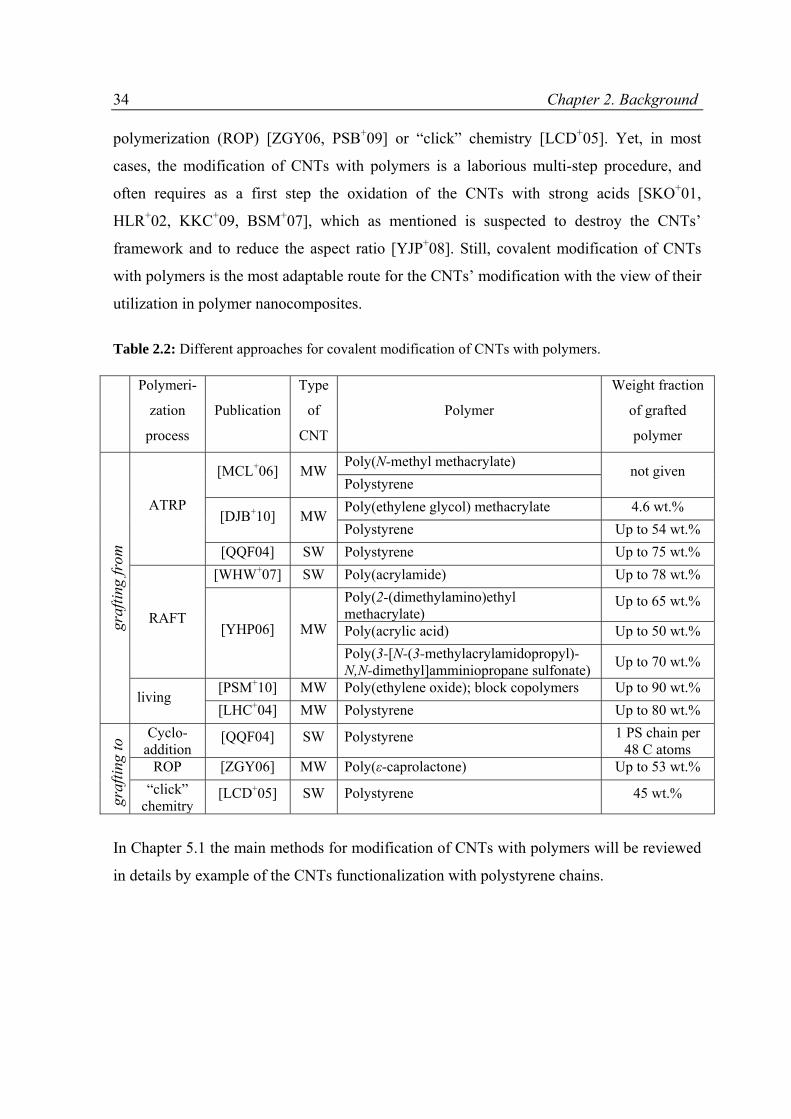
34 Chapter 2. Background polymerization (ROP) [ZGY06, PSB+09] or “click” chemistry [LCD+05]. Yet, in most
cases, the modification of CNTs with polymers is a laborious multi-step procedure, and
often requires as a first step the oxidation of the CNTs with strong acids [SKO+01,
HLR+02, KKC+09, BSM+07], which as mentioned is suspected to destroy the CNTs’
framework and to reduce the aspect ratio [YJP+08]. Still, covalent modification of CNTs
with polymers is the most adaptable route for the CNTs’ modification with the view of their
utilization in polymer nanocomposites.
Table 2.2: Different approaches for covalent modification of CNTs with polymers.
Polymeri-
zation
process
Publication
Type
of
CNT
Polymer
Weight fraction
of grafted
polymer
graf
ting
from
ATRP
[MCL+06] MW Poly(N-methyl methacrylate)
not given Polystyrene
[DJB+10] MW Poly(ethylene glycol) methacrylate 4.6 wt.%
Polystyrene Up to 54 wt.%
[QQF04] SW Polystyrene Up to 75 wt.%
RAFT
[WHW+07] SW Poly(acrylamide) Up to 78 wt.%
[YHP06] MW
Poly(2-(dimethylamino)ethyl methacrylate)
Up to 65 wt.%
Poly(acrylic acid) Up to 50 wt.%
Poly(3-[N-(3-methylacrylamidopropyl)-N,N-dimethyl]amminiopropane sulfonate)
Up to 70 wt.%
living [PSM+10] MW Poly(ethylene oxide); block copolymers Up to 90 wt.%
[LHC+04] MW Polystyrene Up to 80 wt.%
graf
ting
to Cyclo-
addition [QQF04] SW Polystyrene 1 PS chain per
48 C atomsROP [ZGY06] MW Poly(ε-caprolactone) Up to 53 wt.%
“click” chemitry
[LCD+05] SW Polystyrene 45 wt.%
In Chapter 5.1 the main methods for modification of CNTs with polymers will be reviewed
in details by example of the CNTs functionalization with polystyrene chains.
3 Purpose and objectives
In the previous chapters it was shown that CNTs, due to outstanding physical properties
and unique 1D structure, are potentially perfect nanofiller particles for nanocomposite
materials. However, the introduction of CNTs into a polymer matrix meets a number of
problems, like homogeneous and individual distribution within the matrix. Use of phase
separated block copolymer as a three-dimensional template for directed self-assembly of
the nanoparticles can help to overcome these challenges [BMT05]. Moreover,
nanocomposites from CNTs and anisotropic, nanostructured block copolymers are
promising materials that are expected to posses anisotropic physical properties due to the
directed ordering of the CNTs within the phase separated polymer matrix. Park et al. have
already showed that it is possible to align PS-modified MWCNTs by the incorporation of
them into a P(S-b-I) diblock copolymer with a lamellar morphology [PLK+07]. The
problem, however, is that for the modification of CNTs, latex polymerization was applied.
This modification, though efficient, is known to result in the presence of a huge amount of
SDS around the CNTs, and consequently leads to the loss of conductivity of the
nanocomposite [YLS+07] (will be discussed in Chapter 7). Therefore, new strategies need
to be developed to tune the surface properties of the CNTs in order to improve their
utilization in CNT/polymer nanocomposites. Moreover, for optimization of the
nanocomposite preparation, modern characterization methods are required to fully describe
the behavior of the CNTs when dispersed in solvents and within the polymer matrix.
36 Chapter 3. Purpose and objectives The aim of the present work was (i) to develop new simple yet efficient routes to
chemically modify the CNTs for improving their dispersion ability both in liquids and
polymer matrices and (ii) to generate a new nanocomposite on base of the modified CNTs
and a block copolymer matrix; (iii) full characterization of the structure and dispersion
ability of the CNTs in solvents and in polymer matrices was required.
Clearly, these tasks could only be solved in a close cooperation between chemistry
(modification of CNTs), physics (characterization of CNTs’ dispersions) and materials
engineering (preparation of nanocomposites).
4 Characterization methods
In order to realize the unique properties of CNTs in practice in an optimal way, thorough
characterization of CNTs, i.e. their structure, chemical composition and dispersion ability,
and the control over these properties upon manipulation with CNTs is required. Typically,
for morphological characterization, microscopic methods, like transmission electron
microscopy (TEM) or atomic force microscopy (AFM), are applied. Also, microscopy
(scanning electron microscopy (SEM) and AFM) is used in to get information about the
dispersion ability of CNTs. However, the simplicity of the microscopic observations is
deceptive; in most of the cases microscopy does not reflect the real behavior of the CNTs.
The matter is that sample preparation for microscopic investigations implies either drop-
casting or spin-coating the CNTs from a very dilute dispersion onto a substrate, and both
the solvent evaporation and the interaction with the substrate surface may have a significant
influence on the arrangement of CNTs, which may falsify the observations. In this sense,
the characterization of CNTs’ morphology and dispersion ability by use of small-angle X-
ray or neutron scattering techniques, which allows to study bulk samples directly, are of
interest. The only problem is that the interpretation of the small-angle scattering (SAS)
results is often challenging due to the high polydispersity in the CNTs’ dimensions and
their ill-defined structure and composition. Therefore, in order to characterize CNTs by
SAS techniques, preliminary knowledge about the approximate morphology and structure
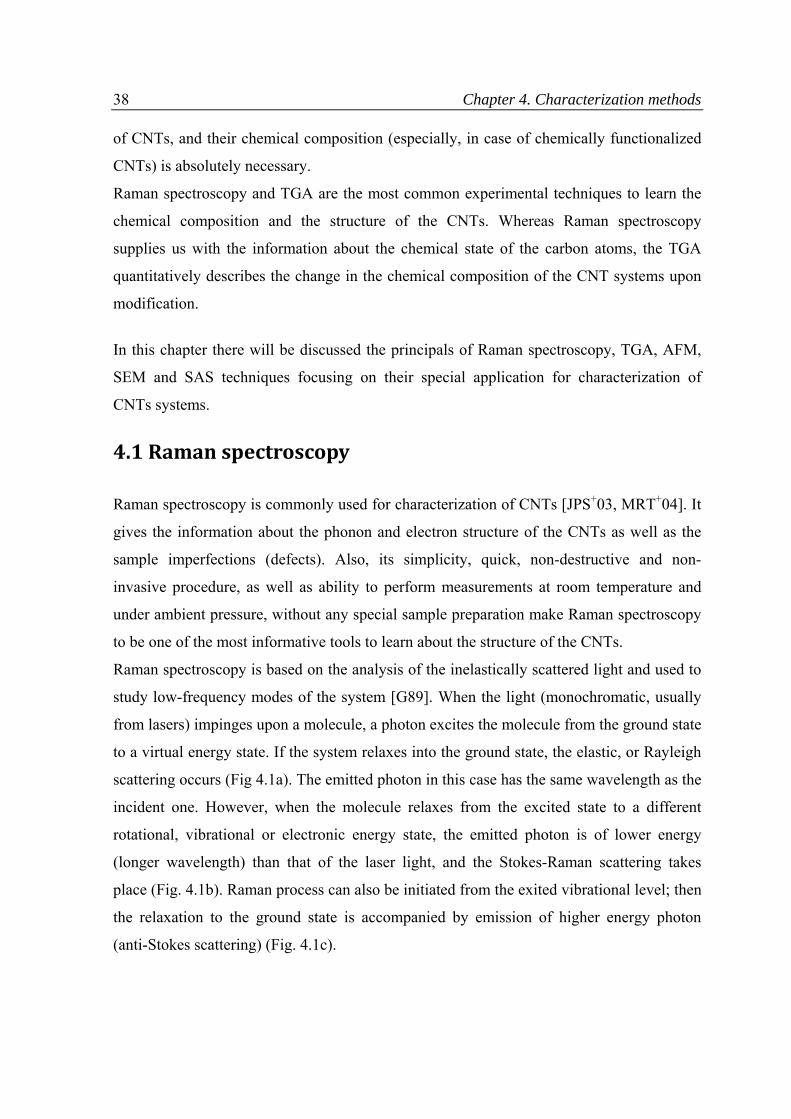
38 Chapter 4. Characterization methods of CNTs, and their chemical composition (especially, in case of chemically functionalized
CNTs) is absolutely necessary.
Raman spectroscopy and TGA are the most common experimental techniques to learn the
chemical composition and the structure of the CNTs. Whereas Raman spectroscopy
supplies us with the information about the chemical state of the carbon atoms, the TGA
quantitatively describes the change in the chemical composition of the CNT systems upon
modification.
In this chapter there will be discussed the principals of Raman spectroscopy, TGA, AFM,
SEM and SAS techniques focusing on their special application for characterization of
CNTs systems.
4.1 Raman spectroscopy
Raman spectroscopy is commonly used for characterization of CNTs [JPS+03, MRT+04]. It
gives the information about the phonon and electron structure of the CNTs as well as the
sample imperfections (defects). Also, its simplicity, quick, non-destructive and non-
invasive procedure, as well as ability to perform measurements at room temperature and
under ambient pressure, without any special sample preparation make Raman spectroscopy
to be one of the most informative tools to learn about the structure of the CNTs.
Raman spectroscopy is based on the analysis of the inelastically scattered light and used to
study low-frequency modes of the system [G89]. When the light (monochromatic, usually
from lasers) impinges upon a molecule, a photon excites the molecule from the ground state
to a virtual energy state. If the system relaxes into the ground state, the elastic, or Rayleigh
scattering occurs (Fig 4.1a). The emitted photon in this case has the same wavelength as the
incident one. However, when the molecule relaxes from the excited state to a different
rotational, vibrational or electronic energy state, the emitted photon is of lower energy
(longer wavelength) than that of the laser light, and the Stokes-Raman scattering takes
place (Fig. 4.1b). Raman process can also be initiated from the exited vibrational level; then
the relaxation to the ground state is accompanied by emission of higher energy photon
(anti-Stokes scattering) (Fig. 4.1c).
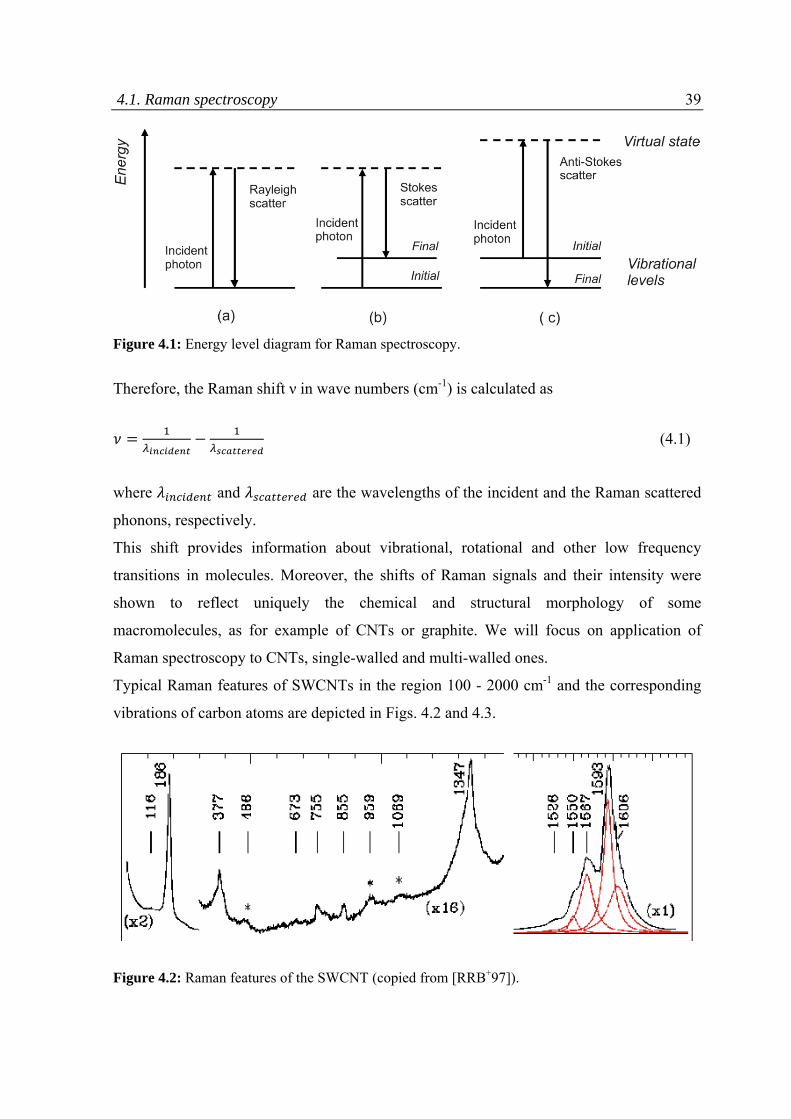
4.1. Raman spectroscopy 39
Figure 4.1: Energy level diagram for Raman spectroscopy.
Therefore, the Raman shift ν in wave numbers (cm-1) is calculated as
(4.1)
where and are the wavelengths of the incident and the Raman scattered
phonons, respectively.
This shift provides information about vibrational, rotational and other low frequency
transitions in molecules. Moreover, the shifts of Raman signals and their intensity were
shown to reflect uniquely the chemical and structural morphology of some
macromolecules, as for example of CNTs or graphite. We will focus on application of
Raman spectroscopy to CNTs, single-walled and multi-walled ones.
Typical Raman features of SWCNTs in the region 100 - 2000 cm-1 and the corresponding
vibrations of carbon atoms are depicted in Figs. 4.2 and 4.3.
Figure 4.2: Raman features of the SWCNT (copied from [RRB+97]).
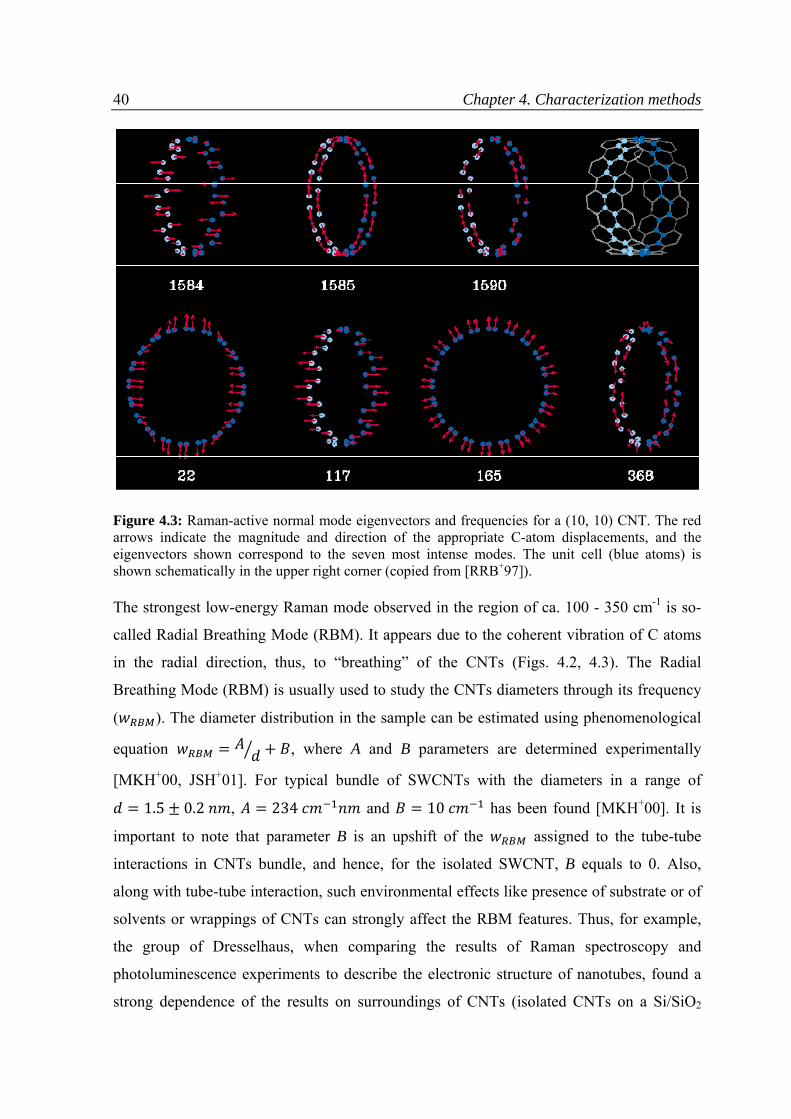
40 Chapter 4. Characterization methods
Figure 4.3: Raman-active normal mode eigenvectors and frequencies for a (10, 10) CNT. The red arrows indicate the magnitude and direction of the appropriate C-atom displacements, and the eigenvectors shown correspond to the seven most intense modes. The unit cell (blue atoms) is shown schematically in the upper right corner (copied from [RRB+97]).
The strongest low-energy Raman mode observed in the region of ca. 100 - 350 cm-1 is so-
called Radial Breathing Mode (RBM). It appears due to the coherent vibration of C atoms
in the radial direction, thus, to “breathing” of the CNTs (Figs. 4.2, 4.3). The Radial
Breathing Mode (RBM) is usually used to study the CNTs diameters through its frequency
( ). The diameter distribution in the sample can be estimated using phenomenological
equation , where A and B parameters are determined experimentally
[MKH+00, JSH+01]. For typical bundle of SWCNTs with the diameters in a range of
1.5 0.2 , 234 and 10 has been found [MKH+00]. It is
important to note that parameter B is an upshift of the assigned to the tube-tube
interactions in CNTs bundle, and hence, for the isolated SWCNT, B equals to 0. Also,
along with tube-tube interaction, such environmental effects like presence of substrate or of
solvents or wrappings of CNTs can strongly affect the RBM features. Thus, for example,
the group of Dresselhaus, when comparing the results of Raman spectroscopy and
photoluminescence experiments to describe the electronic structure of nanotubes, found a
strong dependence of the results on surroundings of CNTs (isolated CNTs on a Si/SiO2
4.1. Raman spectroscopy 41 substrate or SDS wrapped CNTs in aqueous solution; bundled CNTs and the SDS wrapped
ones) [FJS+04]. For very thin CNTs with diameters less than 1 nm the simple equation
does not hold any more, because of the nanotube lattice distortions which
lead to the dependence of on chirality [KZK+03]. For large diameter CNTs (d > 2
nm), the intensity of the RBM features is weak and is hardly observable.
Though Raman scattering measurements on a bundle of CNTs performed with certain laser
intensity gives a general idea about the diameters of tubes that are in the resonance with the
laser line, it does not provide the complete characterization of the tubes in the bundle. On
contrary, by taking Raman spectra using many laser lines, a detailed characterization of the
sample is possible [MKH+00]. For example, measurements using several laser
energies can be used to determine the ratio of metallic to semiconducting CNTs in a given
sample [SCS+04]. Since in our experiments we use only a laser of a certain wavelength, the
assignments of the RBM features and the (n,m) or electronic structure of the CNTs will not
be discussed in details in the present dissertation; the theory can be found in number of
publications and reviews [DDS+05, MPZ+10].
In the higher energy region of the spectrum, the phonons correspond to tangential
displacements of the atoms (Fig. 4.3, upper row of images). At ~ 1600 cm−1 so-called G-
band is observed. The G-band in SWCNTs is associated with the graphitic structure of the
walls, or sp2 hybridized carbon. In graphite the G-band involves an optical phonon mode
between two dissimilar carbon atoms A and B in the unit cell and exhibits one Lorentzian
peak at 1582 cm-1 related to the tangential mode vibrations of the C atoms. In case of
SWCNTs, the G-band is composed of several peaks due to (i) C atoms vibrations along the
nanotube axis (G+) and due to (ii) vibrations of carbon atoms along the circumferential
directions of the SWCNT (G-). Thus, whereas G+ (at ca. 1590 cm-1) is sensitive to charge
transfer from dopant additions to SWCNTs (up-shifts for acceptors, down-shifts for
donors), the G- line shape (at ca. 1570 cm-1) is sensitive to the type of CNT
(semiconducting or metallic) [PME+98, BJC+01]. However, when bundles of CNTs are
investigated it is not always possible to distinguish between G- and G+. It was also shown
that the G-band for large diameter CNTs is similar to the one peak G-band observed in
graphite [JSF+02]. This is the case, for example, for the G-bands from the large diameter
MWCNTs.
42 Chapter 4. Characterization methods At frequencies of ca. 1350 cm-1 a D- (or disorder induced) band is observed. It has a strong
second harmonic at ca. 2 , the G’-band (not shown here). G’ is sensitive to the SWCNT
diameter and chirality. For example, it was shown that the G’ bands in spectra for metallic
SWCNTs have different line shape profiles, univalently depending on the chiral angle of
the CNT [JSH+01]. However, these dependencies are significant only in case of the
individual CNTs studied with Raman spectroscopy; in case of bundle investigation, the
most important is the D-band signal. The changes in its intensity are used to probe and
monitor the structural modifications of the CNT sidewalls that come from introduction of
defects and attachment of different chemical species. Since the D-band (disorder-induced
band) is due to the defects or, in other words, to the presence of sp3 hybridized C atoms,
whereas the signal of the G-band originates due to vibrations of sp2 hybridized carbons, the
sample purity is usually investigated using D/G band intensity ratio [KW89].
The presence of different chemical species covalently attached to the CNTs sidewalls
affects also the positioning of G+ and G’ bands (and consequently, the D-band positioning
as well): similarly to the case of G+-band (see above), the upshifts/downshifts of G’ and D
signals arise due to charge transfer effects to/from acceptors/donors attached to the CNTs’
framework [CSB+03, SJS+03]. Additionally, some upshifts of the Raman characteristic
peaks might be caused by the strong wrapping of CNTs by the polymers. In this case the
reason of the upshift is the increase in the elastic constant of the harmonic oscillator of the
polymer-coated CNTs: the hydrophobic and van der Waals attractions between the polymer
and the graphite sheet increase the energy necessary for vibrations to occur, which is
reflected in the higher frequency of Raman peaks [SGY+05].
In case of MWCNTs, Raman spectroscopy is not as informative as for individual SWCNTs.
Because of the large outer diameters and because MWCNTs contain an assembly of CNTs
with diameters ranging from small to large, most of the characteristic Raman features
observed for SWCNTs are not so evident for MW ones [RJP+00]. For example, the RBM
signal from large diameter tubes is usually too weak to be observable, and the ensemble
average of inner tube diameters broadens the signal. Also, the G-band splitting into G+ and
G- is small in intensity and smeared out due to the effect of diameter distribution within the
individual MWCNT. Therefore, G-band exhibits a weakly asymmetric line shape, with a
peak appearing close to the graphitic frequency at 1582 cm-1 [RJP+00]. The D-band of the
MWCNTs is typically strong even in case of native tubes, and arises due to large amount of
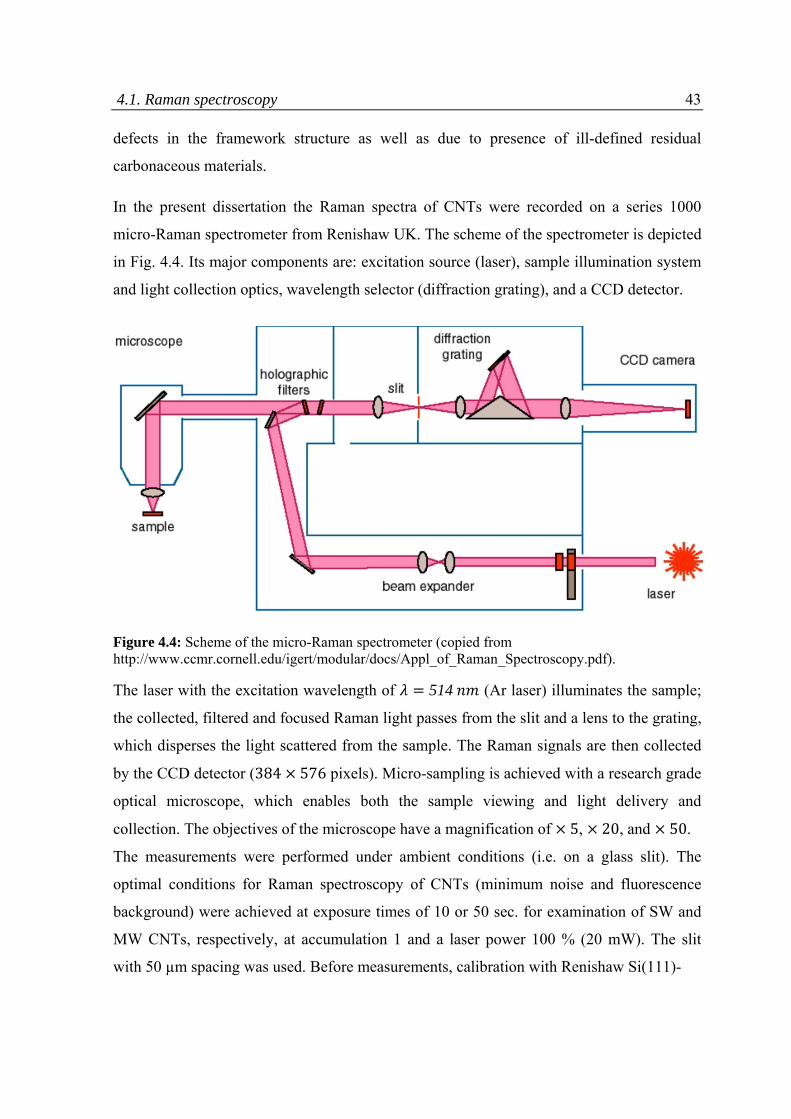
4.1. Raman spectroscopy 43 defects in the framework structure as well as due to presence of ill-defined residual
carbonaceous materials.
In the present dissertation the Raman spectra of CNTs were recorded on a series 1000
micro-Raman spectrometer from Renishaw UK. The scheme of the spectrometer is depicted
in Fig. 4.4. Its major components are: excitation source (laser), sample illumination system
and light collection optics, wavelength selector (diffraction grating), and a CCD detector.
Figure 4.4: Scheme of the micro-Raman spectrometer (copied from http://www.ccmr.cornell.edu/igert/modular/docs/Appl_of_Raman_Spectroscopy.pdf).
The laser with the excitation wavelength of 514 (Ar laser) illuminates the sample;
the collected, filtered and focused Raman light passes from the slit and a lens to the grating,
which disperses the light scattered from the sample. The Raman signals are then collected
by the CCD detector (384 576 pixels). Micro-sampling is achieved with a research grade
optical microscope, which enables both the sample viewing and light delivery and
collection. The objectives of the microscope have a magnification of 5, 20, and 50.
The measurements were performed under ambient conditions (i.e. on a glass slit). The
optimal conditions for Raman spectroscopy of CNTs (minimum noise and fluorescence
background) were achieved at exposure times of 10 or 50 sec. for examination of SW and
MW CNTs, respectively, at accumulation 1 and a laser power 100 % (20 mW). The slit
with 50 µm spacing was used. Before measurements, calibration with Renishaw Si(111)-
44 Chapter 4. Characterization methods reference wafer was carried out. For every sample, the results were averaged over at least
10 measurements. Analysis of the obtained Raman spectra was performed using OriginPro
software.
4.2 Thermogravimetric analysis
Thermo-gravimetric analysis (TGA) is commonly applied to study the characteristics of
materials such as thermal and oxidative stability, decomposition kinetics and degradation
temperatures, composition of multicomponent system, the content of inorganic and organic
components or solvent residuals. The measurements are based on the changes of the sample
weight as a function of temperature; that is why, a high degree of precision in recording
weight, temperature, and temperature change is required, which becomes extremely
important for analysis of “fluffy” substances like CNTs, since due to their low bulk density
only very little amount of substance (ca. 2 - 5 mg) can be analyzed.
The main part of the set-up is a high-precision balance with a pan (generally platinum)
loaded with the sample. The sample is placed in a small electrically heated oven with a
thermocouple to accurately measure the temperature. The atmosphere may be purged with
an inert gas to prevent oxidation and other undesired reactions, or with air. The temperature
is usually changed with the certain rate (5 – 10 °C/min) up to 1000 °C and higher. The
weight of the sample (in %) is plotted as a function of the temperature.
It should be noted that the weight loss of the sample is observed when the sample
undergoes decomposition, or when the loss of volatiles occurs. However, along with the
weight loss, weight gain due to oxidation and absorption with increase of temperature may
happen. Weight gain, for example, quite often takes place when analyzing CNTs, due to the
oxidation of the residual metal particles.
In inert atmosphere CNTs exhibit a high thermal stability, in vacuum they are thermally
stable up to 2000 °C (see Chapter 2.1.2). Therefore, TGA performed under inert conditions
is a useful technique to obtain the information about the presence of the modifiers on the
CNTs’ framework. In the present work, we apply TGA to analyze the amount of the
polymer chemically grafted to the CNTs.
The thermo-gravimetric characterization of the CNTs modified with polymer grafts (PS or
P(4VP)) was obtained on a TG 50 instrument supplied with controller TG 15, both from
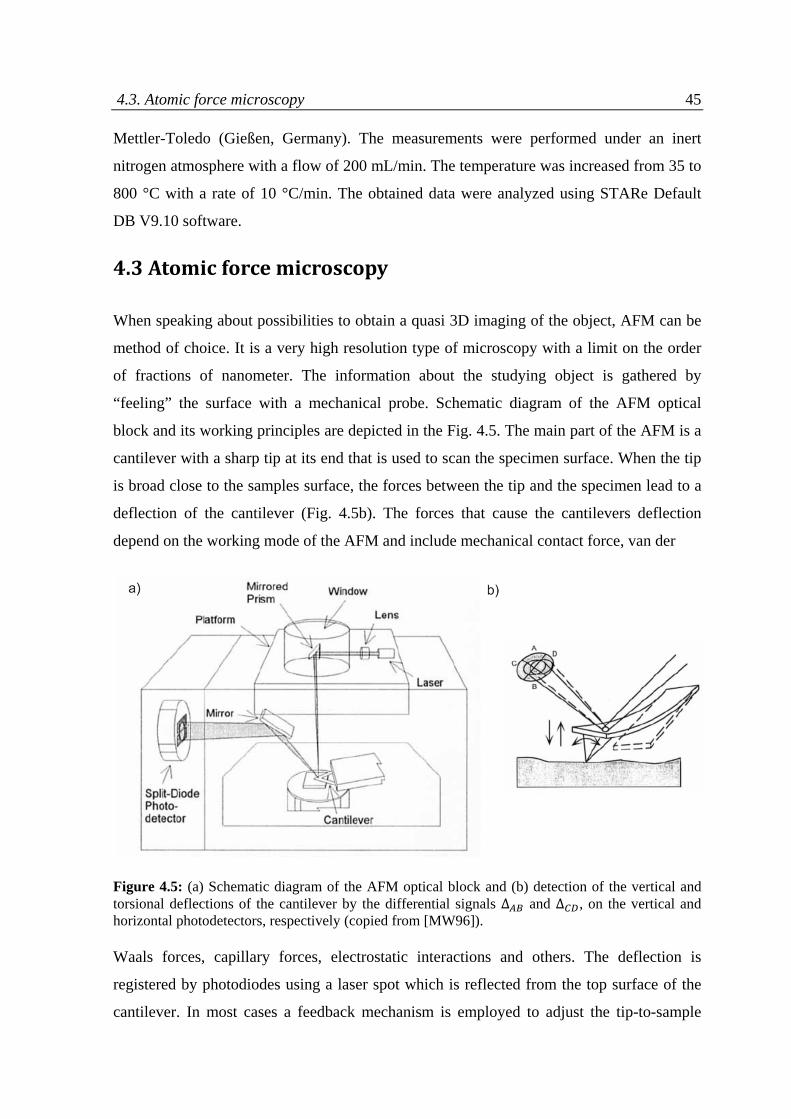
4.3. Atomic force microscopy 45 Mettler-Toledo (Gießen, Germany). The measurements were performed under an inert
nitrogen atmosphere with a flow of 200 mL/min. The temperature was increased from 35 to
800 °C with a rate of 10 °C/min. The obtained data were analyzed using STARe Default
DB V9.10 software.
4.3 Atomic force microscopy
When speaking about possibilities to obtain a quasi 3D imaging of the object, AFM can be
method of choice. It is a very high resolution type of microscopy with a limit on the order
of fractions of nanometer. The information about the studying object is gathered by
“feeling” the surface with a mechanical probe. Schematic diagram of the AFM optical
block and its working principles are depicted in the Fig. 4.5. The main part of the AFM is a
cantilever with a sharp tip at its end that is used to scan the specimen surface. When the tip
is broad close to the samples surface, the forces between the tip and the specimen lead to a
deflection of the cantilever (Fig. 4.5b). The forces that cause the cantilevers deflection
depend on the working mode of the AFM and include mechanical contact force, van der
Figure 4.5: (a) Schematic diagram of the AFM optical block and (b) detection of the vertical and torsional deflections of the cantilever by the differential signals ∆ and ∆ , on the vertical and horizontal photodetectors, respectively (copied from [MW96]).
Waals forces, capillary forces, electrostatic interactions and others. The deflection is
registered by photodiodes using a laser spot which is reflected from the top surface of the
cantilever. In most cases a feedback mechanism is employed to adjust the tip-to-sample
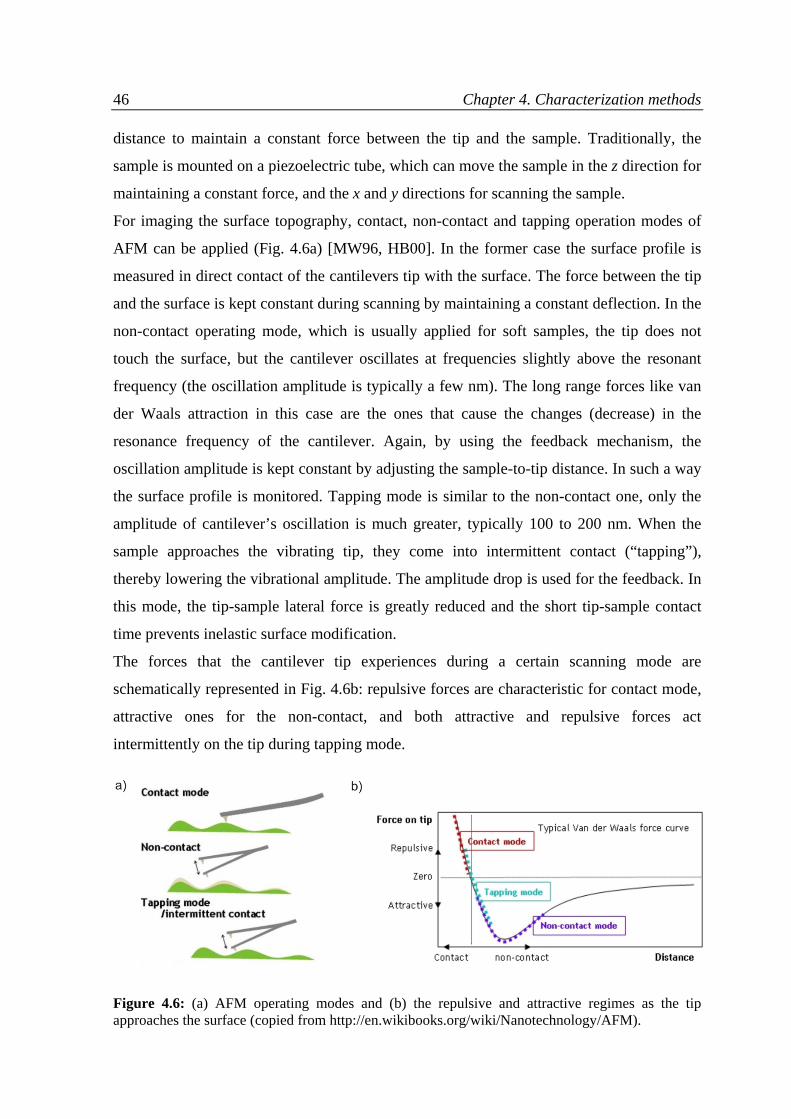
46 Chapter 4. Characterization methods distance to maintain a constant force between the tip and the sample. Traditionally, the
sample is mounted on a piezoelectric tube, which can move the sample in the z direction for
maintaining a constant force, and the x and y directions for scanning the sample.
For imaging the surface topography, contact, non-contact and tapping operation modes of
AFM can be applied (Fig. 4.6a) [MW96, HB00]. In the former case the surface profile is
measured in direct contact of the cantilevers tip with the surface. The force between the tip
and the surface is kept constant during scanning by maintaining a constant deflection. In the
non-contact operating mode, which is usually applied for soft samples, the tip does not
touch the surface, but the cantilever oscillates at frequencies slightly above the resonant
frequency (the oscillation amplitude is typically a few nm). The long range forces like van
der Waals attraction in this case are the ones that cause the changes (decrease) in the
resonance frequency of the cantilever. Again, by using the feedback mechanism, the
oscillation amplitude is kept constant by adjusting the sample-to-tip distance. In such a way
the surface profile is monitored. Tapping mode is similar to the non-contact one, only the
amplitude of cantilever’s oscillation is much greater, typically 100 to 200 nm. When the
sample approaches the vibrating tip, they come into intermittent contact (“tapping”),
thereby lowering the vibrational amplitude. The amplitude drop is used for the feedback. In
this mode, the tip-sample lateral force is greatly reduced and the short tip-sample contact
time prevents inelastic surface modification.
The forces that the cantilever tip experiences during a certain scanning mode are
schematically represented in Fig. 4.6b: repulsive forces are characteristic for contact mode,
attractive ones for the non-contact, and both attractive and repulsive forces act
intermittently on the tip during tapping mode.
Figure 4.6: (a) AFM operating modes and (b) the repulsive and attractive regimes as the tip approaches the surface (copied from http://en.wikibooks.org/wiki/Nanotechnology/AFM).
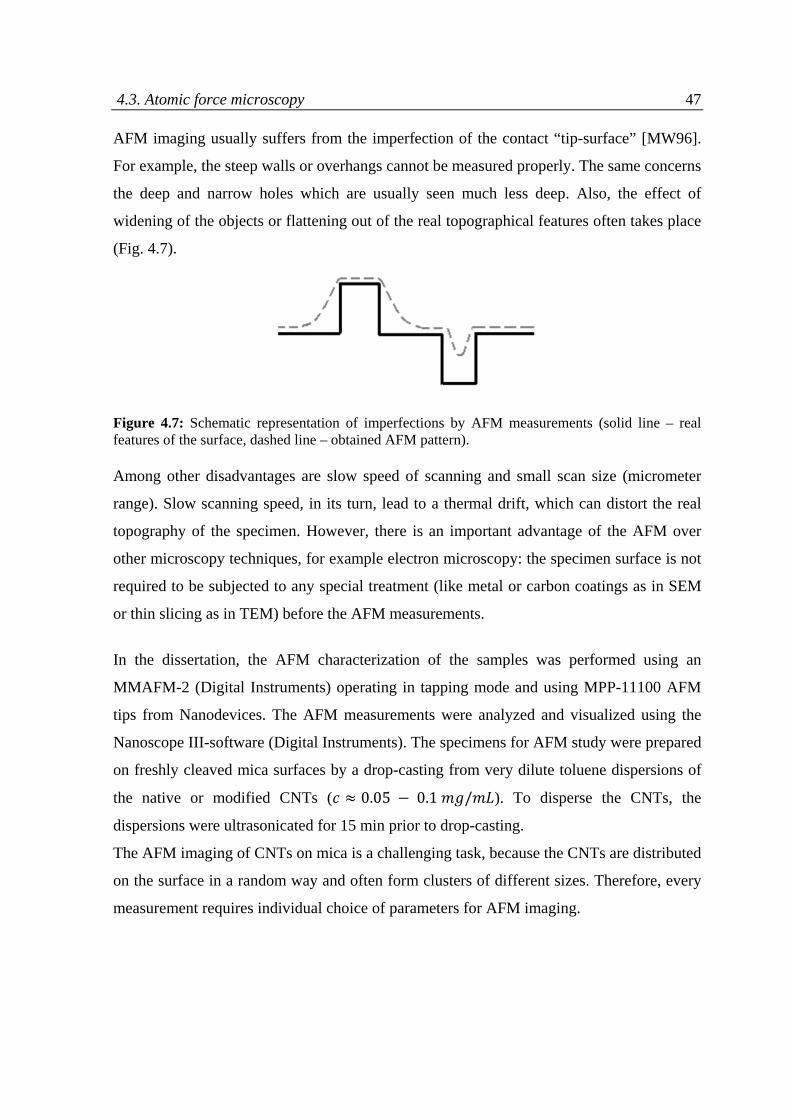
4.3. Atomic force microscopy 47 AFM imaging usually suffers from the imperfection of the contact “tip-surface” [MW96].
For example, the steep walls or overhangs cannot be measured properly. The same concerns
the deep and narrow holes which are usually seen much less deep. Also, the effect of
widening of the objects or flattening out of the real topographical features often takes place
(Fig. 4.7).
Figure 4.7: Schematic representation of imperfections by AFM measurements (solid line – real features of the surface, dashed line – obtained AFM pattern).
Among other disadvantages are slow speed of scanning and small scan size (micrometer
range). Slow scanning speed, in its turn, lead to a thermal drift, which can distort the real
topography of the specimen. However, there is an important advantage of the AFM over
other microscopy techniques, for example electron microscopy: the specimen surface is not
required to be subjected to any special treatment (like metal or carbon coatings as in SEM
or thin slicing as in TEM) before the AFM measurements.
In the dissertation, the AFM characterization of the samples was performed using an
MMAFM-2 (Digital Instruments) operating in tapping mode and using MPP-11100 AFM
tips from Nanodevices. The AFM measurements were analyzed and visualized using the
Nanoscope III-software (Digital Instruments). The specimens for AFM study were prepared
on freshly cleaved mica surfaces by a drop-casting from very dilute toluene dispersions of
the native or modified CNTs ( 0.05 0.1 / ). To disperse the CNTs, the
dispersions were ultrasonicated for 15 min prior to drop-casting.
The AFM imaging of CNTs on mica is a challenging task, because the CNTs are distributed
on the surface in a random way and often form clusters of different sizes. Therefore, every
measurement requires individual choice of parameters for AFM imaging.
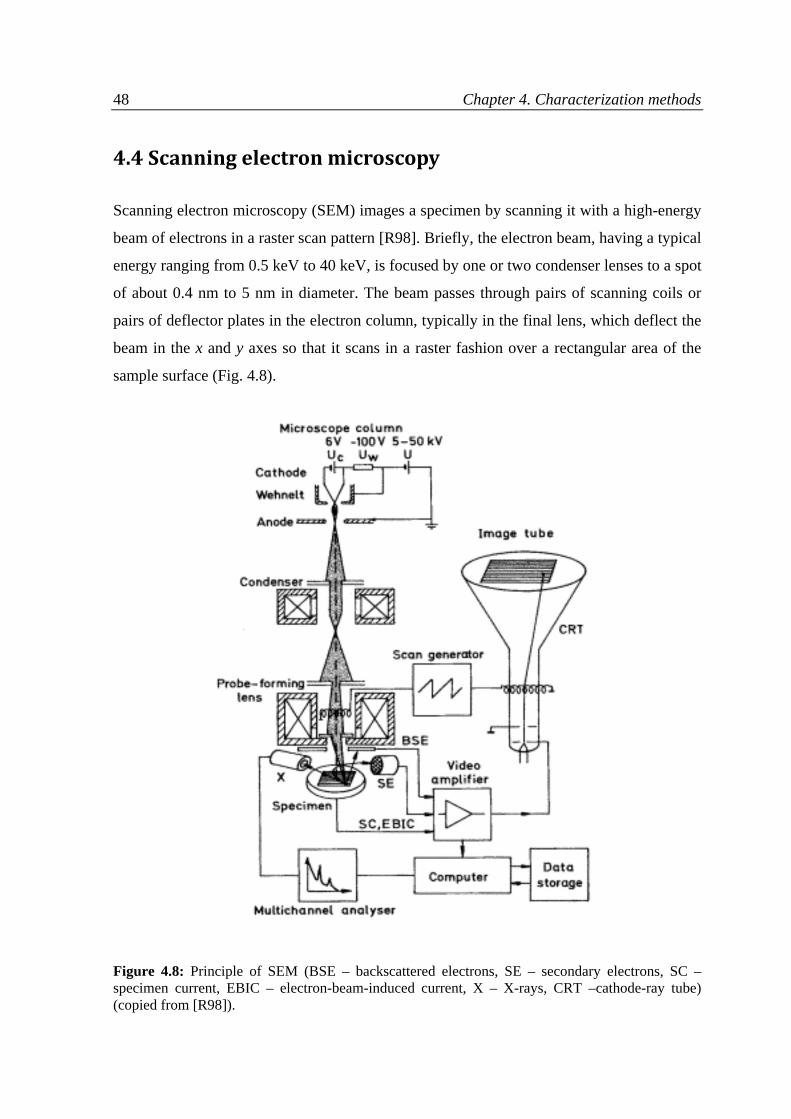
48 Chapter 4. Characterization methods
4.4 Scanning electron microscopy
Scanning electron microscopy (SEM) images a specimen by scanning it with a high-energy
beam of electrons in a raster scan pattern [R98]. Briefly, the electron beam, having a typical
energy ranging from 0.5 keV to 40 keV, is focused by one or two condenser lenses to a spot
of about 0.4 nm to 5 nm in diameter. The beam passes through pairs of scanning coils or
pairs of deflector plates in the electron column, typically in the final lens, which deflect the
beam in the x and y axes so that it scans in a raster fashion over a rectangular area of the
sample surface (Fig. 4.8).
Figure 4.8: Principle of SEM (BSE – backscattered electrons, SE – secondary electrons, SC – specimen current, EBIC – electron-beam-induced current, X – X-rays, CRT –cathode-ray tube) (copied from [R98]).
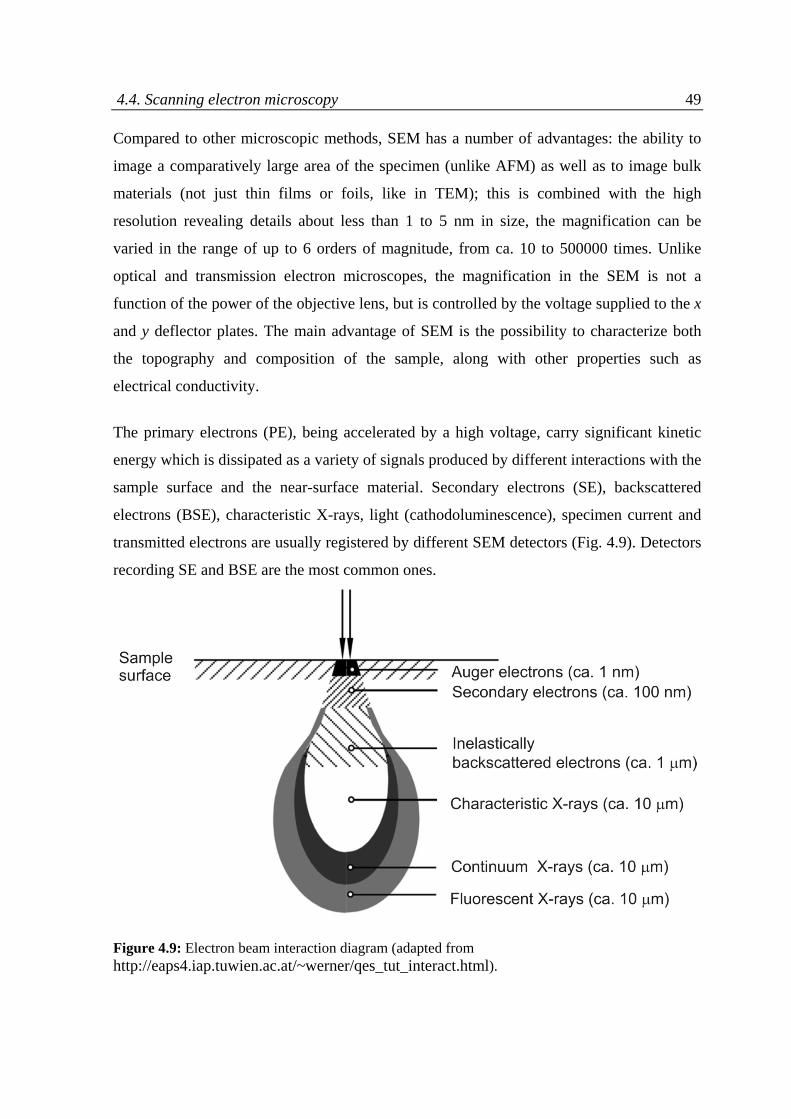
4.4. Scanning electron microscopy 49 Compared to other microscopic methods, SEM has a number of advantages: the ability to
image a comparatively large area of the specimen (unlike AFM) as well as to image bulk
materials (not just thin films or foils, like in TEM); this is combined with the high
resolution revealing details about less than 1 to 5 nm in size, the magnification can be
varied in the range of up to 6 orders of magnitude, from ca. 10 to 500000 times. Unlike
optical and transmission electron microscopes, the magnification in the SEM is not a
function of the power of the objective lens, but is controlled by the voltage supplied to the x
and y deflector plates. The main advantage of SEM is the possibility to characterize both
the topography and composition of the sample, along with other properties such as
electrical conductivity.
The primary electrons (PE), being accelerated by a high voltage, carry significant kinetic
energy which is dissipated as a variety of signals produced by different interactions with the
sample surface and the near-surface material. Secondary electrons (SE), backscattered
electrons (BSE), characteristic X-rays, light (cathodoluminescence), specimen current and
transmitted electrons are usually registered by different SEM detectors (Fig. 4.9). Detectors
recording SE and BSE are the most common ones.
Figure 4.9: Electron beam interaction diagram (adapted from http://eaps4.iap.tuwien.ac.at/~werner/qes_tut_interact.html).
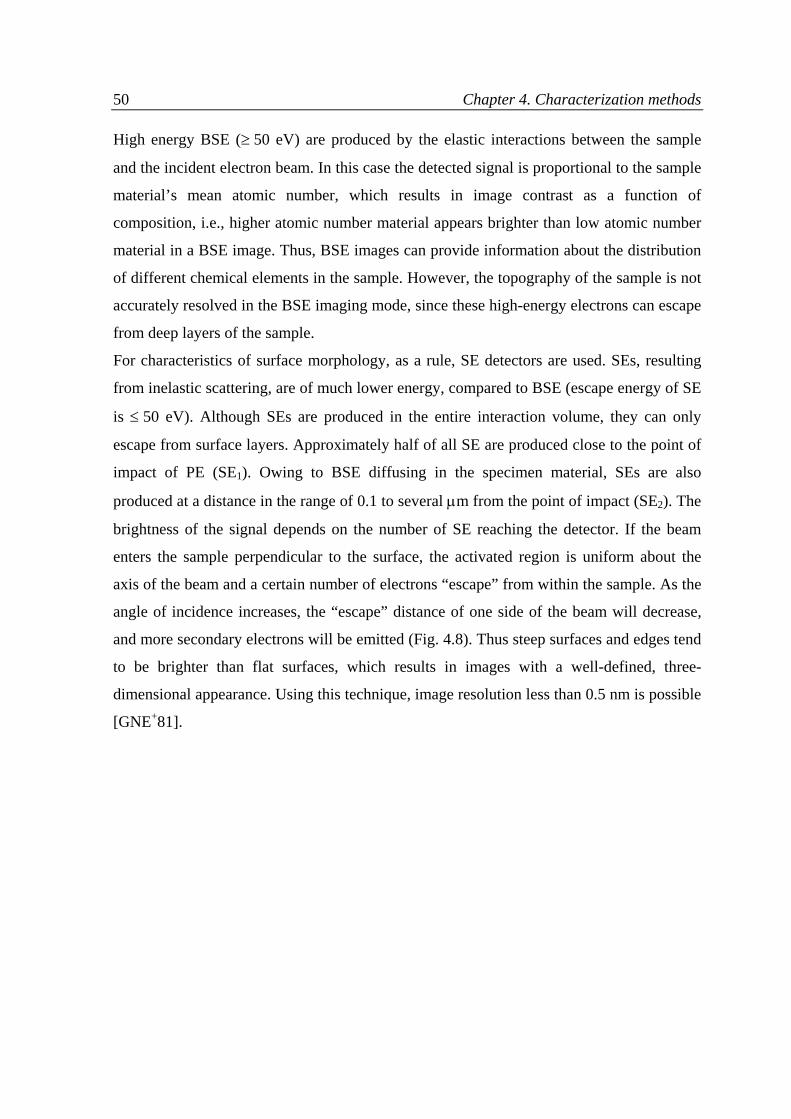
50 Chapter 4. Characterization methods High energy BSE (50 eV) are produced by the elastic interactions between the sample
and the incident electron beam. In this case the detected signal is proportional to the sample
material’s mean atomic number, which results in image contrast as a function of
composition, i.e., higher atomic number material appears brighter than low atomic number
material in a BSE image. Thus, BSE images can provide information about the distribution
of different chemical elements in the sample. However, the topography of the sample is not
accurately resolved in the BSE imaging mode, since these high-energy electrons can escape
from deep layers of the sample.
For characteristics of surface morphology, as a rule, SE detectors are used. SEs, resulting
from inelastic scattering, are of much lower energy, compared to BSE (escape energy of SE
is 50 eV). Although SEs are produced in the entire interaction volume, they can only
escape from surface layers. Approximately half of all SE are produced close to the point of
impact of PE (SE1). Owing to BSE diffusing in the specimen material, SEs are also
produced at a distance in the range of 0.1 to several m from the point of impact (SE2). The
brightness of the signal depends on the number of SE reaching the detector. If the beam
enters the sample perpendicular to the surface, the activated region is uniform about the
axis of the beam and a certain number of electrons “escape” from within the sample. As the
angle of incidence increases, the “escape” distance of one side of the beam will decrease,
and more secondary electrons will be emitted (Fig. 4.8). Thus steep surfaces and edges tend
to be brighter than flat surfaces, which results in images with a well-defined, three-
dimensional appearance. Using this technique, image resolution less than 0.5 nm is possible
[GNE+81].
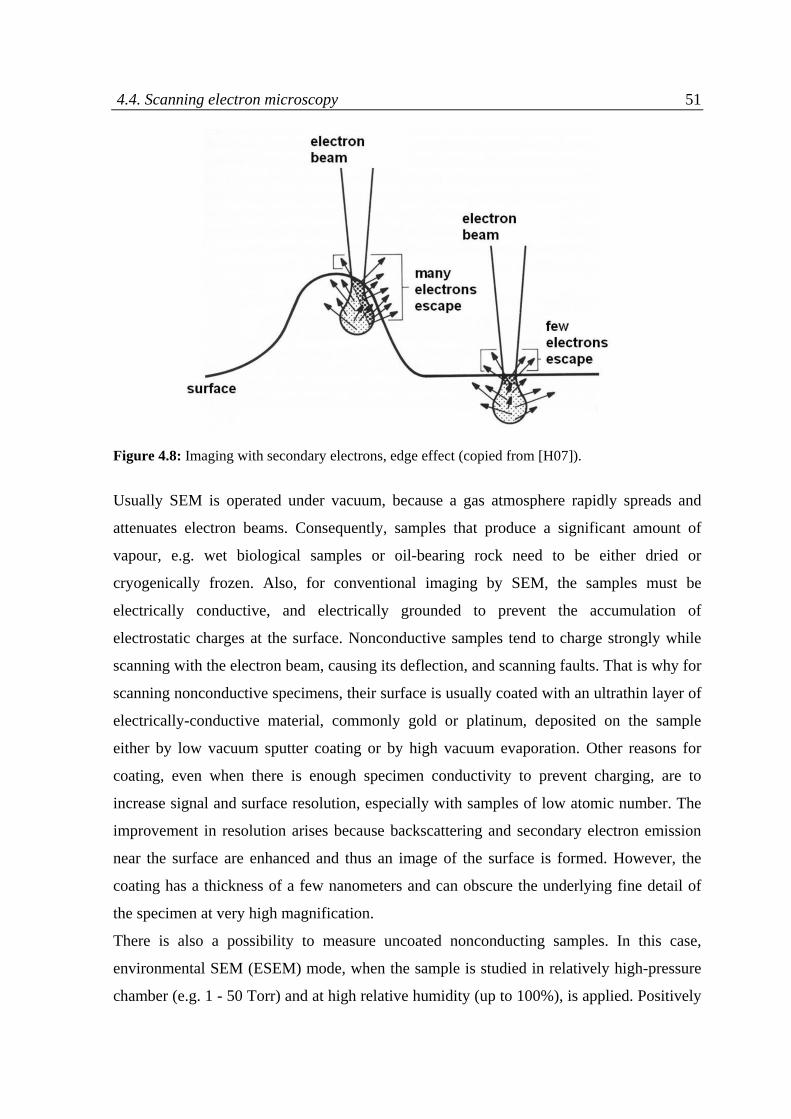
4.4. Scanning electron microscopy 51
Figure 4.8: Imaging with secondary electrons, edge effect (copied from [H07]).
Usually SEM is operated under vacuum, because a gas atmosphere rapidly spreads and
attenuates electron beams. Consequently, samples that produce a significant amount of
vapour, e.g. wet biological samples or oil-bearing rock need to be either dried or
cryogenically frozen. Also, for conventional imaging by SEM, the samples must be
electrically conductive, and electrically grounded to prevent the accumulation of
electrostatic charges at the surface. Nonconductive samples tend to charge strongly while
scanning with the electron beam, causing its deflection, and scanning faults. That is why for
scanning nonconductive specimens, their surface is usually coated with an ultrathin layer of
electrically-conductive material, commonly gold or platinum, deposited on the sample
either by low vacuum sputter coating or by high vacuum evaporation. Other reasons for
coating, even when there is enough specimen conductivity to prevent charging, are to
increase signal and surface resolution, especially with samples of low atomic number. The
improvement in resolution arises because backscattering and secondary electron emission
near the surface are enhanced and thus an image of the surface is formed. However, the
coating has a thickness of a few nanometers and can obscure the underlying fine detail of
the specimen at very high magnification.
There is also a possibility to measure uncoated nonconducting samples. In this case,
environmental SEM (ESEM) mode, when the sample is studied in relatively high-pressure
chamber (e.g. 1 - 50 Torr) and at high relative humidity (up to 100%), is applied. Positively
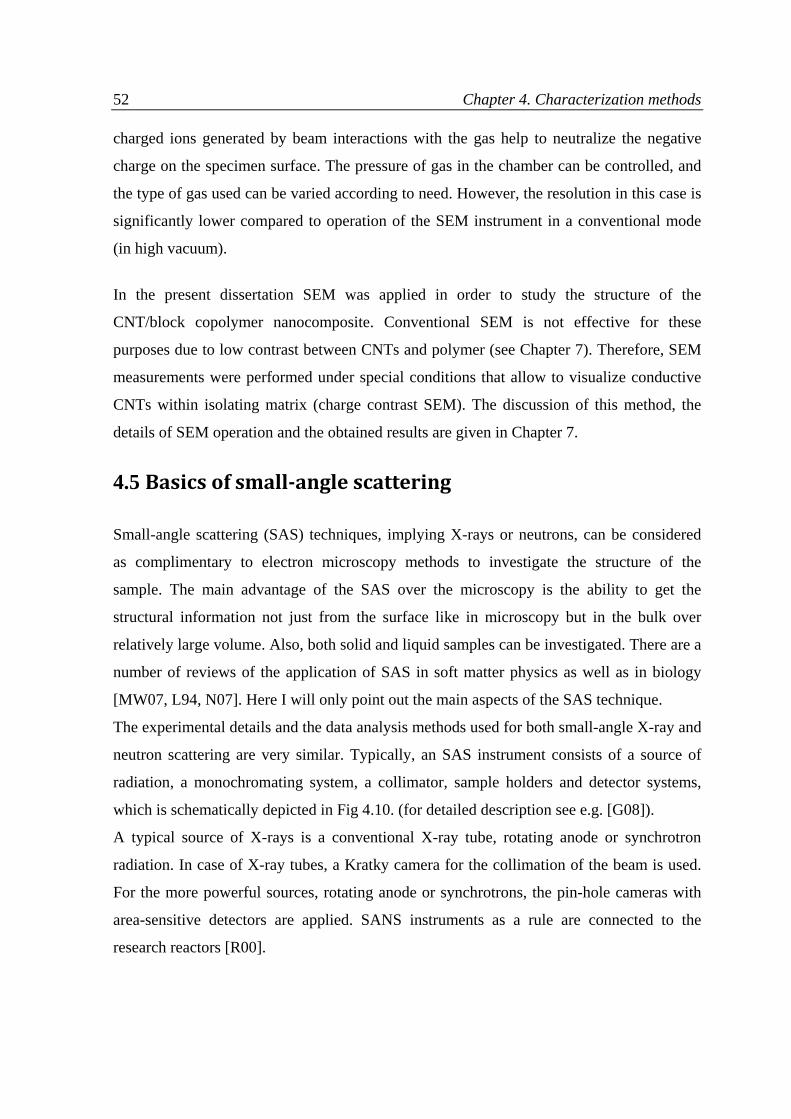
52 Chapter 4. Characterization methods charged ions generated by beam interactions with the gas help to neutralize the negative
charge on the specimen surface. The pressure of gas in the chamber can be controlled, and
the type of gas used can be varied according to need. However, the resolution in this case is
significantly lower compared to operation of the SEM instrument in a conventional mode
(in high vacuum).
In the present dissertation SEM was applied in order to study the structure of the
CNT/block copolymer nanocomposite. Conventional SEM is not effective for these
purposes due to low contrast between CNTs and polymer (see Chapter 7). Therefore, SEM
measurements were performed under special conditions that allow to visualize conductive
CNTs within isolating matrix (charge contrast SEM). The discussion of this method, the
details of SEM operation and the obtained results are given in Chapter 7.
4.5 Basics of smallangle scattering
Small-angle scattering (SAS) techniques, implying X-rays or neutrons, can be considered
as complimentary to electron microscopy methods to investigate the structure of the
sample. The main advantage of the SAS over the microscopy is the ability to get the
structural information not just from the surface like in microscopy but in the bulk over
relatively large volume. Also, both solid and liquid samples can be investigated. There are a
number of reviews of the application of SAS in soft matter physics as well as in biology
[MW07, L94, N07]. Here I will only point out the main aspects of the SAS technique.
The experimental details and the data analysis methods used for both small-angle X-ray and
neutron scattering are very similar. Typically, an SAS instrument consists of a source of
radiation, a monochromating system, a collimator, sample holders and detector systems,
which is schematically depicted in Fig 4.10. (for detailed description see e.g. [G08]).
A typical source of X-rays is a conventional X-ray tube, rotating anode or synchrotron
radiation. In case of X-ray tubes, a Kratky camera for the collimation of the beam is used.
For the more powerful sources, rotating anode or synchrotrons, the pin-hole cameras with
area-sensitive detectors are applied. SANS instruments as a rule are connected to the
research reactors [R00].
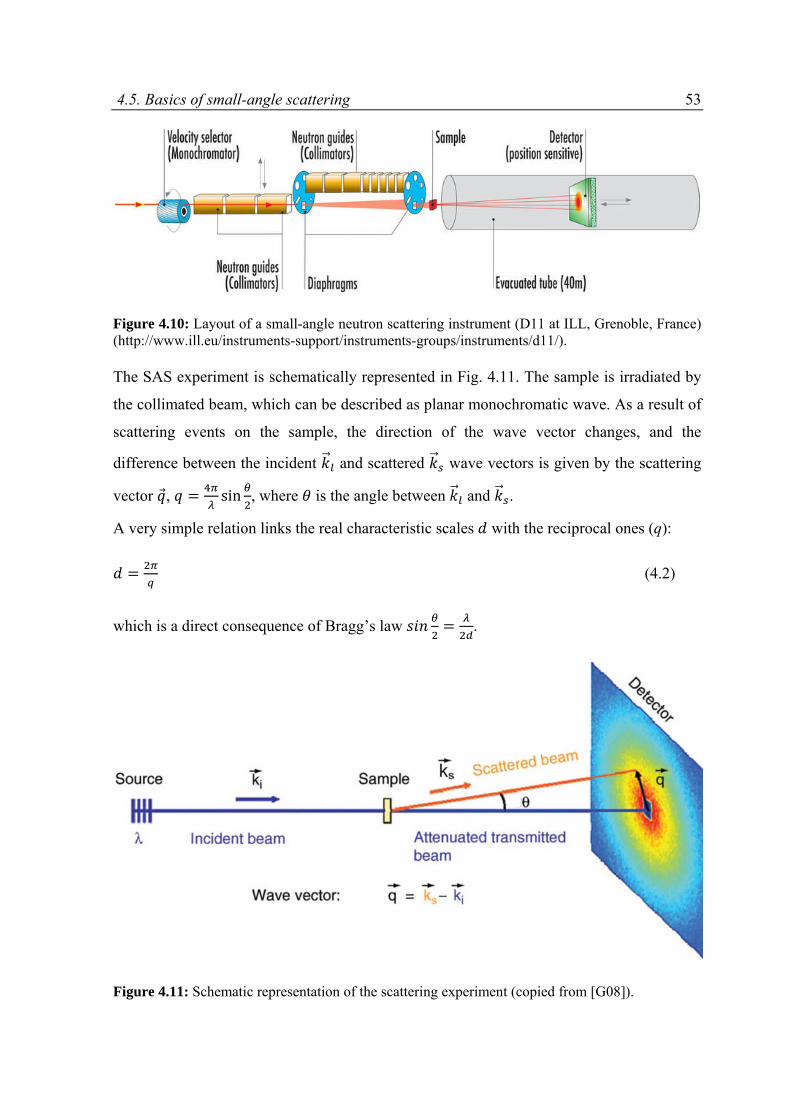
4.5. Basics of small-angle scattering 53
Figure 4.10: Layout of a small-angle neutron scattering instrument (D11 at ILL, Grenoble, France) (http://www.ill.eu/instruments-support/instruments-groups/instruments/d11/).
The SAS experiment is schematically represented in Fig. 4.11. The sample is irradiated by
the collimated beam, which can be described as planar monochromatic wave. As a result of
scattering events on the sample, the direction of the wave vector changes, and the
difference between the incident and scattered wave vectors is given by the scattering
vector , sin , where is the angle between and .
A very simple relation links the real characteristic scales with the reciprocal ones (q):
(4.2)
which is a direct consequence of Bragg’s law .
Figure 4.11: Schematic representation of the scattering experiment (copied from [G08]).
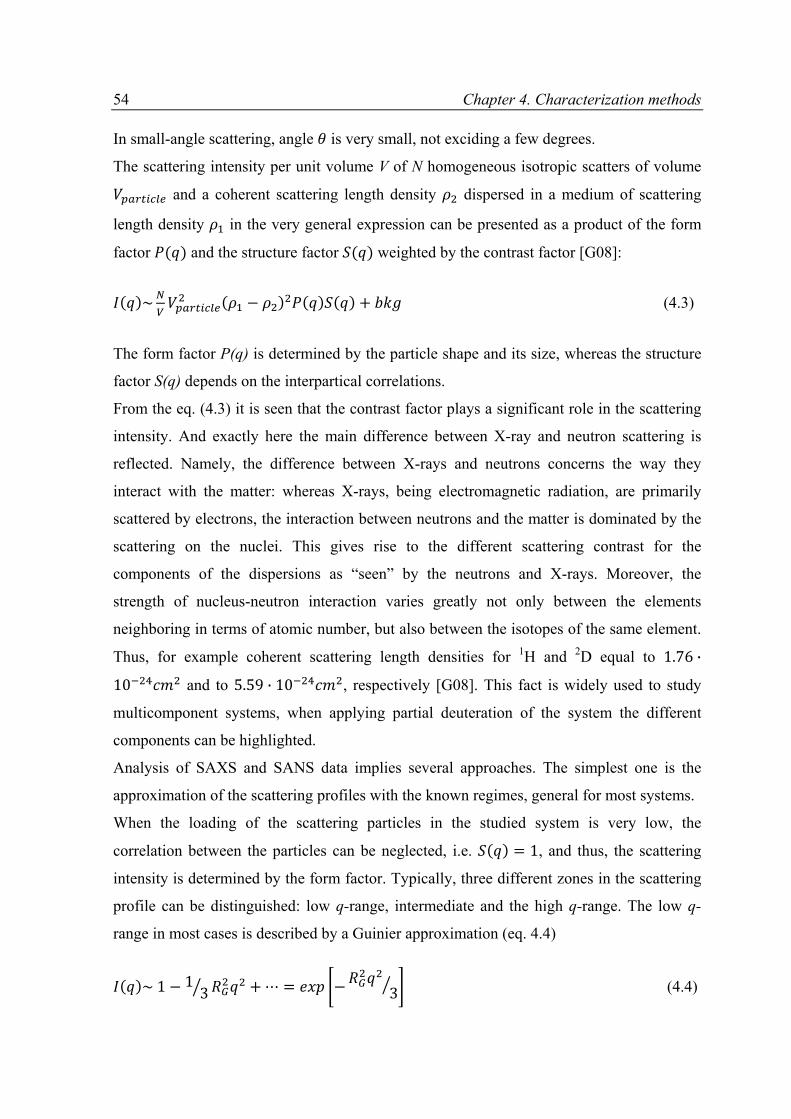
54 Chapter 4. Characterization methods In small-angle scattering, angle is very small, not exciding a few degrees.
The scattering intensity per unit volume V of N homogeneous isotropic scatters of volume
and a coherent scattering length density dispersed in a medium of scattering
length density in the very general expression can be presented as a product of the form
factor and the structure factor weighted by the contrast factor [G08]:
~ (4.3)
The form factor P(q) is determined by the particle shape and its size, whereas the structure
factor S(q) depends on the interpartical correlations.
From the eq. (4.3) it is seen that the contrast factor plays a significant role in the scattering
intensity. And exactly here the main difference between X-ray and neutron scattering is
reflected. Namely, the difference between X-rays and neutrons concerns the way they
interact with the matter: whereas X-rays, being electromagnetic radiation, are primarily
scattered by electrons, the interaction between neutrons and the matter is dominated by the
scattering on the nuclei. This gives rise to the different scattering contrast for the
components of the dispersions as “seen” by the neutrons and X-rays. Moreover, the
strength of nucleus-neutron interaction varies greatly not only between the elements
neighboring in terms of atomic number, but also between the isotopes of the same element.
Thus, for example coherent scattering length densities for 1H and 2D equal to 1.76 ·
10 and to 5.59 · 10 , respectively [G08]. This fact is widely used to study
multicomponent systems, when applying partial deuteration of the system the different
components can be highlighted.
Analysis of SAXS and SANS data implies several approaches. The simplest one is the
approximation of the scattering profiles with the known regimes, general for most systems.
When the loading of the scattering particles in the studied system is very low, the
correlation between the particles can be neglected, i.e. 1, and thus, the scattering
intensity is determined by the form factor. Typically, three different zones in the scattering
profile can be distinguished: low q-range, intermediate and the high q-range. The low q-
range in most cases is described by a Guinier approximation (eq. 4.4)
~ 1 13 3 (4.4)
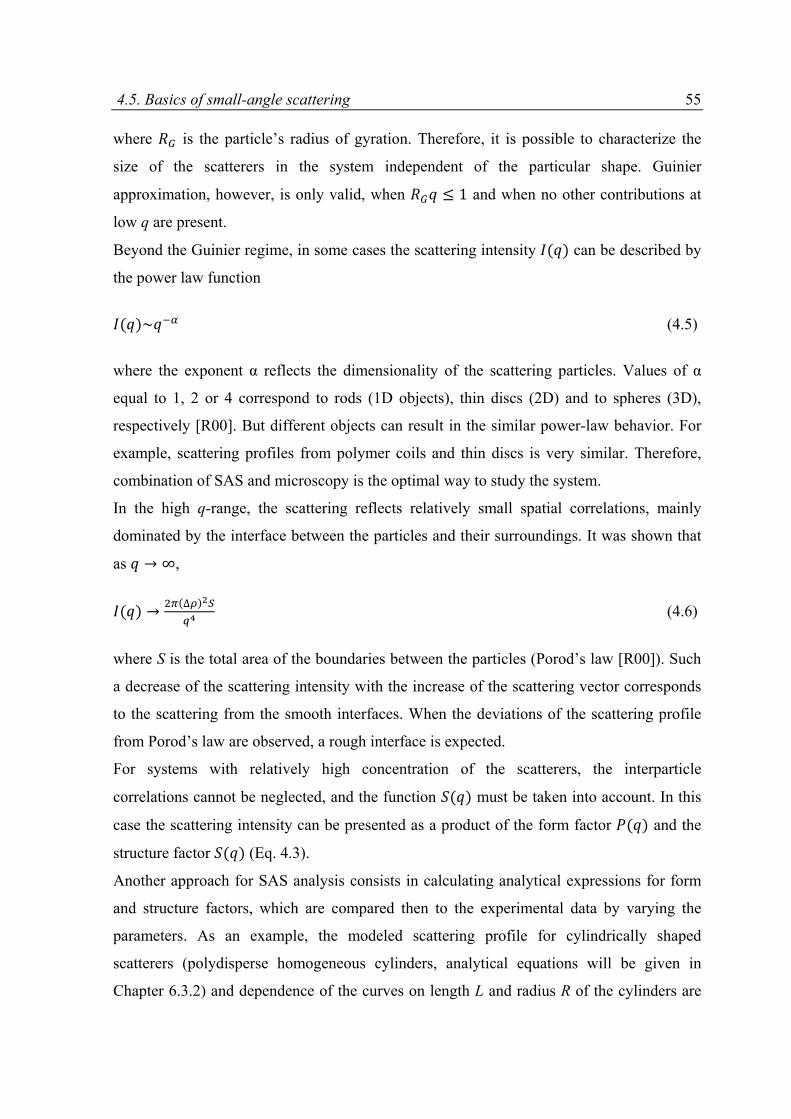
4.5. Basics of small-angle scattering 55 where is the particle’s radius of gyration. Therefore, it is possible to characterize the
size of the scatterers in the system independent of the particular shape. Guinier
approximation, however, is only valid, when 1 and when no other contributions at
low q are present.
Beyond the Guinier regime, in some cases the scattering intensity can be described by
the power law function
~ (4.5)
where the exponent α reflects the dimensionality of the scattering particles. Values of α
equal to 1, 2 or 4 correspond to rods (1D objects), thin discs (2D) and to spheres (3D),
respectively [R00]. But different objects can result in the similar power-law behavior. For
example, scattering profiles from polymer coils and thin discs is very similar. Therefore,
combination of SAS and microscopy is the optimal way to study the system.
In the high q-range, the scattering reflects relatively small spatial correlations, mainly
dominated by the interface between the particles and their surroundings. It was shown that
as ∞,
∆ (4.6)
where S is the total area of the boundaries between the particles (Porod’s law [R00]). Such
a decrease of the scattering intensity with the increase of the scattering vector corresponds
to the scattering from the smooth interfaces. When the deviations of the scattering profile
from Porod’s law are observed, a rough interface is expected.
For systems with relatively high concentration of the scatterers, the interparticle
correlations cannot be neglected, and the function must be taken into account. In this
case the scattering intensity can be presented as a product of the form factor and the
structure factor (Eq. 4.3).
Another approach for SAS analysis consists in calculating analytical expressions for form
and structure factors, which are compared then to the experimental data by varying the
parameters. As an example, the modeled scattering profile for cylindrically shaped
scatterers (polydisperse homogeneous cylinders, analytical equations will be given in
Chapter 6.3.2) and dependence of the curves on length L and radius R of the cylinders are
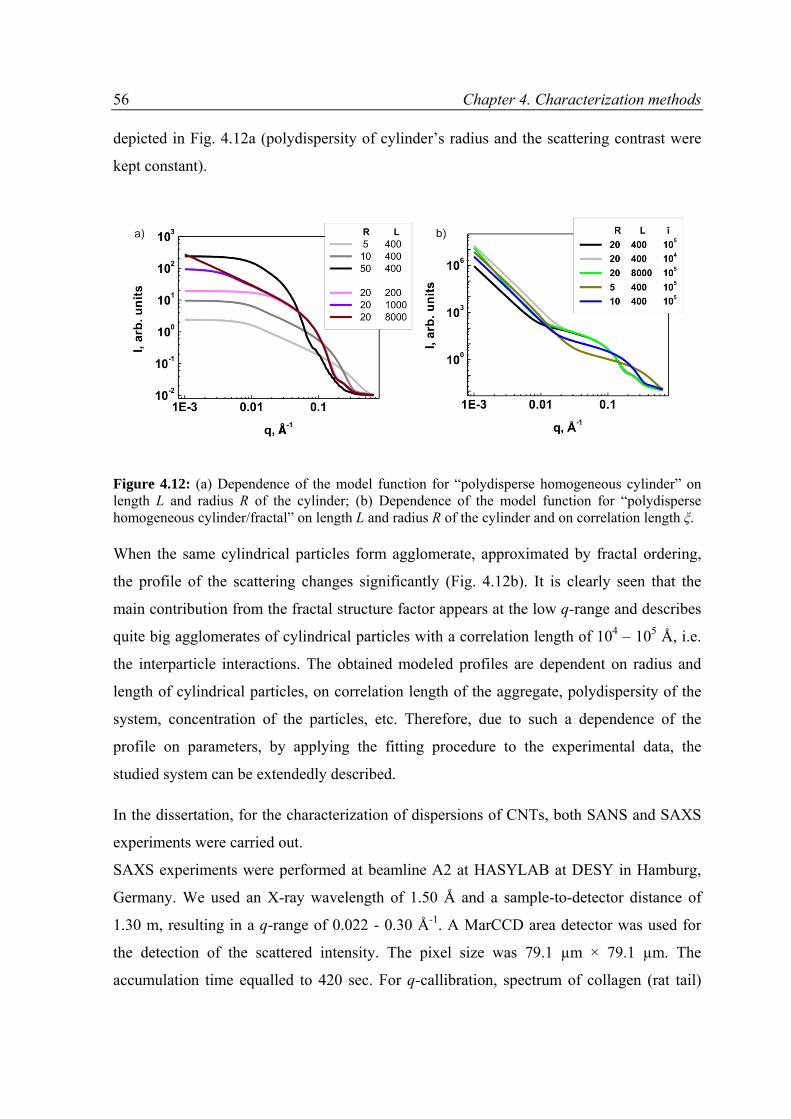
56 Chapter 4. Characterization methods depicted in Fig. 4.12a (polydispersity of cylinder’s radius and the scattering contrast were
kept constant).
Figure 4.12: (a) Dependence of the model function for “polydisperse homogeneous cylinder” on length L and radius R of the cylinder; (b) Dependence of the model function for “polydisperse homogeneous cylinder/fractal” on length L and radius R of the cylinder and on correlation length ξ.
When the same cylindrical particles form agglomerate, approximated by fractal ordering,
the profile of the scattering changes significantly (Fig. 4.12b). It is clearly seen that the
main contribution from the fractal structure factor appears at the low q-range and describes
quite big agglomerates of cylindrical particles with a correlation length of 104 – 105 Å, i.e.
the interparticle interactions. The obtained modeled profiles are dependent on radius and
length of cylindrical particles, on correlation length of the aggregate, polydispersity of the
system, concentration of the particles, etc. Therefore, due to such a dependence of the
profile on parameters, by applying the fitting procedure to the experimental data, the
studied system can be extendedly described.
In the dissertation, for the characterization of dispersions of CNTs, both SANS and SAXS
experiments were carried out.
SAXS experiments were performed at beamline A2 at HASYLAB at DESY in Hamburg,
Germany. We used an X-ray wavelength of 1.50 Å and a sample-to-detector distance of
1.30 m, resulting in a q-range of 0.022 - 0.30 Å-1. A MarCCD area detector was used for
the detection of the scattered intensity. The pixel size was 79.1 µm × 79.1 µm. The
accumulation time equalled to 420 sec. For q-callibration, spectrum of collagen (rat tail)
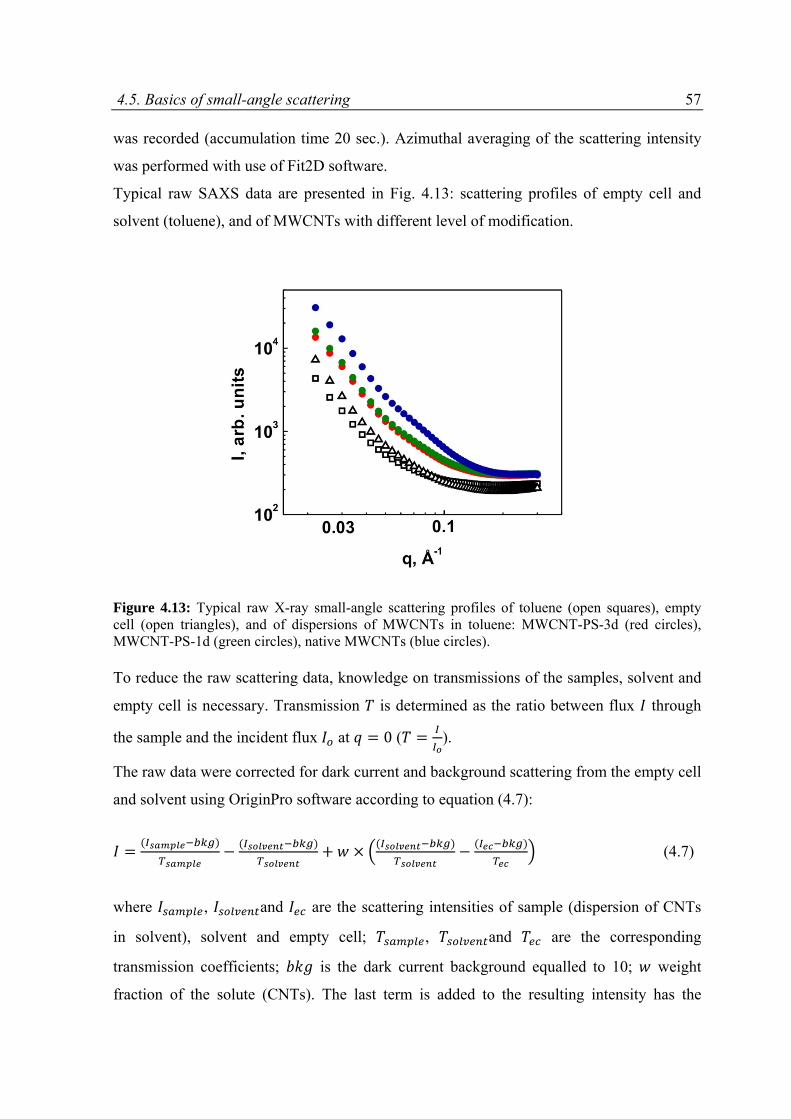
4.5. Basics of small-angle scattering 57 was recorded (accumulation time 20 sec.). Azimuthal averaging of the scattering intensity
was performed with use of Fit2D software.
Typical raw SAXS data are presented in Fig. 4.13: scattering profiles of empty cell and
solvent (toluene), and of MWCNTs with different level of modification.
Figure 4.13: Typical raw X-ray small-angle scattering profiles of toluene (open squares), empty cell (open triangles), and of dispersions of MWCNTs in toluene: MWCNT-PS-3d (red circles), MWCNT-PS-1d (green circles), native MWCNTs (blue circles).
To reduce the raw scattering data, knowledge on transmissions of the samples, solvent and
empty cell is necessary. Transmission is determined as the ratio between flux through
the sample and the incident flux at 0 ( ).
The raw data were corrected for dark current and background scattering from the empty cell
and solvent using OriginPro software according to equation (4.7):
(4.7)
where , and are the scattering intensities of sample (dispersion of CNTs
in solvent), solvent and empty cell; , and are the corresponding
transmission coefficients; is the dark current background equalled to 10; weight
fraction of the solute (CNTs). The last term is added to the resulting intensity has the
58 Chapter 4. Characterization methods following meaning: when subtracting the scattering intensity of solvent from the sample
intensity, we subtract more than necessary, since the sample contains 1 wt.% of
solvent. However, because the concentration of CNTs is low (0.001 wt.%), the last term
gives only small contribution and can be skipped.
SANS experiments on the CNTs’ dispersions were carried out at the instrument D11 at ILL
(Grenoble, France) [LMT92]. The measurements were done in both D-toluene and in the
mixture C7H8/C7D8=89/11 vol.% (HD-toluene), which allowed us to highlight the modifier
of the CNTs (polymer shell) and the bare CNTs, respectively. The coherent scattering
length densities (SLD) of D-toluene, HD-toluene, PS, and CNTs are 5.66 × 10⁻⁶ Å-2, 1.40 ×
10-6 Å-2, 1.44 × 10⁻⁶ Å-2, and 4.7 - 5.7 × 10⁻⁶ Å-2 , respectively [NIST, Scattering length
density calculator, http://www.ncnr.nist.gov/resources/sldcalc.html] (the mass densities of
toluene, PS, and CNTs (according to specifications) are 0.87, 1.05, 1.3 - 1.5 g/cm3 and 1.5-
1.7 g/cm3, respectively).
The experiments were carried out at sample-to-detector distances of 1.2 m, 8 m and 20 m
and a neutron wavelength of 8 Å, resulting in a q-range of 0.0025 - 0.3 Å-1. SANS images
were taken with accumulation times between 300 and 7200 sec., depending on the sample
and sample-to-detector distance. The beam center was defined by the examining the
scattering from PTFE, which is a symmetrical scatterer.
The background is measured by stopping the incoming beam with a piece of Cadmium.
Cadmium is a strong neutron absorber, thus, what is measured on the detector in this case
comes from electronic noise, cosmic and instrument invironment. For absolute intensity
calibration, spectrum of water filled into sample cell, was recorded.
The data reduction implies [GER06]:
1) the detector correction calculated as
, (4.8)
where is scattering intensity from water, filled into empty cell, and is the
corresponding transmission; and is scattering from empty cell and its
transmission; – background intensity.
2) The signals from sample (dispersions of CNTs in solvent) and solvent were
normalized by this factor. This was done with use of programs spolly and
anpolly provided by ILL [GER06].

4.5. Basics of small-angle scattering 59
3) The subtraction the sample cell with solvent from the sample (dispersions of
CNTs in solvent):
, (4.9)
where intensity and transmission stand for the sample
(dispersion of CNTs in solvent), whereas and correspond to
solvent.
Background subtraction and azimuthal averaging were performed with use of software
provided by ILL.

60 Chapter 4. Characterization methods
5 Chemical modification of CNTs with polymer grafts
5.1 State of the art
General discussion of grafting to and grafting from approaches for covalent modification of
CNTs with polymers was given in Chapter 2.3.3. Since the present work is focused on
chemical modification of CNTs with PS, the detailed review of various grafting to and
grafting from approaches will be presented on the example of the covalent grafting of PS
chains onto the CNTs framework.
Grafting to approach as mentioned in the Background section is realized by various
methods like ATRP, cycloaddition, anionic polymerization, etc. Many of them were
applied for covalent modification of CNTs with PS grafts. For example, ATRP conditions
for surface modification with PS, first adapted for modification of fullerenes C60 [ZCD+99,
ZCH+00], were applied by Wu et al. for MWCNTs [WTQ+07]. In the suggested method,
bromine-ended PS synthesized by ATRP was allowed to react directly with MWCNTs in
1,2-dichlorobenzene under ATRP conditions using CuBr/2,20-bipyridine as a catalyst
system. It was assumed that CNTs were initiated by PS-radicals to open their π-bonds and
PS could bond to the sidewalls of CNTs to form a covalent C–C bonding between CNT
framework and PS chains. The mass fraction of the resulting PS grafts was found to be
high, 40 - 55 wt.%. Another grafting to approach for modification of SWCNTs was
62 Chapter 5. Chemical modification of CNTs with polymer grafts realized via condensation reaction [HKK+04]. First, the CNTs were chemically modified
by carboxylic acid functionalities, formed at the open ends of the SWCNTs during the
purification and cutting processes in concentric acids, followed by the conversion of the
carboxy-groups on the CNTs’ surface into the acid chloride ones. Finally, the grafting of
amino-terminated PS was achieved via condensation reactions between the amine groups of
PS chains and CNTs acid chloride units, the reaction was performed at 90 °C and nitrogen
atmosphere during 5 days. The resulted PS-grafted SWCNTs contained about 25 wt.% of
PS chains and exhibited improved dispersion ability in dichloromethane and aromatic
solvents (e.g., benzene, toluene). Mountrichas et al. performed grafting of PS chains to a
variety of CNTs, i.e. shorted-MWCNTs, MWCNTs and SWCNTs, by utilizing anionic
polymerization high vacuum techniques in both, the synthesis of PS chains and the
functionalization reaction [MPT08]. The use of high vacuum in all steps of the procedure
was necessary in order to ensure the stability of the anions during the reaction, as well as
the uniformity of the grafted polymer chains. The reason for this is that the suggested
reaction is based on use of carbonions, and carbonions though expected to react readily
with the sidewalls of CNTs [VCY+03] are known to be easily deactivated from the oxygen
and the humidity of the atmosphere [HIP+00, UM05]. Therefore, quite a complex, specially
designed, reactor is needed for the successful realization of the suggested reaction.
Depending on the molecular weight of PS chains and the type of CNTs, the weight
percentage of the grafted PS chains was found to be in the range 16 – 82 wt.%. Liu et al.
suggested another grafting to approach applied for modification of the shortened SWCNTs
with both PS and poly[(tert-butyl acrylate)-b-styrene] [LYA05]. The polymers, prepared by
living nitroxide-mediated free-radical polymerization, were covalently attached to
SWCNTs through thermolytic release of the nitroxide end groups in the presence of
SWCNTs, which led to an efficient radical coupling of the polymers to the nanotube
sidewalls. The resulting polymer-functionalized CNTs, containing up to 80 and 50 wt.% of
PS and poly[(tert-butyl acrylate)-b-styrene] copolymer, respectively, were highly soluble in
number of organic solvents, and the solubility could be controlled by varying the chemical
composition of the appended polymers.
To functionalize SWCNTs with PS, both grafting to and grafting from approachess were
applied by Qin et al. [QQF+04]. Grafting to functionalization was realized by
cycloaddition of PS-N3 to the sidewalls of SWCNTs. Well-defined PS-N3 macromolecules
were prepared by ATRP of styrene followed by end group transformation from the PS-Br
5.1. State of the art 63 form to PS-N3 by reaction with sodium azide in DMF. The functionalization level of the
CNTs was found to be one PS chain per 48 carbon atoms of SWCNT, which is high for the
grafting to approach. Grafting from was performed by ATRP of styrene monomer from
SWCNTs that were functionalized with one ATRP initiator (bromopropionate groups) per
240 carbon atoms of SWCNT. The polymerization was carried out in 1,2-dichlorobenzene
at 110 °C, and Methyl 2-bromopropionate was added as a free initiator to control the chain
propagation from solid surface and to monitor the polymerization kinetics. By both grafting
methods, increasing the PS content increased the solubility of CNTs in organic solvents.
Also, AFM imaging showed that the original SWCNTs bundles were broken into very
small ropes or even individual tubes by functionalization and polymerization.
Nayak et al. suggested quite an efficient but still very laborious method for modification of
CNTs with PS grafts utilizing grafting from approach [NSR08]. The first step is an
oxidation procedure of CNTs with nitric acid, which leads to removal of the residual
catalyst, and functionalization of the SWCNTs with carboxylic acids at the open ends and
at the defective sites of the CNT walls. Subsequent SOCl2 treatment leads to the formation
of acid chlorides on the surface of CNTs. Grafting of the first styrene unit onto the surface
of SWCNT-COCl has been carried out using ZnO as the Friedel Crafts catalyst in solvent
free condition, when an aromatic compound undergoes electrophilic substitution with an
acylating agent in the presence of a catalyst. Subsequent grafting of PS from the surface of
SWCNTs was performed through free radical polymerization using benzoyl peroxide as the
initiator in an excess of styrene monomer. This protocol for finctionalization of CNTs
resulted in a successful grafting of PS onto SWCNTs with a mass fraction of PS grafts up
to 50 wt.%. Another example of laborious, though efficient, procedure of grafting from
technique was demonstrated by Yang et al. [YXW+06]. PS-grafted MWCNTs with a hairy-
rod nanostructure were synthesized by the in situ free-radical polymerization of styrene in
the presence of MWCNTs terminated with vinyl groups. During the vinylation of
MWCNTs, which was performed in three-step process, the vinyl groups are attached to the
nanotube surfaces via an amide covalent bond.
Surely, one can find many other protocols for polymerization on CNTs. However, as it can
be seen, all the aforementioned schemes for the functionalization of CNTs involve
multistep organic syntheses. Mainly, the preparation protocols are rigorous and time-
consuming. Moreover, as a rule, the first step of any surface chemistry on CNTs is the acid
treatment of the CNTs. This procedure is known to be effective to remove the impurities
64 Chapter 5. Chemical modification of CNTs with polymer grafts and metal catalysts; along with the purification, the acid treatment results in introduction of
the carboxylic, hydroxylic and other groups to the surface of CNTs, which significantly
facilitates the grafting of other molecules onto the CNTs framework. However, such a
purification procedure with use of concentrated acids is very aggressive to the CNTs and
leads to cutting the CNTs into pieces, shortening them and destroying the honeycomb
lattice [YJP+08].
Only a few works suggest the modification of native, non-acid treated CNTs. Among them
is the functionalization of the CNTs with PS via in situ thermo-induced radical
polymerization [L09]. In the suggested polymerizing conditions, the PS grafted MWCNTs
were successfully prepared via the free radical addition reaction by the in situ thermo-
induced bulk polymerization in the presence of MWCNTs. The free PS chain radicals,
formed by thermo-induced polymerization of the monomer, were presumably added onto
the surfaces of the MWCNTs due to breaking of the π-bonds on MWCNT surface with the
PS chain free radicals and therefore the graft polymerization was conducted from the active
centers on the MWCNT surface. The MWCNTs functionalized with PS by means of
suggested mechanism, like in other works, exhibited efficiently improved dispersibility in
organic solvents such as toluene. Also, Viswanathan et al. reported on anionic
polymerization approach for attachment of PS chains to full-length pristine SWCNTs
[VCY+03]. The other quite an easy way to modify the CNTs with PS grafts was suggested
by H. Xu et al. [XWZ+06]. The synthesis of PS-grafted MWCNTs was performed by
single-step in situ polymerization under irradiation of the reactive mixture of MWCNTs
and styrene monomers by 60Co γ-ray for 48 h. The polymer content in the obtained
modified CNTs was found to be up to 15 wt.%, that significantly improves the
dispersibility of the CNTs in common organic solvents such as THF, toluene, and CHCl3. It
was assumed that the functionalization of MWCNTs under γ-ray irradiation involves both
grafting to and grafting from mechanisms: The propagating PS chains, generated by the
radiolysis of styrene monomers and subsequent polymerization under γ-ray irradiation,
have a high tendency to react with unsaturated double bonds on MWCNTs and readily
functionalize them via the grafting to method. For the grafting from mechanism, the tips
and defects of MWCNTs might be easily destroyed by the high-energy γ-ray, which
produces radicals in situ at the CNT surface [SDR+04, PQW+04]. The radicals can then
readily initiate the polymerization of styrene.
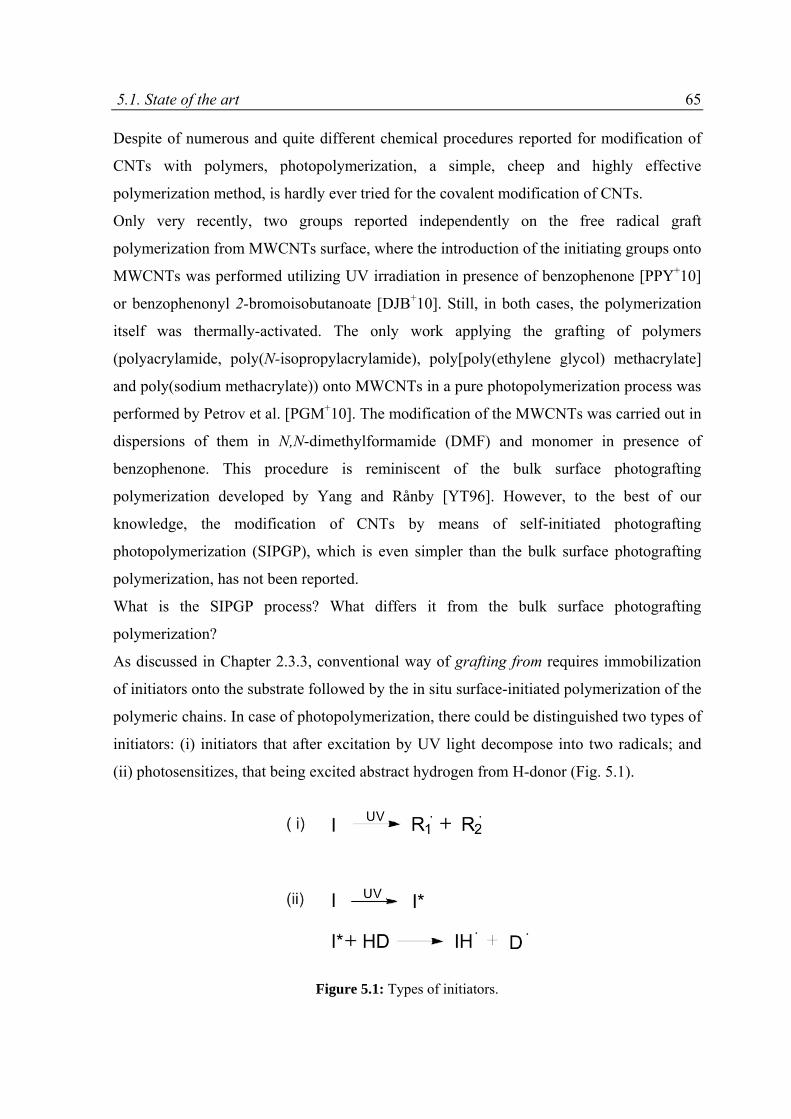
5.1. State of the art 65 Despite of numerous and quite different chemical procedures reported for modification of
CNTs with polymers, photopolymerization, a simple, cheep and highly effective
polymerization method, is hardly ever tried for the covalent modification of CNTs.
Only very recently, two groups reported independently on the free radical graft
polymerization from MWCNTs surface, where the introduction of the initiating groups onto
MWCNTs was performed utilizing UV irradiation in presence of benzophenone [PPY+10]
or benzophenonyl 2-bromoisobutanoate [DJB+10]. Still, in both cases, the polymerization
itself was thermally-activated. The only work applying the grafting of polymers
(polyacrylamide, poly(N-isopropylacrylamide), poly[poly(ethylene glycol) methacrylate]
and poly(sodium methacrylate)) onto MWCNTs in a pure photopolymerization process was
performed by Petrov et al. [PGM+10]. The modification of the MWCNTs was carried out in
dispersions of them in N,N-dimethylformamide (DMF) and monomer in presence of
benzophenone. This procedure is reminiscent of the bulk surface photografting
polymerization developed by Yang and Rånby [YT96]. However, to the best of our
knowledge, the modification of CNTs by means of self-initiated photografting
photopolymerization (SIPGP), which is even simpler than the bulk surface photografting
polymerization, has not been reported.
What is the SIPGP process? What differs it from the bulk surface photografting
polymerization?
As discussed in Chapter 2.3.3, conventional way of grafting from requires immobilization
of initiators onto the substrate followed by the in situ surface-initiated polymerization of the
polymeric chains. In case of photopolymerization, there could be distinguished two types of
initiators: (i) initiators that after excitation by UV light decompose into two radicals; and
(ii) photosensitizes, that being excited abstract hydrogen from H-donor (Fig. 5.1).
Figure 5.1: Types of initiators.
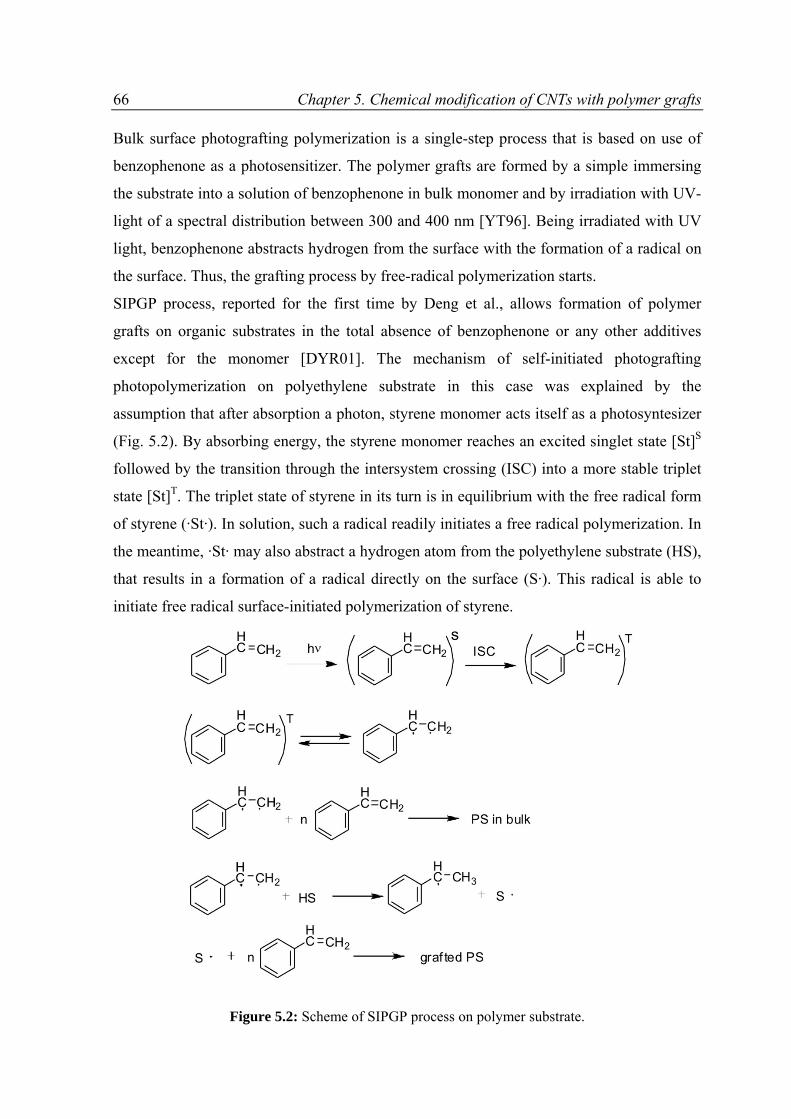
66 Chapter 5. Chemical modification of CNTs with polymer grafts Bulk surface photografting polymerization is a single-step process that is based on use of
benzophenone as a photosensitizer. The polymer grafts are formed by a simple immersing
the substrate into a solution of benzophenone in bulk monomer and by irradiation with UV-
light of a spectral distribution between 300 and 400 nm [YT96]. Being irradiated with UV
light, benzophenone abstracts hydrogen from the surface with the formation of a radical on
the surface. Thus, the grafting process by free-radical polymerization starts.
SIPGP process, reported for the first time by Deng et al., allows formation of polymer
grafts on organic substrates in the total absence of benzophenone or any other additives
except for the monomer [DYR01]. The mechanism of self-initiated photografting
photopolymerization on polyethylene substrate in this case was explained by the
assumption that after absorption a photon, styrene monomer acts itself as a photosyntesizer
(Fig. 5.2). By absorbing energy, the styrene monomer reaches an excited singlet state [St]S
followed by the transition through the intersystem crossing (ISC) into a more stable triplet
state [St]T. The triplet state of styrene in its turn is in equilibrium with the free radical form
of styrene (·St·). In solution, such a radical readily initiates a free radical polymerization. In
the meantime, ·St· may also abstract a hydrogen atom from the polyethylene substrate (HS),
that results in a formation of a radical directly on the surface (S·). This radical is able to
initiate free radical surface-initiated polymerization of styrene.
Figure 5.2: Scheme of SIPGP process on polymer substrate.
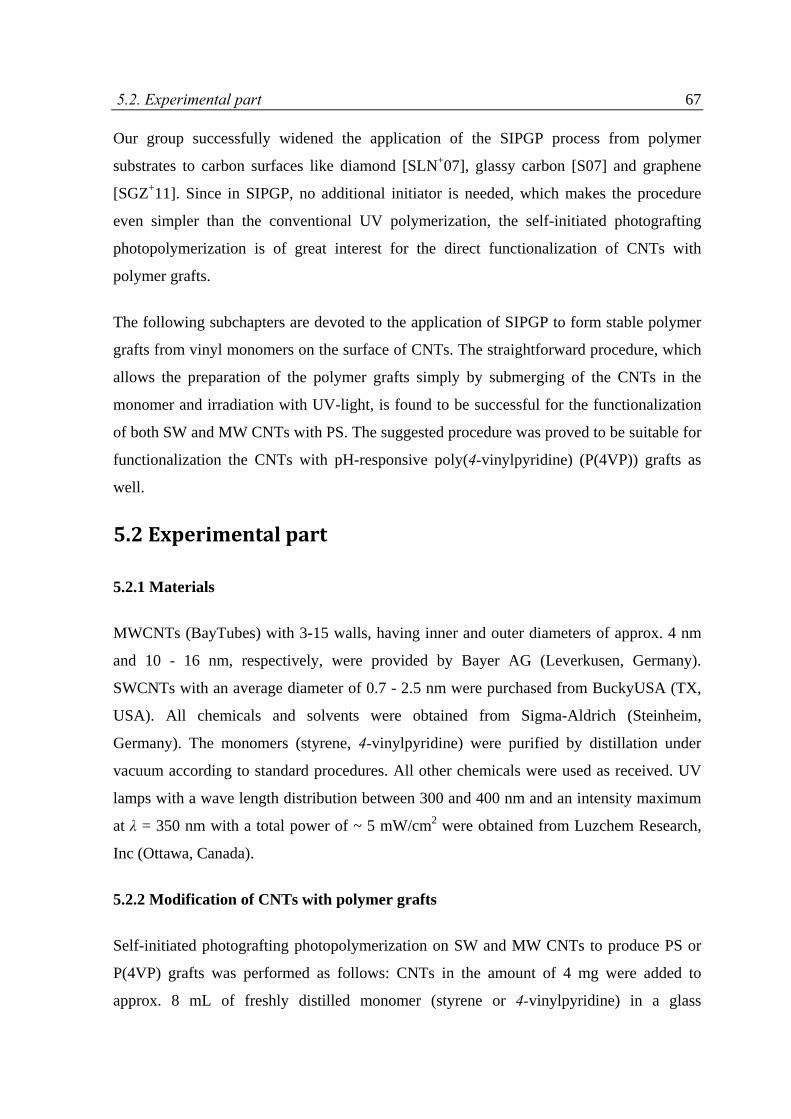
5.2. Experimental part 67 Our group successfully widened the application of the SIPGP process from polymer
substrates to carbon surfaces like diamond [SLN+07], glassy carbon [S07] and graphene
[SGZ+11]. Since in SIPGP, no additional initiator is needed, which makes the procedure
even simpler than the conventional UV polymerization, the self-initiated photografting
photopolymerization is of great interest for the direct functionalization of CNTs with
polymer grafts.
The following subchapters are devoted to the application of SIPGP to form stable polymer
grafts from vinyl monomers on the surface of CNTs. The straightforward procedure, which
allows the preparation of the polymer grafts simply by submerging of the CNTs in the
monomer and irradiation with UV-light, is found to be successful for the functionalization
of both SW and MW CNTs with PS. The suggested procedure was proved to be suitable for
functionalization the CNTs with pH-responsive poly(4-vinylpyridine) (P(4VP)) grafts as
well.
5.2 Experimental part
5.2.1 Materials
MWCNTs (BayTubes) with 3-15 walls, having inner and outer diameters of approx. 4 nm
and 10 - 16 nm, respectively, were provided by Bayer AG (Leverkusen, Germany).
SWCNTs with an average diameter of 0.7 - 2.5 nm were purchased from BuckyUSA (TX,
USA). All chemicals and solvents were obtained from Sigma-Aldrich (Steinheim,
Germany). The monomers (styrene, 4-vinylpyridine) were purified by distillation under
vacuum according to standard procedures. All other chemicals were used as received. UV
lamps with a wave length distribution between 300 and 400 nm and an intensity maximum
at λ = 350 nm with a total power of ~ 5 mW/cm2 were obtained from Luzchem Research,
Inc (Ottawa, Canada).
5.2.2 Modification of CNTs with polymer grafts
Self-initiated photografting photopolymerization on SW and MW CNTs to produce PS or
P(4VP) grafts was performed as follows: CNTs in the amount of 4 mg were added to
approx. 8 mL of freshly distilled monomer (styrene or 4-vinylpyridine) in a glass
68 Chapter 5. Chemical modification of CNTs with polymer grafts photoreaction vial charged with a magnetic stirrer. After the reaction mixture was degassed
by three freeze-thaw cycles, it was ultrasonicated for 5 min to disperse the CNTs in the
monomer. Polymerization was performed at room temperature for different time periods
(0.5, 1, 2, 3 days) by irradiation with UV (λmax = 350 nm) and under constant intensive
stirring. After the polymerization, the reaction mixture was diluted with toluene or ethanol,
which are good solvents for PS or P(4VP), respectively, and was ultrasonicated for 5 - 10
min to remove non-grafted polymer from the CNT surface. The dispersion was pressure
filtered through Teflon filters (0.45 µm) and thoroughly washed with an excess of a good
solvent for the respective polymer (4 - 6 portions of approx. 50 mL of solvent). The filtrate
was collected and vacuum dried to remove the solvent.
Hereafter, we will abbreviate the CNTs as SWCNT-PS-1(3)d or MWCNT-PS-1(3)d for the
SW and MWCNTs modified with PS grafts, obtained by polymerization for 1 or 3 days,
respectively, and as SWCNT-P(4VP)-1(2)d or MWCNT-P(4VP)-1(2)d for the ones
modified with P(4VP).
The samples (native CNTs and the ones modified with polymers) were characterized with
Raman spectroscopy, TGA, and AFM. Additionally, pH-responsive behavior of MWCNT-
P(4VP)-2d in aqueous dispersions was studied.
5.3 Results and discussion
The formation of PS or P(4VP) grafts on CNTs was carried out in dispersions of CNTs in
the corresponding monomer under UV irradiation with an average wavelength of max =
350 nm. No any initiators or solvents were added, also no heating of the reaction mixture
was applied (Fig. 5.3). The only thing complicating the reaction procedure is the fact that
the presence of CNTs in monomer makes the dispersion completely black, even at the low
concentration used (0.5 mg/mL). This strongly decreases the penetration depth of UV light
into the dispersion and thus prolongs the polymerization process. Therefore, the time of
polymerization was varied between 0.5 and 3 days, though high molecular weight polymers
are formed typically already after several hours of UV irradiation [DYR01]. Also, a
constant and intense stirring of the reaction mixture during photografting
photopolymerization on CNTs is necessary in order to keep the CNTs in the dispersed state.
Moreover, because of the low penetration depth of the UV light into the black suspension
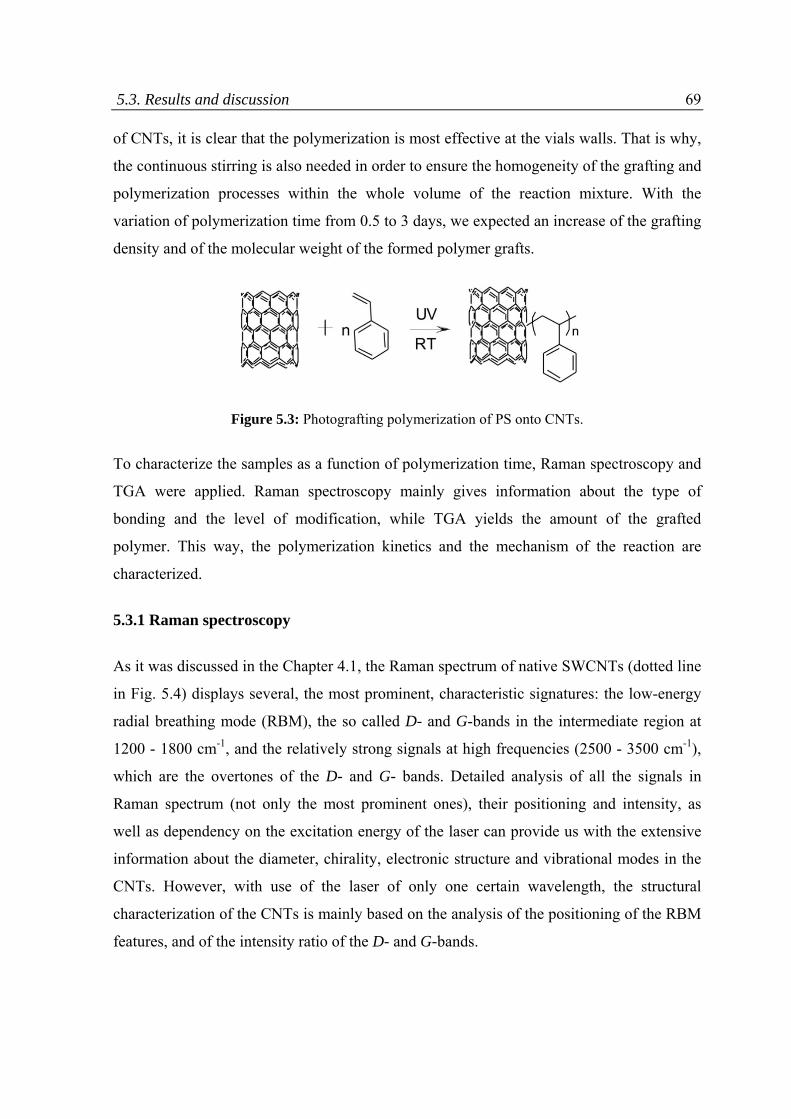
5.3. Results and discussion 69 of CNTs, it is clear that the polymerization is most effective at the vials walls. That is why,
the continuous stirring is also needed in order to ensure the homogeneity of the grafting and
polymerization processes within the whole volume of the reaction mixture. With the
variation of polymerization time from 0.5 to 3 days, we expected an increase of the grafting
density and of the molecular weight of the formed polymer grafts.
Figure 5.3: Photografting polymerization of PS onto CNTs.
To characterize the samples as a function of polymerization time, Raman spectroscopy and
TGA were applied. Raman spectroscopy mainly gives information about the type of
bonding and the level of modification, while TGA yields the amount of the grafted
polymer. This way, the polymerization kinetics and the mechanism of the reaction are
characterized.
5.3.1 Raman spectroscopy
As it was discussed in the Chapter 4.1, the Raman spectrum of native SWCNTs (dotted line
in Fig. 5.4) displays several, the most prominent, characteristic signatures: the low-energy
radial breathing mode (RBM), the so called D- and G-bands in the intermediate region at
1200 - 1800 cm-1, and the relatively strong signals at high frequencies (2500 - 3500 cm-1),
which are the overtones of the D- and G- bands. Detailed analysis of all the signals in
Raman spectrum (not only the most prominent ones), their positioning and intensity, as
well as dependency on the excitation energy of the laser can provide us with the extensive
information about the diameter, chirality, electronic structure and vibrational modes in the
CNTs. However, with use of the laser of only one certain wavelength, the structural
characterization of the CNTs is mainly based on the analysis of the positioning of the RBM
features, and of the intensity ratio of the D- and G-bands.
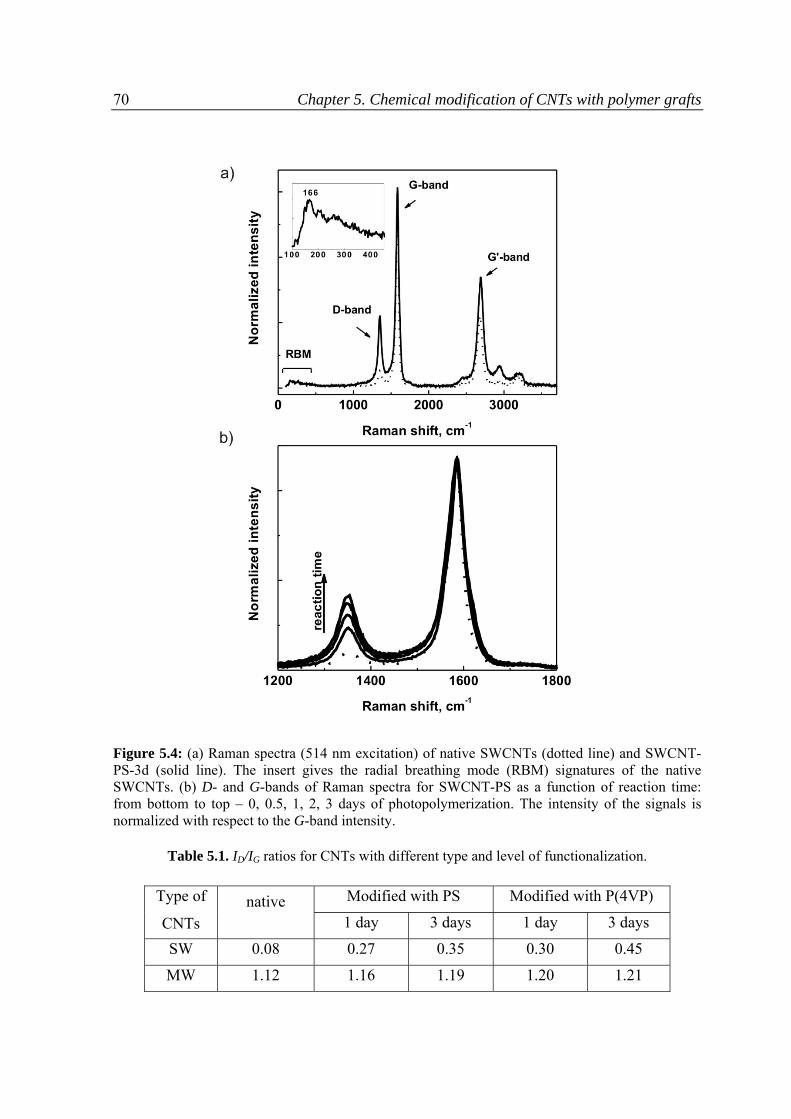
70 Chapter 5. Chemical modification of CNTs with polymer grafts
Figure 5.4: (a) Raman spectra (514 nm excitation) of native SWCNTs (dotted line) and SWCNT-PS-3d (solid line). The insert gives the radial breathing mode (RBM) signatures of the native SWCNTs. (b) D- and G-bands of Raman spectra for SWCNT-PS as a function of reaction time: from bottom to top – 0, 0.5, 1, 2, 3 days of photopolymerization. The intensity of the signals is normalized with respect to the G-band intensity.
Table 5.1. ID/IG ratios for CNTs with different type and level of functionalization.
Type of
CNTs native Modified with PS Modified with P(4VP)
1 day 3 days 1 day 3 days
SW 0.08 0.27 0.35 0.30 0.45
MW 1.12 1.16 1.19 1.20 1.21
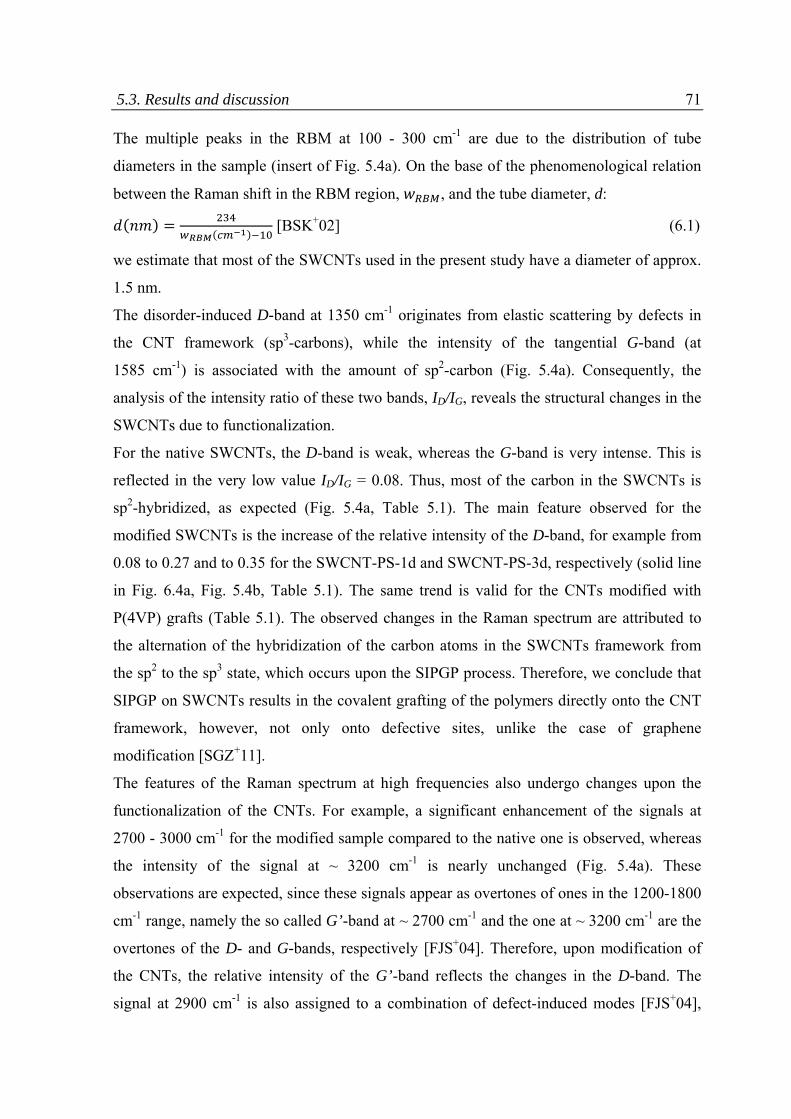
5.3. Results and discussion 71 The multiple peaks in the RBM at 100 - 300 cm-1 are due to the distribution of tube
diameters in the sample (insert of Fig. 5.4a). On the base of the phenomenological relation
between the Raman shift in the RBM region, , and the tube diameter, d:
[BSK+02] (6.1)
we estimate that most of the SWCNTs used in the present study have a diameter of approx.
1.5 nm.
The disorder-induced D-band at 1350 cm-1 originates from elastic scattering by defects in
the CNT framework (sp3-carbons), while the intensity of the tangential G-band (at
1585 cm-1) is associated with the amount of sp2-carbon (Fig. 5.4a). Consequently, the
analysis of the intensity ratio of these two bands, ID/IG, reveals the structural changes in the
SWCNTs due to functionalization.
For the native SWCNTs, the D-band is weak, whereas the G-band is very intense. This is
reflected in the very low value ID/IG = 0.08. Thus, most of the carbon in the SWCNTs is
sp2-hybridized, as expected (Fig. 5.4a, Table 5.1). The main feature observed for the
modified SWCNTs is the increase of the relative intensity of the D-band, for example from
0.08 to 0.27 and to 0.35 for the SWCNT-PS-1d and SWCNT-PS-3d, respectively (solid line
in Fig. 6.4a, Fig. 5.4b, Table 5.1). The same trend is valid for the CNTs modified with
P(4VP) grafts (Table 5.1). The observed changes in the Raman spectrum are attributed to
the alternation of the hybridization of the carbon atoms in the SWCNTs framework from
the sp2 to the sp3 state, which occurs upon the SIPGP process. Therefore, we conclude that
SIPGP on SWCNTs results in the covalent grafting of the polymers directly onto the CNT
framework, however, not only onto defective sites, unlike the case of graphene
modification [SGZ+11].
The features of the Raman spectrum at high frequencies also undergo changes upon the
functionalization of the CNTs. For example, a significant enhancement of the signals at
2700 - 3000 cm-1 for the modified sample compared to the native one is observed, whereas
the intensity of the signal at ~ 3200 cm-1 is nearly unchanged (Fig. 5.4a). These
observations are expected, since these signals appear as overtones of ones in the 1200-1800
cm-1 range, namely the so called G’-band at ~ 2700 cm-1 and the one at ~ 3200 cm-1 are the
overtones of the D- and G-bands, respectively [FJS+04]. Therefore, upon modification of
the CNTs, the relative intensity of the G’-band reflects the changes in the D-band. The
signal at 2900 cm-1 is also assigned to a combination of defect-induced modes [FJS+04],
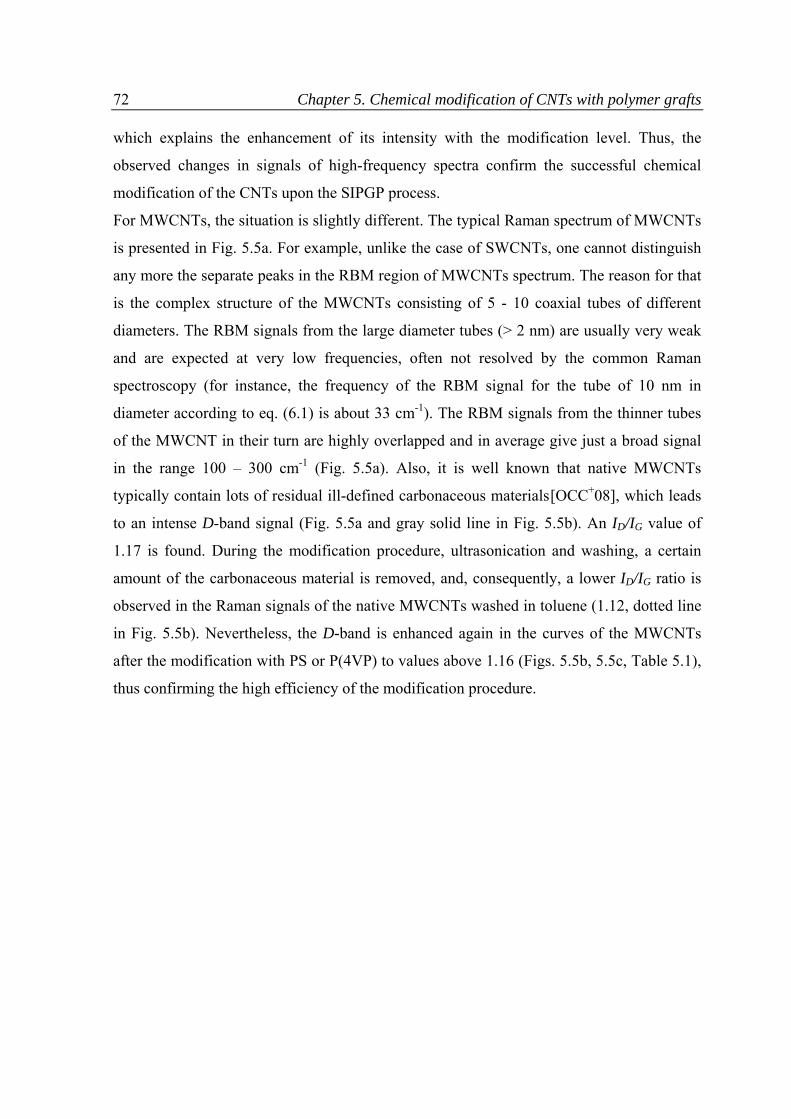
72 Chapter 5. Chemical modification of CNTs with polymer grafts
which explains the enhancement of its intensity with the modification level. Thus, the
observed changes in signals of high-frequency spectra confirm the successful chemical
modification of the CNTs upon the SIPGP process.
For MWCNTs, the situation is slightly different. The typical Raman spectrum of MWCNTs
is presented in Fig. 5.5a. For example, unlike the case of SWCNTs, one cannot distinguish
any more the separate peaks in the RBM region of MWCNTs spectrum. The reason for that
is the complex structure of the MWCNTs consisting of 5 - 10 coaxial tubes of different
diameters. The RBM signals from the large diameter tubes (> 2 nm) are usually very weak
and are expected at very low frequencies, often not resolved by the common Raman
spectroscopy (for instance, the frequency of the RBM signal for the tube of 10 nm in
diameter according to eq. (6.1) is about 33 cm-1). The RBM signals from the thinner tubes
of the MWCNT in their turn are highly overlapped and in average give just a broad signal
in the range 100 – 300 cm-1 (Fig. 5.5a). Also, it is well known that native MWCNTs
typically contain lots of residual ill-defined carbonaceous materials[OCC+08], which leads
to an intense D-band signal (Fig. 5.5a and gray solid line in Fig. 5.5b). An ID/IG value of
1.17 is found. During the modification procedure, ultrasonication and washing, a certain
amount of the carbonaceous material is removed, and, consequently, a lower ID/IG ratio is
observed in the Raman signals of the native MWCNTs washed in toluene (1.12, dotted line
in Fig. 5.5b). Nevertheless, the D-band is enhanced again in the curves of the MWCNTs
after the modification with PS or P(4VP) to values above 1.16 (Figs. 5.5b, 5.5c, Table 5.1),
thus confirming the high efficiency of the modification procedure.
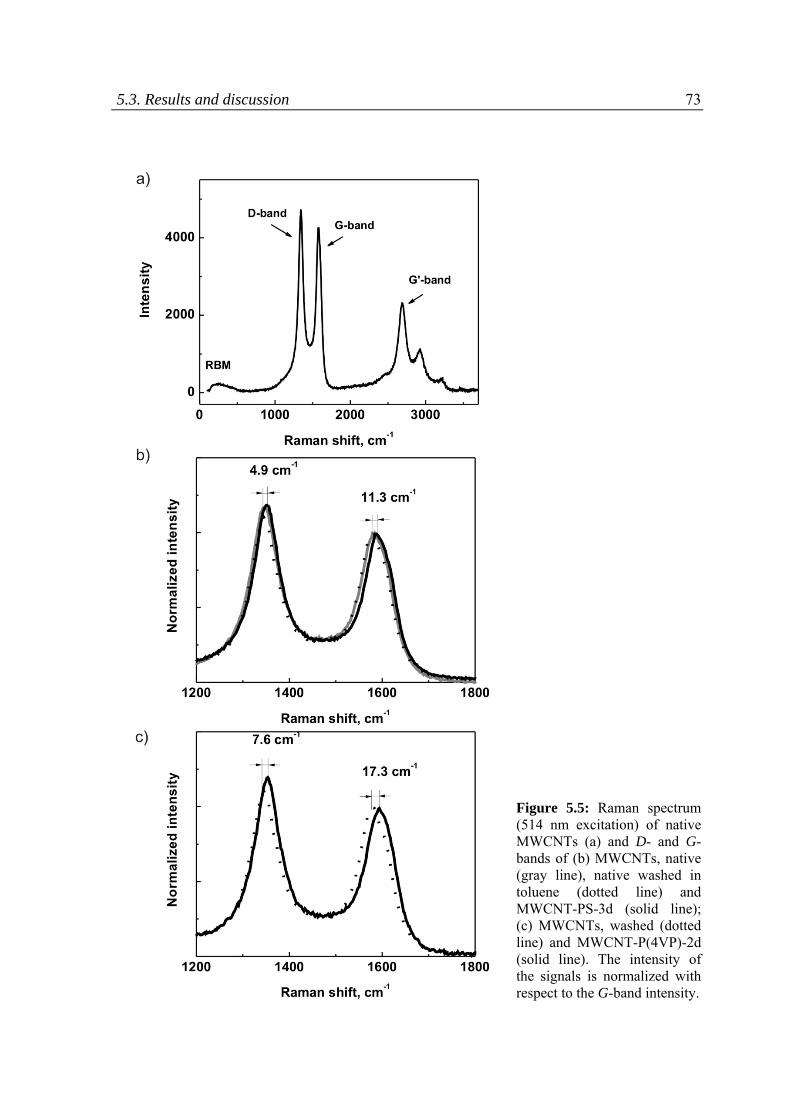
5.3. Results and discussion 73
Figure 5.5: Raman spectrum (514 nm excitation) of native MWCNTs (a) and D- and G-bands of (b) MWCNTs, native (gray line), native washed in toluene (dotted line) and MWCNT-PS-3d (solid line); (c) MWCNTs, washed (dotted line) and MWCNT-P(4VP)-2d (solid line). The intensity of the signals is normalized with respect to the G-band intensity.
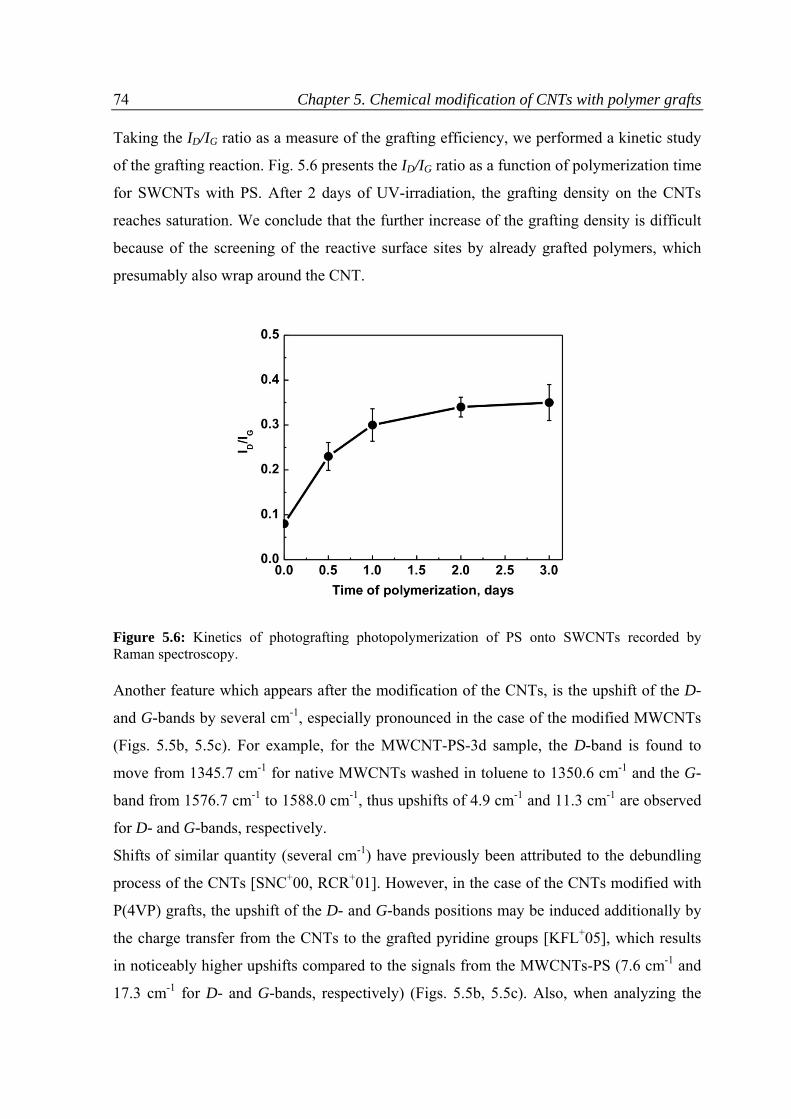
74 Chapter 5. Chemical modification of CNTs with polymer grafts
Taking the ID/IG ratio as a measure of the grafting efficiency, we performed a kinetic study
of the grafting reaction. Fig. 5.6 presents the ID/IG ratio as a function of polymerization time
for SWCNTs with PS. After 2 days of UV-irradiation, the grafting density on the CNTs
reaches saturation. We conclude that the further increase of the grafting density is difficult
because of the screening of the reactive surface sites by already grafted polymers, which
presumably also wrap around the CNT.
Figure 5.6: Kinetics of photografting photopolymerization of PS onto SWCNTs recorded by Raman spectroscopy.
Another feature which appears after the modification of the CNTs, is the upshift of the D-
and G-bands by several cm-1, especially pronounced in the case of the modified MWCNTs
(Figs. 5.5b, 5.5c). For example, for the MWCNT-PS-3d sample, the D-band is found to
move from 1345.7 cm-1 for native MWCNTs washed in toluene to 1350.6 cm-1 and the G-
band from 1576.7 cm-1 to 1588.0 cm-1, thus upshifts of 4.9 cm-1 and 11.3 cm-1 are observed
for D- and G-bands, respectively.
Shifts of similar quantity (several cm-1) have previously been attributed to the debundling
process of the CNTs [SNC+00, RCR+01]. However, in the case of the CNTs modified with
P(4VP) grafts, the upshift of the D- and G-bands positions may be induced additionally by
the charge transfer from the CNTs to the grafted pyridine groups [KFL+05], which results
in noticeably higher upshifts compared to the signals from the MWCNTs-PS (7.6 cm-1 and
17.3 cm-1 for D- and G-bands, respectively) (Figs. 5.5b, 5.5c). Also, when analyzing the
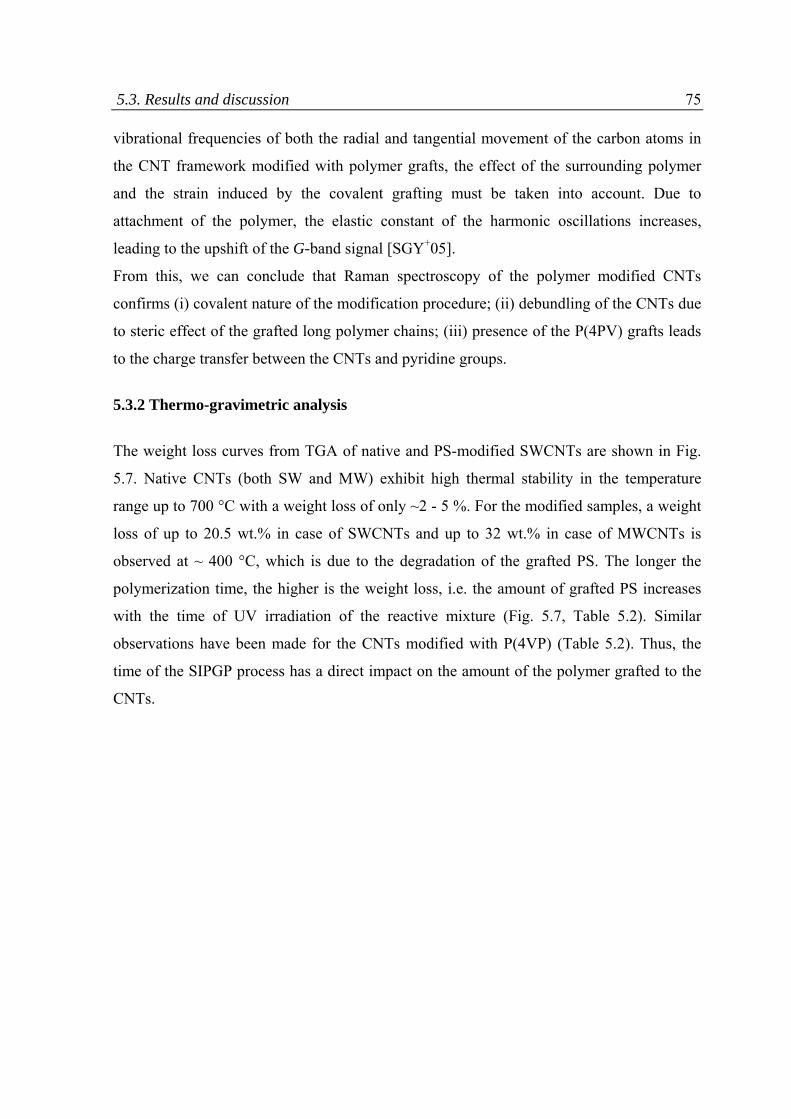
5.3. Results and discussion 75 vibrational frequencies of both the radial and tangential movement of the carbon atoms in
the CNT framework modified with polymer grafts, the effect of the surrounding polymer
and the strain induced by the covalent grafting must be taken into account. Due to
attachment of the polymer, the elastic constant of the harmonic oscillations increases,
leading to the upshift of the G-band signal [SGY+05].
From this, we can conclude that Raman spectroscopy of the polymer modified CNTs
confirms (i) covalent nature of the modification procedure; (ii) debundling of the CNTs due
to steric effect of the grafted long polymer chains; (iii) presence of the P(4PV) grafts leads
to the charge transfer between the CNTs and pyridine groups.
5.3.2 Thermo-gravimetric analysis
The weight loss curves from TGA of native and PS-modified SWCNTs are shown in Fig.
5.7. Native CNTs (both SW and MW) exhibit high thermal stability in the temperature
range up to 700 °C with a weight loss of only ~2 - 5 %. For the modified samples, a weight
loss of up to 20.5 wt.% in case of SWCNTs and up to 32 wt.% in case of MWCNTs is
observed at ~ 400 °C, which is due to the degradation of the grafted PS. The longer the
polymerization time, the higher is the weight loss, i.e. the amount of grafted PS increases
with the time of UV irradiation of the reactive mixture (Fig. 5.7, Table 5.2). Similar
observations have been made for the CNTs modified with P(4VP) (Table 5.2). Thus, the
time of the SIPGP process has a direct impact on the amount of the polymer grafted to the
CNTs.
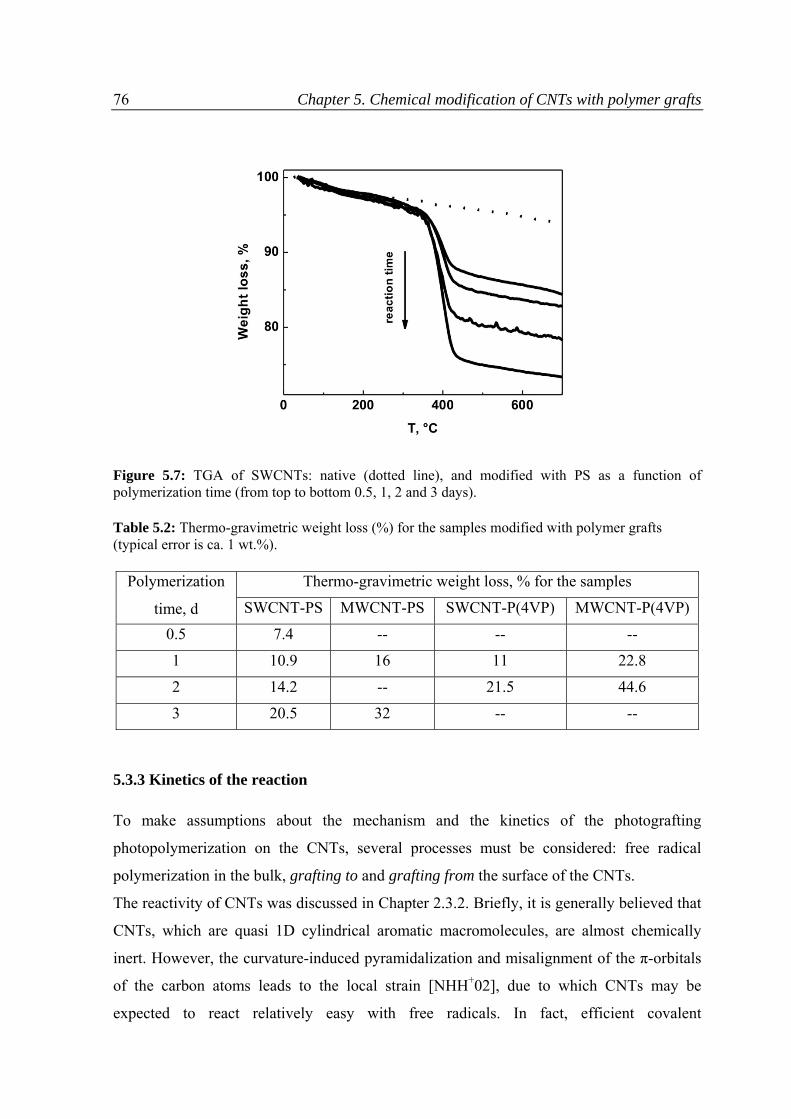
76 Chapter 5. Chemical modification of CNTs with polymer grafts
Figure 5.7: TGA of SWCNTs: native (dotted line), and modified with PS as a function of polymerization time (from top to bottom 0.5, 1, 2 and 3 days).
Table 5.2: Thermo-gravimetric weight loss (%) for the samples modified with polymer grafts (typical error is ca. 1 wt.%).
Polymerization
time, d
Thermo-gravimetric weight loss, % for the samples
SWCNT-PS MWCNT-PS SWCNT-P(4VP) MWCNT-P(4VP)
0.5 7.4 -- -- --
1 10.9 16 11 22.8
2 14.2 -- 21.5 44.6
3 20.5 32 -- --
5.3.3 Kinetics of the reaction
To make assumptions about the mechanism and the kinetics of the photografting
photopolymerization on the CNTs, several processes must be considered: free radical
polymerization in the bulk, grafting to and grafting from the surface of the CNTs.
The reactivity of CNTs was discussed in Chapter 2.3.2. Briefly, it is generally believed that
CNTs, which are quasi 1D cylindrical aromatic macromolecules, are almost chemically
inert. However, the curvature-induced pyramidalization and misalignment of the π-orbitals
of the carbon atoms leads to the local strain [NHH+02], due to which CNTs may be
expected to react relatively easy with free radicals. In fact, efficient covalent
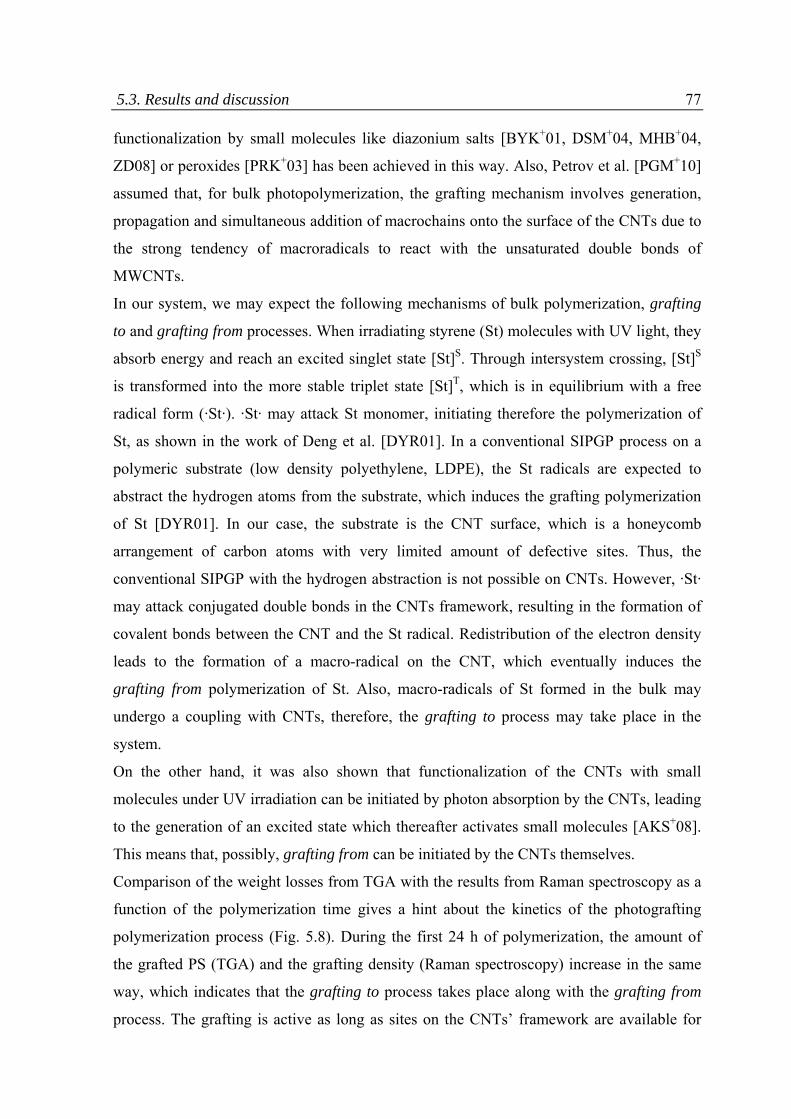
5.3. Results and discussion 77 functionalization by small molecules like diazonium salts [BYK+01, DSM+04, MHB+04,
ZD08] or peroxides [PRK+03] has been achieved in this way. Also, Petrov et al. [PGM+10]
assumed that, for bulk photopolymerization, the grafting mechanism involves generation,
propagation and simultaneous addition of macrochains onto the surface of the CNTs due to
the strong tendency of macroradicals to react with the unsaturated double bonds of
MWCNTs.
In our system, we may expect the following mechanisms of bulk polymerization, grafting
to and grafting from processes. When irradiating styrene (St) molecules with UV light, they
absorb energy and reach an excited singlet state [St]S. Through intersystem crossing, [St]S
is transformed into the more stable triplet state [St]T, which is in equilibrium with a free
radical form (·St·). ·St· may attack St monomer, initiating therefore the polymerization of
St, as shown in the work of Deng et al. [DYR01]. In a conventional SIPGP process on a
polymeric substrate (low density polyethylene, LDPE), the St radicals are expected to
abstract the hydrogen atoms from the substrate, which induces the grafting polymerization
of St [DYR01]. In our case, the substrate is the CNT surface, which is a honeycomb
arrangement of carbon atoms with very limited amount of defective sites. Thus, the
conventional SIPGP with the hydrogen abstraction is not possible on CNTs. However, ·St·
may attack conjugated double bonds in the CNTs framework, resulting in the formation of
covalent bonds between the CNT and the St radical. Redistribution of the electron density
leads to the formation of a macro-radical on the CNT, which eventually induces the
grafting from polymerization of St. Also, macro-radicals of St formed in the bulk may
undergo a coupling with CNTs, therefore, the grafting to process may take place in the
system.
On the other hand, it was also shown that functionalization of the CNTs with small
molecules under UV irradiation can be initiated by photon absorption by the CNTs, leading
to the generation of an excited state which thereafter activates small molecules [AKS+08].
This means that, possibly, grafting from can be initiated by the CNTs themselves.
Comparison of the weight losses from TGA with the results from Raman spectroscopy as a
function of the polymerization time gives a hint about the kinetics of the photografting
polymerization process (Fig. 5.8). During the first 24 h of polymerization, the amount of
the grafted PS (TGA) and the grafting density (Raman spectroscopy) increase in the same
way, which indicates that the grafting to process takes place along with the grafting from
process. The grafting is active as long as sites on the CNTs’ framework are available for
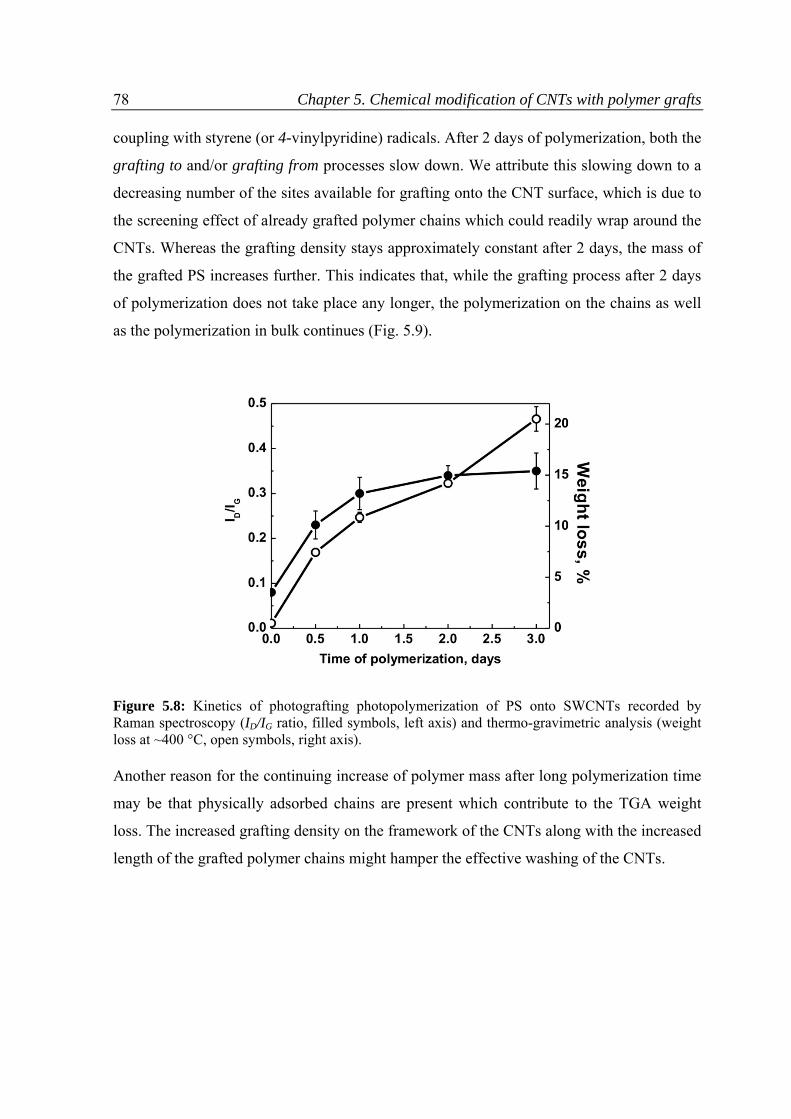
78 Chapter 5. Chemical modification of CNTs with polymer grafts
coupling with styrene (or 4-vinylpyridine) radicals. After 2 days of polymerization, both the
grafting to and/or grafting from processes slow down. We attribute this slowing down to a
decreasing number of the sites available for grafting onto the CNT surface, which is due to
the screening effect of already grafted polymer chains which could readily wrap around the
CNTs. Whereas the grafting density stays approximately constant after 2 days, the mass of
the grafted PS increases further. This indicates that, while the grafting process after 2 days
of polymerization does not take place any longer, the polymerization on the chains as well
as the polymerization in bulk continues (Fig. 5.9).
Figure 5.8: Kinetics of photografting photopolymerization of PS onto SWCNTs recorded by Raman spectroscopy (ID/IG ratio, filled symbols, left axis) and thermo-gravimetric analysis (weight loss at ~400 °C, open symbols, right axis).
Another reason for the continuing increase of polymer mass after long polymerization time
may be that physically adsorbed chains are present which contribute to the TGA weight
loss. The increased grafting density on the framework of the CNTs along with the increased
length of the grafted polymer chains might hamper the effective washing of the CNTs.
5.3. Results and discussion 79
Figure 5.9: Kinetics of photografting photopolymerization process on CNTs: after 1 day of polymerization – low grafting density, relatively short polymer grafts; after 3 days of polymerization – increased grafting density, longer and more branched polymer chains.
It is interesting to note, that the weight loss values found for the modified MWCNTs are
~1.5 - 2 times as high as for the modified SWCNTs. This concerns both the modification
with PS grafts and the modification with P(4VP) (Table 5.2). Since the mass of the grafted
PS is proportional to the product of grafting density and surface of the CNT, and taking into
account that the bulk densities of the SW and MW CNTs are approximately the same
(alternating in the range 0.15 - 0.17 g/cm3 for both SW and MW CNTs), the difference in
the mass losses means that either the grafting density on the MWCNTs is much higher
compared to the one on the SWCNTs, or that the grafting of the polymer occurs also on the
inner tubes of the MWCNTs. As discussed above, the reactivity of the CNTs arises from
the curvature induced pyramidalization and misalignment of the π-orbitals of the carbon
atoms. Therefore, the reactivity of the tubes of smaller diameters is expected to be higher
compared to the thicker ones [ZOR+01], thus, the reactivity of MWCNTs should be lower
than the ones of SWCNTs. On the other hand, MWCNTs have many more defects on the
sidewalls including groups like –H, -OH, -COOH and others. As mentioned above, the
conventional way of SIPGP on organic substrates involves the abstraction of H atoms from
the surface, initiating the grafting [DYR01]. Therefore, one of the possible explanations of
the increased reactivity of the MWCNTs is the presence of defects. However, grafting on
the defects cannot be the only way of the CNTs functionalization. Raman spectroscopy of
CNTs shows a strong enhancement of the D-band upon the modification (Fig. 5.4)
indicating the appearance of additional “defects” or sp3-hybridized carbons as a result of
SIPGP, thus, the grafting onto initially non-defective sites. The polymerization on the inner
tubes of the MWCNTs may also take place, increasing the overall mass percentage of
grafted PS. Unfortunately, it is challenging to prove experimentally, which process is
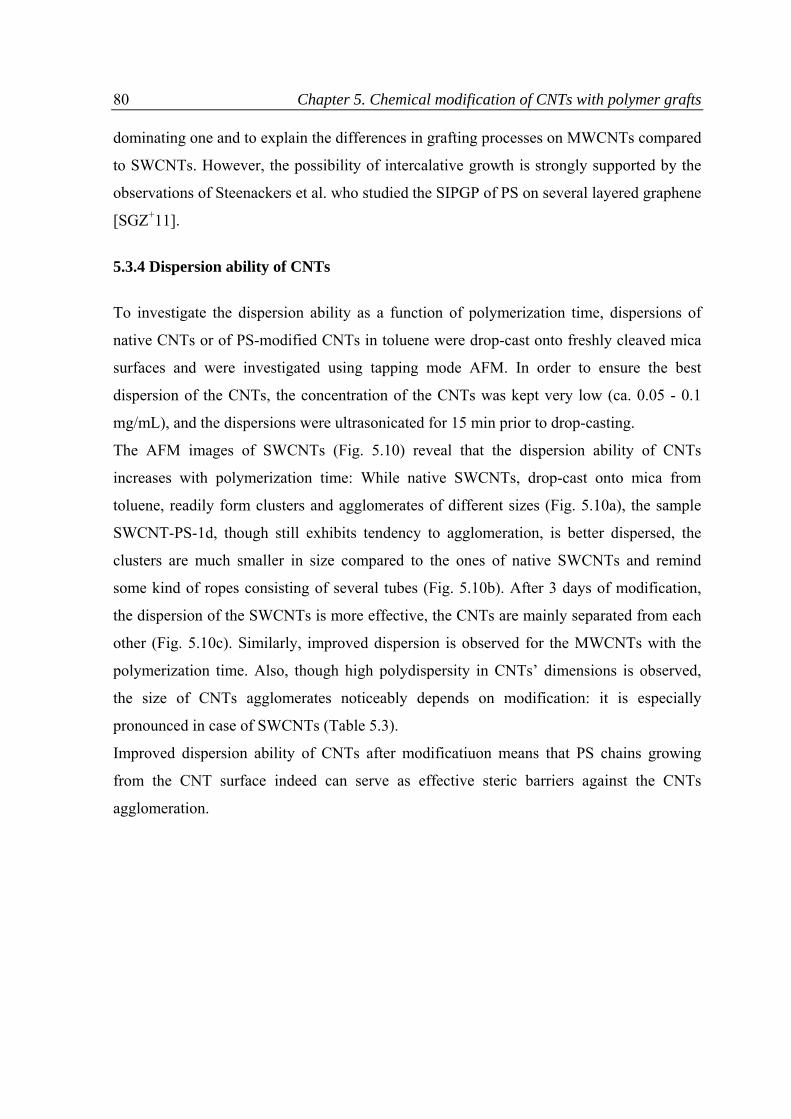
80 Chapter 5. Chemical modification of CNTs with polymer grafts
dominating one and to explain the differences in grafting processes on MWCNTs compared
to SWCNTs. However, the possibility of intercalative growth is strongly supported by the
observations of Steenackers et al. who studied the SIPGP of PS on several layered graphene
[SGZ+11].
5.3.4 Dispersion ability of CNTs
To investigate the dispersion ability as a function of polymerization time, dispersions of
native CNTs or of PS-modified CNTs in toluene were drop-cast onto freshly cleaved mica
surfaces and were investigated using tapping mode AFM. In order to ensure the best
dispersion of the CNTs, the concentration of the CNTs was kept very low (ca. 0.05 - 0.1
mg/mL), and the dispersions were ultrasonicated for 15 min prior to drop-casting.
The AFM images of SWCNTs (Fig. 5.10) reveal that the dispersion ability of CNTs
increases with polymerization time: While native SWCNTs, drop-cast onto mica from
toluene, readily form clusters and agglomerates of different sizes (Fig. 5.10a), the sample
SWCNT-PS-1d, though still exhibits tendency to agglomeration, is better dispersed, the
clusters are much smaller in size compared to the ones of native SWCNTs and remind
some kind of ropes consisting of several tubes (Fig. 5.10b). After 3 days of modification,
the dispersion of the SWCNTs is more effective, the CNTs are mainly separated from each
other (Fig. 5.10c). Similarly, improved dispersion is observed for the MWCNTs with the
polymerization time. Also, though high polydispersity in CNTs’ dimensions is observed,
the size of CNTs agglomerates noticeably depends on modification: it is especially
pronounced in case of SWCNTs (Table 5.3).
Improved dispersion ability of CNTs after modificatiuon means that PS chains growing
from the CNT surface indeed can serve as effective steric barriers against the CNTs
agglomeration.
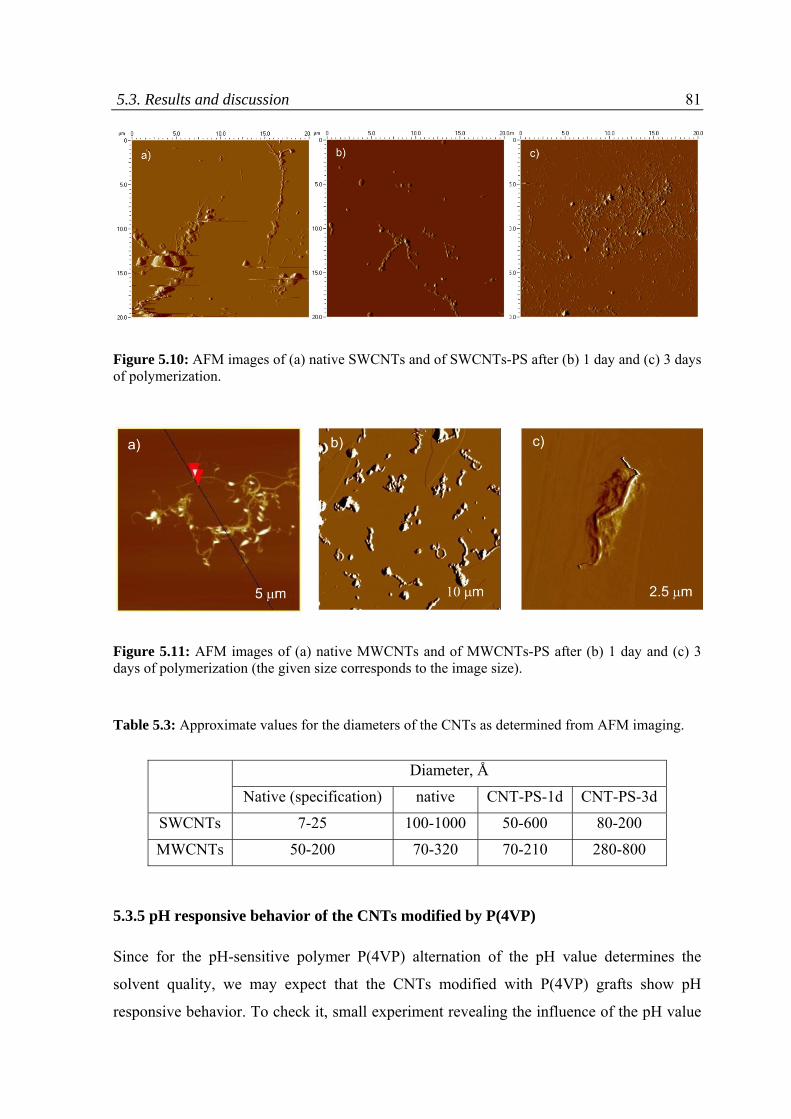
5.3. Results and discussion 81
Figure 5.10: AFM images of (a) native SWCNTs and of SWCNTs-PS after (b) 1 day and (c) 3 days of polymerization.
Figure 5.11: AFM images of (a) native MWCNTs and of MWCNTs-PS after (b) 1 day and (c) 3 days of polymerization (the given size corresponds to the image size).
Table 5.3: Approximate values for the diameters of the CNTs as determined from AFM imaging.
Diameter, Å
Native (specification) native CNT-PS-1d CNT-PS-3d
SWCNTs 7-25 100-1000 50-600 80-200
MWCNTs 50-200 70-320 70-210 280-800
5.3.5 pH responsive behavior of the CNTs modified by P(4VP)
Since for the pH-sensitive polymer P(4VP) alternation of the pH value determines the
solvent quality, we may expect that the CNTs modified with P(4VP) grafts show pH
responsive behavior. To check it, small experiment revealing the influence of the pH value
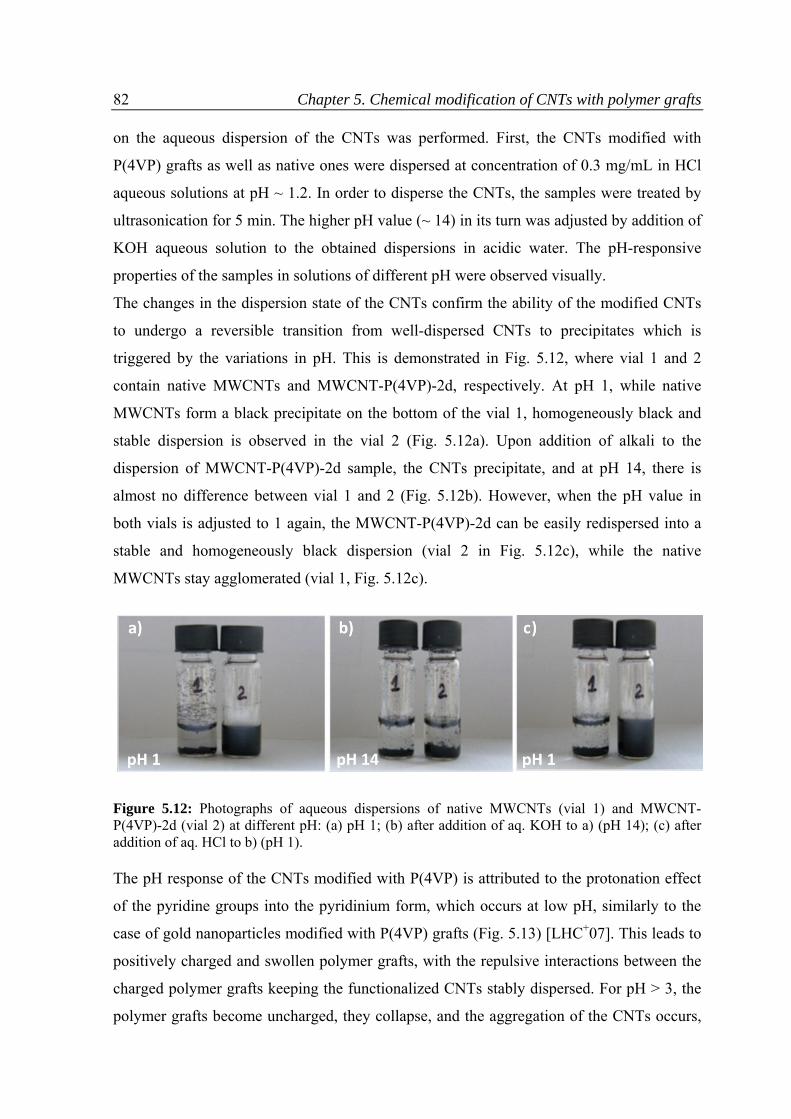
82 Chapter 5. Chemical modification of CNTs with polymer grafts
on the aqueous dispersion of the CNTs was performed. First, the CNTs modified with
P(4VP) grafts as well as native ones were dispersed at concentration of 0.3 mg/mL in HCl
aqueous solutions at pH ~ 1.2. In order to disperse the CNTs, the samples were treated by
ultrasonication for 5 min. The higher pH value (~ 14) in its turn was adjusted by addition of
KOH aqueous solution to the obtained dispersions in acidic water. The pH-responsive
properties of the samples in solutions of different pH were observed visually.
The changes in the dispersion state of the CNTs confirm the ability of the modified CNTs
to undergo a reversible transition from well-dispersed CNTs to precipitates which is
triggered by the variations in pH. This is demonstrated in Fig. 5.12, where vial 1 and 2
contain native MWCNTs and MWCNT-P(4VP)-2d, respectively. At pH 1, while native
MWCNTs form a black precipitate on the bottom of the vial 1, homogeneously black and
stable dispersion is observed in the vial 2 (Fig. 5.12a). Upon addition of alkali to the
dispersion of MWCNT-P(4VP)-2d sample, the CNTs precipitate, and at pH 14, there is
almost no difference between vial 1 and 2 (Fig. 5.12b). However, when the pH value in
both vials is adjusted to 1 again, the MWCNT-P(4VP)-2d can be easily redispersed into a
stable and homogeneously black dispersion (vial 2 in Fig. 5.12c), while the native
MWCNTs stay agglomerated (vial 1, Fig. 5.12c).
Figure 5.12: Photographs of aqueous dispersions of native MWCNTs (vial 1) and MWCNT-P(4VP)-2d (vial 2) at different pH: (a) pH 1; (b) after addition of aq. KOH to a) (pH 14); (c) after addition of aq. HCl to b) (pH 1).
The pH response of the CNTs modified with P(4VP) is attributed to the protonation effect
of the pyridine groups into the pyridinium form, which occurs at low pH, similarly to the
case of gold nanoparticles modified with P(4VP) grafts (Fig. 5.13) [LHC+07]. This leads to
positively charged and swollen polymer grafts, with the repulsive interactions between the
charged polymer grafts keeping the functionalized CNTs stably dispersed. For pH > 3, the
polymer grafts become uncharged, they collapse, and the aggregation of the CNTs occurs,
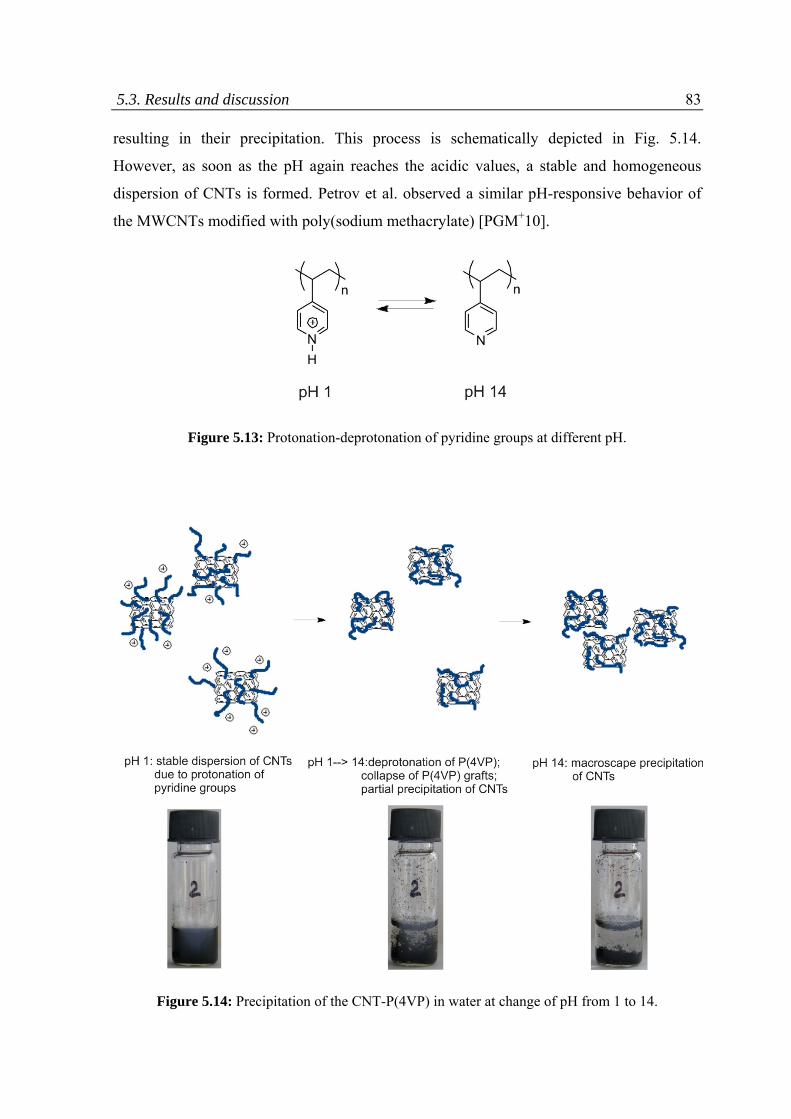
5.3. Results and discussion 83 resulting in their precipitation. This process is schematically depicted in Fig. 5.14.
However, as soon as the pH again reaches the acidic values, a stable and homogeneous
dispersion of CNTs is formed. Petrov et al. observed a similar pH-responsive behavior of
the MWCNTs modified with poly(sodium methacrylate) [PGM+10].
Figure 5.13: Protonation-deprotonation of pyridine groups at different pH.
Figure 5.14: Precipitation of the CNT-P(4VP) in water at change of pH from 1 to 14.
84 Chapter 5. Chemical modification of CNTs with polymer grafts
5.4 Conclusions
We apply self-initiated photografting photopolymerization for the covalent modification of
both SW and MW CNTs. The irradiation of the CNTs with UV light in the presence of bulk
vinyl monomers (styrene and 4-vinylpyridine) results in the effective formation of stable
polymer grafts chemically bound to the surface of the CNTs; the highly functionalized
CNTs contain up to 44 wt.% of polymer grafts. The grafting density as well as the length of
the grafted polymers can be controlled by the irradiation time. The functionalization results
in an improved dispersion ability of the CNTs, which is necessary for the development of
highly functional nanocomposite materials. Moreover, the P(4VP) functionalized CNTs
undergo a reversible transition from the well-dispersed state to the precipitate upon changes
in the pH.
Compared to the conventional ways to modify CNTs with polymers (ATRP, RAFT
polymerization, etc.), SIPGP suggests a very easy one-step, ligand- and metal-free
procedure to perform polymer grafting from various vinyl monomers. The process requires
no any CNT pretreatment (as for example, oxidation) and works well with as-produced
both SW and MW CNTs; this implies that the length and the structure of CNTs are
maximally preserved.
6 Dispersability of carbon nanotubes: A small‐angle scattering study
6.1 State of the art
Though interest to CNTs as to unique 1D objects with a wide spectrum of potential
applications was boosted two decades ago, in the beginning of the 1990s by the report of
Iijima [I91], even nowadays, when numerous experimental techniques are available for
extensive investigations of the CNTs structure and their properties, many aspects about
CNTs have not been clarified. For instance, there is still a lack of knowledge about the
agglomeration behavior of CNTs in dispersions. For the visualization of CNTs and their
agglomerates, microscopic techniques like atomic force microscopy (AFM), scanning and
transmission electron microscopy (SEM, TEM) are widely used [SDK+07, BGM+07,
KXH+10]. In one of the recent works, Backes et al. showed that also by optical bright-field
and dark-field microscopy, it is possible to resolve small bundles of SWCNTs (up to 1 - 5
nm in height) which were spin-coated from dispersion onto a Si substrate with a SiOx
surface layer [BEB+10]. However, the simplicity of the microscopic observations may be
deceptive and does not in all cases reflect the real behavior of the CNTs. Both the sample
preparation by drop-casting or spin-coating from very dilute dispersion onto a substrate, the
solvent evaporation and the interaction of the CNTs with the substrate surface may have a
significant influence on the arrangement of CNTs and may falsify the observations.
86 Chapter 6. Dispersability of CNTs: A small-angle scattering study At the same time, characterization of the agglomerates directly in dispersion is highly
desirable, since one of the main pathways to prepare CNT/polymer nanocomposites is
solution processing, i.e. both components are separately dissolved in a common solvent,
followed by co-mixing and solution casting [MW06, CKB+06, PRK+09]. As discussed
above, the dispersion of CNTs in the solvent is itself challenging because CNTs do not
easily deagglomerate, and large clusters and agglomerates of CNTs behave differently
compared to individually separated CNTs. As a consequence, the properties of the final
composite are highly dependent on the agglomeration state of the CNTs in dispersion (see
Chapter 2.2). To overcome the problem of aggregation, the modification of CNTs has been
widely envisaged, both chemical and physical [SRC+10] (Chapter 2.2).
However, it is challenging to develop the optimal method for the CNTs modification;
therefore, influence of the modification procedure on the dispersion properties, as well as
on the CNTs morphology need to be thoroughly studied. Because it is a non-destructive, in
situ, volume-sensitive probe, small-angle scattering, either using X-rays (SAXS) or
neutrons (SANS), is an obvious candidate to provide the required morphological data.
SAXS and SANS have previously been applied for probing CNT dispersions [BHB06,
SZB+03, ZIW+04, UMD+00]. Considering the nearly one-dimensional CNTs as isolated,
randomly distributed, long and straight particles, their scattering intensity is expected to
exhibit a power law, I(q) qα, where q is the magnitude of the scattering vector and the
exponent α is -1 [R00, SF87] (Chapter 4.5). However, such a behavior was observed only
in very dilute dispersions of CNTs and at high concentrations of dispersing agents (for
example, concentration of SWCNTs 0.02 wt.%, surfactant (Sodium dodecylbenzene
sulfonate):SWCNT ratio is 10:1) [ZIW+04]. In most other works, values of α between -2.5
and -3 were observed; which was attributed to the aggregation of the CNTs [BHB06,
SZB+03].
Modeling of the full scattering curves of CNTs in dispersion has only been attempted in
very few studies [ZHJ+05, JWT+07], and mainly for the case of CNTs dispersed in the
polymer matrix. Zhao et al. used ultra-small angle X-ray scattering (USAXS) to study the
morphology of polyamide 6/CNT composites prepared by in situ polymerization of ε-
caprolactam in the presence of pristine or carboxylated multi-walled CNTs. The USAXS
curves taken at an MWCNT concentration of 0.1 wt.% did not follow the power law with α
= -1. Therefore, the authors applied the stiff-rod model which is a simplified rigid rod
6.1. State of the art 87 model. It matches the exact form factor of a rod except for q > 1/R, where R is the rod
radius. The oscillations in the q > 1/R region, characteristic for the exact rod form factor,
are not included in the stiff-rod model because they are smeared out due to polydispersity
of the rod diameter. However, the stiff-rod model did not match the experimental curve
either. On contrary, a model based on fractal ordering of short rod-like segments (diameter
~ 304 Å, length ~ 800 Å) matched the scattering curves well. The scattering can be
attributed to the CNTs having a wormlike rod conformation; however, the authors noted
that the same model can as well apply to aggregates of straight rods with fractal correlation.
Several years later, Zhao et al. suggested a simplified tube form factor to fit USAXS curves
from CNT-reinforced composites on base of polyamide 6 [ZHJ+05]. The suggested model
differs from the previously described ones (exact rod or simplified rigid rod) mainly in the
intermediate q-range which is due to the two-dimensional character of the tube wall. Still
the fits are not perfect. Moreover, the simplified tube form factor could only be applied for
very low concentrations of CNTs (0.01 wt.%). At higher concentrations, when
agglomerates of the CNTs are present, the authors account for the long-range correlations
by including a fractal structure factor.
In the present Chapter, an investigation of the PS-modified CNTs (Chapter 5) in toluene
dispersion, which is a good solvent for PS, is presented. The main focus is on the dispersion
ability of SW and MW CNTs in the solvent in dependence on the amount of grafted PS.
Small-angle neutron scattering (SANS) covering a large range of scattering vectors allowed
us to get information on a large range of length scales. Moreover, contrast variation was
carried out by using fully deuterated toluene (D-toluene) or a mixture of protonated toluene
(H-toluene) and D-toluene and allowed us to highlight either the polymer shell or the
CNTs. Additional small-angle X-ray scattering (SAXS) on dispersions of the CNTs in H-
toluene gives combined information and enabled us to verify the results from SANS. The
experimental SAXS/SANS curves are modeled using the form factor of homogeneous or
core-shell cylinders for SW or MW CNTs, respectively. A fractal structure factor is used to
model their correlation. This way, we describe both the structure and dispersion ability of
the SW and MW CNTs depending on the amount of grafted polymer. The broad
distribution of the CNTs’ dimensions is taken into account by including polydispersity of
the cylindrical segments into the models.
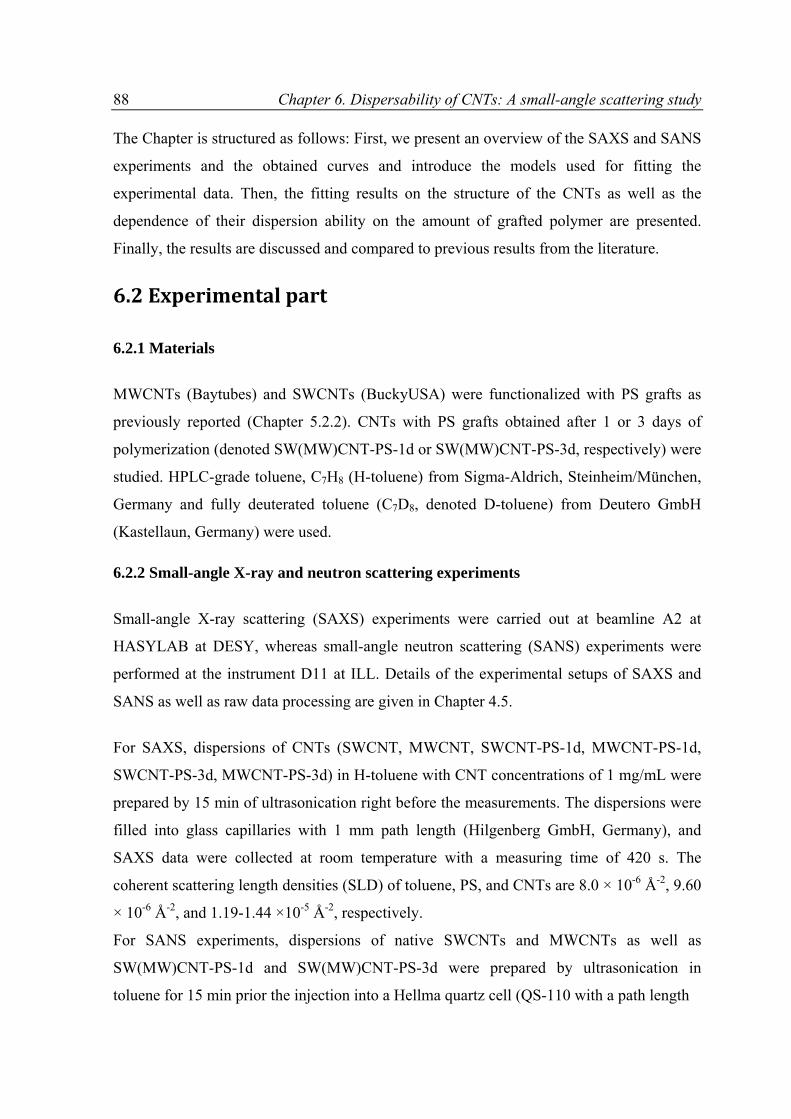
88 Chapter 6. Dispersability of CNTs: A small-angle scattering study The Chapter is structured as follows: First, we present an overview of the SAXS and SANS
experiments and the obtained curves and introduce the models used for fitting the
experimental data. Then, the fitting results on the structure of the CNTs as well as the
dependence of their dispersion ability on the amount of grafted polymer are presented.
Finally, the results are discussed and compared to previous results from the literature.
6.2 Experimental part
6.2.1 Materials
MWCNTs (Baytubes) and SWCNTs (BuckyUSA) were functionalized with PS grafts as
previously reported (Chapter 5.2.2). CNTs with PS grafts obtained after 1 or 3 days of
polymerization (denoted SW(MW)CNT-PS-1d or SW(MW)CNT-PS-3d, respectively) were
studied. HPLC-grade toluene, C7H8 (H-toluene) from Sigma-Aldrich, Steinheim/München,
Germany and fully deuterated toluene (C7D8, denoted D-toluene) from Deutero GmbH
(Kastellaun, Germany) were used.
6.2.2 Small-angle X-ray and neutron scattering experiments
Small-angle X-ray scattering (SAXS) experiments were carried out at beamline A2 at
HASYLAB at DESY, whereas small-angle neutron scattering (SANS) experiments were
performed at the instrument D11 at ILL. Details of the experimental setups of SAXS and
SANS as well as raw data processing are given in Chapter 4.5.
For SAXS, dispersions of CNTs (SWCNT, MWCNT, SWCNT-PS-1d, MWCNT-PS-1d,
SWCNT-PS-3d, MWCNT-PS-3d) in H-toluene with CNT concentrations of 1 mg/mL were
prepared by 15 min of ultrasonication right before the measurements. The dispersions were
filled into glass capillaries with 1 mm path length (Hilgenberg GmbH, Germany), and
SAXS data were collected at room temperature with a measuring time of 420 s. The
coherent scattering length densities (SLD) of toluene, PS, and CNTs are 8.0 × 10⁻⁶ Å-2, 9.60
× 10-6 Å-2, and 1.19-1.44 ×10⁻⁵ Å-2, respectively.
For SANS experiments, dispersions of native SWCNTs and MWCNTs as well as
SW(MW)CNT-PS-1d and SW(MW)CNT-PS-3d were prepared by ultrasonication in
toluene for 15 min prior the injection into a Hellma quartz cell (QS-110 with a path length
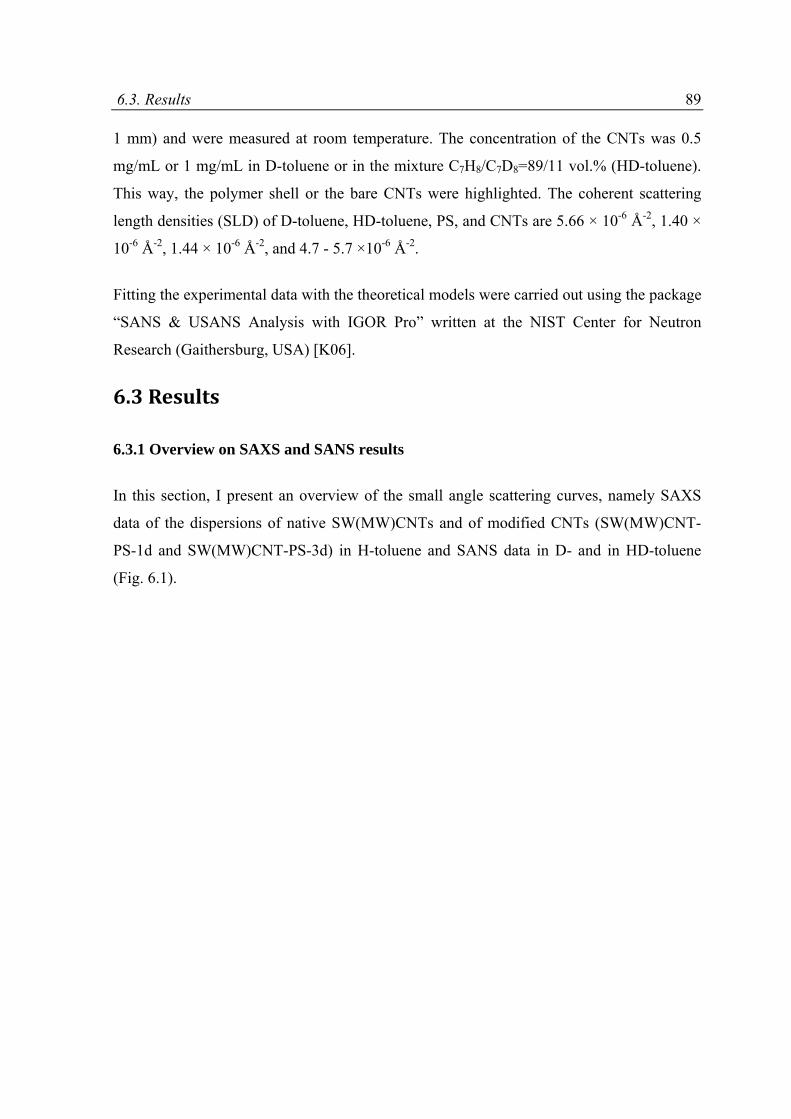
6.3. Results 89 1 mm) and were measured at room temperature. The concentration of the CNTs was 0.5
mg/mL or 1 mg/mL in D-toluene or in the mixture C7H8/C7D8=89/11 vol.% (HD-toluene).
This way, the polymer shell or the bare CNTs were highlighted. The coherent scattering
length densities (SLD) of D-toluene, HD-toluene, PS, and CNTs are 5.66 × 10⁻⁶ Å-2, 1.40 ×
10-6 Å-2, 1.44 × 10⁻⁶ Å-2, and 4.7 - 5.7 ×10⁻⁶ Å-2.
Fitting the experimental data with the theoretical models were carried out using the package
“SANS & USANS Analysis with IGOR Pro” written at the NIST Center for Neutron
Research (Gaithersburg, USA) [K06].
6.3 Results
6.3.1 Overview on SAXS and SANS results
In this section, I present an overview of the small angle scattering curves, namely SAXS
data of the dispersions of native SW(MW)CNTs and of modified CNTs (SW(MW)CNT-
PS-1d and SW(MW)CNT-PS-3d) in H-toluene and SANS data in D- and in HD-toluene
(Fig. 6.1).
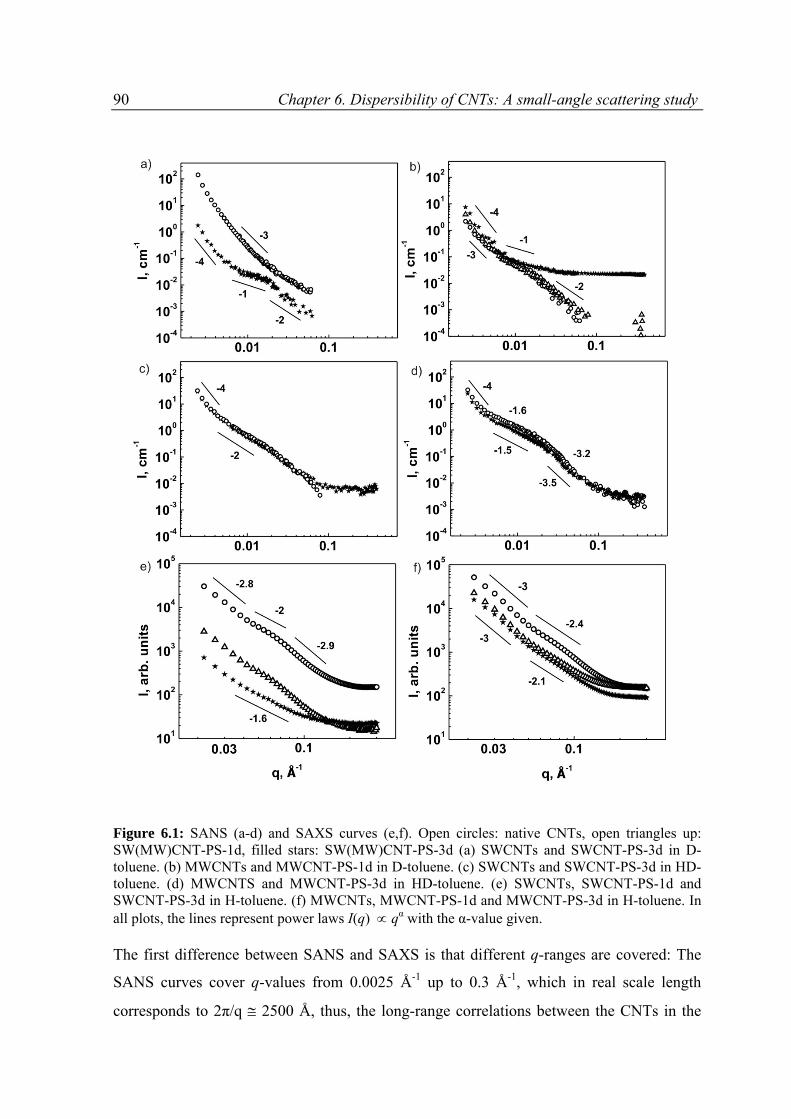
90 Chapter 6. Dispersibility of CNTs: A small-angle scattering study
Figure 6.1: SANS (a-d) and SAXS curves (e,f). Open circles: native CNTs, open triangles up: SW(MW)CNT-PS-1d, filled stars: SW(MW)CNT-PS-3d (a) SWCNTs and SWCNT-PS-3d in D-toluene. (b) MWCNTs and MWCNT-PS-1d in D-toluene. (c) SWCNTs and SWCNT-PS-3d in HD-toluene. (d) MWCNTS and MWCNT-PS-3d in HD-toluene. (e) SWCNTs, SWCNT-PS-1d and SWCNT-PS-3d in H-toluene. (f) MWCNTs, MWCNT-PS-1d and MWCNT-PS-3d in H-toluene. In all plots, the lines represent power laws I(q) qα with the α-value given.
The first difference between SANS and SAXS is that different q-ranges are covered: The
SANS curves cover q-values from 0.0025 Å-1 up to 0.3 Å-1, which in real scale length
corresponds to 2π/q 2500 Å, thus, the long-range correlations between the CNTs in the
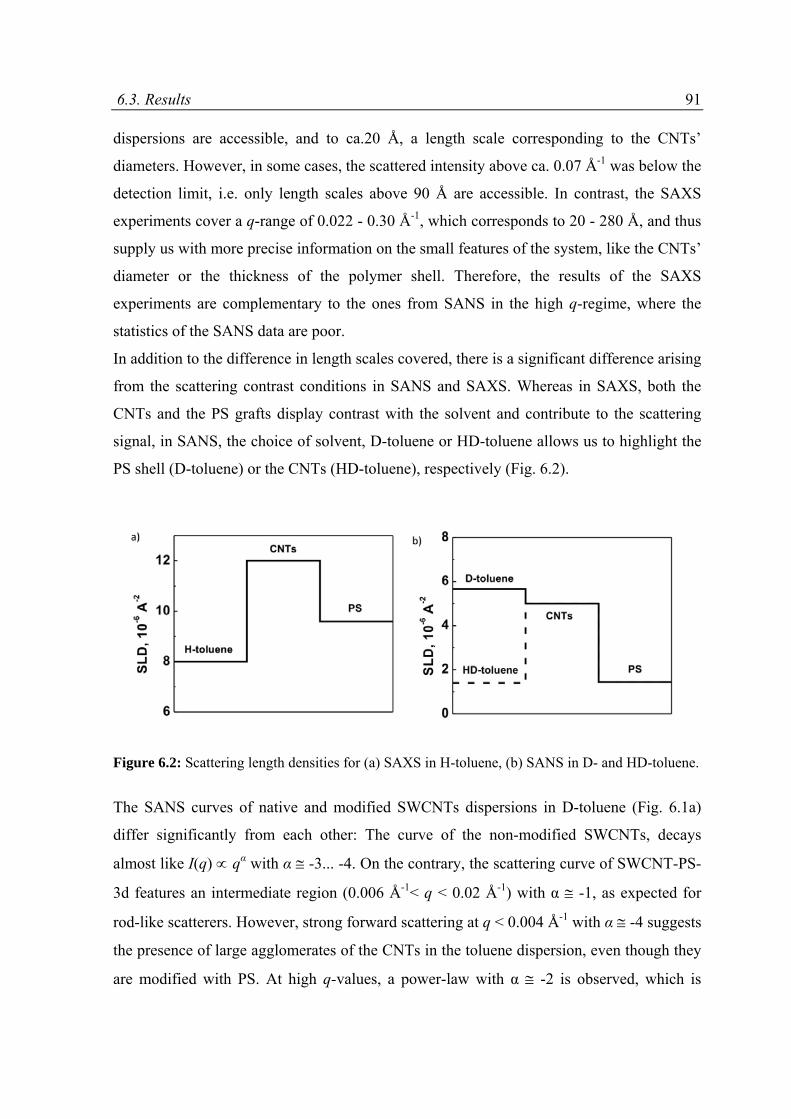
6.3. Results 91 dispersions are accessible, and to ca.20 Å, a length scale corresponding to the CNTs’
diameters. However, in some cases, the scattered intensity above ca. 0.07 Å-1 was below the
detection limit, i.e. only length scales above 90 Å are accessible. In contrast, the SAXS
experiments cover a q-range of 0.022 - 0.30 Å-1, which corresponds to 20 - 280 Å, and thus
supply us with more precise information on the small features of the system, like the CNTs’
diameter or the thickness of the polymer shell. Therefore, the results of the SAXS
experiments are complementary to the ones from SANS in the high q-regime, where the
statistics of the SANS data are poor.
In addition to the difference in length scales covered, there is a significant difference arising
from the scattering contrast conditions in SANS and SAXS. Whereas in SAXS, both the
CNTs and the PS grafts display contrast with the solvent and contribute to the scattering
signal, in SANS, the choice of solvent, D-toluene or HD-toluene allows us to highlight the
PS shell (D-toluene) or the CNTs (HD-toluene), respectively (Fig. 6.2).
Figure 6.2: Scattering length densities for (a) SAXS in H-toluene, (b) SANS in D- and HD-toluene.
The SANS curves of native and modified SWCNTs dispersions in D-toluene (Fig. 6.1a)
differ significantly from each other: The curve of the non-modified SWCNTs, decays
almost like I(q) qα with α -3... -4. On the contrary, the scattering curve of SWCNT-PS-
3d features an intermediate region (0.006 Å-1< q < 0.02 Å-1) with α -1, as expected for
rod-like scatterers. However, strong forward scattering at q < 0.004 Å-1 with α -4 suggests
the presence of large agglomerates of the CNTs in the toluene dispersion, even though they
are modified with PS. At high q-values, a power-law with α -2 is observed, which is
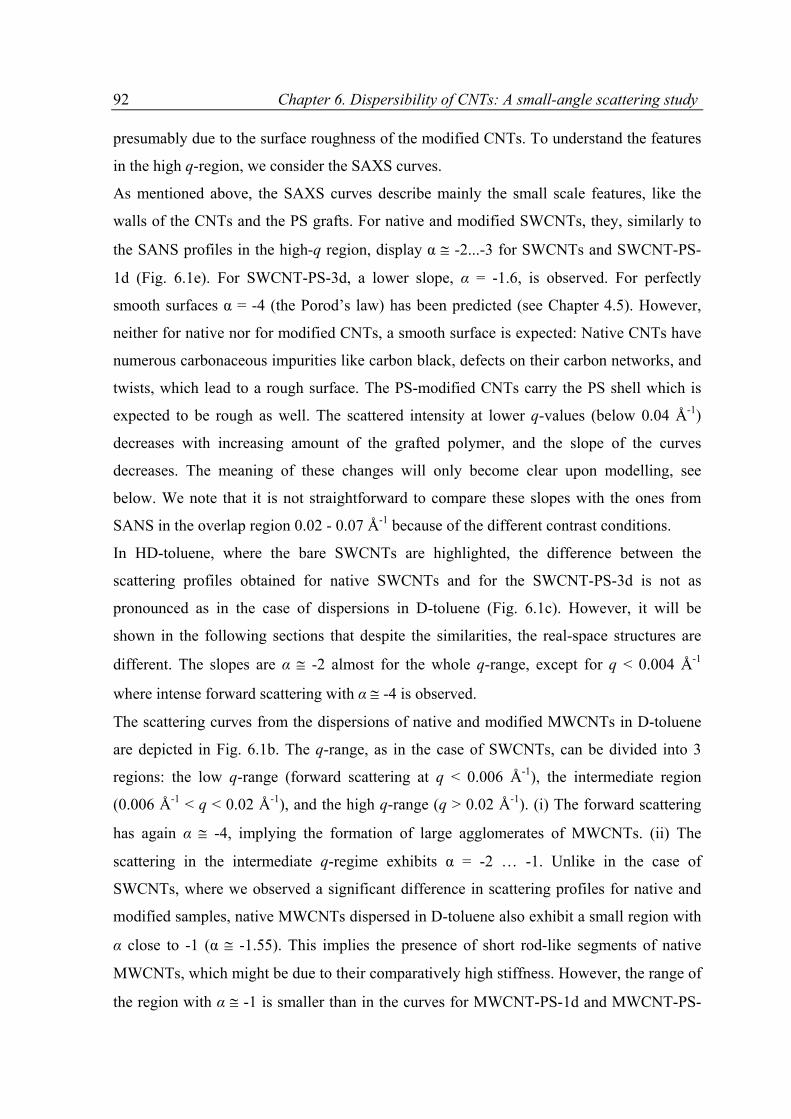
92 Chapter 6. Dispersibility of CNTs: A small-angle scattering study presumably due to the surface roughness of the modified CNTs. To understand the features
in the high q-region, we consider the SAXS curves.
As mentioned above, the SAXS curves describe mainly the small scale features, like the
walls of the CNTs and the PS grafts. For native and modified SWCNTs, they, similarly to
the SANS profiles in the high-q region, display α -2...-3 for SWCNTs and SWCNT-PS-
1d (Fig. 6.1e). For SWCNT-PS-3d, a lower slope, α = -1.6, is observed. For perfectly
smooth surfaces α = -4 (the Porod’s law) has been predicted (see Chapter 4.5). However,
neither for native nor for modified CNTs, a smooth surface is expected: Native CNTs have
numerous carbonaceous impurities like carbon black, defects on their carbon networks, and
twists, which lead to a rough surface. The PS-modified CNTs carry the PS shell which is
expected to be rough as well. The scattered intensity at lower q-values (below 0.04 Å-1)
decreases with increasing amount of the grafted polymer, and the slope of the curves
decreases. The meaning of these changes will only become clear upon modelling, see
below. We note that it is not straightforward to compare these slopes with the ones from
SANS in the overlap region 0.02 - 0.07 Å-1 because of the different contrast conditions.
In HD-toluene, where the bare SWCNTs are highlighted, the difference between the
scattering profiles obtained for native SWCNTs and for the SWCNT-PS-3d is not as
pronounced as in the case of dispersions in D-toluene (Fig. 6.1c). However, it will be
shown in the following sections that despite the similarities, the real-space structures are
different. The slopes are α -2 almost for the whole q-range, except for q < 0.004 Å-1
where intense forward scattering with α -4 is observed.
The scattering curves from the dispersions of native and modified MWCNTs in D-toluene
are depicted in Fig. 6.1b. The q-range, as in the case of SWCNTs, can be divided into 3
regions: the low q-range (forward scattering at q < 0.006 Å-1), the intermediate region
(0.006 Å-1 < q < 0.02 Å-1), and the high q-range (q > 0.02 Å-1). (i) The forward scattering
has again α -4, implying the formation of large agglomerates of MWCNTs. (ii) The
scattering in the intermediate q-regime exhibits α = -2 … -1. Unlike in the case of
SWCNTs, where we observed a significant difference in scattering profiles for native and
modified samples, native MWCNTs dispersed in D-toluene also exhibit a small region with
α close to -1 (α -1.55). This implies the presence of short rod-like segments of native
MWCNTs, which might be due to their comparatively high stiffness. However, the range of
the region with α -1 is smaller than in the curves for MWCNT-PS-1d and MWCNT-PS-
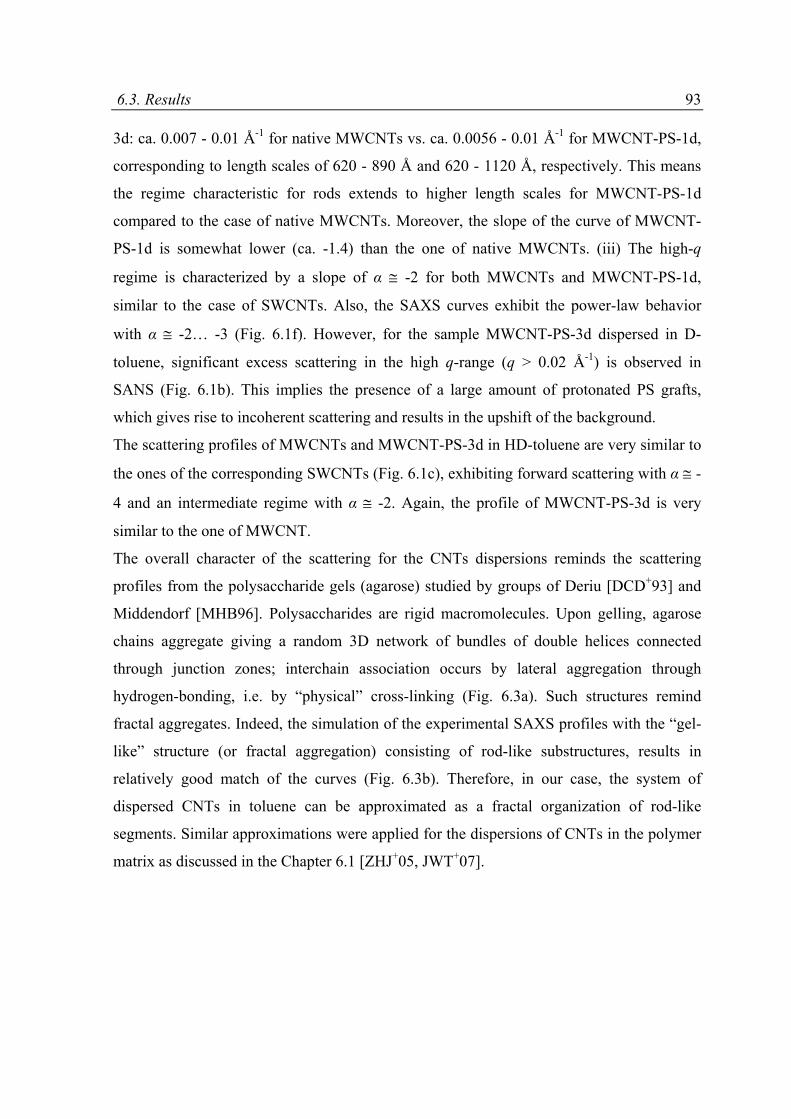
6.3. Results 93 3d: ca. 0.007 - 0.01 Å-1 for native MWCNTs vs. ca. 0.0056 - 0.01 Å-1 for MWCNT-PS-1d,
corresponding to length scales of 620 - 890 Å and 620 - 1120 Å, respectively. This means
the regime characteristic for rods extends to higher length scales for MWCNT-PS-1d
compared to the case of native MWCNTs. Moreover, the slope of the curve of MWCNT-
PS-1d is somewhat lower (ca. -1.4) than the one of native MWCNTs. (iii) The high-q
regime is characterized by a slope of α -2 for both MWCNTs and MWCNT-PS-1d,
similar to the case of SWCNTs. Also, the SAXS curves exhibit the power-law behavior
with α -2… -3 (Fig. 6.1f). However, for the sample MWCNT-PS-3d dispersed in D-
toluene, significant excess scattering in the high q-range (q > 0.02 Å-1) is observed in
SANS (Fig. 6.1b). This implies the presence of a large amount of protonated PS grafts,
which gives rise to incoherent scattering and results in the upshift of the background.
The scattering profiles of MWCNTs and MWCNT-PS-3d in HD-toluene are very similar to
the ones of the corresponding SWCNTs (Fig. 6.1c), exhibiting forward scattering with α -
4 and an intermediate regime with α -2. Again, the profile of MWCNT-PS-3d is very
similar to the one of MWCNT.
The overall character of the scattering for the CNTs dispersions reminds the scattering
profiles from the polysaccharide gels (agarose) studied by groups of Deriu [DCD+93] and
Middendorf [MHB96]. Polysaccharides are rigid macromolecules. Upon gelling, agarose
chains aggregate giving a random 3D network of bundles of double helices connected
through junction zones; interchain association occurs by lateral aggregation through
hydrogen-bonding, i.e. by “physical” cross-linking (Fig. 6.3a). Such structures remind
fractal aggregates. Indeed, the simulation of the experimental SAXS profiles with the “gel-
like” structure (or fractal aggregation) consisting of rod-like substructures, results in
relatively good match of the curves (Fig. 6.3b). Therefore, in our case, the system of
dispersed CNTs in toluene can be approximated as a fractal organization of rod-like
segments. Similar approximations were applied for the dispersions of CNTs in the polymer
matrix as discussed in the Chapter 6.1 [ZHJ+05, JWT+07].
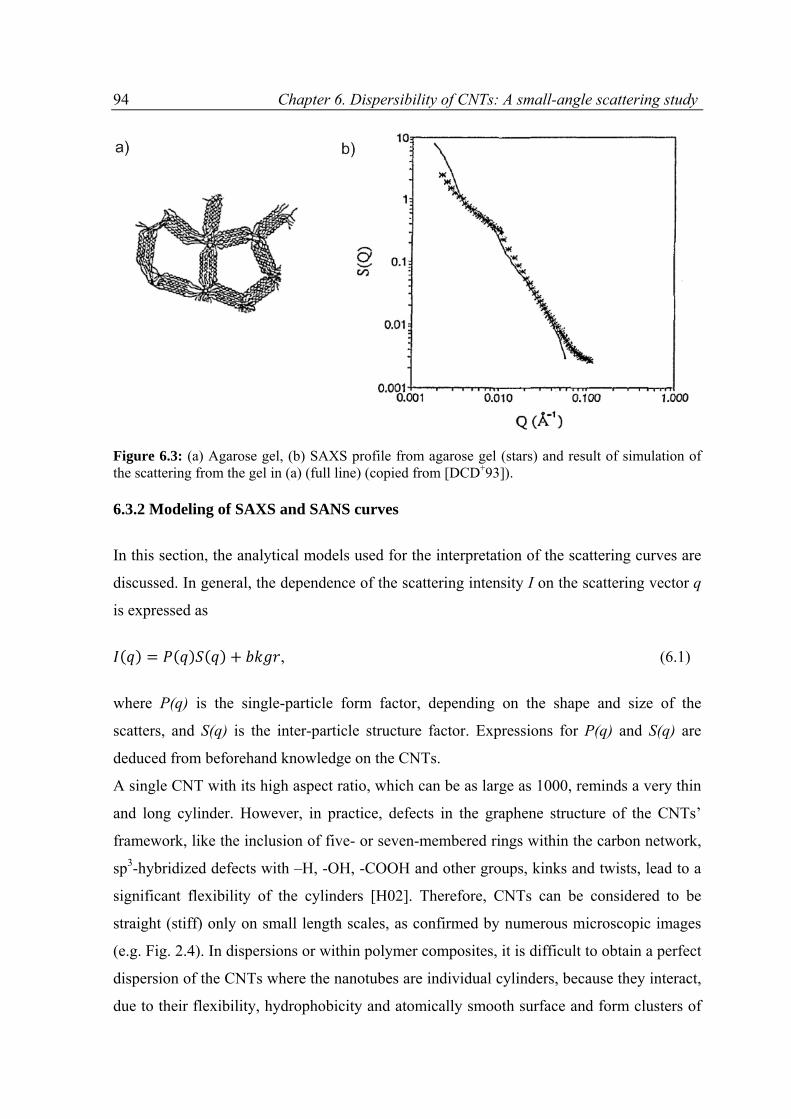
94 Chapter 6. Dispersibility of CNTs: A small-angle scattering study
Figure 6.3: (a) Agarose gel, (b) SAXS profile from agarose gel (stars) and result of simulation of the scattering from the gel in (a) (full line) (copied from [DCD+93]).
6.3.2 Modeling of SAXS and SANS curves
In this section, the analytical models used for the interpretation of the scattering curves are
discussed. In general, the dependence of the scattering intensity I on the scattering vector q
is expressed as
, (6.1)
where P(q) is the single-particle form factor, depending on the shape and size of the
scatters, and S(q) is the inter-particle structure factor. Expressions for P(q) and S(q) are
deduced from beforehand knowledge on the CNTs.
A single CNT with its high aspect ratio, which can be as large as 1000, reminds a very thin
and long cylinder. However, in practice, defects in the graphene structure of the CNTs’
framework, like the inclusion of five- or seven-membered rings within the carbon network,
sp3-hybridized defects with –H, -OH, -COOH and other groups, kinks and twists, lead to a
significant flexibility of the cylinders [H02]. Therefore, CNTs can be considered to be
straight (stiff) only on small length scales, as confirmed by numerous microscopic images
(e.g. Fig. 2.4). In dispersions or within polymer composites, it is difficult to obtain a perfect
dispersion of the CNTs where the nanotubes are individual cylinders, because they interact,
due to their flexibility, hydrophobicity and atomically smooth surface and form clusters of
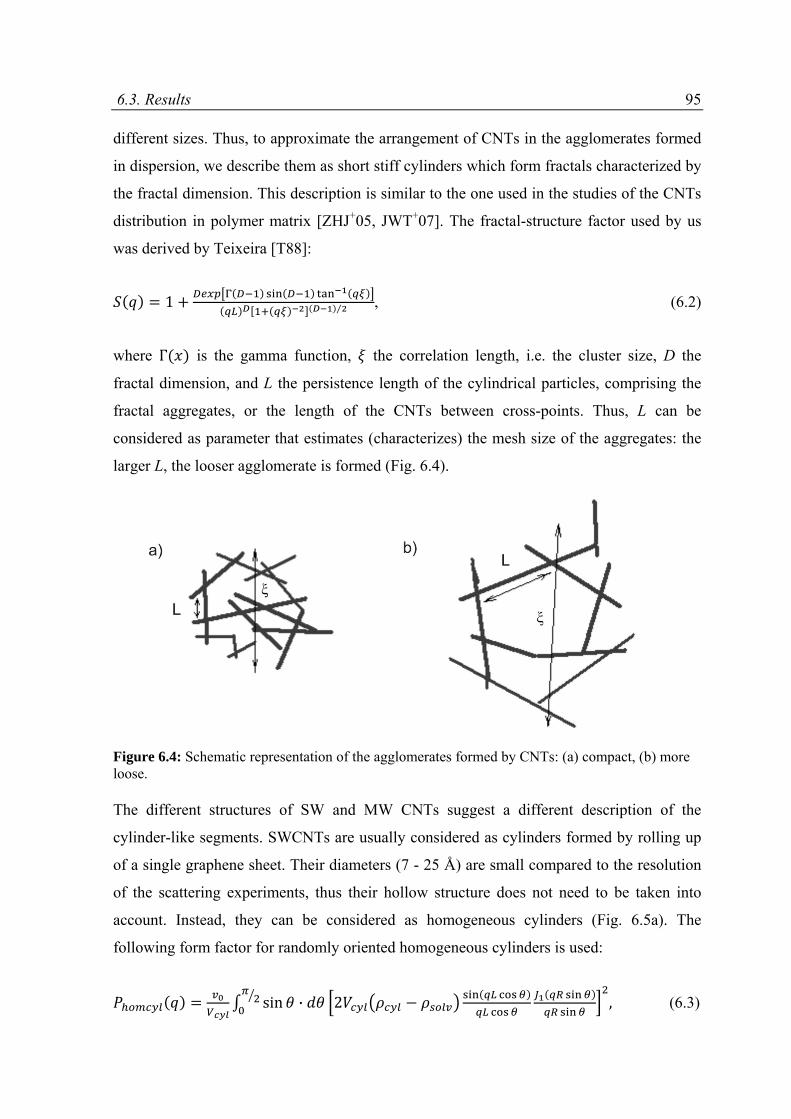
6.3. Results 95 different sizes. Thus, to approximate the arrangement of CNTs in the agglomerates formed
in dispersion, we describe them as short stiff cylinders which form fractals characterized by
the fractal dimension. This description is similar to the one used in the studies of the CNTs
distribution in polymer matrix [ZHJ+05, JWT+07]. The fractal-structure factor used by us
was derived by Teixeira [T88]:
1 ⁄ , (6.2)
where Γ is the gamma function, the correlation length, i.e. the cluster size, D the
fractal dimension, and L the persistence length of the cylindrical particles, comprising the
fractal aggregates, or the length of the CNTs between cross-points. Thus, L can be
considered as parameter that estimates (characterizes) the mesh size of the aggregates: the
larger L, the looser agglomerate is formed (Fig. 6.4).
Figure 6.4: Schematic representation of the agglomerates formed by CNTs: (a) compact, (b) more loose.
The different structures of SW and MW CNTs suggest a different description of the
cylinder-like segments. SWCNTs are usually considered as cylinders formed by rolling up
of a single graphene sheet. Their diameters (7 - 25 Å) are small compared to the resolution
of the scattering experiments, thus their hollow structure does not need to be taken into
account. Instead, they can be considered as homogeneous cylinders (Fig. 6.5a). The
following form factor for randomly oriented homogeneous cylinders is used:
sin · 2 , (6.3)
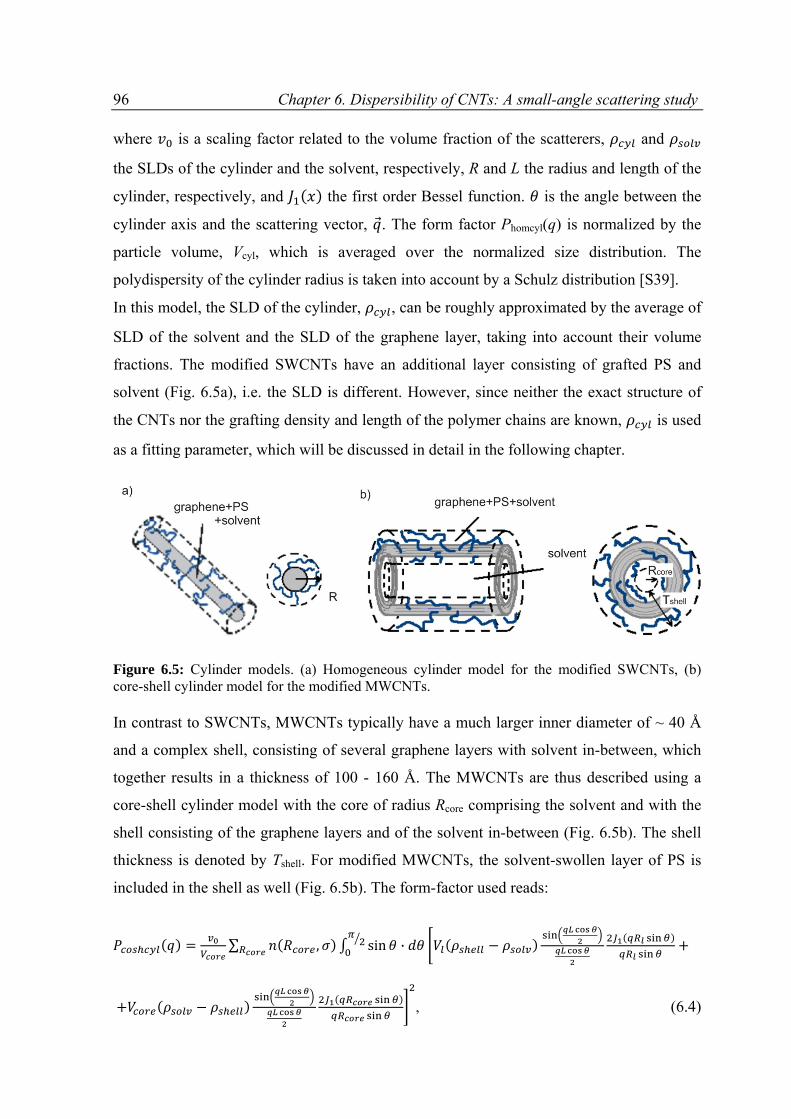
96 Chapter 6. Dispersibility of CNTs: A small-angle scattering study where is a scaling factor related to the volume fraction of the scatterers, and
the SLDs of the cylinder and the solvent, respectively, R and L the radius and length of the
cylinder, respectively, and the first order Bessel function. is the angle between the
cylinder axis and the scattering vector, . The form factor Phomcyl(q) is normalized by the
particle volume, Vcyl, which is averaged over the normalized size distribution. The
polydispersity of the cylinder radius is taken into account by a Schulz distribution [S39].
In this model, the SLD of the cylinder, , can be roughly approximated by the average of
SLD of the solvent and the SLD of the graphene layer, taking into account their volume
fractions. The modified SWCNTs have an additional layer consisting of grafted PS and
solvent (Fig. 6.5a), i.e. the SLD is different. However, since neither the exact structure of
the CNTs nor the grafting density and length of the polymer chains are known, is used
as a fitting parameter, which will be discussed in detail in the following chapter.
Figure 6.5: Cylinder models. (a) Homogeneous cylinder model for the modified SWCNTs, (b) core-shell cylinder model for the modified MWCNTs.
In contrast to SWCNTs, MWCNTs typically have a much larger inner diameter of ~ 40 Å
and a complex shell, consisting of several graphene layers with solvent in-between, which
together results in a thickness of 100 - 160 Å. The MWCNTs are thus described using a
core-shell cylinder model with the core of radius Rcore comprising the solvent and with the
shell consisting of the graphene layers and of the solvent in-between (Fig. 6.5b). The shell
thickness is denoted by Tshell. For modified MWCNTs, the solvent-swollen layer of PS is
included in the shell as well (Fig. 6.5b). The form-factor used reads:
∑ , sin ·
, (6.4)
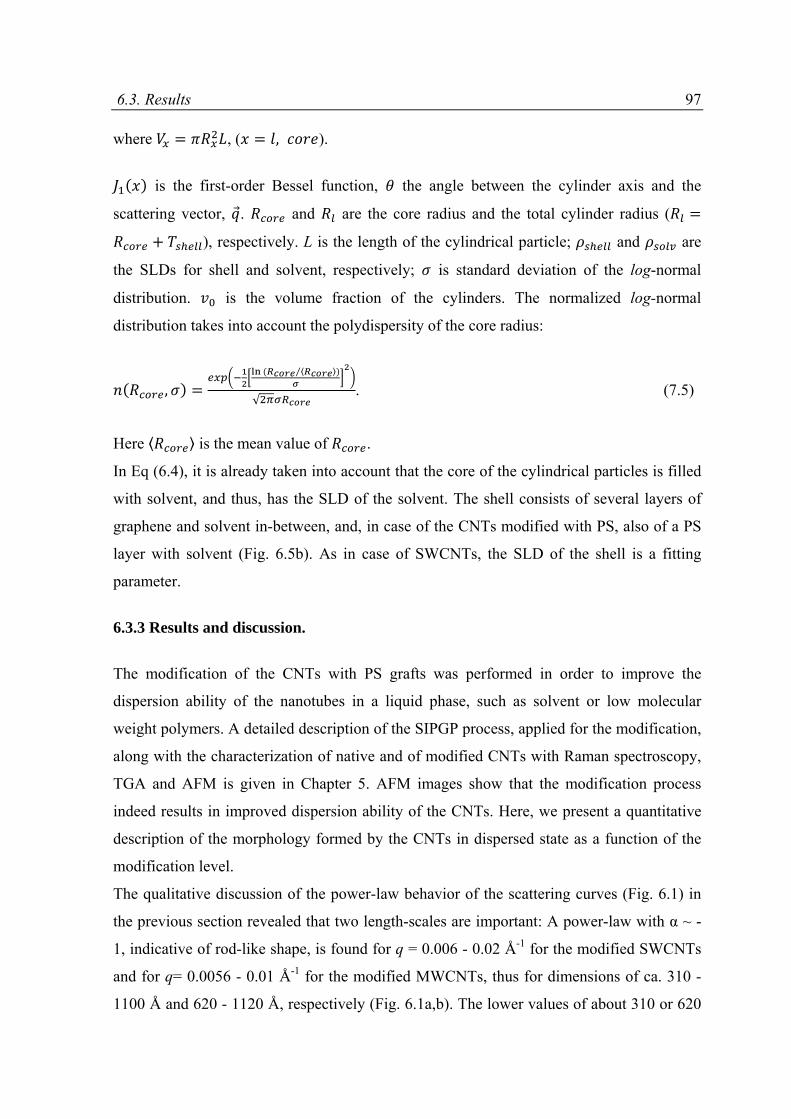
6.3. Results 97 where , ( , ).
is the first-order Bessel function, the angle between the cylinder axis and the
scattering vector, . and are the core radius and the total cylinder radius (
), respectively. L is the length of the cylindrical particle; and are
the SLDs for shell and solvent, respectively; is standard deviation of the log-normal
distribution. is the volume fraction of the cylinders. The normalized log-normal
distribution takes into account the polydispersity of the core radius:
, ⁄
√. (7.5)
Here is the mean value of .
In Eq (6.4), it is already taken into account that the core of the cylindrical particles is filled
with solvent, and thus, has the SLD of the solvent. The shell consists of several layers of
graphene and solvent in-between, and, in case of the CNTs modified with PS, also of a PS
layer with solvent (Fig. 6.5b). As in case of SWCNTs, the SLD of the shell is a fitting
parameter.
6.3.3 Results and discussion.
The modification of the CNTs with PS grafts was performed in order to improve the
dispersion ability of the nanotubes in a liquid phase, such as solvent or low molecular
weight polymers. A detailed description of the SIPGP process, applied for the modification,
along with the characterization of native and of modified CNTs with Raman spectroscopy,
TGA and AFM is given in Chapter 5. AFM images show that the modification process
indeed results in improved dispersion ability of the CNTs. Here, we present a quantitative
description of the morphology formed by the CNTs in dispersed state as a function of the
modification level.
The qualitative discussion of the power-law behavior of the scattering curves (Fig. 6.1) in
the previous section revealed that two length-scales are important: A power-law with α ~ -
1, indicative of rod-like shape, is found for q = 0.006 - 0.02 Å-1 for the modified SWCNTs
and for q= 0.0056 - 0.01 Å-1 for the modified MWCNTs, thus for dimensions of ca. 310 -
1100 Å and 620 - 1120 Å, respectively (Fig. 6.1a,b). The lower values of about 310 or 620
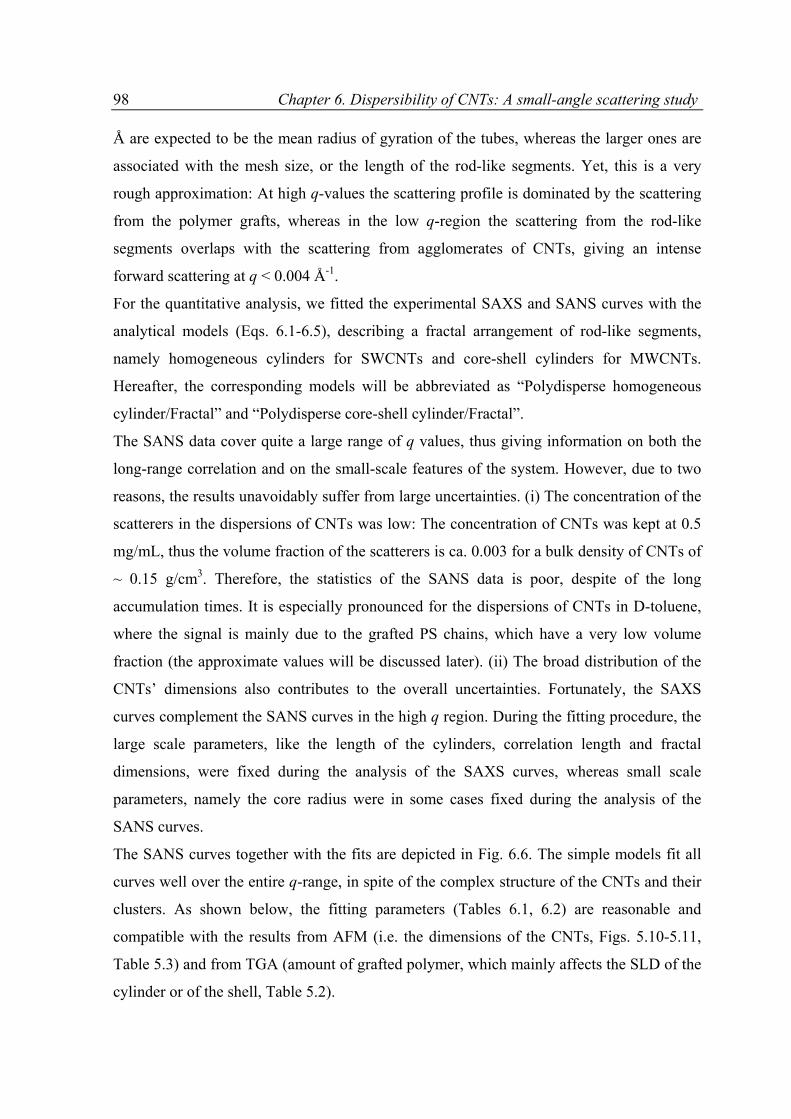
98 Chapter 6. Dispersibility of CNTs: A small-angle scattering study Å are expected to be the mean radius of gyration of the tubes, whereas the larger ones are
associated with the mesh size, or the length of the rod-like segments. Yet, this is a very
rough approximation: At high q-values the scattering profile is dominated by the scattering
from the polymer grafts, whereas in the low q-region the scattering from the rod-like
segments overlaps with the scattering from agglomerates of CNTs, giving an intense
forward scattering at q < 0.004 Å-1.
For the quantitative analysis, we fitted the experimental SAXS and SANS curves with the
analytical models (Eqs. 6.1-6.5), describing a fractal arrangement of rod-like segments,
namely homogeneous cylinders for SWCNTs and core-shell cylinders for MWCNTs.
Hereafter, the corresponding models will be abbreviated as “Polydisperse homogeneous
cylinder/Fractal” and “Polydisperse core-shell cylinder/Fractal”.
The SANS data cover quite a large range of q values, thus giving information on both the
long-range correlation and on the small-scale features of the system. However, due to two
reasons, the results unavoidably suffer from large uncertainties. (i) The concentration of the
scatterers in the dispersions of CNTs was low: The concentration of CNTs was kept at 0.5
mg/mL, thus the volume fraction of the scatterers is ca. 0.003 for a bulk density of CNTs of
~ 0.15 g/cm3. Therefore, the statistics of the SANS data is poor, despite of the long
accumulation times. It is especially pronounced for the dispersions of CNTs in D-toluene,
where the signal is mainly due to the grafted PS chains, which have a very low volume
fraction (the approximate values will be discussed later). (ii) The broad distribution of the
CNTs’ dimensions also contributes to the overall uncertainties. Fortunately, the SAXS
curves complement the SANS curves in the high q region. During the fitting procedure, the
large scale parameters, like the length of the cylinders, correlation length and fractal
dimensions, were fixed during the analysis of the SAXS curves, whereas small scale
parameters, namely the core radius were in some cases fixed during the analysis of the
SANS curves.
The SANS curves together with the fits are depicted in Fig. 6.6. The simple models fit all
curves well over the entire q-range, in spite of the complex structure of the CNTs and their
clusters. As shown below, the fitting parameters (Tables 6.1, 6.2) are reasonable and
compatible with the results from AFM (i.e. the dimensions of the CNTs, Figs. 5.10-5.11,
Table 5.3) and from TGA (amount of grafted polymer, which mainly affects the SLD of the
cylinder or of the shell, Table 5.2).
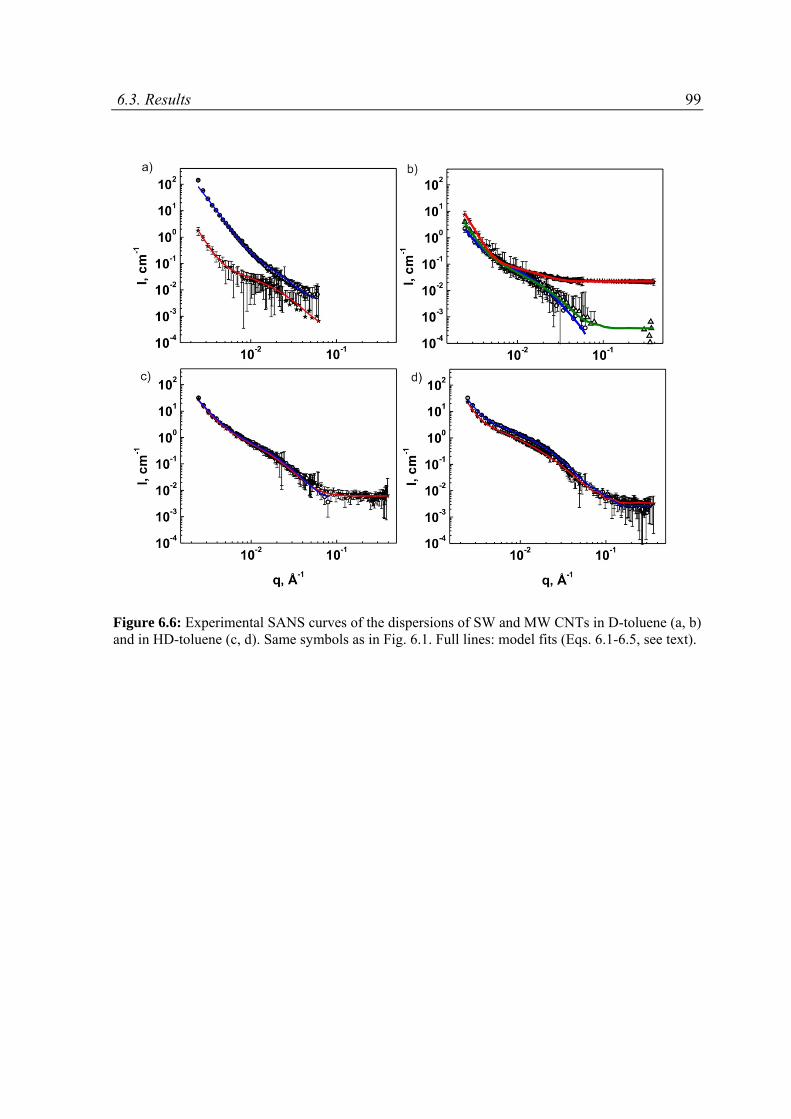
6.3. Results 99
Figure 6.6: Experimental SANS curves of the dispersions of SW and MW CNTs in D-toluene (a, b) and in HD-toluene (c, d). Same symbols as in Fig. 6.1. Full lines: model fits (Eqs. 6.1-6.5, see text).
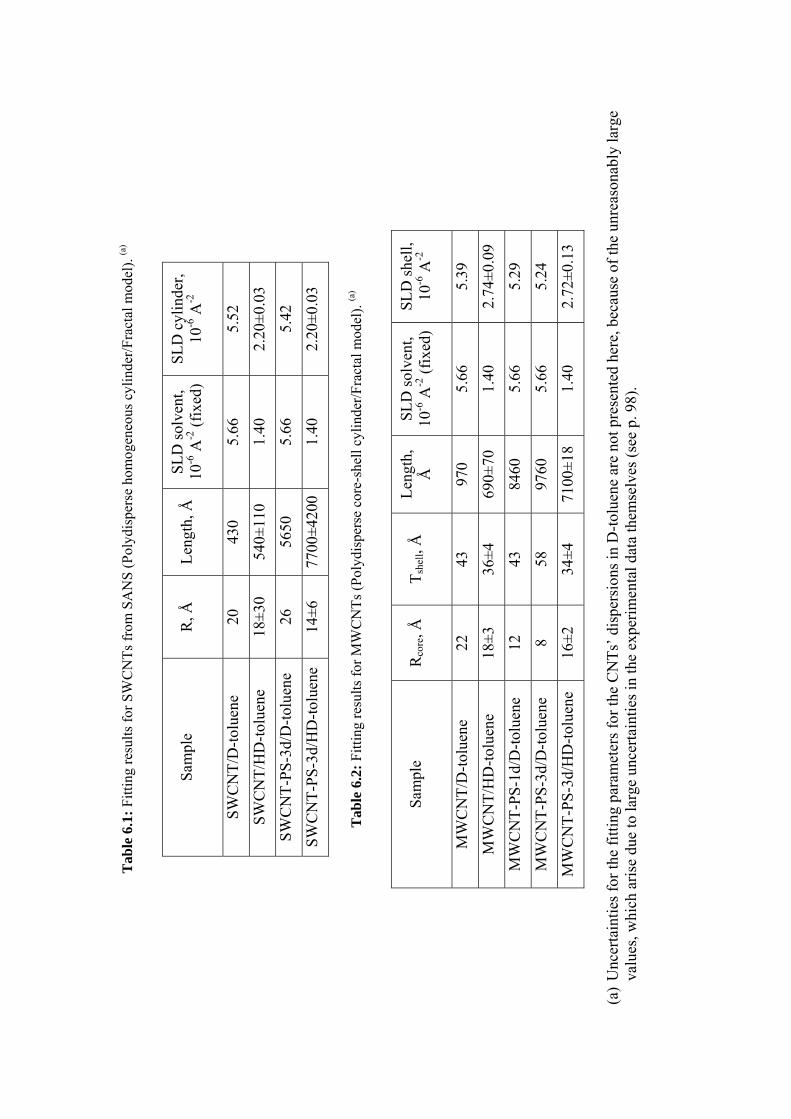
Tab
le 6
.1:
Fitt
ing
resu
lts
for
SW
CN
Ts
from
SA
NS
(P
olyd
ispe
rse
hom
ogen
eous
cyl
inde
r/F
ract
al m
odel
). (a
)
Sam
ple
R, Å
L
engt
h, Å
S
LD
sol
vent
, 10
-6 A
-2 (
fixe
d)S
LD
cyl
inde
r,
10-6
A-2
SW
CN
T/D
-tol
uene
20
43
0 5.
66
5.52
SW
CN
T/H
D-t
olue
ne
18±3
0 54
0±11
0 1.
40
2.20
±0.0
3
SW
CN
T-P
S-3
d/D
-tol
uene
26
56
50
5.66
5.
42
SW
CN
T-P
S-3
d/H
D-t
olue
ne
14±6
77
00±4
200
1.40
2.
20±0
.03
Tab
le 6
.2:
Fitt
ing
resu
lts
for
MW
CN
Ts
(Pol
ydis
pers
e co
re-s
hell
cyl
inde
r/F
ract
al m
odel
). (a
)
Sam
ple
Rco
re, Å
T
shel
l, Å
L
engt
h,
Å
SL
D s
olve
nt,
10-6
A-2
(fi
xed)
SL
D s
hell
, 10
-6 A
-2
MW
CN
T/D
-tol
uene
22
43
97
0 5.
66
5.39
MW
CN
T/H
D-t
olue
ne
18±3
36
±4
690±
70
1.40
2.
74±0
.09
MW
CN
T-P
S-1
d/D
-tol
uene
12
43
84
60
5.66
5.
29
MW
CN
T-P
S-3
d/D
-tol
uene
8
58
9760
5.
66
5.24
MW
CN
T-P
S-3
d/H
D-t
olue
ne
16±2
34
±4
7100
±18
1.40
2.
72±0
.13
(a)
Unc
erta
inti
es f
or th
e fi
ttin
g pa
ram
eter
s fo
r th
e C
NT
s’ d
ispe
rsio
ns in
D-t
olue
ne a
re n
ot p
rese
nted
her
e, b
ecau
se o
f th
e un
reas
onab
ly la
rge
valu
es, w
hich
ari
se d
ue to
larg
e un
cert
aint
ies
in th
e ex
peri
men
tal d
ata
them
selv
es (
see
p. 9
8).
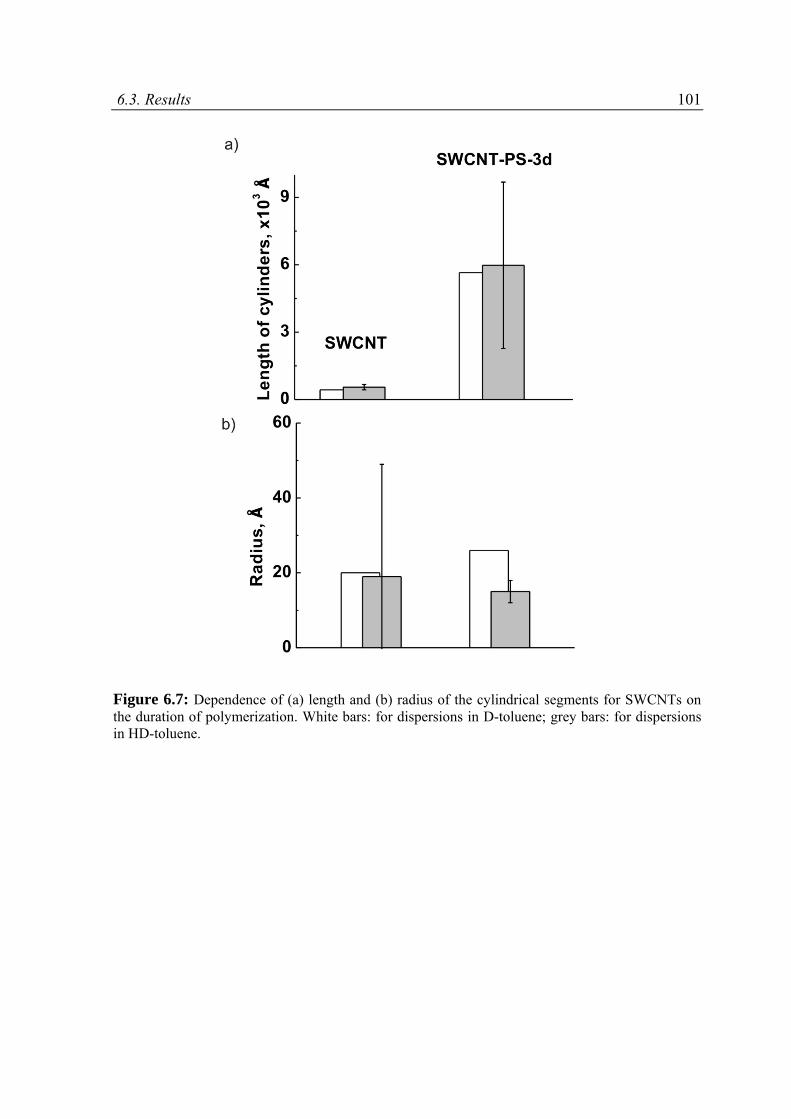
6.3. Results 101
Figure 6.7: Dependence of (a) length and (b) radius of the cylindrical segments for SWCNTs on the duration of polymerization. White bars: for dispersions in D-toluene; grey bars: for dispersions in HD-toluene.
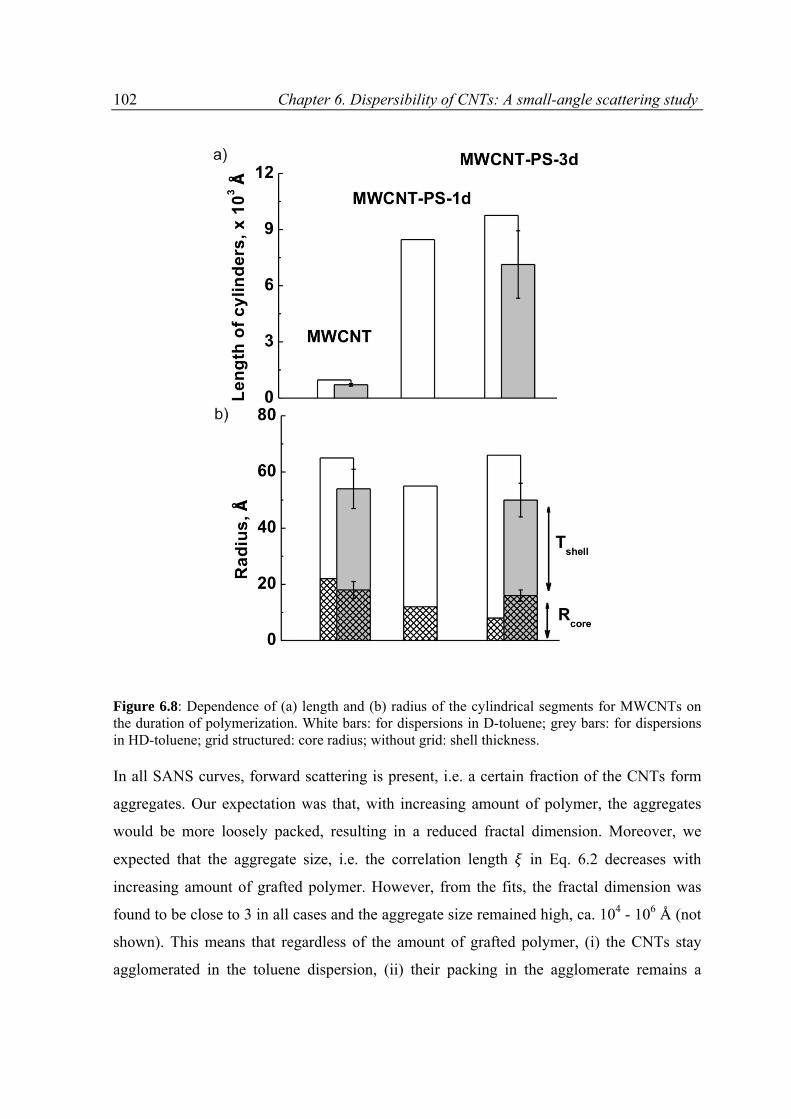
102 Chapter 6. Dispersibility of CNTs: A small-angle scattering study
Figure 6.8: Dependence of (a) length and (b) radius of the cylindrical segments for MWCNTs on the duration of polymerization. White bars: for dispersions in D-toluene; grey bars: for dispersions in HD-toluene; grid structured: core radius; without grid: shell thickness.
In all SANS curves, forward scattering is present, i.e. a certain fraction of the CNTs form
aggregates. Our expectation was that, with increasing amount of polymer, the aggregates
would be more loosely packed, resulting in a reduced fractal dimension. Moreover, we
expected that the aggregate size, i.e. the correlation length in Eq. 6.2 decreases with
increasing amount of grafted polymer. However, from the fits, the fractal dimension was
found to be close to 3 in all cases and the aggregate size remained high, ca. 104 - 106 Å (not
shown). This means that regardless of the amount of grafted polymer, (i) the CNTs stay
agglomerated in the toluene dispersion, (ii) their packing in the agglomerate remains a
6.3. Results 103 three-dimensional network of rod-like segments, and (iii) the agglomerate size remains
unchanged.
Nevertheless, on smaller length scales, the modification of the SW and MW CNTs indeed
affects their dispersion ability. The length of the cylindrical segments increases
significantly for all samples (from ca. 700 - 900 Å up to ca. 7000 - 9000 Å) with the
amount of grafted polymer (Figs. 6.7a, 6.8a, Tables 6.1,6.2), i.e. the mesh size in the fractal
aggregate increases significantly, which means that the agglomerates are much more
loosely packed in case of the CNTs modified with PS grafts compared to the native ones.
Special consideration is required for the dependence of the shell thickness (in case of
MWCNTs) or of the tube diameter (for SWCNTs) on the modification level of the CNTs.
In HD-toluene, where the bare MWCNTs are highlighted and the PS shell is not expected
to be observable, the shell thickness and the total radius are unaffected by the modification
(shell thickness ca. 34 - 36 Å, total radius ca. 50 - 54 Å). The core radius stays constant
within the uncertainties. On contrary, in D-toluene the PS-grafts are highlighted. Therefore,
changes in cross-section dimensions of the native MWCNTs and of the modified ones are
observed: As expected, for modified MWCNTs, the shell thickness is with 58 Å (MWCNT-
PS-3d) larger than for the native MWCNTs (43 Å) (Fig. 6.8b, Table 6.2). In case of the
MWCNT-PS-1d it is, however, of approx the same value as for the native MWCNTs (43
Å). We should keep in mind that these values are averaged over a large number of different
CNTs. Similar shell thicknesses of MWCNTs and MWCNT-PS-1d might, therefore,
indicate that (i) the short polymer chains are mainly wrapped around CNTs and/or (ii)
better exfoliation of the modified CNTs compared to the native ones is observed (the
“thick” (roped) tubes are dominated by the “thinner” ones in case of the modified sample).
Interestingly, in D-toluene, the core radius of the MWCNTs decreases with increasing
functionalization level: the inner diameter decreases from 22 Å for native MWCNTs to 12
Å for MWCNT-PS-1d and to 8 Å for MWCNT-PS-3d (Fig. 6.8b, Table 6.2). This indicates
the presence of PS grafts not only on the outer walls of the CNTs but on the inner ones as
well. The result is consistent with the conclusion about the intercalative growth of polymer
chains on CNTs made on the base of Raman spectroscopy and TGA analysis (see Chapter
5).
From the comparison of the shell thicknesses of native and modified MWCNTs, the
thickness of the PS shell is up to 10 - 20 Å.
104 Chapter 6. Dispersibility of CNTs: A small-angle scattering study In the SWCNT system, core and shell cannot be distinguished, but the entire CNT/PS
structure is described as a homogeneous cylinder. In D-toluene, the radii of the dispersed
native SWCNTs were found at ca. 20 Å and a slightly increased value (26 Å) is found for
SWCNT-PS-3d (Fig. 6.7b, Table 6.1). The value of 20 Å is at least twice as large as
specified for a single SWCNT (diameters of 7 - 25 Å according to the manufacturer). This
means that the SWCNTs form some kind of ropes consisting of several tubes. The
formation of such ropes may also explain why the radius increases only slightly with
increase of modification level. When the CNTs are modified, in addition to the increase of
the CNTs’ radius due to the PS grafts, their dispersion ability increases, and the modified
CNTs can be more easily exfoliated from the ropes existing in the native samples, and thus,
form the ropes consisting of less tubes. On contrary, non-modified CNTs more likely stay
agglomerated (which is confirmed by AFM, Fig. 5.10-5.11, Chapter 5). These effects
counteract, and thus the average radius is unchanged upon modification. The SANS
experiments in HD-toluene, where bare CNTs are highlighted, confirm this idea: Whereas
native SWCNTs have radii of ca. 18 Å, SWCNTs-PS-3d have a smaller radius of ca. 14 Å
(Table 6.1).
The value of the SLDs of the modeled cylinders contains a wealth of information. The
simplified models imply a homogeneous and constant SLD of the cylindrical segments in
the case of SWCNTs or within the core and the shell in MWCNTs. However, real CNTs
have a hollow-core structure with one (for SWCNTs) or several (for MWCNTs) Ångstrøm
thick graphene walls with an inter-layer distance of ca. 3.4 Å in-between. Moreover, the
modified CNTs are decorated additionally with PS grafts, which are presumably
inhomogeneously distributed along the tubes (Fig. 6.5). Furthermore, the grafting of PS is
presumably intercalative, resulting in the presence of polymer in between the graphene
layers and inside the tubes (Chapter 5, [SGZ+11]). When dispersed in a solvent, all the gaps
between the graphene layers and between the PS grafts are filled with the solvent. Thus, the
cylindrical segments represent a three-component system of graphene, solvent and PS. In
the ideal case of an n-phase system, where each of the phases has a constant scattering
length density (i = 1... n) and the volume fraction (with ∑ 1), the average
SLD is determined as ∑ . Neglecting the inhomogeneities within the
individual phases, which arise due to the atomic nature of the material and to the density
fluctuations at all size scales, characteristic of the real systems, we can estimate the SLDs
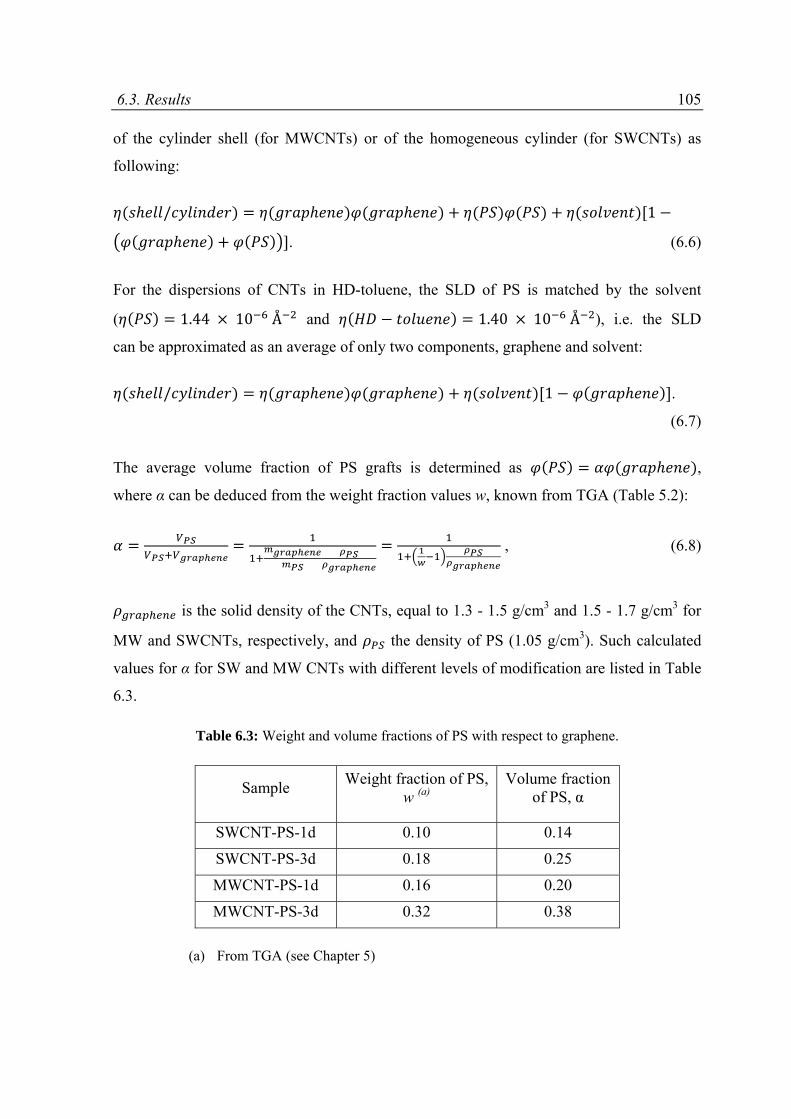
6.3. Results 105 of the cylinder shell (for MWCNTs) or of the homogeneous cylinder (for SWCNTs) as
following:
/ 1
. (6.6)
For the dispersions of CNTs in HD-toluene, the SLD of PS is matched by the solvent
( 1.44 10 Å and 1.40 10 Å ), i.e. the SLD
can be approximated as an average of only two components, graphene and solvent:
/ 1 .
(6.7)
The average volume fraction of PS grafts is determined as ,
where α can be deduced from the weight fraction values w, known from TGA (Table 5.2):
, (6.8)
is the solid density of the CNTs, equal to 1.3 - 1.5 g/cm3 and 1.5 - 1.7 g/cm3 for
MW and SWCNTs, respectively, and the density of PS (1.05 g/cm3). Such calculated
values for α for SW and MW CNTs with different levels of modification are listed in Table
6.3.
Table 6.3: Weight and volume fractions of PS with respect to graphene.
Sample Weight fraction of PS,
w (a) Volume fraction
of PS, α
SWCNT-PS-1d 0.10 0.14
SWCNT-PS-3d 0.18 0.25
MWCNT-PS-1d 0.16 0.20
MWCNT-PS-3d 0.32 0.38
(a) From TGA (see Chapter 5)

106 Chapter 6. Dispersibility of CNTs: A small-angle scattering study From the values of the SLDs of the shell or cylinder together with equations (6.6-6.7), we
can determine the volume fraction of the graphene layers in the cylindrical segments, and
thus, the thickness of the graphene layers. The obtained thickness values are in the range 8-
15 Å for the shell of the MWCNTs and 3 – 5 Å for SWCNTs (Tables 6.4, 6.5).
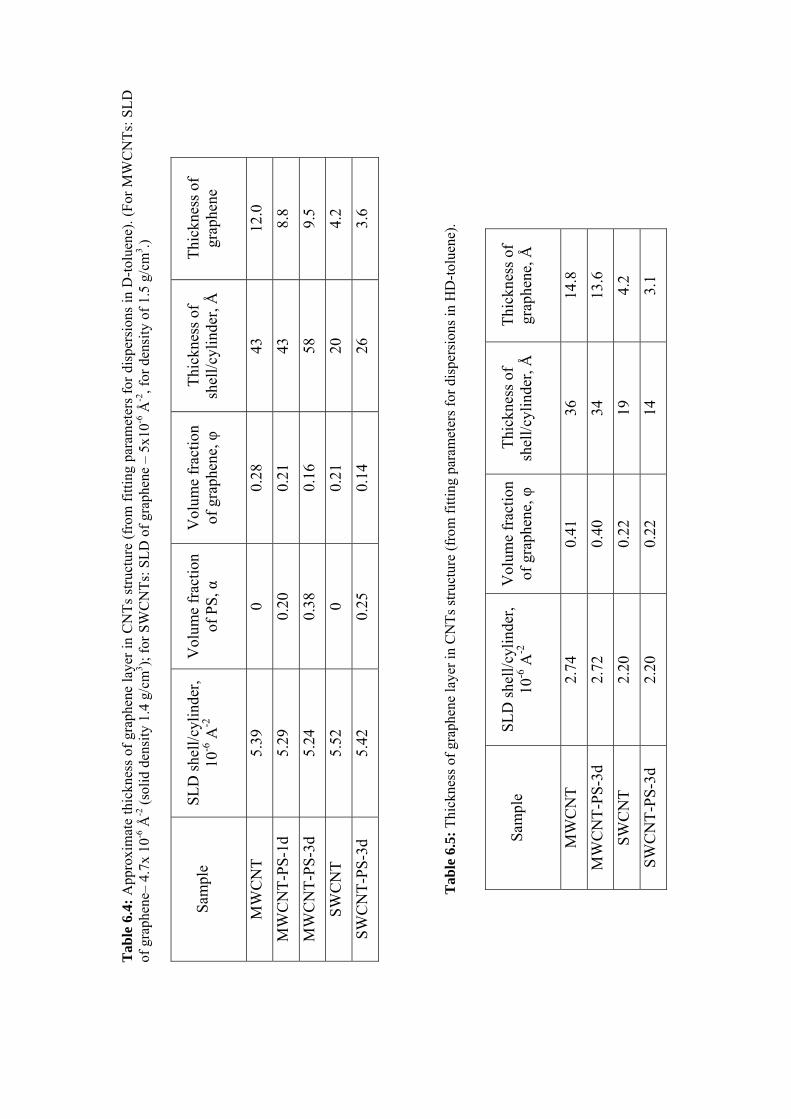
Tab
le 6
.4:
App
roxi
mat
e th
ickn
ess
of g
raph
ene
laye
r in
CN
Ts
stru
ctur
e (f
rom
fit
ting
par
amet
ers
for
disp
ersi
ons
in D
-tol
uene
). (
For
MW
CN
Ts:
SL
D
of g
raph
ene–
4.7
x 10
-6 Å
-2 (
soli
d de
nsity
1.4
g/c
m3 );
for
SW
CN
Ts:
SL
D o
f gr
aphe
ne –
5x1
0-6 Å
-2, f
or d
ensi
ty o
f 1.
5 g/
cm3 .)
Sam
ple
SL
D s
hell
/cyl
inde
r,
10-6
A-2
V
olum
e fr
acti
on
of P
S, α
V
olum
e fr
acti
on
of g
raph
ene,
φ
Thi
ckne
ss o
f sh
ell/
cyli
nder
, Å
Thi
ckne
ss o
f gr
aphe
ne
MW
CN
T
5.39
0
0.28
43
12
.0
MW
CN
T-P
S-1
d 5.
29
0.20
0.
21
43
8.8
MW
CN
T-P
S-3
d 5.
24
0.38
0.
16
58
9.5
SW
CN
T
5.52
0
0.21
20
4.
2
SW
CN
T-P
S-3
d 5.
42
0.25
0.
14
26
3.6
Tab
le 6
.5:
Thi
ckne
ss o
f gr
aphe
ne la
yer
in C
NT
s st
ruct
ure
(fro
m f
itti
ng p
aram
eter
s fo
r di
sper
sion
s in
HD
-tol
uene
).
Sam
ple
SL
D s
hell
/cyl
inde
r,
10-6
A-2
V
olum
e fr
acti
on
of g
raph
ene,
φ
Thi
ckne
ss o
f sh
ell/
cyli
nder
, Å
Thi
ckne
ss o
f gr
aphe
ne, Å
MW
CN
T
2.74
0.
41
36
14.8
MW
CN
T-P
S-3
d 2.
72
0.40
34
13
.6
SW
CN
T
2.20
0.
22
19
4.2
SW
CN
T-P
S-3
d 2.
20
0.22
14
3.
1
108 Chapter 6. Dispersibility of CNTs: A small-angle scattering study In order to estimate the number of the walls comprising the MWCNTs and how many
SWCNTs form ropes, we need to know the thickness of single graphene layer in CNTs.
Despite of a number of theoretical calculations of the thickness of the CNTs walls, in fact,
there is no consensus on the exact value of the CNT wall thickness. Some theoretical
calculations suggest the wall thickness to be equal to the graphite inter-layer spacing (3.4
Å) [L97] or the doubled C-C bond length in the CNTs structure [CBT+04]. In the model of
Cai et al. [CWY+09], the wall thickness is defined as the ‘thickness’ of the electron cloud of
an SWCNT and is approximately equal to 3.2 Å and, thus, slightly larger than the twice of
the C-C bond length (2.824 Å). The thickness of 3.2 - 3.4 Å, however, is an order of
magnitude larger than the other results. For instance, the values in the range of 0.6 - 0.9 Å
are reported by atomistic simulations and continuum shell models [HWH06]. Energy
equivalence between molecular and structural mechanics provides a wall thickness of 1.47
Å [TPF05].
Similar uncertainty concerns the interlayer distance between the walls (separation between
the layers). Usually it is considered to be constant at 3.4 Å, which is 3 - 5% larger than that
of the graphite-layer spacing [I91, EA92]. However, Kiang et al. pointed out that the
spacing between graphene layers may depend on the tubes curvature and the number of
layers, thus ranging from 0.342 to 0.375 nm [KEA+98].
Taking the mean value of about 1.0 - 1.5 Å for the wall thickness and 3.4 Å for the inter-
layer distance, we obtain that the MWCNTs with 8 walls, have a shell thickness of 31.8 –
35.8 Å, which is comparable with both the fitted wall thickness and the mean value of the
walls’ number from the specification of the manufacturer. Also, the calculated graphene
thickness in the order of 8 - 15 Å corresponds to MWCNTs composed of 8 - 10 walls.
Values of 3 - 5 Å for graphene thickness found for the SWCNTs means that 2 - 4 CNTs
form some kind of ropes.
Also, the SAXS experimental data are approximated by the models suggested for SW and
MW CNTs relatively well (Fig. 6.9). However, for the MWCNTs systems there are
deviations of the modeled curve from the experimental values at high q-values, where,
probably, the model is much too simple for the perfect description of the small-scale
features (Fig. 6.9b). Though the length of the cylindrical segments cannot be resolved
within this q-range, the overall tendency of the scattering profile gives an adequate fitting
values which are in good agreement with the SANS results. The SAXS fitting parameters
differ from the fitting parameters for SANS experiments (CNTs in D-toluene) within a
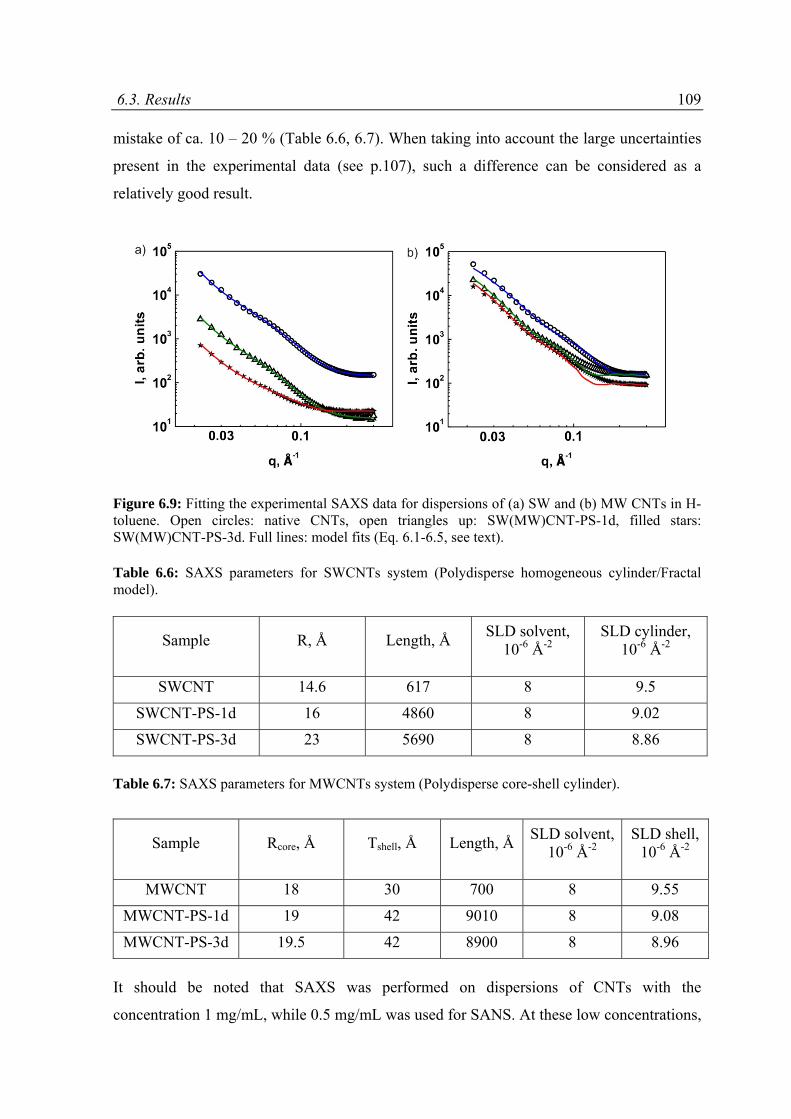
6.3. Results 109 mistake of ca. 10 – 20 % (Table 6.6, 6.7). When taking into account the large uncertainties
present in the experimental data (see p.107), such a difference can be considered as a
relatively good result.
Figure 6.9: Fitting the experimental SAXS data for dispersions of (a) SW and (b) MW CNTs in H-toluene. Open circles: native CNTs, open triangles up: SW(MW)CNT-PS-1d, filled stars: SW(MW)CNT-PS-3d. Full lines: model fits (Eq. 6.1-6.5, see text).
Table 6.6: SAXS parameters for SWCNTs system (Polydisperse homogeneous cylinder/Fractal model).
Sample R, Å Length, Å SLD solvent,
10-6 Å-2 SLD cylinder,
10-6 Å-2
SWCNT 14.6 617 8 9.5
SWCNT-PS-1d 16 4860 8 9.02
SWCNT-PS-3d 23 5690 8 8.86
Table 6.7: SAXS parameters for MWCNTs system (Polydisperse core-shell cylinder).
Sample Rcore, Å Tshell, Å Length, Å SLD solvent,
10-6 Å-2 SLD shell,
10-6 Å-2
MWCNT 18 30 700 8 9.55
MWCNT-PS-1d 19 42 9010 8 9.08
MWCNT-PS-3d 19.5 42 8900 8 8.96
It should be noted that SAXS was performed on dispersions of CNTs with the
concentration 1 mg/mL, while 0.5 mg/mL was used for SANS. At these low concentrations,
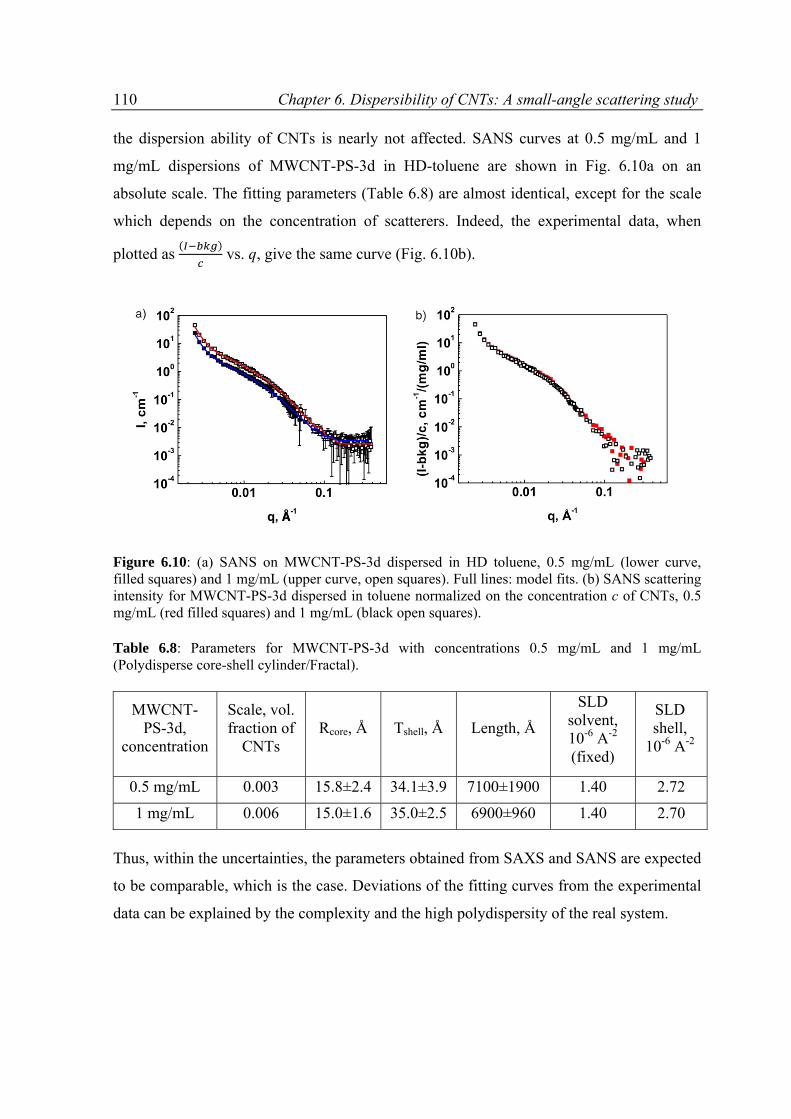
110 Chapter 6. Dispersibility of CNTs: A small-angle scattering study the dispersion ability of CNTs is nearly not affected. SANS curves at 0.5 mg/mL and 1
mg/mL dispersions of MWCNT-PS-3d in HD-toluene are shown in Fig. 6.10a on an
absolute scale. The fitting parameters (Table 6.8) are almost identical, except for the scale
which depends on the concentration of scatterers. Indeed, the experimental data, when
plotted as vs. q, give the same curve (Fig. 6.10b).
Figure 6.10: (a) SANS on MWCNT-PS-3d dispersed in HD toluene, 0.5 mg/mL (lower curve, filled squares) and 1 mg/mL (upper curve, open squares). Full lines: model fits. (b) SANS scattering intensity for MWCNT-PS-3d dispersed in toluene normalized on the concentration c of CNTs, 0.5 mg/mL (red filled squares) and 1 mg/mL (black open squares).
Table 6.8: Parameters for MWCNT-PS-3d with concentrations 0.5 mg/mL and 1 mg/mL (Polydisperse core-shell cylinder/Fractal).
MWCNT-PS-3d,
concentration
Scale, vol. fraction of
CNTs Rcore, Å Tshell, Å Length, Å
SLD solvent, 10-6 A-2
(fixed)
SLD shell,
10-6 A-2
0.5 mg/mL 0.003 15.8±2.4 34.1±3.9 7100±1900 1.40 2.72
1 mg/mL 0.006 15.0±1.6 35.0±2.5 6900±960 1.40 2.70
Thus, within the uncertainties, the parameters obtained from SAXS and SANS are expected
to be comparable, which is the case. Deviations of the fitting curves from the experimental
data can be explained by the complexity and the high polydispersity of the real system.
6.4. Conclusions 111
6.4 Conclusions
Small-angle neutron and X-ray scattering (SANS/SAXS) experiments performed on
dispersions of CNTs in a liquid phase (toluene) gave insight into the structures formed by
the CNTs in dispersion and allowed to study the influence of modification of the CNTs
with PS grafts on both their morphology and aggregation behavior. Despite the high
polydispersity of the system and the complex structure of the CNTs, the model system of
cylindrical particles with fractal ordering fits the experimental curves well. We found that
the modification of the CNTs with polymer grafts indeed leads to an improved dispersion
ability of the CNTs resulting in loose agglomerates with a mesh size of ~7000 - 9000 Å,
which is one order of magnitude higher compared to the compact clusters formed by native
CNTs. SWCNTs when dispersed in solvent most probably form ropes consisting of 2 – 4
tubes. Alteration of the solvent (D-toluene or HD-toluene) in SANS experiments allowed
us to characterize the shell formed by PS grafts. We conclude that grafting occurs not only
on the outer walls of the CNTs, but, in case of MWCNTs, on the inner tubes as well. The
PS shell itself is about 10 - 20 Å thick.
The presented study is almost the only example of the extensive characterization of the
behavior of CNTs in a liquid phase (solvent) and its dependence on the modification of
CNTs: Most of the previous works, as discussed in Chapter 6.1, concern the study of
distribution of CNTs in a solid phase (polymer matrix). Characterization of dispersion
ability of CNTs in a solvent allows to study both the dispersion ability of CNTs and the
morphological changes of CNTs themselves upon modification (polymer grafts), whereas
the latter is not possible when CNTs are already introduced in a polymer matrix. Also, the
characterization of dispersion ability of CNTs in solvents as a function of their modification
level is advantageous for optimization of the solution processing for preparation of
CNTs/polymer nanocomposites.

112
7 CNT/Block copolymer nanocomposites
7.1 Block copolymer as a matrix for CNT/polymer
nanocomposites
In Chapter 2 a few examples of successful utilization of block copolymers (BCP) for
noncovalent modification of CNTs were already shown: Due to the affinity of one of the
blocks of the BCP to CNTs and of the other one to the solvent, the improved dispersion of
the CNTs can be achieved. However, there is another, maybe even more promising,
application of BCPs, namely as a matrix for CNT/polymer nanocomposites.
The schematic representation of the diblock copolymer is depicted in Fig. 7.1a. It consists
of the blocks A and B that are made up of different polymerized monomers and covalently
connected to each other. In general, BCP may include three or more blocks, but for
simplicity we will focus on diblock copolymers. Let us consider a melt of such a polymer.
It is clear that if the blocks are immiscible with each other, they tend to segregate, but,
because the blocks are covalently bonded to each other, the full-scale macrophase
separation is impossible. The result of this conflict is the so-called microphase separation
with the formation of A- and B-rich domains. Depending on the relative length of each
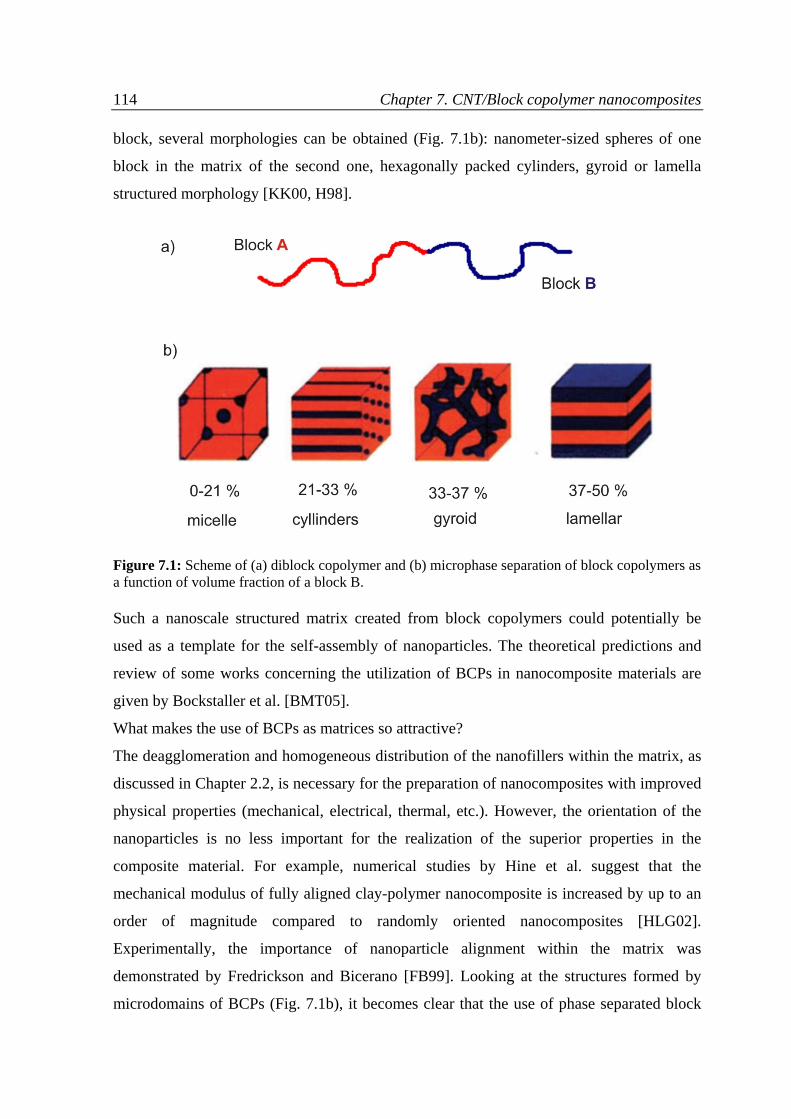
114 Chapter 7. CNT/Block copolymer nanocomposites
block, several morphologies can be obtained (Fig. 7.1b): nanometer-sized spheres of one
block in the matrix of the second one, hexagonally packed cylinders, gyroid or lamella
structured morphology [KK00, H98].
Figure 7.1: Scheme of (a) diblock copolymer and (b) microphase separation of block copolymers as a function of volume fraction of a block B.
Such a nanoscale structured matrix created from block copolymers could potentially be
used as a template for the self-assembly of nanoparticles. The theoretical predictions and
review of some works concerning the utilization of BCPs in nanocomposite materials are
given by Bockstaller et al. [BMT05].
What makes the use of BCPs as matrices so attractive?
The deagglomeration and homogeneous distribution of the nanofillers within the matrix, as
discussed in Chapter 2.2, is necessary for the preparation of nanocomposites with improved
physical properties (mechanical, electrical, thermal, etc.). However, the orientation of the
nanoparticles is no less important for the realization of the superior properties in the
composite material. For example, numerical studies by Hine et al. suggest that the
mechanical modulus of fully aligned clay-polymer nanocomposite is increased by up to an
order of magnitude compared to randomly oriented nanocomposites [HLG02].
Experimentally, the importance of nanoparticle alignment within the matrix was
demonstrated by Fredrickson and Bicerano [FB99]. Looking at the structures formed by
microdomains of BCPs (Fig. 7.1b), it becomes clear that the use of phase separated block
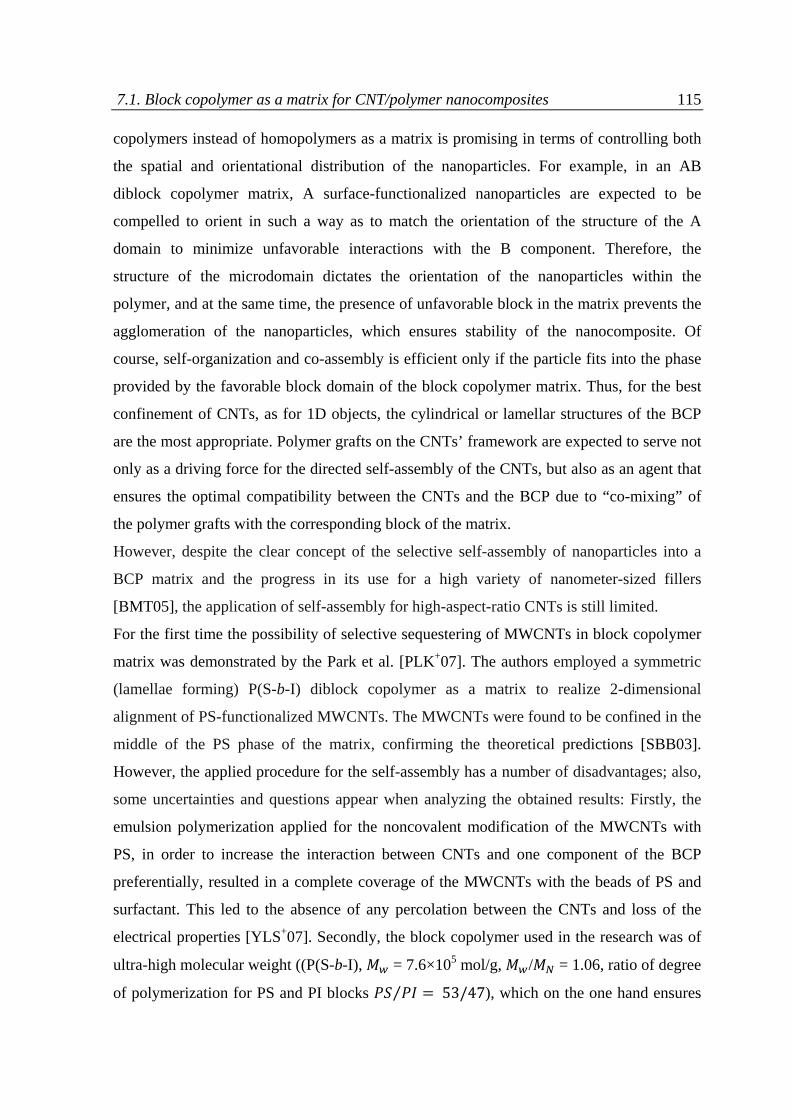
7.1. Block copolymer as a matrix for CNT/polymer nanocomposites 115 copolymers instead of homopolymers as a matrix is promising in terms of controlling both
the spatial and orientational distribution of the nanoparticles. For example, in an AB
diblock copolymer matrix, A surface-functionalized nanoparticles are expected to be
compelled to orient in such a way as to match the orientation of the structure of the A
domain to minimize unfavorable interactions with the B component. Therefore, the
structure of the microdomain dictates the orientation of the nanoparticles within the
polymer, and at the same time, the presence of unfavorable block in the matrix prevents the
agglomeration of the nanoparticles, which ensures stability of the nanocomposite. Of
course, self-organization and co-assembly is efficient only if the particle fits into the phase
provided by the favorable block domain of the block copolymer matrix. Thus, for the best
confinement of CNTs, as for 1D objects, the cylindrical or lamellar structures of the BCP
are the most appropriate. Polymer grafts on the CNTs’ framework are expected to serve not
only as a driving force for the directed self-assembly of the CNTs, but also as an agent that
ensures the optimal compatibility between the CNTs and the BCP due to “co-mixing” of
the polymer grafts with the corresponding block of the matrix.
However, despite the clear concept of the selective self-assembly of nanoparticles into a
BCP matrix and the progress in its use for a high variety of nanometer-sized fillers
[BMT05], the application of self-assembly for high-aspect-ratio CNTs is still limited.
For the first time the possibility of selective sequestering of MWCNTs in block copolymer
matrix was demonstrated by the Park et al. [PLK+07]. The authors employed a symmetric
(lamellae forming) P(S-b-I) diblock copolymer as a matrix to realize 2-dimensional
alignment of PS-functionalized MWCNTs. The MWCNTs were found to be confined in the
middle of the PS phase of the matrix, confirming the theoretical predictions [SBB03].
However, the applied procedure for the self-assembly has a number of disadvantages; also,
some uncertainties and questions appear when analyzing the obtained results: Firstly, the
emulsion polymerization applied for the noncovalent modification of the MWCNTs with
PS, in order to increase the interaction between CNTs and one component of the BCP
preferentially, resulted in a complete coverage of the MWCNTs with the beads of PS and
surfactant. This led to the absence of any percolation between the CNTs and loss of the
electrical properties [YLS+07]. Secondly, the block copolymer used in the research was of
ultra-high molecular weight ((P(S-b-I), = 7.6×10⁵ mol/g, / = 1.06, ratio of degree
of polymerization for PS and PI blocks ⁄ 53/47), which on the one hand ensures
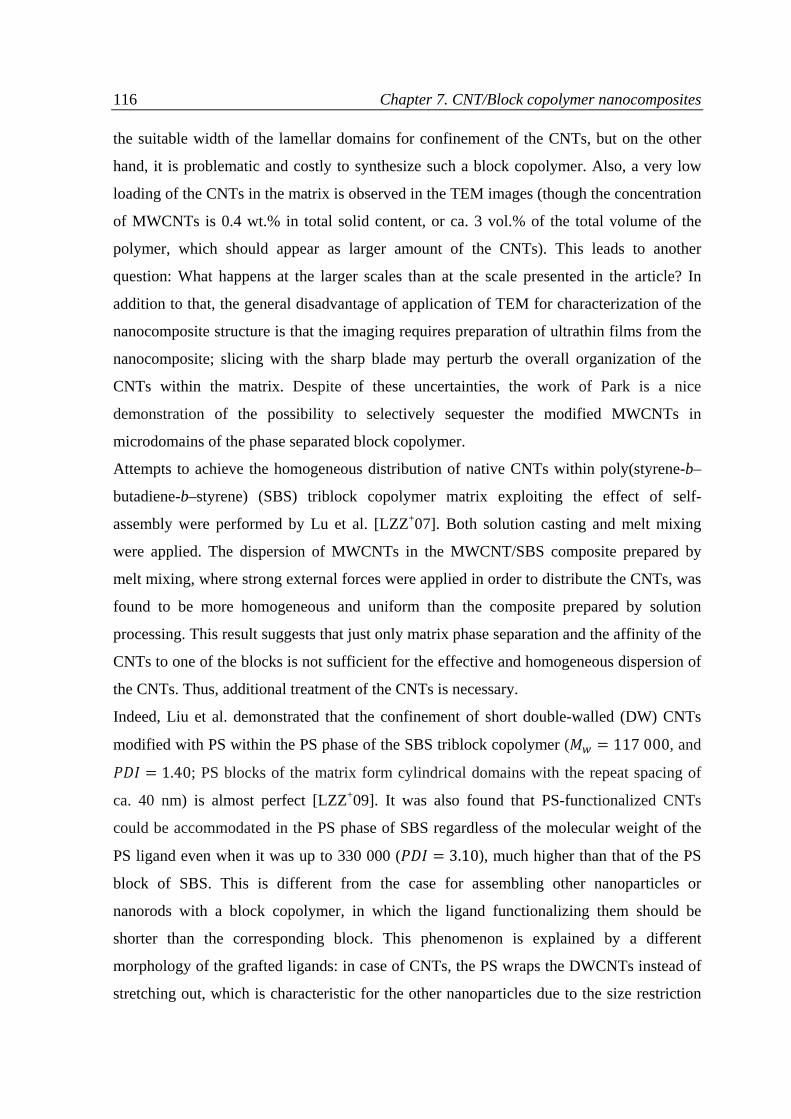
116 Chapter 7. CNT/Block copolymer nanocomposites
the suitable width of the lamellar domains for confinement of the CNTs, but on the other
hand, it is problematic and costly to synthesize such a block copolymer. Also, a very low
loading of the CNTs in the matrix is observed in the TEM images (though the concentration
of MWCNTs is 0.4 wt.% in total solid content, or ca. 3 vol.% of the total volume of the
polymer, which should appear as larger amount of the CNTs). This leads to another
question: What happens at the larger scales than at the scale presented in the article? In
addition to that, the general disadvantage of application of TEM for characterization of the
nanocomposite structure is that the imaging requires preparation of ultrathin films from the
nanocomposite; slicing with the sharp blade may perturb the overall organization of the
CNTs within the matrix. Despite of these uncertainties, the work of Park is a nice
demonstration of the possibility to selectively sequester the modified MWCNTs in
microdomains of the phase separated block copolymer.
Attempts to achieve the homogeneous distribution of native CNTs within poly(styrene-b–
butadiene-b–styrene) (SBS) triblock copolymer matrix exploiting the effect of self-
assembly were performed by Lu et al. [LZZ+07]. Both solution casting and melt mixing
were applied. The dispersion of MWCNTs in the MWCNT/SBS composite prepared by
melt mixing, where strong external forces were applied in order to distribute the CNTs, was
found to be more homogeneous and uniform than the composite prepared by solution
processing. This result suggests that just only matrix phase separation and the affinity of the
CNTs to one of the blocks is not sufficient for the effective and homogeneous dispersion of
the CNTs. Thus, additional treatment of the CNTs is necessary.
Indeed, Liu et al. demonstrated that the confinement of short double-walled (DW) CNTs
modified with PS within the PS phase of the SBS triblock copolymer ( 117 000, and
1.40; PS blocks of the matrix form cylindrical domains with the repeat spacing of
ca. 40 nm) is almost perfect [LZZ+09]. It was also found that PS-functionalized CNTs
could be accommodated in the PS phase of SBS regardless of the molecular weight of the
PS ligand even when it was up to 330 000 ( 3.10), much higher than that of the PS
block of SBS. This is different from the case for assembling other nanoparticles or
nanorods with a block copolymer, in which the ligand functionalizing them should be
shorter than the corresponding block. This phenomenon is explained by a different
morphology of the grafted ligands: in case of CNTs, the PS wraps the DWCNTs instead of
stretching out, which is characteristic for the other nanoparticles due to the size restriction
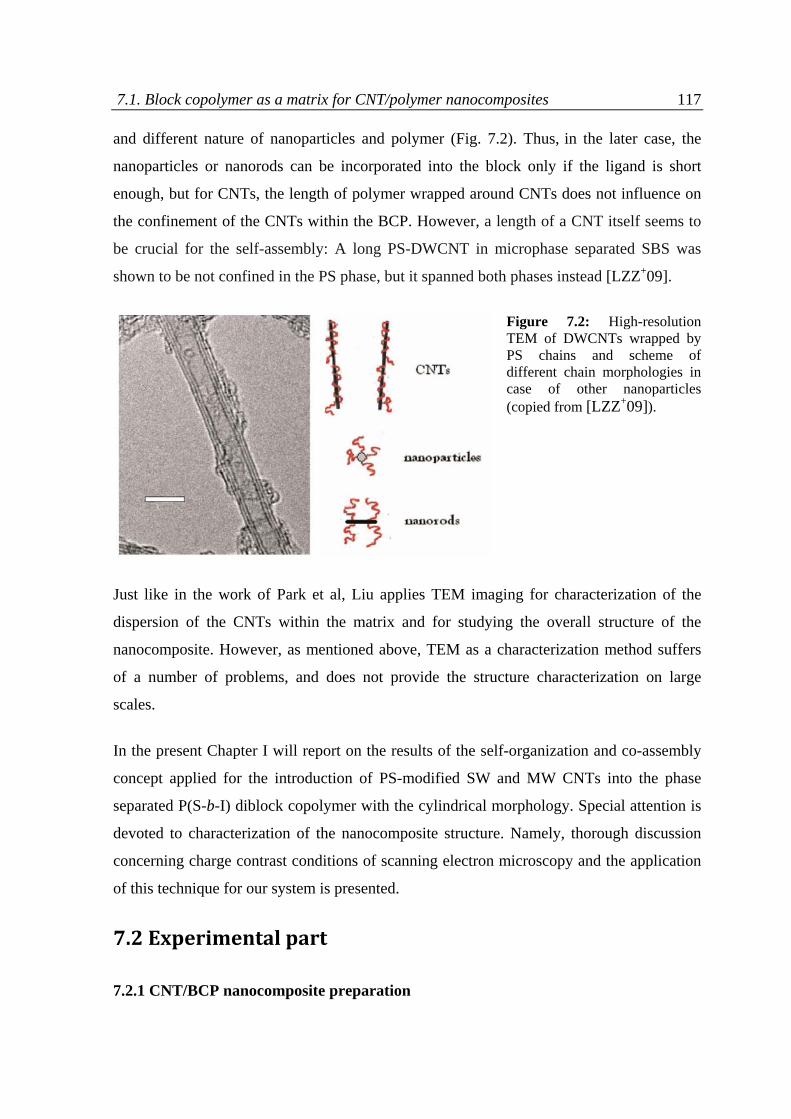
7.1. Block copolymer as a matrix for CNT/polymer nanocomposites 117 and different nature of nanoparticles and polymer (Fig. 7.2). Thus, in the later case, the
nanoparticles or nanorods can be incorporated into the block only if the ligand is short
enough, but for CNTs, the length of polymer wrapped around CNTs does not influence on
the confinement of the CNTs within the BCP. However, a length of a CNT itself seems to
be crucial for the self-assembly: A long PS-DWCNT in microphase separated SBS was
shown to be not confined in the PS phase, but it spanned both phases instead [LZZ+09].
Figure 7.2: High-resolution TEM of DWCNTs wrapped by PS chains and scheme of different chain morphologies in case of other nanoparticles (copied from [LZZ+09]).
Just like in the work of Park et al, Liu applies TEM imaging for characterization of the
dispersion of the CNTs within the matrix and for studying the overall structure of the
nanocomposite. However, as mentioned above, TEM as a characterization method suffers
of a number of problems, and does not provide the structure characterization on large
scales.
In the present Chapter I will report on the results of the self-organization and co-assembly
concept applied for the introduction of PS-modified SW and MW CNTs into the phase
separated P(S-b-I) diblock copolymer with the cylindrical morphology. Special attention is
devoted to characterization of the nanocomposite structure. Namely, thorough discussion
concerning charge contrast conditions of scanning electron microscopy and the application
of this technique for our system is presented.
7.2 Experimental part
7.2.1 CNT/BCP nanocomposite preparation
118 Chapter 7. CNT/Block copolymer nanocomposites As a matrix for the composites from CNTs with diblock copolymers, a P(S-b-I) diblock
copolymer with block molar masses of 165 kg/mol and 245 kg/mol and a polydispersity of
1.2 was used (Polymer Source Inc., Montreal, Canada). It is expected to form the
cylindrical morphology of PS blocks within a PI matrix. The nanocomposites from the
CNTs and P(S-b-I) with 0.5 or 1 wt.% of SW or MW CNTs (native SW(MW)CNTs or
SW(MW)CNT-PS-2d) were prepared by solution processing. An aliquot of CNTs (1.6 or
3.2 mg for loadings of 0.5 and 1 wt.%, respectively) was dispersed in THF at a
concentration of 1.6 mg/mL and was ultrasonicated for 5 min. This dispersion was mixed
with the block copolymer solution in THF (concentration 0.16 g/mL), and the mixture was
stirred at high shear rate for 2 h, followed by a solution casting in a Petry dish. The sample
was left to dry in ambient atmosphere at room temperature for 80 h.
7.2.2 Scanning electron microscopy
SEM characterization of the diblock copolymer/CNTs composites was performed using
Quanta 200FEG (Fei Co., Eindhoven, The Netherlands). For the imaging of the CNTs
within the block copolymer matrix, charge contrast conditions of SEM were applied
[LAG+05]. The SEM was operated in high vacuum in the high-voltage acceleration regime
(10 kV) with a working distance of ~ 10 mm. A secondary electron detector was used.
Specimens for SEM were prepared by cryo-breaking in liquid nitrogen and were used as
such, i.e. without any additional treatment, such as surface etching or coating with a
conductive layer.
7.3 Results and discussion
Knowledge on the organization of the CNTs within the polymer matrix is mandatory for
understanding the changes in physical properties of the resulting composite. However, this
knowledge as a rule is very limited mainly due to limitations of the characterization
techniques. All common microscopic techniques have their specific disadvantages
concerning the visualization of the CNT dispersion in polymer matrix. Optical microscopy
assesses mainly big bundles of the CNTs; atomic force microscopy (AFM) only shows a
surface profile or a cross-section of the composite material; transmission electron
microscopy (TEM) gives images of thin sections (thickness ca. 100 nm), from which it is
7.3. Results and discussion 119 difficult to make conclusions for organization of the CNTs in bulk material. Moreover, the
preparation of the ultrathin microtome samples for TEM itself can inflict an extensive
damage on the polymer matrix and significantly affect the organization of the CNTs in the
sample: during the slicing the sample by cryo-microtoming, the blade can distort the
placement of the mechanically strong CNT within relatively soft matrix. It is also
challenging to identify the CNTs in the matrix by the conventional electron microscopy
(SEM or TEM) due to a very low contrast between the CNTs and surrounding matrix.
As an example, results of conventional SEM of the neat P(S-b-I) matrix and of a CNT/P(S-
b-I) nanocomposite containing 0.5 wt.% of MWCNTs are presented in Fig. 7.3. The images
were recorded at an accelerating voltage of 3 kV, a working distance of 4 - 6 mm and under
high vacuum conditions (Quanta200 FEG microscope from FEI Company); the cryo-
broken samples were sputtered with gold prior measurements; thus, the usual conditions for
investigation of polymers were applied. Though the resolution of the images is high, it is
difficult to make any conclusion about the distribution of CNTs within the matrix. Fig. 7.3a
represents the SEM image of the neat block copolymer, whereas the image of the
CNT/block copolymer nanocomposite is depicted in Fig. 7.3b. On both of the images there
can be distinguished bright spots, which may correspond to either CNTs (on the right-hand
image) or rigid PS blocks in the block copolymer matrix (on both (a) and (b) images). Only
the holes seen in Fig. 7.3b might indicate the presence of CNTs, pulled out from the matrix
during the sample preparation (cryo-breaking). However, on base of these images we
cannot say anything more conclusive. This example clearly shows that SEM operated in a
conventional mode is not the method of choice for characterization of CNT/block
copolymer nanocomposite.
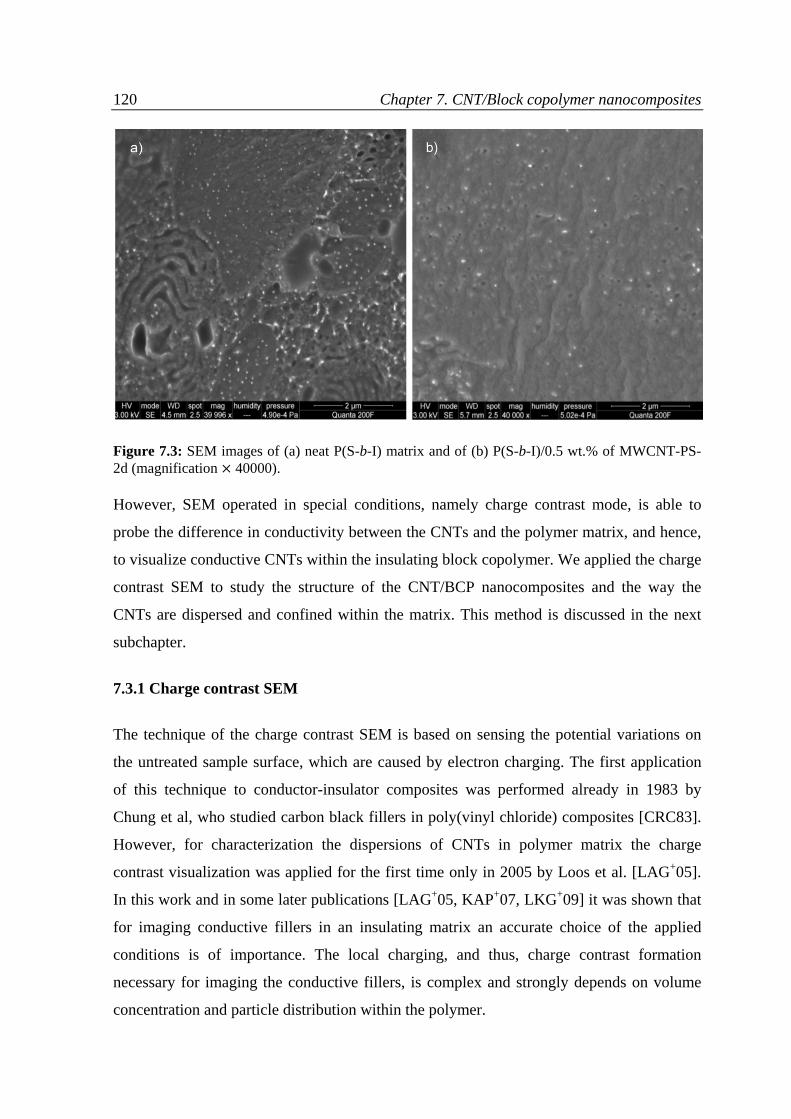
120 Chapter 7. CNT/Block copolymer nanocomposites
Figure 7.3: SEM images of (a) neat P(S-b-I) matrix and of (b) P(S-b-I)/0.5 wt.% of MWCNT-PS-2d (magnification 40000).
However, SEM operated in special conditions, namely charge contrast mode, is able to
probe the difference in conductivity between the CNTs and the polymer matrix, and hence,
to visualize conductive CNTs within the insulating block copolymer. We applied the charge
contrast SEM to study the structure of the CNT/BCP nanocomposites and the way the
CNTs are dispersed and confined within the matrix. This method is discussed in the next
subchapter.
7.3.1 Charge contrast SEM
The technique of the charge contrast SEM is based on sensing the potential variations on
the untreated sample surface, which are caused by electron charging. The first application
of this technique to conductor-insulator composites was performed already in 1983 by
Chung et al, who studied carbon black fillers in poly(vinyl chloride) composites [CRC83].
However, for characterization the dispersions of CNTs in polymer matrix the charge
contrast visualization was applied for the first time only in 2005 by Loos et al. [LAG+05].
In this work and in some later publications [LAG+05, KAP+07, LKG+09] it was shown that
for imaging conductive fillers in an insulating matrix an accurate choice of the applied
conditions is of importance. The local charging, and thus, charge contrast formation
necessary for imaging the conductive fillers, is complex and strongly depends on volume
concentration and particle distribution within the polymer.
7.3. Results and discussion 121 Chung et al., in order to explain the dependence of charge contrast imaging on the volume
concentration and distribution of the carbon black as conductive fillers, suggested to define
six categories of the composites [CRC83]. To make the discussion more general, we will
distinguish only four cases:
1) Pure dielectric: no conductive fillers;
2) Low volume concentration of conductive fillers or their poor dispersion, no
percolation thresholds through the matrix;
3) Relatively high concentration of the conductive particles or a good dispersion of
conductive fillers in the insolating matrix;
4) Only conductive particles: no dielectric.
The cases (1) and (4) are trivial: whereas the sample (1) charges up and no imaging is
possible, the sample of category (4) gives standard SEM images. More interesting are the
cases (2) and (3).
A typical SEM specimen is about 2000 µm thick; however, the penetration depth of the
electron beam is only of a few µm. Therefore, the charge from the beam accumulates at the
surface of the sample where the beam is incident [CRC83]. Presence of conductive fillers in
the matrix prevents from as high charging as for the dielectric material. This means that the
charge is leaking off the surface. Two ways for charge leakage exist: either (i) secondary
electrons coming off the surface, or (ii) via charge leakage through conductive particles.
Therefore, since the potential at the specimen surface is the result of equilibrium between
the SEM beam current and the secondary electrons, the backscattered electrons, and the
leakage current, the imaging significantly depends on the concentration and dispersion of
the conductive fillers throughout the sample. As the volume concentration of the
conductive fillers decreases (sample (3) sample (2)), the charge leakage decreases,
causing the increase of the potential of the specimen surface, until it reaches a value
sufficient to deflect the beam or make it unstable so no image could be formed (sample (1)).
The conductive particles or agglomerates, when monitored with SEM charging contrast
mode, as a rule are seen as bright spots in a dark matrix, because the secondary electrons
are emitted preferentially from these particles. This can be explained as follows [CRC83]:
The isolated (unconnected) conductive particle accumulates on its surface a charge
deposited from the SEM beam (Fig. 7.4). This gives rise to a higher potential at the particle
than that produced by the charge accumulated in the surrounding dielectric. Therefore,
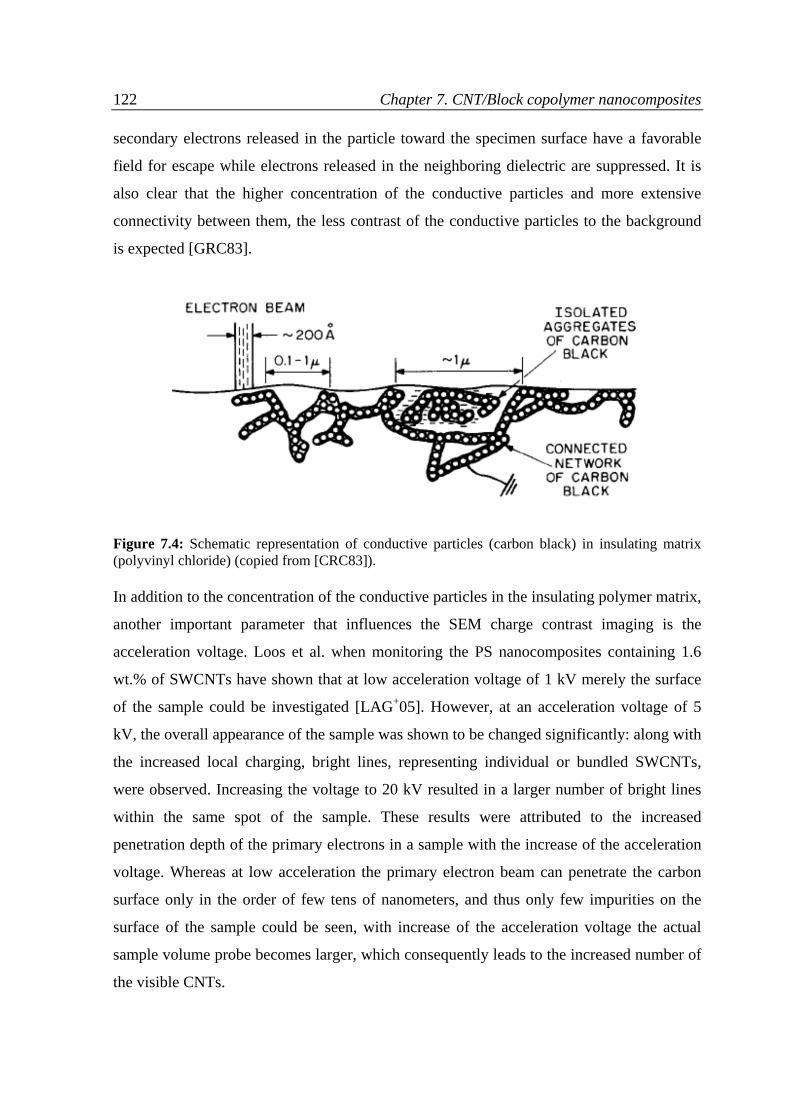
122 Chapter 7. CNT/Block copolymer nanocomposites secondary electrons released in the particle toward the specimen surface have a favorable
field for escape while electrons released in the neighboring dielectric are suppressed. It is
also clear that the higher concentration of the conductive particles and more extensive
connectivity between them, the less contrast of the conductive particles to the background
is expected [GRC83].
Figure 7.4: Schematic representation of conductive particles (carbon black) in insulating matrix (polyvinyl chloride) (copied from [CRC83]).
In addition to the concentration of the conductive particles in the insulating polymer matrix,
another important parameter that influences the SEM charge contrast imaging is the
acceleration voltage. Loos et al. when monitoring the PS nanocomposites containing 1.6
wt.% of SWCNTs have shown that at low acceleration voltage of 1 kV merely the surface
of the sample could be investigated [LAG+05]. However, at an acceleration voltage of 5
kV, the overall appearance of the sample was shown to be changed significantly: along with
the increased local charging, bright lines, representing individual or bundled SWCNTs,
were observed. Increasing the voltage to 20 kV resulted in a larger number of bright lines
within the same spot of the sample. These results were attributed to the increased
penetration depth of the primary electrons in a sample with the increase of the acceleration
voltage. Whereas at low acceleration the primary electron beam can penetrate the carbon
surface only in the order of few tens of nanometers, and thus only few impurities on the
surface of the sample could be seen, with increase of the acceleration voltage the actual
sample volume probe becomes larger, which consequently leads to the increased number of
the visible CNTs.
7.3. Results and discussion 123 Similar investigations of the dispersion quality of the MWCNTs in epoxy composites via
charge contrast SEM imaging were performed by Kovacs et al. [KAP+07]. The authors also
found a strong dependence of the visualization of the nanotubes in the surrounding matrix
on the acceleration voltage. However, unlike the results reported by Loos et al., no
additional nanotubes were observed with increase of acceleration voltage; at any voltage
applied to the sample (0.2 – 20 kV) all monitored electrons were emitted within
approximately 50 nm of the sample depth. Instead, the authors observed another important
feature of the charging contrast SEM, namely, the acceleration voltage can manipulate the
charging of the sample which in the end produces the charging contrast needed for imaging.
At very low acceleration voltage (0.2 - 0.7 kV) the CNTs were observed in the polymer
matrix, being bright in a dark polymer. Increase of the voltage to the values 1 - 2 kV led to
the inverse picture, the CNTs became dark in a bright polymer. Further increase of the
acceleration voltage (4 - 20 kV) again resulted in bright CNTs. These observations were
explained by the fact that the total electron emission yield of a sample depends on the beam
energy and can even increase above unity [KAP+07]. At low acceleration voltages the local
electron emission yield is smaller than unity meaning that the sample charges negatively.
Increasing the beam energy increases also the emission yield, which crosses the unity at a
certain voltage, starting from which the sample becomes positively charged. In this energy
region the incident electron beam excites efficiently many secondary electrons near the
surface which then can all leave the sample. With increasing energy most of the secondary
electrons are excited deeper and can no longer leave the sample, thus the emission yield
starts to decrease, negative charging of the sample again takes place. The acceleration
voltages corresponding to the crossover between negative and positive charging of the
sample lead to vanishing of any contrast between the CNTs and polymer, as the sample
remains uncharged.
Additional parameters like magnification (scanning density) and beam dwell time per area
(scanning speed) were also shown to affect significantly the sample charging [KAP+07].
These parameters determine the electron dose. At the same time, as discussed above, the
equilibrium density of charges within the sample depends on the relationship of the electron
dose and the discharging capability of the individual sample regions. Therefore, it is clear
why the CNTs can be seen dark or bright depending on the magnification or scanning
speed.
124 Chapter 7. CNT/Block copolymer nanocomposites However, despite of quite thorough studies of the charge contrast imaging of CNTs in
polymer matrices, understanding of its mechanism and dependency of the imaging on
applied acceleration voltage, magnification and scanning speed, the optimum conditions for
SEM charge imaging must be found for every specific microscope. Kovacs et al. showed
for instance that the LEO 1530 FE-SEM microscope was unable to perform any images of
CNTs with use of ordinary secondary electron detector, while the perfect contrast was
found by recording the signal with InLens detector [KAP+07]. However, Loos et al.
demonstrated the SEM charge contrast imaging of CNTs with an Environmental SEM
(ESEM) from FEI Company supplied with the conventional secondary electron detector
[LAG+05].
7.3.2 Charge contrast imaging of CNT/P(S-b-I) nanocomposites
To study our system, namely the nanocomposites consisting of the P(S-b-I) diblock
copolymer and 0.5 or 1 wt.% of native or modified CNTs, we used Environmental SEM
(Quanta200 FEG) from FEI Company and hence applied conditions similar to the ones
used by Loos et al [LAG+05] (see Chapter 7.2.2).
Fig. 7.5 shows a series of high resolution SEM images of the P(S-b-I) nanocomposite
containing 1 wt.% of the modified MWCNT-PS-2d. In the charge contrast regime at high
acceleration voltage (10 kV), the secondary electron yield at the positions of the CNTs is
high; therefore, the CNTs are seen as bright dots and lines within the dark matrix.
The images show a very homogeneous distribution of the modified CNTs within the matrix.
Such a homogeneous distribution of the CNTs throughout the whole sample makes it
highly conductive and provides numerous pathways for the charge leakage through the
sample. Therefore it is possible to resolve the image even at high magnification and slow
scanning rate (~ 30 µs per line, resolution 2048 1768). The high magnification image (
200000) (Fig. 7.5d) allows to estimate that the CNTs are mainly individually dispersed and
predominantly directed by the morphology of the diblock copolymer matrix.
It is also clearly seen that the ends of the lines are much brighter than the rest, and the tails
are almost disappearing. The closer the CNTs to the surface, the higher yield of the
secondary electrons and thus the higher brightness is expected. Low brightness might be
indicative of underlying layers of the sample. Therefore, different brightness of the
observed lines (CNTs) reconstructs the quasi 3D distribution of CNTs within the matrix:
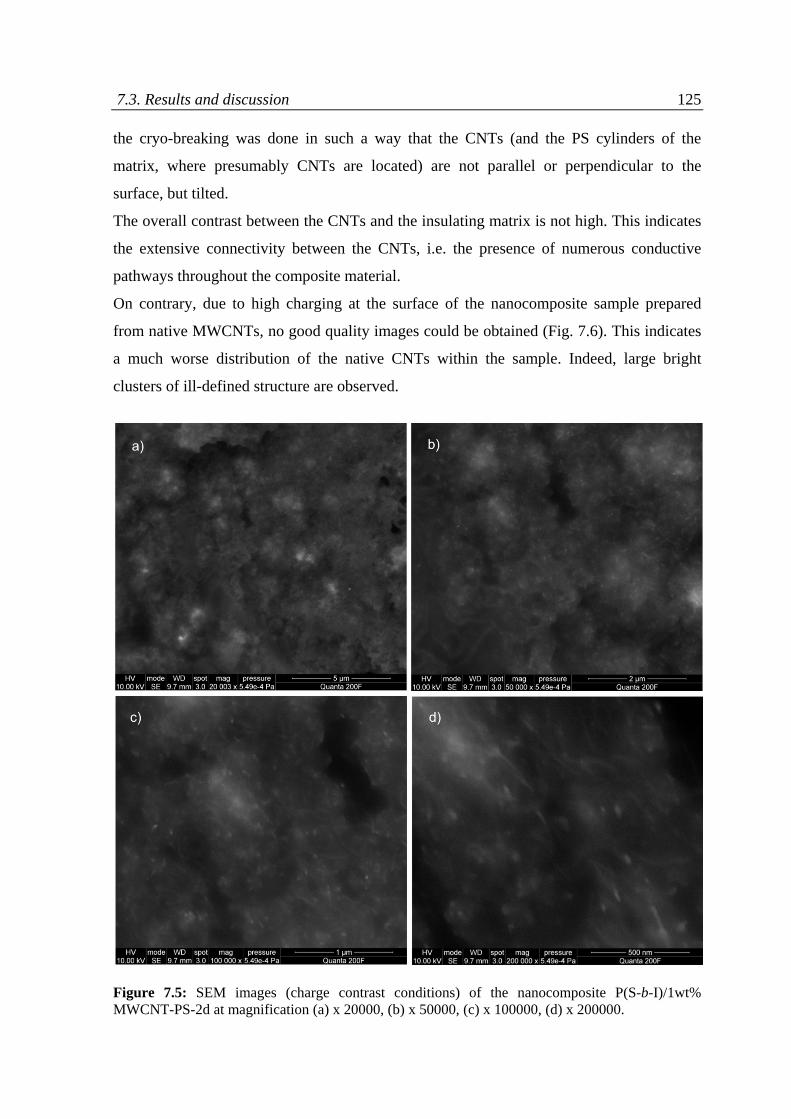
7.3. Results and discussion 125 the cryo-breaking was done in such a way that the CNTs (and the PS cylinders of the
matrix, where presumably CNTs are located) are not parallel or perpendicular to the
surface, but tilted.
The overall contrast between the CNTs and the insulating matrix is not high. This indicates
the extensive connectivity between the CNTs, i.e. the presence of numerous conductive
pathways throughout the composite material.
On contrary, due to high charging at the surface of the nanocomposite sample prepared
from native MWCNTs, no good quality images could be obtained (Fig. 7.6). This indicates
a much worse distribution of the native CNTs within the sample. Indeed, large bright
clusters of ill-defined structure are observed.
Figure 7.5: SEM images (charge contrast conditions) of the nanocomposite P(S-b-I)/1wt% MWCNT-PS-2d at magnification (a) x 20000, (b) x 50000, (c) x 100000, (d) x 200000.
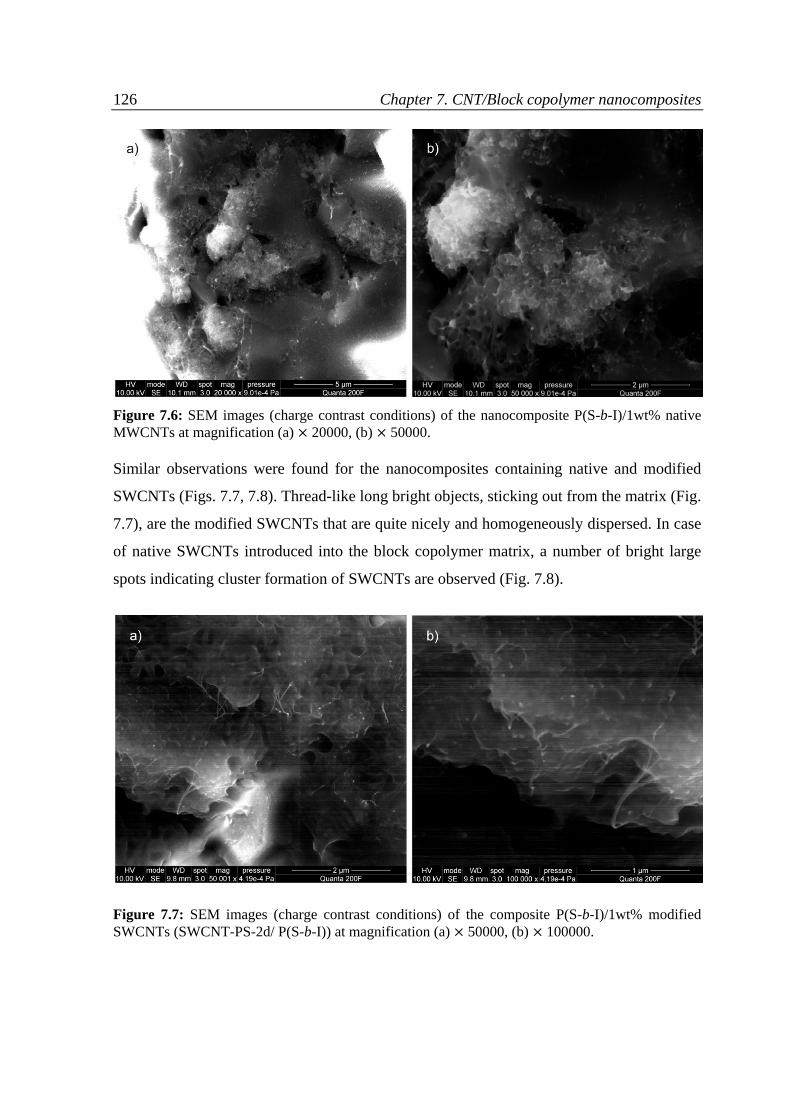
126 Chapter 7. CNT/Block copolymer nanocomposites
Figure 7.6: SEM images (charge contrast conditions) of the nanocomposite P(S-b-I)/1wt% native MWCNTs at magnification (a) 20000, (b) 50000.
Similar observations were found for the nanocomposites containing native and modified
SWCNTs (Figs. 7.7, 7.8). Thread-like long bright objects, sticking out from the matrix (Fig.
7.7), are the modified SWCNTs that are quite nicely and homogeneously dispersed. In case
of native SWCNTs introduced into the block copolymer matrix, a number of bright large
spots indicating cluster formation of SWCNTs are observed (Fig. 7.8).
Figure 7.7: SEM images (charge contrast conditions) of the composite P(S-b-I)/1wt% modified SWCNTs (SWCNT-PS-2d/ P(S-b-I)) at magnification (a) 50000, (b) 100000.
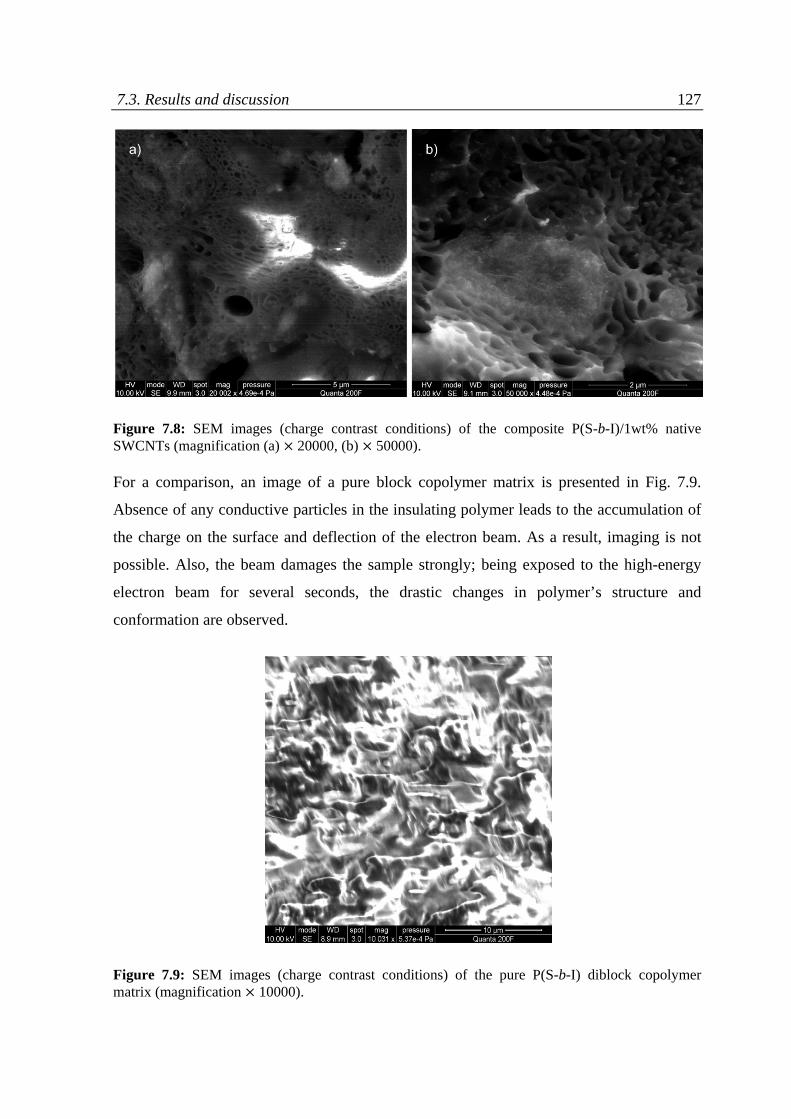
7.3. Results and discussion 127
Figure 7.8: SEM images (charge contrast conditions) of the composite P(S-b-I)/1wt% native SWCNTs (magnification (a) 20000, (b) 50000).
For a comparison, an image of a pure block copolymer matrix is presented in Fig. 7.9.
Absence of any conductive particles in the insulating polymer leads to the accumulation of
the charge on the surface and deflection of the electron beam. As a result, imaging is not
possible. Also, the beam damages the sample strongly; being exposed to the high-energy
electron beam for several seconds, the drastic changes in polymer’s structure and
conformation are observed.
Figure 7.9: SEM images (charge contrast conditions) of the pure P(S-b-I) diblock copolymer matrix (magnification 10000).
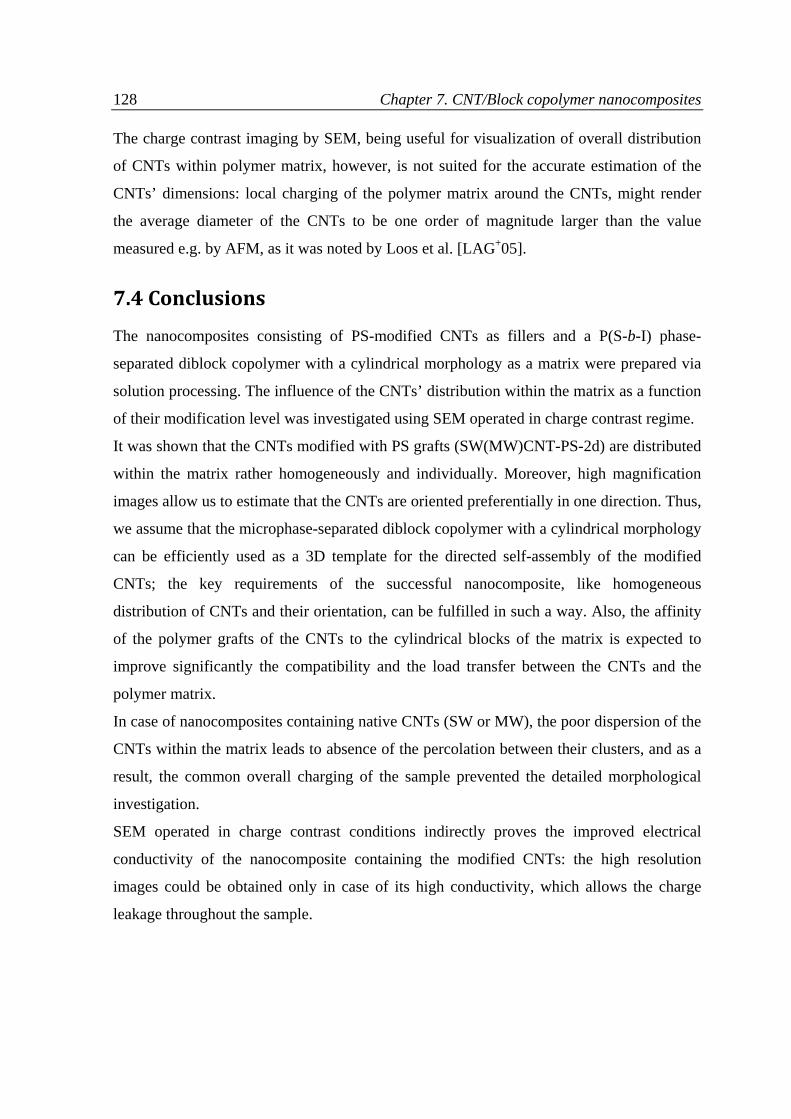
128 Chapter 7. CNT/Block copolymer nanocomposites The charge contrast imaging by SEM, being useful for visualization of overall distribution
of CNTs within polymer matrix, however, is not suited for the accurate estimation of the
CNTs’ dimensions: local charging of the polymer matrix around the CNTs, might render
the average diameter of the CNTs to be one order of magnitude larger than the value
measured e.g. by AFM, as it was noted by Loos et al. [LAG+05].
7.4 Conclusions
The nanocomposites consisting of PS-modified CNTs as fillers and a P(S-b-I) phase-
separated diblock copolymer with a cylindrical morphology as a matrix were prepared via
solution processing. The influence of the CNTs’ distribution within the matrix as a function
of their modification level was investigated using SEM operated in charge contrast regime.
It was shown that the CNTs modified with PS grafts (SW(MW)CNT-PS-2d) are distributed
within the matrix rather homogeneously and individually. Moreover, high magnification
images allow us to estimate that the CNTs are oriented preferentially in one direction. Thus,
we assume that the microphase-separated diblock copolymer with a cylindrical morphology
can be efficiently used as a 3D template for the directed self-assembly of the modified
CNTs; the key requirements of the successful nanocomposite, like homogeneous
distribution of CNTs and their orientation, can be fulfilled in such a way. Also, the affinity
of the polymer grafts of the CNTs to the cylindrical blocks of the matrix is expected to
improve significantly the compatibility and the load transfer between the CNTs and the
polymer matrix.
In case of nanocomposites containing native CNTs (SW or MW), the poor dispersion of the
CNTs within the matrix leads to absence of the percolation between their clusters, and as a
result, the common overall charging of the sample prevented the detailed morphological
investigation.
SEM operated in charge contrast conditions indirectly proves the improved electrical
conductivity of the nanocomposite containing the modified CNTs: the high resolution
images could be obtained only in case of its high conductivity, which allows the charge
leakage throughout the sample.
8 Conclusions and outlook
The presented dissertation is devoted to the optimization of CNT/polymer nanocomposites
performance. The main bottleneck for the nanocomposite with superior physical properties
is to achieve a homogeneous distribution of individually separated CNTs within the matrix.
In order to tune the surface properties of CNTs, to overcome the van der Waals attraction
between them and to prevent their agglomeration, numerous approaches for CNTs
modification and introduction of them into a polymer matrix, both physical and chemical,
are reported in literature. However, whereas physical methods suffer from lack of effect,
chemical routes are usually laborious and costly. Therefore, new strategies needed to be
suggested and proven.
The first step towards the CNT/polymer nanocomposite is to devise a simple yet efficient
route to chemically modify the CNTs with the view of improvement of their dispersion
ability in liquids and in the polymer matrix. For chemical modification of the CNTs, self-
initiated photografting photopolymerization (SIPGP) was applied. A straightforward
procedure, previously reported for modification of various carbon surfaces
(ultrananocristalline diamond, carbon black, graphene), was probed on CNTs for the first
time. SIPGP allows the preparation of the polymer grafts simply by submerging of the
CNTs in bulk vinyl monomer followed by irradiation with UV light, and is found to be
successful for the functionalization of both SW and MW CNTs. In such a way, highly
functionalized CNTs with up to 35 - 44 wt.% of polystyrene and poly(4-vinylpyridine)
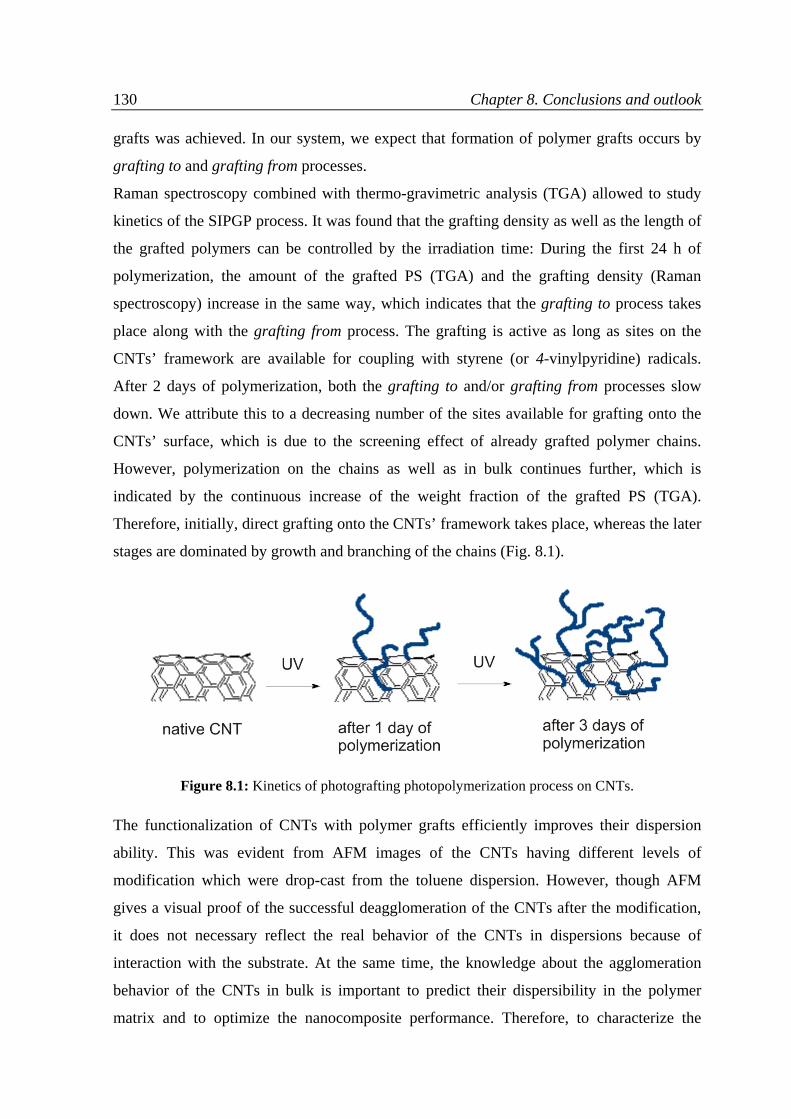
130 Chapter 8. Conclusions and outlook grafts was achieved. In our system, we expect that formation of polymer grafts occurs by
grafting to and grafting from processes.
Raman spectroscopy combined with thermo-gravimetric analysis (TGA) allowed to study
kinetics of the SIPGP process. It was found that the grafting density as well as the length of
the grafted polymers can be controlled by the irradiation time: During the first 24 h of
polymerization, the amount of the grafted PS (TGA) and the grafting density (Raman
spectroscopy) increase in the same way, which indicates that the grafting to process takes
place along with the grafting from process. The grafting is active as long as sites on the
CNTs’ framework are available for coupling with styrene (or 4-vinylpyridine) radicals.
After 2 days of polymerization, both the grafting to and/or grafting from processes slow
down. We attribute this to a decreasing number of the sites available for grafting onto the
CNTs’ surface, which is due to the screening effect of already grafted polymer chains.
However, polymerization on the chains as well as in bulk continues further, which is
indicated by the continuous increase of the weight fraction of the grafted PS (TGA).
Therefore, initially, direct grafting onto the CNTs’ framework takes place, whereas the later
stages are dominated by growth and branching of the chains (Fig. 8.1).
Figure 8.1: Kinetics of photografting photopolymerization process on CNTs.
The functionalization of CNTs with polymer grafts efficiently improves their dispersion
ability. This was evident from AFM images of the CNTs having different levels of
modification which were drop-cast from the toluene dispersion. However, though AFM
gives a visual proof of the successful deagglomeration of the CNTs after the modification,
it does not necessary reflect the real behavior of the CNTs in dispersions because of
interaction with the substrate. At the same time, the knowledge about the agglomeration
behavior of the CNTs in bulk is important to predict their dispersibility in the polymer
matrix and to optimize the nanocomposite performance. Therefore, to characterize the
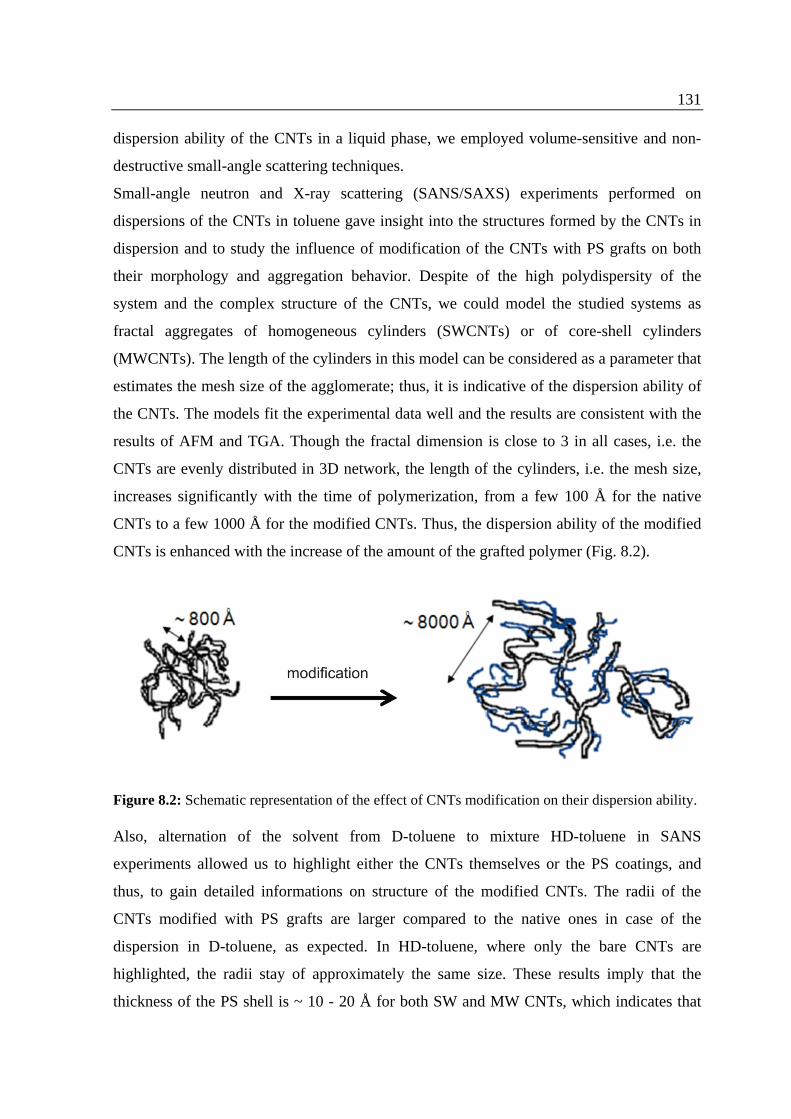
131 dispersion ability of the CNTs in a liquid phase, we employed volume-sensitive and non-
destructive small-angle scattering techniques.
Small-angle neutron and X-ray scattering (SANS/SAXS) experiments performed on
dispersions of the CNTs in toluene gave insight into the structures formed by the CNTs in
dispersion and to study the influence of modification of the CNTs with PS grafts on both
their morphology and aggregation behavior. Despite of the high polydispersity of the
system and the complex structure of the CNTs, we could model the studied systems as
fractal aggregates of homogeneous cylinders (SWCNTs) or of core-shell cylinders
(MWCNTs). The length of the cylinders in this model can be considered as a parameter that
estimates the mesh size of the agglomerate; thus, it is indicative of the dispersion ability of
the CNTs. The models fit the experimental data well and the results are consistent with the
results of AFM and TGA. Though the fractal dimension is close to 3 in all cases, i.e. the
CNTs are evenly distributed in 3D network, the length of the cylinders, i.e. the mesh size,
increases significantly with the time of polymerization, from a few 100 Å for the native
CNTs to a few 1000 Å for the modified CNTs. Thus, the dispersion ability of the modified
CNTs is enhanced with the increase of the amount of the grafted polymer (Fig. 8.2).
Figure 8.2: Schematic representation of the effect of CNTs modification on their dispersion ability.
Also, alternation of the solvent from D-toluene to mixture HD-toluene in SANS
experiments allowed us to highlight either the CNTs themselves or the PS coatings, and
thus, to gain detailed informations on structure of the modified CNTs. The radii of the
CNTs modified with PS grafts are larger compared to the native ones in case of the
dispersion in D-toluene, as expected. In HD-toluene, where only the bare CNTs are
highlighted, the radii stay of approximately the same size. These results imply that the
thickness of the PS shell is ~ 10 - 20 Å for both SW and MW CNTs, which indicates that
132 Chapter 8. Conclusions and outlook polymer chains are mainly wrapped around the CNTs. For the MWCNTs, in addition to a
growth of a polymer layer on the outside, polymerization also takes place in the core of the
CNTs and between the graphene layers. Such an intercalative growth has previously been
reported in case of graphite modification as well. An analysis of the dependence of the
scattering length densities of the cylinder shell on the used solvent and the level of
functionalization of the CNTs allowed us to conclude that the walls of the MWCNTs
consist of 8 - 10 graphene layers and that the SWCNTs form ropes consisting of 2 - 4 tubes.
Thus, SANS/SAXS experiments allowed us to study both the morphology of the CNTs and
their aggregation behavior in bulk. It was confirmed that the formation of polymer grafts on
CNTs by SIPGP process is efficient for the improvement of the CNTs’ dispersion ability.
Besides the high efficiency of SIPGP, compared to the conventional ways to modify CNTs
with polymers (ATRP, RAFT polymerization, etc.), it suggests a very easy one-step,
ligand- and metal-free procedure to perform polymer grafting from various vinyl monomers
without any oxidation of CNTs which implies that the length and the structure of CNTs are
maximally preserved. The only disadvantage may be the relatively long polymerization
time (1 – 3 days) which is due to the strong light absorption by the CNT dispersions.
However, this problem can be resolved by use of a different reactor, as for instance, a
fluidic cell where the dispersion of CNTs is continuously circulating: Thin capillaries of the
cell in this case would allow an efficient penetration of UV light and the continuous
circulation would prevent agglomeration of CNTs during the polymerization.
For the preparation of nanocomposites, a microphase-separated P(S-b-I) diblock copolymer
where the PS blocks form cylindrical morphology was chosen as a matrix. The PS-modified
CNTs were introduced to the polymer matrix via solution processing in THF. We expected
that the block copolymer structure would serve as a 3D template for the directed self-
assembly of the modified CNTs into PS cylinders. To prove this idea, the visualization of
the CNTs within the matrix was performed by SEM operated in a charge contrast mode.
The images show a very homogeneous distribution of the modified CNTs within the matrix.
Such a homogeneous distribution of the CNTs throughout the whole sample makes it
highly conductive and provides numerous pathways for the charge leakage through the
sample. Therefore it was possible to resolve the image even at high magnification and slow
scanning rate. The high magnification image allowed us to estimate that the CNTs are
mainly individually dispersed and predominantly directed by the morphology of the block
copolymer matrix. On contrary, in case of the native CNTs, large ill-defined clusters of
133 them were observed in the matrix. Also, due to high charging at the surface of the
nanocomposite sample prepared from the native MWCNTs, no good quality images could
be obtained. This is indicative of a much worse distribution of the native CNTs within the
sample.
More information about the ordering of the CNTs within the matrix can be obtained by
means of small-angle neutron scattering experiments. For example, a large q-range
provided by the beamline D11 at ILL (q ~ 0.0001 - 1 Å-1) covers the whole range of length
scales from the CNT diameter and CNT-CNT correlations to the morphology of the block
copolymer matrix. Also, the neutron scattering contrast between the CNTs and the two
blocks (PS and PI) is sufficiently high to discriminate the CNTs from the block copolymer
matrix (SLDs of PI, PS and of CNTs are 0.2 10 , 1.4 10 and 4.7 5.7
10 , respectively).
Nevertheless, even without investigation of the composite structure with SANS, on base of
the SEM imaging we confirm that the block copolymer morphology can be efficiently used
as a template for the directed assembly of the modified CNTs. Moreover, the CNTs are
predominantly orientated in one direction by the cylindrical morphology of the block
copolymer. Of course, such an order can only be observed on micro-scales, in the micro-
domains of the matrix. High degree of ordering of the cylinders in the block copolymer,
and thus, of the CNTs in the nanocomposite, on larger scales can be achieved for instance
by the shear applied to the composite material. The nanocomposite with highly ordered
CNTs is expected to exhibit anisotropic mechanical and electrical properties, which can be
interesting for a number of applications. This may be a topic of further investigations.

135
Bibliography
[A03] Ж.И. Алферов, Микросистемная техника 2003, 8, 3 (Alferov Jh.I.,
Microsystem technique 2003, 8, 3) (in Russian)
[AB08] Angelikopoulos P., Bock H, J. Phys. Chem. B 2008, 112, 13793
[AKS+08] Alvarez N.T., Kittrell C., Schmidt H.K., Hauge R.H., Engel P.S., Tour J.M.,
J. Am. Chem. Soc. 2008, 130, 14227
[ASB+99] Abatemarco T., Stickel J., Belfort J., Frank B.P., Ajayan P.M., Belfort G., J
Phys Chem B 1999, 103, 3534
[ASG+00] Ajayan P.M., Schadler L.S., Giannaris C., Rubio A., Adv. Mater. 2000, 12,
750
[BB05] Balasubramanian K., Burghard M., Small 2005, 1, 180
[BBS+94] Blase X., Benedict L.X., Shirley E. L., Louie S.G., Phys. Rev. Lett. 1994, 72,
1878
[BEB+10] Backes C., Englert J.M., Bernhard N., Hauke F., Hirsch A., Small 2010, 6,
1968
[BGM+07] Bellucci S., Gaggiotti G., Marchetti M., Micciulla F., Mucciato R., Regi M.,
Journal of Physics: Conference Series 2007, 61, 99
[BHB06] Bauer B.J., Hobbie E.K., Becker M.L., Macromolecules 2006, 39, 2637
[BHW05] Banerjee S., Hemraj-Benny T., Wong S.S., Adv. Mater. 2005, 17, 17
[BJC+01] Brown S.D.M., Jorio A., Corio P., Dresselhaus M.S., Dresselhaus G., Saito
R., Kneipp K., Phys. Rev. B 2001, 63, 155414
[BKT00] Berber S., Kwon Y.-K., Tománek D., Phys. Rev. Lett 2000, 84, 4613
136 Bibliography [BKV+93] Bethune D.S., Kiang C.H., De Vries M.S., Gorman G., Savoy R., Vazquez
J., Beyers R., Nature 1993, 363, 605
[BMT05] Bockstaller M.R., Mickiewicz R.A., Thomas E.L., Adv. Mater. 2005, 17,
1331
[BNR+02] Bandyopadhyaya R., Nativ-Roth E., Regev O., Yerushalmi-Rozen R., Nano
Lett. 2002, 2, 25
[BSK+02] Bachilo S.M., Strano M.S., Kittrell C., Hauge R.H., Smalley R.E., Weisman
R.B., Science 2002, 298, 2361
[BSL+08] Bianco A., Sainz R., Li S., Dumortier H., Lacerda L., Kostarelos K.,
Giordani S., Prato M., Biomedical Applications of Functionalised Carbon
Nanotubes, Springer Science + Business Media B.V., Medicinal Chemistry
and Pharmacological Potential of Fullerenes and Carbon Nanotubes Carbon
Materials: Chemistry and Physics, 2008, 1, 23
[BSM+07] Baskaran D., Sakellariou G., Mays J.W., Bratcher M.S., J. Nanosci.
Nanotechnol. 2007, 7, 1560
[BYK+01] Bahr J.L., Yang J., Kosynkin D.V., Bronikowski M.J., Smalley R.E., Tour
J.M., J. Am. Chem. Soc. 2001, 123, 6536
[CBT+04] Cai J., Bie R.F., Tan X.M. Lu C., Physica B 2004, 344, 99
[CJK+05] Chang T.E., Jensen L.R., Kisliuk A., Pipes R.B., Sokolov A.P., Polymer
2005, 46, 439
[CKB+06] Coleman J.N., Khan U., Blau W.J., Gun’ko Y.K., Carbon 2006, 44, 1624
[CLW+02] Chen J., Liu H., Weimer W.A., Halls M.D., Waldeck D.H., Walker G.C., J.
Am. Chem. Soc. 2002, 124, 9034
[COW+10] Chen C., Ogino A., Wang X., Nagatsu M., Appl. Phys. Lett. 2010, 96,
131504
137 [CR10] Choi W.S., Ryu S.H., J. Appl. Polym. Sci. 2010, 116, 2910
[CR11] Choi W.S., Ryu S.H., Colloids and Surfaces A: Physicochemical and
Engineering Aspects 2011, 375, 55
[CRC83] Chung K.T., Reisner J.H., Compbell E.R., J. Appl. Phys. 1983, 54, 6099
[CSA+05] Chichak K.S., Star A., Altoe M.V.R., Stoddart J.F., Small 2005, 1, 452
[CSB+03] Corio P., Santos P.S., Brar V.W., Samsonidze G.G., Chou S.G., Dresselhaus
M.S., Chem. Phys. Lett. 2003, 370, 675
[CWY+09] Cai J., Wang C.Y., Yu T., Yu S., Phys. Scr. 2009, 79, 025702
[CZW+01] Chen R.J., Zhang Y.G., Wang D.W., Dai H.J., J. Am. Chem. Soc. 2001, 123,
3838
[DCD+93] Deriu A., Cavatorta E., Di Cola D., Middendorf H.D., Journal De Physique
IV Colloque C1, supplkment au Journal de Physique 11 1993, 3, 237
[DDS+05] Dresselhaus M.S., Dresselhaus G., Saito R., Jorio A., Physics Reports 2005,
409, 47
[DEF+03] Ding W., Eitan A., Fisher F.T., Chen X., Dikin D. A., Andrews R., Brinson
L.C., Schadler L.S., Rudf R.S., Nano Lett. 2003, 3, 1593
[DJB+10] Daugaard A.E., Jankova K., Bøgelund J., Nielsen J.K., Hvilsted S., Journal
of Polymer Science: Part A: Polymer Chemistry 2010, 48, 4594
[DSM+04] Dyke C.A., Stewart M.P., Maya F., Tour J.M., Synlett. 2004, 1, 155
[DYR01] Deng J.-P., Yang W.-T., Rånby B., Macromol. Rapid Commun. 2001, 22,
535
[EA92] Ebbesen and Ajayan Nature 1992, 358, 220
[EHK06] Endo M., Hayashi T., Kim Y.-A., Pure Appl. Chem. 2006, 78, 1703
138 Bibliography [ESA08] Endo M., Strano M.S., Ajayan P.M., Carbon Nanotubes:Topics in Applied
Physics 2008, 111, 13
[FB99] Fredrickson G.H., Bicerano J., J. Chem. Phys. 1999, 110, 2181
[FBS+06] Fornes T.D., Baur J.W., Sabba Y., Thomas E.L., Polymer 2006, 47, 1704
[FCB+02] Frankland S.J.V., Caglar A., Brenner D.W., Griebel M., J. Phys. Chem. B
2002, 106, 3046
[FJS+04] Fantini C., Jorio A., Souza M., Strano M.S., Dresselhaus M.S., Pimenta
M.A., Phys. Rev. Lett. 2004, 93, 147406
[FLM+06] Fagan J.A., Landi B.J., Mandelbaum I., Simpson J.R., Bajpai V., Bauer B.J.,
Migler K., Walker A.R.H., Raffaelle R., Hobbie E.K., J. Phys. Chem. B
2006, 110, 23801
[G08] Grillo A., Soft matter characterization, Chapte 13: Small-angle neutron
scattering and applications in soft condensed matter, Springer 2008
[G89] Gardiner D.J., Practical Raman spectroscopy, Springer-Verlag 1989
[GER06] Ghosh R.E., Egelhaaf S.U., Rennie A.R., A computing guide for small-angle
scattering experiment, Institut Max von Laue Paul Langevin, ILL06GH05T,
2006
[GKS+07] Geng H.-Z., Kim K.K., So K.P., Lee Y.S., Chang Y., Lee Y.H., J. Am.
Chem. Soc. 2007, 129, 7758
[GLK+08] Geng H.-Z., Lee D.S., Kim K.K., Han G.H., Park H.K., Lee Y.H., Chem.
Phys. Lett. 2008, 455, 275
[GNE+81] Goldstein G.I., Newbury D.E., Echlin P., Joy D.C., Fiori C., Lifshin E.,
Scanning electron microscopy and x-ray microanalysis. New York: Plenum
Press, 1981
139 [GNT+95] Guo T., Nikolaev P., Thess A., Colbert D.T., Smalley R.E. Chem. Phys. Lett.
1995, 243, 49
[GS98] Garg A., Sinnott S.B., Chem Phys. Lett. 1998, 295, 275
[H02] Hirsch A., Angew. Chem. Int. Ed. 2002, 41, 1853
[H07] Hafner B., Scanning electron microscopy primer, Characterization Facility,
University of Minnesota – Twin Cities, 2007
[H87] Haddon R.C., J. Am. Chem. Soc. 1987, 109, 1676
[H98] Hamley I.W., The physics of block copolymers, Oxford University Press
1998
[HB00] Howland R., Benatar L., A practical guide to scanning probe microscopy,
ThermoMicroscopes 2000
[HC98] Haddon R.C., Chow S.-Y, J. Am. Chem. Soc. 1998, 120, 10494
[HCS+06] Hu C., Chen Z., Shen A., Shen X., Li J., Hu S., Carbon 2006, 44, 428
[HHO+06] Hussain, F., Hojjati M., Okamato M., Gorga R.E., Journal of Composite
Materials 2006, 40, 1511
[HIN+01] Hamon M.A., Itkis M.E., Niyogi S., Alvaraez T., Kuper C., Menon M.,
Haddon R.C., J. Am. Chem. Soc. 2001, 123, 11292
[HIP+00] Hadjichrisitidis H., Iatrou S., Pispas M., Pitsikalis M., J. Polym. Sci.: Part A:
Polym. Chem. 2000, 38, 3211
[HKK+04] Ham H.T., Koo C.M., Kim S.O., Choi Y.S., Chung I.J., Macromol. Res.
2004, 12, 384
[HLG02] Hine P.J., Lusti H.R., Gusev A.A., Compos. Sci. Technol. 2002, 62, 1445
140 Bibliography [HLR+02] Hill D.E., Lin Y., Rao A.M., Allard L.F., Sun Y., Macromolecules 2002, 35,
9466
[HNM+98] Hayashi S., Naitoh A., Machida S., Okasaki M., Maruyama K., Tsubokawa
N., Appl. Organomet. Chem. 1998, 12, 743
[HSO92] Hamada N., Sawada S., Oschiyama A., Phys. Rev. Lett 1992, 68, 1579
[HWH06] Huang Y., Wu J., Hwang K.C., Phys. Rev. B 2006, 74, 245413
[I91] Iijima S. Nature 1991, 354, 56
[IBJ+03] Islam M.F., Rojas E., Bergey D.M., Johnson A.T., Yodh A.G., Nano Lett.
2003, 3, 269
[II93] Iijima S., Ichihashi T., Nature 1993, 363, 603
[IM10] Ilani S., McEuen P.L., Annu. Rev. Condens. Matter. Phys. 2010, 1, 1
[IRB+03] Islam M.F., Rojas E., Bergey D.M., Johnson A.T., Yodh A.G., Nano Lett.
2003, 3, 269
[JPS+03] Jorio A., Pimenta M.N., Souza Filho A.G., Saito R., Dresselhaus G.,
Dresselhaus M.S., New J. Phys. 2003, 5, 1.1
[JSF+02] Jorio A., Souza Filho A.G., Dresselhaus G., Dresselhaus M.S., Swan A.K.,
ÜnlüB M.S., Goldberg B.B., Pimenta M.A., Hafner J.H., Lieber C.M., Saito
R., Phys. Rev. B 2002, 65, 155412
[JSH+01] Jorio A., Saito R., Hafner J.H., Lieber C.M., Hunter M., McClure T.,
Dresselhaus G., Dresselhaus M.S., Phys. Rev. Lett. 2001, 86, 1118
[JWT+07] Justice R.S., Wang D.H., Tan L.-S., Schaefer D.W., J. Appl. Cryst. 2007, 40,
88
[K06] Kline S., J. Appl. Cryst. 2006, 39, 895
141 [KAP+07] Kovacs J.Z., Andresen K., Pauls J. R., Garcia C.P., M. Schossig, K. Schulte,
W. Bauhofer, Carbon 2007, 45, 1279
[KEA+98] Kiang C.H., Endo M., Ajayan P.M., Dresselhaus G., Dresselhaus M.S., Phys.
Rev. Lett. 1998, 81, 1869
[KFL+05] Kim U.J., Furtado C.A., Liu X., Chen G., Eklund P.C., J. Am. Chem. Soc.
2005, 127, 15437
[KHG+04] Keogh S.M., Hedderman T.G., Gregan E., Farrell G., Chambers G., Byrne
H.J., J. Phys. Chem. B 2004, 108, 6233
[KK00] Khokhlov A.R., Kuchanov S.I., Lectures on physical chemistry of polymers,
Moskva “Mir” 2000 (in Russian)
[KKC+09] Kumar N.A., Kim S.H., Cho B.G., Lim K.T., Jeong Y.T., Colloid. Polym.
Sci. 2009, 287, 97
[KSK+06] Kim J.A., Seong D.G., Kang T.J., Youn J.R., Carbon 2006, 44, 1898
[KW89] Knight D.S., White W.B., J. Mater. Res. 1989, 4, 385
[KXH+10] Kim J., Xiong H., Hofmann M., Kong J., Amemiya S., Anal. Chem. 2010,
82, 1605
[KZK+03] Kürti J., Zolyomi V., Kertesz M., Sun G.Y., New J. Phys. 2003, 5, 125
[L09] Liu P., J. Nanopart. Res. 2009, 11, 1011
[L94] Lodge T., Mikrochim. Acta 1994, 116, 1
[L97] Lu J.P., Phys. Rev. Lett. 1997, 79, 1297
[LAG+05] Loos J., Alexeev A., Grossiord N., Koning C.E., Regev O., Ultramicroscopy,
2005, 104, 160
142 Bibliography [LCD+05] Li H., Cheng F., Duft A.M., Adronov A., J. Am. Chem. Soc. 2005, 127,
14518
[LHC+04] Liu I.-C., Huang H.-M., Chang C.-Y., Tsai H.-C., Hsu C.-H., Tsiang R.C.-
C., Macromolecules 2004, 37, 283
[LHC+07] Li D., He Q., Cui Y., Li J., Chem. Mater. 2007, 19, 412
[LKG+09] Lillehei P.T., Kim J.-W., Gibbons L.J., Park C., Nanotechnology 2009, 20,
325708
[LL01] Liao K., Li S., Appl. Phys. Lett. 2001, 79, 4225
[LMT92] Lindner P., May R.P., Timmins P.A., Physica B 1992, 180, 967
[LRD+98] Liu J., Rinzler A.G., Dai H.J., Hafner J.H., Bradley R.K., Boul P.J., Lu A.,
Iverson T., Shelimov K., Huffman C.B., Rodriguez-Macias F., Shon Y.S.,
Lee T.R., Colbert D.T., Smalley R.E., Science 1998, 280, 1253
[LS07] Li Y., Shimizu H., Polymer 2007, 48, 2203
[LW98] Lourie O., Wagner H.D, Appl. Phys. Lett. 1998, 73, 3527
[LYA05] Liu Y., Yao Z., Adronov A., Macromolecules 2005, 38, 1172
[LZH+06] Liu Y.-T., Zhao W., Huang Z.-Y., Gao Y.-F., Xie X.-M., Wang X.-H., Ye
H.-Y., Letters to the Editor/ Carbon 2006, 44, 1581
[LZZ+07] Lu L., Zhou Z., Zhang Y., Wang S., Zhang Y., Carbon 2007, 45, 2621
[LZZ+09] Liu Y.-T., Zhang Z.-L., Zhao W., Xie X.-M., Ye X.-Y., Carbon 2009, 47,
1867
[M05] Meyyappan M., Carbon nanotubes science and applications, CRC Press:
Boca Raton, FL, 2005
143 [S07] Steenackers M., Micro- and nanostructured polymer grafts, Dissertation
2007
[M10] Mittal V., Polymer nanotube nanocomposites. Synthesis, properties and
application, Wiley & Sons, Inc., 2010
[MCL+06] Matrab T., Chancolon J., L’hermite M.M., Rouzaud J.-N., Deniau G.,
Boudou J.-P., Chehimi M.M., Delama M., Colloids and Surfaces A:
Physicochem. Eng. Aspects 2006, 287, 217
[MH96] Middendorf H.D., Hotz de Baar O.F.A., Journal of Molecular Structure
1996, 383, 241
[MHB+04] Marcoux P.R., Hapiot P., Batail P., Pinson J., New J. Chem. 2004, 28, 302
[MKH+00] Milnera M., Kuerti J., Hulman H., Kuzmany H., Phys. Rev. Lett, 2000, 84,
1324
[MLK+06] Moisala A., Li Q., Kinloch I.A., Windle A.H., Composites Science and
Technology 2006, 66, 1285
[MPH+05] McNally T., Potschke P., Halley P., Murphy M., Martin D., Bell S.E.J.,
Brennane J.P., Beinf D., Lemoineg P., Quinn J.P., Polymer 2005, 46, 8222
[MRL+03] Matarredona O., Rhoads H., Li Z.R., Harwell J.H., Balzano L., Resasco
D.E., J. Phys. Chem. B 2003, 107, 13357
[MPT08] Mountrichas G., Pispas S., Tagmatarchis N., Materials Science and
Engineering B 2008, 152, 40
[MPZ+10] Michel T., Paillet M., Zahab A., Nakabayashi D., Jourdain V., Parret R.,
Sauvajol J.-L., Adv. Nat. Sci.: Nanosci. Nanotechnol. 2010, 1, 045007
[MRT+02] Machon M., Reich S., Thomsen C., Sanchez-Portal D., Ordejon P., Phys.
Rev. B 2002, 66, 155410
144 Bibliography [MRT+04] Maultzsch J., Reich S., Thomsen C., Requardt H., Ordejon P., Phys. Rev.
Lett. 2004, 92, 075501
[MSH+03] Moore V.C., Strano M.S., Haroz E.H., Hauge R.H., Smalley R.E., Nano Lett.
2003, 3, 1379
[MW06] Moniruzzaman M., Winey K.I., Macromolecules 2006, 39, 5194
[MW07] Melnichenko Y.B., Wignall G.D., Journal of applied physics 2007, 102,
021101
[MW96] Magonov S.N., Whangbo M.-H., Surface ananlysis with STM and AFM.
Experiments and theoretical aspects of image analysis, VCH
Verlagsgesellschaft mbH 1996
[MZ07] Mylvaganam K., Zhang L.C., Recent Patents on Nanotechnology 2007, 1, 59
[N07] Neylon C., European Biophysics Journal 2007, 37, 531
[NAK+05] Numata M., Asai M., Kaneko K., Bae A.H., Hasegawa T., Sakurai K.,
Shinkai S., J. Am. Chem. Soc. 2005, 127, 5875
[NBB+99] Nikolaev P., Bronikowski M.J., Bradley R.K., Rohmund F., Colbert D.T.,
Smith K.A., Smalley R.E., Chem. Phys. Lett. 1999, 313, 91
[NHH+02] Niyogi S., Hamon M.A., Hu H., Zhao B., Bhowmik P., Sen R., Itkis M.E.,
Haddon R.C., Accounts of Chemical Research 2002, 35, 1105
[NSR08] Nayak R.R., Shanmugharaj A.M., Ryu S.H., Macromol. Chem. Phys. 2008,
209, 1137
[O06a] Obraztsov A.A., Lectures “Nanomaterials”, MSU, 2006
[O06b] O'Connell, M. J., Carbon nanotubes properties and applications, CRC Taylor
& Francis: Boca Raton: Raton, 2006
145 [OBE+01] O'Connell M.J., Boul P., Ericson L.M., Huffman C., Wang Y.H., Haroz E.,
Kuper C., Tour J., Ausman K.D., Smalley R.E., Chem. Phys. Lett. 2001,
342, 265
[OBH+02] O'Connell M.J., Bachilo S.M., Huffman C.B., Moore V.C., Strano M.S.,
Haroz E.H., Rialon K.L., Boul P.J., Noon W.H., Kittrell C., Ma J., Hauge
R.H., Weisman R.B., Smalley R.E., Science 2002, 297, 593
[OCC+08] Ouyanga Y., Conga L.M., Chena L., Liub Q.X., Fang Y., Physica E 2008,
40, 2386
[OHK+98] Odom T.W., Huang J.L., Kim P., Lieber C.M., Nature 1998, 391, 62
[PÄL+05] Paloniemi H., Ääritalo T., Laiho T., Like H., Kocharova N., Haapakka K.,
Terzi F., Seeber R., Lukkari J., J. Phys. Chem. B 2005, 109, 8634
[PGM+10] Petrov P., Georgiev G., Momekova D., Momekov G., Tsvetanov C.B.,
Polymer 2010, 51, 2465
[PLK+07] Park I., Lee W., Kim J., Park M., Lee H., Sensors and Actuators B 2007,126,
301
[PME+98] Pimenta M.A., Marucci A., Empedocles S., Bawendi M., Hanlon E.B., Rao
A.M., Eklund P.C.,. Smalley R.E., Dresselhaus G., Dresselhaus M.S., Phys.
Rev. B Rapid. 1998, 58, 16016
[PPK+07] Park I., Park M., Kim J., Lee H., Macromolecular Research 2007, 15, 498
[PPY+10] Park J.J., Park D.M., Youk J.H., Yu W.-R., Lee J., Carbon 2010, 48, 2899
[PQW+04] Peng J., Qu X.X., Wei G.S., Li J.Q., Qiao J.L., Carbon 2004, 42, 2741
[PRK+03] Peng H., Reverdy P., Khabashesku V.N., Margrave J.L., Chem. Commun.
2003, 3, 362
146 Bibliography [PRK+09] Pujari S., Ramanathan T., Kasimatis K., Masuda J., Andrews R., Torkelson
J.M., Brinson L.C., Burghardt W.R., Journal of Polymer Science: Part B:
Polymer Physics 2009, 47, 1426
[PSB+09] Priftis D., Sakellariou G., Baskaran D., Maysbc J.W., Hadjichristidis N., Soft
Matter 2009, 5, 4272
[PSC03] Park S., Srivastava D., Cho K., Nano Lett. 2003, 3, 1273
[PSM+10] Priftis D., Sakellariou G., Mays J.W., Hadjichristidis N., Journal of polymer
science Part A: Polymer Chemistry 2010, 48, 1104
[QDA+00] Qian D., Dickey E.C., Andrews R., Rantell T., Applied Physics Letters 2000,
76, 2868
[QQF+04] Qin S., Qin D., Ford W.T., Resasco D.E., Herrera J.E., Macromolecules
2004, 37, 752
[R00] Roe R.J., Methods of X-ray and neutron scattering in polymer science,
Oxford University Press 2000
[R07] Reilly R.M., J. Nucl. Med 2007, 48, 1039
[R86] Roy R., Mater. Sci. Res. 1986, 21, 25
[R98] Reimer L., Scanning electron microscopy. Physics of image formation and
microanalysis, Springer 1998
[RBR+04] Rajendra J., Baxendale M., Rap L.G.D., Rodger A., J. Am. Chem. Soc. 2004,
126, 11182
[RCR+01] Rao A.M., Chen J., Richter E., Schlecht U., Eklund P.C., Haddon R.C.,
Venkateswaran U.D., Kwon Y.K., Tomanek D., Phys. Rev. Lett. 2001, 86,
3895
147 [RJP+00] Rao A.M., Jorio A., Pimenta M.A., Dantas M.S.S., Saito R., Dresselhaus G.,
Dresselhaus M.S., Phys. Rev. Lett. 2000, 84, 1820
[RL52] Радушкевич Л.В., Лукьянович В.М., Журнал физической химии т.
XXVI 1952, 1, 88 (Radushkevich L.V. ,Lukyanovich V.M., J. Phys. Chem.
of Russia 1952, 1, 88) (in Russian)
[RPM90] Riley A.M., Paynter C.D., McGenity P.M., Adams J.M., Plast. Rub. Proc.
Appl. 1990, 14, 85
[RQL03] Ruof R.S., Qian D., Liu W.K., C. R. Physique 2003, 4, 993
[RRB+97] Rao A.M., Richter E., Bandow S., Chase B., Eklund P.C., Williams K.A.,
Fang S., Subbaswamy K.R., Menon M., Thess A., Smalley R.E.,
Dresselhaus G., Dresselhaus M.S., Science 1997, 275, 187
[RTM04] Reich S., Thomsen C., Maultzsch J., Carbon nanotubes: basic concept and
physical properties, Wiley-VCH Verlag GmbH 2004
[RZZ+01] Rong M.Z., Zhang M.Q., Zheng Y.X., Walter R., Friedrich K., Polymer
2001, 42, 167
[S02] Strong A.B., History of composite materials – opportunities and necessities,
Composites Manufacturing 2002
[S39] Schulz G.V., J. Phys. Chem. 1939, 43, 25
[SA08] Sharma P., Ahuja P., Mater. Res. Bull. 2008, 43, 2517
[SAG02] Safadi B., Andrews R., Grulke E.A., Journal of Applied Polymer Science
2002, 84, 2660
[SBB03] Shou Z.Y., Buxton G.A., Balazs A.C., Compos. Interfaces 2003, 10, 343
148 Bibliography [SCS+04] Samsonidze G.G., Chou S.G., Santos A.P., Selbst A., Dresselhaus M.S.,
Swan A.K., Ünlü M.S., Goldberg B.B., Chattopaddhyay D., Kim S.N.,
Papadimitrakopoulos F., Appl. Phys. Lett. 2004, 85, 1006
[SDK+07] Safarova K., Dvorak A., Kubinek R., Vujtek M., Rek A., Modern Research
and Educational Topics in Microscopy 2007, 2, 513
[SDR04] Skakalova V., Dettlaff-Weglikowska U., Roth S., Diamond Relat. Mater.
2004, 13, 296
[SF87] Svergun D.I., Feigin L.A., Structure Analysis by Small-Angle X-ray and
Neutron Scattering, Plenum, New York, 1987
[SFD+92a] Saito R., Fujita M., Dresselhaus G., Dresselhaus M.S, Phys. Rev. B 1992, 46,
1804
[SFD+92b] Saito R., Fujita M., Dresselhaus G., Dresselhaus M.S., Appl. Phys. Lett.
1992, 60, 2204
[SG02] Stejsnal J., Gilbert R.G., Pure Appl. Chem. 2002, 745, 857
[SGA98] Schadler L.S., Giannaris S.C., Ajayan P.M., Appl. Phys. Lett. 1998, 73, 3842
[SGY+05] Sinani V.A., Gheith M.K., Yaroslavov A.A., Rakhnyanskaya A.A., Sun K.,
Mamedov A.A., Wicksted J.P., Kotov N.A., J. Am. Chem. Soc. 2005, 127,
3463
[SGZ+11] Steenackers M., Gigler A.M., Zhang N., Deubel F., Seifert M., Hess L.H.,
Lim C.H.Y.X., Loh K.P., Garrido J.A., Jordan R., Stutzmann M., Sharp I.D.,
J. Am. Chem. Soc. 2011, Article ASAP
[SHG+03] Star A., Han T.R., Gabriel J.C.P., Bradley K., Gruner G., Nano Lett. 2003, 3,
1421
[SHM+06] Sluzarenko N., Heurtefeu B., Maugey M., Zakri C., Poulin P.,
Lecommandoux S., Carbon 2006, 44, 3207
149 [SJS+03] Souza Filho A.G., Jorio A., Samsonidze Ge. G., Dresselhaus G., Saito R.,
Dresselhaus M.S., Nanotechnology 2003, 14, 1130
[SKB06] Shofner M.L., Khabashesku V.N., Barrera E.V., Chemistry of Materials
2006, 18, 906
[SKO+01] Sano M., Kamino A., Okamura J., Shinkai S., Langmuir 2001, 17, 5125
[SLG+03] Star A., Liu Y., Grant K., Ridvan L., Stoddart J.F., Steuerman D.W., Diehl
M.R., Boukai A., Heath J.R., Macromolecules 2003, 36, 553
[SLM+77] Shirakawa H., Louis E.J., MacDiarmid A.G., Chiang C.K., Heeger A.J., J.
Chem. Soc., Chem. Commun. 1977, 578
[SLN+07] Steenackers M., Lud S.Q., Niedermeier M., Bruno P., Gruen D.M., Feulner
P., Stutzmann M., Garrido J.A., Jordan R., J. Am. Chem. Soc. 2007, 129,
15655
[SMM+03] Strano M.S., Moore V.C., Miller M.K., Allen M.J., Haroz E.H., Kittrell C.,
Hauge R.H., Smalley R.E., J. Nanosci. Nanotechnol. 2003, 3, 81
[SNC+00] Stephan C., Nguyen T.P., de la Chapelle M.L., Lefrant S., Journet C.,
Bernier P., Synth. Met. 2000, 108, 139
[SNH+08] Sekitani T., Noguchi Y., Hata K., Fukushima T., Aida T., Someya T.,
Science 2008, 321, 1468
[SRC+10] Sahooa N.G., Ranab S., Chob J.W., Li L., Chana S.H., Progress in Polymer
Science 2010, 35, 837
[SS02] Star A., Stoddart J.F., Macromolecules 2002, 35, 7516
[SSH+02] Star A., Steuerman D.W., Heath J.R., Stoddart J.F., Angew. Chem. Int. Ed.
2002, 41, 2508
150 Bibliography [SSJ03] Samsonidze G.G., Saito R., Jorio A., Pimenta M.A., Souza Filho A.G.,
Grüneis A., Dresselhaus G., Dresselhaus M.S., J. Nanosci. Nanotech. 2003,
3, 431
[SSN+02] Steuerman D.W., Star A., Narizzano R., Choi H., Ries R.S., Nicolini C.,
Stoddart J.F., Heath J.R., J. Phys. Chem. B 2002, 106, 3124
[SY05] Song Y.S., Youn J.R., Carbon 2005, 43, 1378
[SYR05] Szleifera I., Yerushalmi-Rozen R., Polymer 2005, 46, 7803
[SZB+03] Schaefer D.W., Zhao J., Brown J.M., Anderson D.P., Tomlin D.W., Chem.
Phys. Lett. 2003, 375, 369
[T88] Teixeira J., J. Appl. Cryst. 1988, 21, 781
[TFR+11] Toussi S.M., Fakhrul-Razi A., Chuah L., Suraya A.R., IOP Conf. Series:
Materials Science and Engineering 2011, 17, 12003
[TLC05] Thostenson E.T., Li C., Chou T.-W., Composites Science and Technology
2005, 65, 491
[TLN+96] Thess A., Lee R., Nikolaev P., Dai H., Petit P., Robert J., Xu C., Lee Y.H.,
Kim S.G., Rinzler A.G., Colbert D.T., Scuseria G.E., Tomanek D, Fischer
J.E., Smalley R.E, Science 1996, 273, 483
[TPF05] Tserpesa K.I., Papanikos P., Composites: Part B 2005, 36, 468
[TSC+10] Tang Q.Y., Shafiq I., Chan Y.C., Wong N.B., Cheung R., J. Nanosci.
Nanotechnol. 2010, 10, 4967
[TW93] Taylor R., Walton D.R.M., Nature 1993, 363, 685
[UM05] Uhrig D., Mays J.W., J. Polym. Sci.: Part A: Polym. Chem. 2005, 43, 6179
[UMD+00] Urbina A., Miguel C., Delgado J.L., Langa F., Díaz-Paniagua C., Batallán F.,
Phys. Rev. B 2000, 78, 045420
151 [VCY+03] Viswanathan G., Chakrapani N., Yang H., Wei B., Chung H., Cho K., Ryu
C.Y., Ajayan P.M., J. Am. Chem. Soc. 2003, 125, 9258
[VMF+03] Velasco-Santos C., Martinez-Hernandez A.L., Fisher F.T., Ruoff R., Castano
V.M., Chem. Mater. 2003, 15, 4470
[W47] Wallace P.R., Phys. Rev.1947, 71, 622
[WH04] Wu K.B., Hu S.S., Carbon 2004, 42, 3237
[WHF+02] Wetzel B., Haupert F., Friedrich K., Zhang M.Q., Rong M.Z., Polymer
engineering and science 2002, 42, 1919
[WHW+07] Wang G.-J., Huang S.-Z., Wang Y., Liu L., Qiu J., Li Y., Polymer 2007, 48,
728
[WLX+09] Wang X., Li Q., Xie J., Jin Z., Wang J., Li Y., Jiang K., Fan S., Nano Lett.
2009, 9, 3137
[WPG05] Wang M., Pramoda K.P., Goh S.H., Polymer 2005, 46, 11510
[WTQ+07] Wu H.-X., Tong R., Qiu X.-Q., Yang H.-F., Lin Y.-H., Cai R.-F., Qian S.-
X., Carbon 2007, 45, 152
[WV04] Wagner D., Vaia R., Nanocomposites: issues at the interface. Materials
today. Elsevier Ltd., 2004
[WVR+98] Wildoeer J.W.G., Venema L.C., Rinzler A.G., Smalley R.E., Dekker C.,
Nature 1998, 391, 59
[WZH+04] Wang H., Zhou W., Ho D.L., Winey K.I., Fischer J.E., Glinka C.J., Hobbie
E.K., Nano Lett. 2004, 4, 1789
[XWZ+06] Xu H., Wang X., Zhang Y., Liu S., Chem. Mater. 2006, 18, 2929
[YHP06] You Y.-Z., Hong C.-Y., Pan C.-Y., Nanotechnology 2006, 17, 2350
152 Bibliography [YJP+08] Yu H., Jin Y., Peng F., Wang H., Yang J., J. Phys. Chem. C 2008, 112, 6758
[YKZ05] Yang M., Koutsos V., Zaiser M., J. Phys. Chem. B 2005, 109, 10009
[YLS+07] Yu J., Lu K., Sourty E., Grossiord N., Koning C.E., Loos J., Carbon 2007,
45, 2897
[YMK04] Yurekli K., Mitchell C.A., Krishnamoorti R., J. Am. Chem. Soc. 2004, 126,
9902
[YRS05] Yang D.Q., Rochette J.F., Sacher E., J. Phys. Chem. B 2005, 109, 4481
[YT96] Yang W., Rånby B., J. Appl. Polym. Sci. 1996, 62, 533
[YXW+06] Yang Y., Xie X., Wu J., Mai, Y.-W., Journal of Polymer Science: Part A:
Polymer Chemistry 2006, 44, 3869
[ZCD+99] Zhou P., Chen G.Q., Du F.S., Li Z.C., Li F.M., Acta Polymer Sinica 1999, 6,
757
[ZCH+00] Zhou P., Chen G.Q., Hong H., Du F.S., Li Z.C., Li F.M., Macromolecules
2000, 33, 1948
[ZD08] Zhao J.-X., Ding Y.-H., J. Phys. Chem. C 2008, 112, 13141
[ZGY06] Zeng H., Gao C., Yan D., Adv. Funct. Mater. 2006, 16, 812
[ZHJ+05] Zhao C., Hu G., Justice R., Schaefer D.W., Zhang S., Yang M., Han C.C.,
Polymer 2005, 46, 5125
[ZIW+04] Zhou W., Islam M.F., Wang H., Ho D.L., Yodh A.G., Winey K.I., Fischer
J.E., Chem. Phys. Lett. 2004, 384, 185
[ZKP+03] Zhu J., Kim J., Peng H., Margrave J.L., Khabashesku V.N., Barrera E.V.,
Nano Lett, 2003, 3, 1107
153 [ZLC+08] Zou J., Liu L., Chen H., Khondaker S.I., McCullough R.D., Huo Q., Zhai L.,
Adv. Mater. 2008, 1, 9999
[ZLF+08] Zhao W., Liu Y.-T., Feng Q.-P., Xie X.-M., Wang X.-H., Ye X.-Y., J. App.
Polym. Sci. 2008, 109, 3525
[ZLH+03] Zhao J.J., Lu J.P., Han J., Yang C.K., Appl. Phys. Lett. 2003, 82, 3746
[ZOA+04] Zorbas V., Ortiz-Acevedo A., Dalton A.B., Yoshida M.M., Dieckmann G.R.,
Draper R.K., Baughman R.H., Jose-Yacaman M., Musselman I.H., J. Am.
Chem. Soc. 2004, 126, 7222
[ZOR+01] Zhou W., Ooi Y.H., Russo R., Papanek P., Luzzi D.E., Fischer J.E.,
Bronikowski M.J., Willis P.A., Smalley R.E., Chem. Phys. Lett. 2001, 6, 350
[ZRC+06] Zhang Q. H., Rastogi S., Chen D.J., Lippits D., Lemstra P. J., Carbon 2006,
44, 778
[ZXY+08] Zheng Q., Xue Q., Yan K., Gao X., Li Q., Hao L., Polymer 2008, 49, 800
[ZZT+93] Zhang X.F., Zhang X.B., Van Tendeloo G., Amelinckx S., Op de Beeck M.,
Van Landuyt J., J. Cryst. Growth 1993, 130, 368

154 Bibliography
155
List of publications
Publications related to the dissertation
Golosova A.A., Mendrek A., Steenackers M., Schulte L., Ndoni S., Papadakis C.M., Jordan
R., Polymer brushes on carbon nanotubes by self-initiated photografting
photopolymerization (SIPGP), J. Mater Chem., to be submitted
Golosova A.A., Adelsberger J., Sepe A., Niedermeier M., Lindner P., Funari S.S., Jordan
R., Papadakis C.M., Dispersions of modified carbon nanotubes: A small-angle scattering
investigation, to be submitted
Other publications
Golosova A.A., Papadakis C.M., Jordan R., Chemical functionalization of carbon
nanotubes with aryl diazonium salts, MRS Spring Meeting 2011, accepted
Zhong Q., Wang W., Adelsberger J., Golosova A., Koumba A.M.B., Laschewsky A.,
Funari S.S., Perlich J., Roth S.V., Papadakis C.M., Müller-Buschbaum P., Collapse
transition in thin films of poly(methoxydiethylenglycol acrylate), Colloid. Polym. Sci.
2011, 289, 569
Talks
Golosova A., Jordan R., Papadakis C.M., Chemical functionalization of carbon nanotubes
for preparation of nanocomposites, 4th FRM II Workshop on Neutron Scattering, Burg
Rothenfels, 15 – 18 June 2009
Golosova A., Jordan R., Papadakis C.M., Chemical functionalization of carbon nanotubes
for preparation of nanocomposites, IGSSE Meeting, Raithenhaslach Monastery,
Burghausen, 18 – 19 June 2009
156 List of publications Golosova A., Jordan R., Papadakis C.M., Chemical functionalization of carbon nanotubes
for preparation of nanocomposites, International Conference on Carbon Based
Nanocomposites CNTComp09, Hamburg, 20 – 23 September 2009
Golosova A., Jordan R., Papadakis C.M., Polymer modified carbon nanotubes for
nanocomposite applications, TU Denmark, Nanotech Department, Copenhagen, Denmark,
5 May 2010
Golosova A., Adelsberger J., Sepe A., Niedermeier M., Funari S.S., Lindner P., Jordan R.,
Papadakis C.M., Small-angle scattering study of dispersion ability of the polystyrene
modified carbon nanotubes, DPG Frühjahrstagung 2011, Dresden, 13 – 18 March 2011
Golosova A., Papadakis C.M., Jordan R., Materials “3 in 1”: light, strong, conductive, 5th
IGSSE Forum: Communicating Science to Society, Raithenhaslach Monastery, Burghausen,
8 – 10 June 2011
Posters
Golosova A., Jordan R., Papadakis C.M., Functional Nanocomposites by Directed
Assembly of Carbon Nanotubes in Block Copolymer Matrix, 1st Joint Nano Workshop,
Garching, 10 June 2008
Golosova A., Jordan R., Papadakis C.M., Functional Nanocomposites by Directed
Assembly of Carbon Nanotubes in Block Copolymer Matrix, IGSSE Forum 2008,
Raithenhaslach Monastery, Burghausen, 27 –28 June 2008
Golosova A., Richter G., Timmann A., Jordan R., Papadakis C.M., Sidewall
functionalization of carbon nanotubes for preparation of nanocomposites, HASYLAB
Users’ Meeting, Hamburg, 30 January 2009
Golosova A., Richter G., Timmann A., Jordan R., Papadakis C.M., Sidewall
functionalization of carbon nanotubes for preparation of nanocomposites, DPG
Frühjahrstagung, Dresden, 22 – 27 March 2009
157 Golosova A., Timmann A., Jordan R., Papadakis C.M., Chemical functionalization of
carbon nanotubes for preparation of nanocomposites, Nano-Workshop DTU, Copenhagen,
Denmark, 6 May 2009
Golosova A., Timmann A., Jordan R., Papadakis C.M., Chemical functionalization of
carbon nanotubes for preparation of nanocomposites, Frontiers in polymer science, Mainz,
7 – 9 June 2009
Golosova A., Timmann A., Funari S.S., Jordan R., Papadakis C.M., Chemical
functionalization of carbon nanotubes for preparation of nanocomposites, JCNS 2009,
Tutzing, 5 – 8 October 2009
Golosova A., Jordan R., Adelsberger J., Sepe A., Niedermeier M., Funari S.S., Lindner P.,
Papadakis C.M., Chemical functionalization of carbon nanotubes (CNTs) for preparation
of nanocomposites, DPG Frühjahrstagung, Regensburg, 21 – 26 March 2010
Golosova A., Jordan R., Funari S.S., Lindner P., Papadakis C.M., Chemical
functionalization of carbon nanotubes with polymer grafts, ChemOnTubes, Arcachon,
France, 11 – 15 April 2010
Golosova A., Jordan R., Funari S.S., Lindner P., Papadakis C.M., Chemical
functionalization of carbon nanotubes for nanocomposite applications, All-Russian
conference ”Macromolecular nanoobjects and polymer nanocomposites”, Moscow, 24 – 29
October 2010
Golosova A., Adelsberger J., Sepe A., Niedermeier M., Funari S.S., Lindner P., Jordan R.,
Papadakis C.M., Small-angle scattering study of dispersion ability of the polystyrene
modified carbon nanotubes, HASYLAB Users’ Meeting 2011, Hamburg, 27 January 2011

Acknowledgments
First of all, I would like thank my academic advisors, Prof. Christine M. Papadakis and
Prof. Rainer Jordan, for giving me the opportunity to work on the interesting and
interdisciplinary project, for their helpful advices and inspiration. I really appreciate the
chance they have provided me to assimilate in a short time the experience in working with
CNTs, at both physical and chemical aspects.
I want to thank Dr. Sokol Ndoni for overtaking a supervision of my work during the three-
months research stay at Technical University of Denmark, Department of Nanotechnology.
And I am especially grateful to Lars Schulte: firstly, for his assistance during SEM
measurements (which mainly were possible at the weekends), and secondly, for brightening
my loneliness in Denmark.
Additionally, I would like to thank Dr. Sergio Funari and Dr. Peter Lindner for the
assistance during the beamtimes at A2, HASYLAB and D11, ILL.
I am also grateful to Dr. Aleksandra Mendrek from Professur für Makromolekulare
Chemie, TU Dresden, for TGA measurements and to Prof. J.A. Lercher from Lehrstuhl für
Technische Chemie II, TU München, for letting me use the facilities in his laboratory for
Raman spectroscopy.
Also, to Prof. Peter Müller-Buschbaum and to Prof. Bernhard Rieger, I express my
gratitude for giving me the opportunity to work in the labs at Physics and Chemistry
Departments.
I thank all my former and current colleagues at Chemistry and Physics Departments for
their help and productive discussions. Special thanks to Gerhard Richter for his patience in
explaining me, a Russian student with a Diploma-degree in Physics, the basics of organic
synthesis and for his help in the first steps of my PhD. I want to express my sincere
gratitude to Joseph Adelsberger, Tilo Hoppe, Alessandro Sepe, Sebastian Jaksch, Dr.
Johannes Wiedersich, Martin Niedermeier, Semih Ener, as well as to Naima Hutter, Frank
Deubel, Dr. Marin Steenackers and Dr. Uwe Seemann: it was a real pleasure for me to be in
one team with you. Thanks to all the members of MAKRO and E13 groups for the
wonderful working (and not only working) atmosphere!

I would also like to thank our secretaries, Monika Antoniak, Petra Douglas, Susanna Fink
and Marion Waletzki, for their help and support with the paperwork. Besides, it was always
nice to just drop in at their office, because of their cheerful mood that they share with
everyone.
For financial support, I would like to thank International Graduate School of Science and
Engineering (IGSSE). Also, the whole concept of IGSSE appeared to be perfect for the
comprehensive development of professional and personal skills. I appreciate it a lot.
And finally, my special thanks I give to the people who supported me with their love, faith
in me and encouragement throughout the 3 years of my PhD. These are my parents, my
dear Mama and Papa, and the remainder of my family in Russia. Probably, this dissertation
would have been impossible without their moral support. Thank you!