Embed Size (px)
Citation preview

REVIEW
Physiological aspects of energy metabolism andgastrointestinal effects of carbohydrates
M Elia1 and JH Cummings2
1Institute of Human Nutrition, University of Southampton, Southampton, UK and 2Department of Pathology and Neuroscience,Ninewells Hospital and Medical School, Dundee, UK
The energy values of carbohydrates continue to be debated. This is because of the use of different energy systems, for example,combustible, digestible, metabolizable, and so on. Furthermore, ingested macronutrients may not be fully available to tissues,and the tissues themselves may not be able fully to oxidize substrates made available to them. Therefore, for certaincarbohydrates, the discrepancies between combustible energy (cEI), digestible energy (DE), metabolizable energy (ME) and netmetabolizable energy (NME) may be considerable. Three food energy systems are in use in food tables and for food labelling indifferent world regions based on selective interpretation of the digestive physiology and metabolism of food carbohydrates. Thisis clearly unsatisfactory and confusing to the consumer. While it has been suggested that an enormous amount of work wouldhave to be undertaken to change the current ME system into an NME system, the additional changes may not be as great asanticipated. In experimental work, carbohydrate is high in the macronutrient hierarchy of satiation. However, studies of eatingbehaviour indicate that it does not unconditionally depend on the oxidation of one nutrient, and argue against the operation ofa simple carbohydrate oxidation or storage model of feeding behaviour to the exclusion of other macronutrients. The site, rateand extent of carbohydrate digestion in, and absorption from the gut are key to understanding the many roles of carbohydrate,although the concept of digestibility has different meanings. Within the nutrition community, the characteristic patterns ofdigestion that occur in the small (upper) vs large (lower) bowel are known to impact in contrasting ways on metabolism, whilein the discussion of the energy value of foods, digestibility is defined as the proportion of combustible energy that is absorbedover the entire length of the gastrointestinal tract. Carbohydrates that reach the large bowel are fermented to short-chain fattyacids. The exact amounts and types of carbohydrate that reach the caecum are unknown, but are probably between 20 and40 g/day in countries with ‘westernized’ diets, whereas they may reach 50 g/day where traditional staples are largely cereal ordiets are high in fruit and vegetables. Non-starch polysaccharides clearly affect bowel habit and so, to a lesser extent, doesresistant starch. However, the short-chain carbohydrates, which are also found in breast milk, have little if any laxative role,although do effect the balance of the flora. This latter property has led to the term ‘prebiotic’, which is defined as the capacity toincrease selectively the numbers of bifidobacteria and lactobacilli without growth of other genera. This now well-establishedphysiological property has not so far led through to clear health benefits, but current studies are focused on their potential toprevent diarrhoeal illnesses, improve well-being and immunomodulation, particularly in atopic children and on increasedcalcium absorption.
European Journal of Clinical Nutrition (2007) 61 (Suppl 1), S40–S74; doi:10.1038/sj.ejcn.1602938
Keywords: carbohydrate; energy; short-chain fatty acids; glycaemic index; food labelling; prebiotic
Introduction
All organisms require fuels to maintain their life cycles. For
humans, carbohydrates are the major fuels, typically
accounting for 45–70% of the total energy intake and
expenditure. Despite their importance in energy metabo-
lism, the energy values of some carbohydrates continue to be
debated and are confused due to the existence of different
energy systems, which are not entirely consistent with each
other (for example, combustible, digestible energy (DE),
metabolizable energy (ME), net metabolizable energy
(NME) systems; general and specific Atwater systems). The
choice of energy system is of considerable importance
because it not only affects the energy values of carbo-
hydrates, but also those of fats, proteins and alcohol (FAO,
Correspondence: Professor M Elia, Institute of Human Nutrition, University of
Southampton, Southampton General Hospital, MP 113 (F Level), Tremona Rd,
Southampton SO16 6YD, UK.
E-mail: [email protected]
European Journal of Clinical Nutrition (2007) 61 (Suppl 1), S40–S74& 2007 Nature Publishing Group All rights reserved 0954-3007/07 $30.00
www.nature.com/ejcn

2003). In establishing the energy values of carbohydrates, it
is not only necessary to consider their intrinsic physico-
chemical properties, but also their physiology, specifically,
their digestibility, the end products of their metabolism and
even the pathways by which they are metabolized. Since it is
desirable to use the same energy system for all macronu-
trients, it is appropriate to consider at least briefly the energy
values of carbohydrates, fats and proteins as a combined
entity. Similarly, the role of carbohydrates in energy balance
can only be adequately examined by considering the broader
perspectives of energy homeostasis, which involve all
macronutrients.
The site of carbohydrate breakdown in the gut, the rate
and extent of breakdown, and the kinetics of absorption are
key to understanding many other roles that carbohydrate
plays beyond providing energy. In the large bowel, dietary
carbohydrate interacts with a rich and diverse microbiota
that produce end products unique to the body. This process
of fermentation affects bowel habit, transit time, mucosal
health, and also provides products to the portal and systemic
circulation, thus effecting metabolism both within and
beyond the gut.
In this paper, we have focused on areas where there has
been progress since the 1997 consultation, or where there is
substantial controversy. The implications for the glycaemic
response and for conditions such as diabetes, obesity and
cancer are dealt with in other papers in this expert review.
The evidence reviewed is primarily from human studies.
Energy values of carbohydrates and othermacronutrients
Figure 1, which is a modification of previous diagrams
(Warwick and Baines, 2000; Livesey, 2001; FAO, 2003), shows
the flow of energy through the body. It presents a conceptual
framework for considering energy values of foods and
individual macronutrients. The pathway begins with the
combustible energy intake that depends on the physico-
chemical characteristics of ingested macronutrients, and not
on physiological processes. There are then three subsequent
consecutive steps, each of which depends on the previous
one. Each of these depends on physiological processes:
digestibility (relevant to DE), metabolizability (relevant to
ME) and relative metabolic (bioenergetic) efficiency (rele-
vant to NME). These are considered separately below.
Combustible energy
Combustible energy refers to the heat released during
complete combustion of foodstuffs or macronutrients in
the presence of O2, to yield CO2 and H2O. The heat of
combustion of amino acids/protein is reported in various
ways, for example with S being in elemental form, as SO3, or
H2SO4. In the comprehensive analysis provided by Elia and
Livesey (1992), the end products are H2O (liquid), CO2 (gas),
N2 (gas) and H2SO4.115H2O. Combustible energy has also
been called the heat of combustion, gross energy, intake
energy and energy intake. Since some of these terms can be
confused with DE and ME intake, the term combustible
intake of energy (cIE) will be used in this paper, because it is
self-explanatory and less likely to be misinterpreted or
confused with other terms.
The combustible energy values for hexose-based carbo-
hydrates (kJ/g) are generally between 15.5 and 17.5 kJ/g (less
than 15% difference) (Table 1) (Livesey and Elia, 1988; Elia
and Livesey, 1992), and are more than twofold lower than
those of typical fats. Since carbohydrates are more oxidized
than fats (their carbon skeletons are linked to relatively more
oxygen and less hydrogen), they generate less heat than fat
when fully combusted with oxygen. The variability in heat
of combustion of different hexose-based carbohydrates (kJ/g)
is almost entirely determined by the number of glycosidic
bonds, the formation of which is associated with loss of one
molecule of water (water of condensation) per glycosidic
bond (Elia and Livesey, 1992). When the heat of combustion
of hexose-based carbohydrates is expressed as monosacchar-
ide equivalents, the values are very consistent with each
other (B15.7 kJ/g, rounded to 16 kJ/g). The value for
glycogen is only approximately 1.3% greater than that of
glucose (Elia and Livesey, 1992), the difference being due to
the heat released during the breakdown of the glycosidic
bonds (in living organisms, this is achieved through
enzymatic hydrolysis of glycosidic bonds (heat of hydro-
lysis). Glucose monohydrate is unusual in being hydrated
Ingested energy (cIE)
Digestible energy (DE)= cIE – cFE - cGaE
Metabolisable energy (ME)= DE – cUE - cSE
Net metabolisable energy(NME) = ME –Hine = kME
Faecal energy (cFE)
Combustible gas (cGaE)
Urinary energy (cUE)
Surface energy (cSE)
Heat due to bio-energeticinefficiency relative toglucose oxidation (Hine)
(Stored energy)
LossesGains
Figure 1 Diagram showing the flow of energy through the body.The abbreviations cIE, cFE, cGaE and cSE refer to combustible intakeenergy (cIE), combustible faecal (cFE), gaseous (cGaE) and surfaceenergy (cSE), respectively. Hine is the heat released as a result ofmetabolic inefficiency in performing metabolic and external workrelative to glucose. The coefficient k reflects this metabolic efficiency.The equations shown in the diagram apply in states of nutrientbalance. In situations where excess energy is deposited, metaboliz-able energy (ME) and net metabolizable energy (NME) of the dietincludes the energy that would be made available throughmobilization and oxidative metabolism of the stored energy.
Physiological aspects of energy metabolismM Elia and JH Cummings
S41
European Journal of Clinical Nutrition

and having a low-energy density (14.1 kJ/g), but when
expressed as anhydrous glucose, the value becomes 15.6 kJ/g.
The heat of combustion of polyols (alcohol derivatives of
sugars), as for other carbohydrates, depends on their
composition and number of glycosidic linkages. For many
the values are B17.0 kJ/g (for example, 16.70–17.2 kJ/g for
erythritol, isomalt, lactitol, maltitol, mannitol, sorbitol,
xylitol) (Elia and Livesey, 1992; Livesey, 1992). Glycerol
(triol), which is also a polyol, has a relatively high heat of
combustion (18 kJ/g). The values for polysaccharides that
reach the colon do not differ substantially from those for
starch or glycogen (for example, 17.5 kJ/g for guar gum and
solka-floc cellulose, 17.2 kJ/g for pectin, but as low as 15.5 kJ/
g for psyllum gum and as high as 17.6 kJ/g for sugar beet
fibre) (Livesey, 1992; Livesey and Elia, 1995). The mean
values for non-starch polysaccharides (NSP) in cereals have
been reported to be 17.5 (range 16.6–18.5) kJ/g, vegetables,
16.8 (range 16.6–17.9) kJ/g, and fruits 16.5 (range 14.9–
17.3) kJ/g. Hydroxyl-propylmethyl cellulose, a chemically
modified NSP, has a particularly high heat of combustion
(22.0 kJ/g), which is due to the high heat of formation of the
substituted side chains. The values for oligosaccharides, such
as polydextrose, polyfructose and soya bean oligosaccharides
are between 16.8 and 17.0 kJ/g. It is estimated that the
average combustible energy of NSP in mixed conventional
diets is approximately 17.0 kJ/g, compared to 15.7 kJ/g for
carbohydrates (as monosaccharide equivalents) that are
absorbed by the small bowel (‘available carbohydrates’).
The principles of thermodynamics imply that the heat
released when carbohydrates are completely combusted in a
bomb calorimeter in the presence of oxygen is the same as
when the same quantity of carbohydrate is fully oxidized to
H2O and CO2 by living organisms through a large series of
metabolic steps. However, ingested macronutrients may not
be made fully available to tissues, and the tissues themselves
may not be able to fully oxidize substrates made available to
them. Therefore, for certain carbohydrates, the discrepancies
between combustible energy (cEI), DE, ME and NME may be
considerable.
Digestible energy
It is obvious that substances that are not absorbed cannot be
metabolized by human tissues. For the purposes of energy
metabolism, digestibility is defined as the proportion of
combustible energy that is absorbed over the entire length of
the gastrointestinal tract. DE (DE¼ cIE�digestibility) is
estimated as the difference between the combustible energy
present in ingested food and that present in faeces
(þ combustible gases, such as H2 and CH4 which are
excreted).
DE ¼ cIE � cFE � cGaE
The ‘c’ in cIE (combustible intake energy), cFE (combustible
faecal energy) and cGaE (combustible gaseous energy)
indicates that it is the heat of combustion that is being
considered, thus avoiding confusion with DE, ME and NME
values. DE is actually an ‘apparent’ energy value, because the
flux of nutrients into and out of the colon is not unidirec-
tional. For example, mucus is secreted into the large bowel
(estimated to be 2–3 g/day, but in certain diseases affecting
the large intestine, the amount may be considerably more).
In addition, desquamated colonic cells are shed directly into
the lumen of the colon, which may also receive desquamated
cells from the small intestine. Some of the energy from these
sources, which is not present in the diet, may be lost to
faeces, reducing the apparent digestibility of the diet.
Another problem concerns loss of energy in the form of
combustible gaseous products (flatusþbreath), which was
neglected in early human studies. The result is that DE intake
was slightly overestimated. However, this omission makes
very little overall difference to DE intake because a relatively
small amount of energy is lost in this way in humans. Whole
body calorimetry studies over 24 h in healthy subjects have
measured the excretion of H2 and CH4 (via flatus and breath)
and found it to be small (usually o1 l/day) (Poppitt et al.,
1996; King et al., 1998), with variable and sometimes an
inverse relationship between H2 and CH4 excretion. This
may correspond, very approximately, to about 3–5% of the
Table 1 The RQ (CO2 production/O2 consumption), combustibleenergy equivalents of CO2 (cEeqCO2) and O2 (cEeqO2), and the heatof combustion of the major macronutrients and specific carbohydratesa
RQ EeqO2 (kJ/l) EeqCO2 (kJ/l) Heat ofcombustion (kJ/g)
MacronutrientsCarbohydrate 1.000 21.12 21.12 17.51Fat 0.710 19.61 27.62 39.42Protein 0.835 19.48 23.33 23.64Alcohol 0.667 20.33 30.49 29.68
Specific carbohydratesStarch 1.000 21.12 21.12 17.48Glycogen 1.000 21.12 21.12 17.52Sucrose 1.000 20.97 20.97 16.48Maltose 1.000 20.99 20.99 16.49Lactose 1.000 21.00 21.00 16.50Glucose 1.000 20.84 20.84 15.56Galactose 1.000 20.84 20.84 15.56Fructose 1.000 20.91 20.91 15.61Glycerol 0.857 21.16 24.69 18.03Erythritol 0.889 20.91 23.53 17.27Xylitol 0.909 19.92 21.91 16.96Sorbitol 0.923 20.89 22.71 16.71Mannitol 0.923 20.89 22.71 16.71Maltitol 0.960 20.87 21.74 16.98Lactitol 0.960 20.87 21.74 16.98Isomalt 0.960 20.87 21.74 16.98
Abbreviations: EeqCO2, energy equivalents of CO2; EeqO2, energy equivalents
of O2; RQ, respiratory quotient.aThe values are based on the characteristics of the nutrients and are
independent of whether they are endogenous or exogenous or whether they
are given orally or intravenously. Based on Elia and Livesey (1992) and
unpublished data.
Physiological aspects of energy metabolismM Elia and JH Cummings
S42
European Journal of Clinical Nutrition

combustible energy of the fermentable carbohydrates enter-
ing the colon (0.50–0.85 kJ/g, sometimes rounded up to
1 kJ/g of fermentable carbohydrate) and 0.3–0.5% of total
combustible carbohydrate intake when 10% of it enters the
colon as fermentable carbohydrate. Most H2 and CH4 are
excreted in flatus, especially at high rates of net gaseous
production, but a variable proportion is absorbed and excreted
unchanged in breath (cf. definition of DE above, which
involves absorption of gases produced during fermentation,
which contributes to the overall ‘digestibility’ of energy).
It should be noted that the digestibility and DE values are
mean values obtained in subjects without disease. It is
recognized that digestibility, and therefore DE (kJ/g), vary
between individuals and are affected by both age (for
example, the fractional absorption of some macronutrients,
is less in young infants than adults) and disease (malabsorp-
tion disorders). There may also be interaction between
nutrients. For example, studies in rats suggest that guar
gum and some pectin preparations induce substantial faecal
fat loss, although quantitatively important interactions of a
similar kind were not observed in humans (Rumpler et al.,
1998). One study in healthy volunteers showed that an
increase in dietary fibre intake from 15 to 46 g/day, through
addition of pectin to the diet, increased fatty acid excretion
from 1.5 to 2.7 g/day (Cummings et al., 1979). Another study
reported a smaller increase in fatty acid excretion when
dietary fibre intake was increased from 17 to 45 g/day
through addition of wheat bran to the diet (Cummings
et al., 1976). The possibility that quantitatively greater
interactions occur with novel fats cannot be excluded.
Dietary fibre has also been repeatedly reported to increase
N excretion, but at least some of this N originates from urea,
which passes through the colonic mucosa to reach bacteria
and which also enters the colon through the ileocaecal valve,
which allows transfer of small intestinal fluid from the small
to the large intestine. Fat and protein (non-nitrogenous
component) in biomass are generally thought to be gener-
ated from fermentable carbohydrate. High intakes of fibre
may also increase shedding of mucosal cells, containing
some fat and protein) into the lumen of the gut.
For carbohydrates that are considered to be fully digested
and absorbed by the small intestine (digestibility¼1.0; for
example, glucose, fructose, lactose, sucrose and starch), DE is
identical to cIE. For carbohydrates that are not absorbed at
all, DE and digestibility are zero (although their cIE is similar
to that of other types of carbohydrates (kJ/g)).
The DE of carbohydrate that reaches the colon (‘unavail-
able carbohydrate’) is lower than its cEI, partly because some
are not fermented (faeces generally contain some of this
carbohydrate) and partly because some of the products of
fermentation are lost to faeces (for example, as bacterial
biomass). Virtually, all the short-chain fatty acids (SCFAs)
produced during fermentation are absorbed through the
colon and metabolized by human tissues (butyrate is also
actively metabolized by the colonic mucosa). Guar gum,
which is completely fermented, contributes about 60% of its
cIE to SCFAs; pectin, which is about 95% fermented
contributes a little less of its energy to SCFAs; and other
types of carbohydrates, which are poorly fermented (for
example, Solka-floc) contribute very little of their energy to
SCFAs (Livesey and Elia, 1995). For traditional foods (foods
listed in the 1978 edition of McCance and Widdowson’s
Composition of Foods (Paul and Southgate, 1978), a general
fermentability value of 70% seems reasonable (Livesey and
Elia, 1995; FAO, 1998), since 30% of the NSP is excreted in
faeces over a wide range of intakes. This is in agreement with
intestinal balance studies and net production rates of SCFAs,
which are almost entirely available for metabolism by
human tissues (Livesey and Elia, 1995), with lower efficiency
than glucose (Hine is used to indicate the heat released as a
result of this metabolic inefficiency relative to glucose). A
schematic diagram (Figure 2) can help understand how
standard reference values for DE (and ME) of NSP and other
carbohydrates reaching the colon (‘fibre’) are established,
assuming that 70% are fermented there. For historical
reasons, values for the energy values of ‘fibre’ largely
developed from meta-analyses of studies using either the
AOAC (2002) or Southgate (1969) analytic procedures, which
corresponds approximately to NSPþ resistant starch (RS).
DE ¼cIE � cFE � cGaE
¼17:0 � 8:7 � 0:6kJ=g
¼7:7kJ=g
The value for cFE (8.7 kJ/g) is the sum of the cIE of
unfermented carbohydrate (5.1 kJ/g or 30% of the total cIE
of the carbohydrate entering the colon; Figure 2) and
products of fermentation lost to faeces (mainly bacterial
matter) (3.6 kJ/g). Another way of calculating the same result
is to use a fractional intestinal balance approach. Since 70%
of carbohydrate that reaches the colon is fermented, of
which B65% is transformed into SCFAs (B60%) plus
gaseous energy (5%), then the following equation applies:
DE ¼17:0�0:7�0:65
¼7:7kJ=g
For simplicity, the figure assumes that 5% of the energy of
fermented carbohydrate is lost as fermentation heat and
another 5% as gaseous energy, although it is more likely to
be 7 and 3%. The results also vary between subjects. For
example, calculations based on balance studies carried out in
six subjects who were studied in a metabolic unit and whole
body calorimeter indicate that 3.872.8% of fermentable
energy (NSPþRS) was lost as gaseous energy (H2 and CH4)
(Poppitt et al., 1996). The values for individual types of
fermented carbohydrate differ, partly because the proportion
fermented varies and partly because products of fermenta-
tion also vary (that is, bacterial biomass plus gaseous
products, which are excreted vs SCFAs, virtually all of which
are absorbed and metabolized by human tissues) (Livesey
and Elia, 1995).
Physiological aspects of energy metabolismM Elia and JH Cummings
S43
European Journal of Clinical Nutrition

Similar calculation procedures to the above can be used to
establish DE values of polyols. Like NSP, polyols are a
heterogeneous group of substances (Bernier and Pascal,
1990; Japanese Ministry of Health, 1991; Livesey, 1992;
FASEB 1994; Finley and Leveille, 1996) that have different
physiological properties. For example, glycerol, like glucose,
is fully absorbed (digestibility¼1.0), and therefore its DE is
the same as its cEI (18.0 kJ/g). Although other polyols, such
as isomalt, lactitol, maltitol and erythritol, have a cEI of
16.70–17.20 kJ/g, their DE values (11.0–16.61 kJ/g) are 65–
97% of their cEI. In contrast, virtually, all the lactitol in food
escapes digestion and absorption by the small bowel and
finds its way into the large bowel, where about 60% of its cIE
is converted to SCFAs, which are subsequently absorbed by
the colon (cIE, 17.0 kJ/g; DE, estimated to be about 11.1 kJ/g
(DE¼0.65cIE)). With the increasing use of different types of
polyols in foods, it is becoming apparent that their digestibility,
the extent to which they are absorbed by the small bowel and
the extent to which they are subsequently metabolized by
human tissues varies so much (see below) that it might be
appropriate to use individual rather than generic energy values.
A further potential complexity is that polyols may be handled
differently by the gut (resulting in different digestibility and DE
values) when taken in foods compared to drinks. However,
food regulations normally prohibit the use of polyols in drinks.
An exception is the use of erythritol, which is hardly
metabolized once absorbed and hardly fermented when
reaching the colon. An issue for further consideration is
whether low-dose polyols should be used in drinks.
Metabolizable energy
By convention, the metabolizable dietary energy (ME) is meas-
ured at zero nitrogen and energy balance. In these circumstances,
ME is the component of DE that produces heat during oxidative
metabolism. It does not include energy that is lost to urine
(combustible urinary energy (cUE; for example, urea, which is a
partially combusted end product of protein metabolism or
unmetabolized urinary polyols) or body surfaces (combustible
surface energy (cSE; for example, desquamated cells, hair loss,
perspiration), because this energy is not used in metabolism.
Therefore, ME can be defined mathematically as follows:
ME ¼ DE � cUE � cSE
Since DE¼ cIE–cGaE, the following also applies:
ME ¼ cIE � cGaE � cUE � cSE
In normal healthy subjects, loss of surface energy is small
and can be ignored. For many carbohydrates (for example,
Bacterial matter
Unfermented fibre
Short chain fatty acids(SCFA)
H2 and CH4
Fermentation heat
5.1
3.6
7.1
0.60.6
Faecal energy (8.7 kJ)
Metabolisable = Digestibleenergy (7.7 kJ)
Energy kJ/g
Hine SCFA (1.2 kJ)
Netmetabolisableenergy(5.9 kJ)
Gaseous energy (0.6 kJ)
Hine 'fibre'(1.8 kJ)
'Fibre'17.0 kJ/g
Figure 2 The fate of ‘fibre’ ingested with conventional foods. It is assumed that 70% is fermented, so that 5.1 kJ/g (30% of the combustibleintake energy (cIE) is lost to faeces unchanged. Of the fibre that is fermented, 5% of the cIE energy is lost as gaseous products (H2 and CH4), andanother 5% as heat of fermentation, which contributes to metabolizable energy. The majority (60% of cIE) is converted to short-chain fatty acids,almost all of which are absorbed and metabolized by human tissues, or lost to faeces (30% of cIE), mainly as bacterial biomass. Of the energyinitially present in total fibre (fermentable and non-fermentable) 51.0% is lost to faeces, 3.5% to gaseous products and the remaining 45.5%accounts for metabolizable energy.
Physiological aspects of energy metabolismM Elia and JH Cummings
S44
European Journal of Clinical Nutrition

glucose, starch, NSP) there is also negligible loss of cIE to
urine, and so cUE can also be ignored. Under these
circumstances (which do not apply to many polyols), the
following equation is valid
DE ¼ ME
For carbohydrates that are fully absorbed and fully metabo-
lized to CO2 and H2O (‘available carbohydrates’, for
example, glucose, starch), the following equation also
applies:
cIE ¼ DE ¼ ME
For other types of carbohydrates, ME is less than cIE, either
because there is some loss of cIE to faeces (cFE) and/or urine
(cUE), as in the case of some polyols. Polyols, which are often
used as bulk-sweetening agents, have fewer detrimental
effects on teeth, lower glycemic indices and lower ME values
than conventional sweet sugars (for example, glucose,
fructose, sucrose). The proportion absorbed by the small
intestine varies considerably with the type of polyol (Bernier
and Pascal, 1990; Livesey, 1992; Finley and Leveille, 1996),
and tends to decrease with increasing molecular weight. As
much as 35% of the energy of polyols can be accounted for
in faeces (digestibility of energy, 65–100%; although polyols
are fermented and not recovered in faeces, some of the
products of this fermentation are recovered in faeces). In
addition, a variable proportion of absorbed polyols is lost in
urine. A detailed discussion about the extent of absorption
and metabolism of polyols by bacteria in the human colon
and by human tissues is beyond the scope of this paper.
However, the following brief points illustrate the variability
in their physiological handling. The small intestine absorbs
only about 2–5% of lactitol, which is almost completely
recovered in urine (95%), with little oxidation by human
tissues (suggested by studies involving intravenous admin-
istration of C-labelled lactitol (Bernier and Pascal, 1990)).
The small intestine absorbs B25% of mannitol and, like
lactitol, it is almost totally excreted in urine without
metabolism by human tissues (again suggested by intrave-
nous administration of labelled (Nasrallah and Iber, 1969)
and unlabelled (Nasrallah and Iber, 1969) mannitol). In
contrast, glycerol is completely absorbed and metabolized by
human tissues, without excretion in urine. Sorbitol is
absorbed to the extent of B50%, of which the majority
(B85%) is metabolized by human tissues (Finley and
Leveille, 1996).
Most studies assessing ME of diets have been carried out in
subjects close to N and energy balance. The DE and ME
systems appear to overestimate DE and ME when energy
intake is low, especially when accompanied by high NSP
intake because apparent digestibility tends to be lower. Food
energy values reflect the supply of energy and not whether it
is spent. Some energy is deposited during growth and
development of obesity. The combustible energy that is
deposited in such situations corresponds to DE, which may
not be made available to oxidative metabolism, if for
example it is retained during the growing process. Some of
it may not be made available even if it were mobilized
and metabolized, because incompletely combusted products
of metabolism, such as urea, are excreted in urine
(for protein, DE4ME). However, when carbohydrate is
mobilized, it is usually totally oxidized (combustible
energy¼DE¼ME). The issue is discussed further below—
‘Calculating energy balance’.
DE and ME values may be influenced by genetic factors
and disease. For example, although lactose is assigned a
digestibility coefficient of 1.0, so that cIE¼DE (also¼ME), in
subjects with lactose malabsorption (Matthews et al., 2005;
Montalto et al., 2006) (due to genetic factors that can affect
entire populations, or to damage of intestinal lactase by
gastroenteritis or enteropathy), not all the lactose is hydro-
lyzed and absorbed by the small intestine. Some of it reaches
the colon, where it is fermented to produce faecal matter and
gaseous end products (both of which reduce DE and ME) and
SCFAs, which are absorbed and metabolized by human
tissues. Another example concerns fructose, which when
ingested in small quantities is fully absorbed by the small
intestine, but when ingested in large quantities, can reach
the large bowel, where it is fermented (Truswell et al.,
1988). This fermentation results in some loss of energy
to faeces (cFE) (for example, as bacterial biomass), which
again reduces its DE and ME values. Yet another example
involves loss of glucose in the urine of diabetic patients
(metabolizability of o1.0; and MEoDE). Since DE and ME
values vary between individuals and are affected by disease,
the values in general use are based on average results
obtained in ‘healthy’ subjects using doses of substrates that
are likely to be ingested. Any errors in establishing DE values
will not only affect ME values but also NME values, which is
discussed next.
Net metabolizable energy
A criticism that has been raised against the ME system is that
it fails to consider differences in the efficiency with which
substrates supply biologically useful energy. The NME system
is based on the concept of biological efficiency at the level of
ATP and takes into account two specific processes, both of
which have the effect of reducing metabolic efficiency. First,
the heat of fermentation does not yield ATP to the host.
Since this lowers the overall bioenergetic efficiency of the
fermentable substrate, some workers have suggested using
the term ‘true metabolizable energy’, which they have
defined as ME minus the heat of fermentation (Bar, 1990;
Bernier and Pascal, 1990). This approach, which is used in
animal nutrition, differs from that in human nutrition,
where the heat of fermentation is included in ME. Second,
different fuels yield net ATP (ATP gain) with different
bioenergetic efficiencies (Elia and Livesey, 1988, 1992;
Blaxter, 1989). Those with lower efficiencies (for example,
protein) will result in more heat production for the
Physiological aspects of energy metabolismM Elia and JH Cummings
S45
European Journal of Clinical Nutrition
same useful metabolic or external physical work done than
in those with higher efficiencies (that is, more heat is
released for the same ATP gain). The NME system aims to
make the energy values of all fuels equivalent at a
biochemical level (isobioenergic). It does this by adjusting
ME values to take into account differences in the energetic
efficiency with which net ATP is generated. A theoretical
approach, which is discussed first, has been found to agree
remarkably well with an empirical approach based on
measurements obtained by indirect calorimetry, which is
discussed later.
The energy equivalent of ATP is the heat generated
during oxidation of a substrate (ME) divided by the
number of moles of ATP gained through specified
oxidative metabolic pathways. To understand this,
it is necessary to clarify four points (Elia and Livesey,
1988, 1992).
(1) Application of NME does not require an under-
standing of how ATP is generated, any more that
than application of ME requires an understanding
of the complex processes of digestion and fermenta-
tion, which are quantitatively poorly understood and
variable.
(2) ATP gain does not mean that ATP accumulates: ATP has a
small pool size with a very rapid turnover. Therefore, the
term ‘ATP gain’ refers to the ATP made available to the
body for metabolic or external work.
(3) Some pathways involve both production and utilization
of ATP. For example, during glucose oxidation, one ATP
is obligatorily used in the initial activation of glucose to
glucose 6-phosphate and another for the conversion
of fructose-6-phosphate to fructose-1,6-biphosphate.
Therefore, two extra moles of ATP are produced than
are gained. The term ‘ATP gain’ refers to the net gain of
ATP (total ATP produced minus ATP utilized obligatorily
during the oxidation of a substrate).
(4) ATP gain, which refers to the net provision of energy
in the form of ATP, has to be distinguished from
biochemical processes, including substrate cycling
(for example, fatty acid-acetyl-CoA recycling or
glucose-lactate recycling) that utilizes ATP. The two
should not be confused because they are on different
sides of the ATP balance equation (ATP gain¼ATP
utilized).
The NME system is based on the concept of relative
metabolic efficiency. Although uncoupling of oxidative
phosphorylation increases the amount of heat released per
ATP gained, this affects all macronutrients, so that the ratio
of metabolic efficiency between two macronutrients is
expected to change much less than that associated with a
single nutrient. This is confirmed quantitatively by theore-
tical models of progressive uncoupling (Livesey, 1984, 1986).
By convention, the NME system expresses efficiency of
nutrients relative to glucose, which is assigned an efficiency
coefficient of 1.0 (kglucose¼1.0)(Dutch Nutrition Council,
1987; Blaxter, 1989; Livesey and Elia, 1995).
kðnutrientÞ ¼ kJðMEglucoseÞper ATP gain=kJ ðMEnutrientÞper ATP gain
¼ ATP gain per kJ ðMEnutrientÞ=ATP gain per kJ ðMEglucoseÞ
The following equations show how the coefficient, knutrient,
is related to its NME (NMEnutrient).
The lower the value of knutrient, the greater the metabolic
inefficiency relative to glucose and the greater the amount of
heat released for the same ATP gain (Livesey, 1984; Elia and
Livesey, 1988, 1992; Livesey and Elia, 1995).
The term Hine is the extra heat released as a result of
metabolic inefficiency relative to glucose (that is, extra heat
released for the same ATP gain). Hine is therefore a
component of total heat release.
NMEnutrient ¼ knutrient�ME
¼ MEnutrient � ðð1 � knutrientÞ�MEnutrientÞ¼ MEnutrient � Hine
Since Hine is the heat released as a result of the metabolic
inefficiency (relative to glucose) (Hine¼ (1�knutrient)
�MEnutrient), 1�knutrient can be regarded as the metabolic
inefficiency coefficient relative to glucose. The overall values
for k (and therefore 1�k) for carbohydrates fermented in the
large bowel takes into account not only the relative
metabolic inefficiency of oxidizing the products of fermen-
tation (SCFAs are absorbed and oxidized by human tissues),
but also the heat of fermentation, which is not associated
with ATP gain to the host. Both of these elevate the overall
energy equivalent of ATP gain relative to glucose, and
decrease the overall value for knutrient (or increase the
inefficiency coefficient, 1�knutrient), with a resulting increase
in heat production (Hine).
The metabolic efficiency with which fats are oxidized is
98% that of glucose, proteins about 80%, alcohol about 90%,
SCFAs (direct oxidation) about 85–90%. Various scholars and
committees have established theoretical values of efficiency
of substrate oxidation relative to glucose from the stochio-
metry of metabolic pathways (summarized by G Livesey)
with the following ranges: protein (Blaxter, 1971, 1989;
Schulz, 1975, 1978; Flatt, 1978, 1980, 1987, 1992; Livesey
and Elia, 1985; Life Sciences Research Office, 1994; Black,
2000), 0.78–0.85 (mean, 0.81); fat (Armstrong, 1969; Schulz,
1975, 1978; Flatt, 1978, 1980, 1987, 1992; Livesey and Elia,
1985; Blaxter, 1989; Black, 2000), 0.97–1.01 (mean 0.98);
fermentable carbohydrate (British Nutrition Foundation,
1990; Life Sciences Research Office, 1994; Livesey, 2002),
0.74–0.75 (mean, 0.74); and mixed short-chain organic acids
(Armstrong, 1969; Livesey and Elia, 1985; Dutch Nutrition
Council, 1987; Livesey, 1992; Life Sciences Research Office,
1994), 0.83–0.87 (mean, 0.85). In the case of oxidation of
SCFAs by human tissues, this means that about 10–15%
more heat is released for a given ATP gain than when glucose
is oxidized to yield the same ATP gain. However, in subjects
ingesting 80 g protein and only 20 g ‘fibre’, the excess heat
Physiological aspects of energy metabolismM Elia and JH Cummings
S46
European Journal of Clinical Nutrition

generated through bioenergetic inefficiency during protein
oxidation is B10-fold greater than during SCFA oxidation
(B5-fold greater than the overall Hine of fibre, which
includes the heat of fermentation). This is mainly because
more protein is oxidized than in SCFAs, and partly because
the bioenergetic inefficiency in generating ATP is greater
during protein oxidation than in SCFA oxidation. The
inefficiency associated with the metabolism of NSP as a
whole not only takes into account the bioenergetic ineffi-
ciency of oxidizing SCFAs but also the heat of fermentation
(overall metabolic efficiency of fermentable NSP B72.5%
that of glucose). Even so, the heat released as a result of
metabolic inefficiency relative to glucose (Hine) remains
quantitatively more important with protein than with NSP
mainly because much more protein than NSP is usually
ingested. However, in subjects ingesting large amounts of
NSP and relatively little protein, as in some low-income
countries, the heat released as a result of metabolic
inefficiency associated with these two macronutrients can
be almost equivalent.
To examine the validity of the NME system, theoretically
calculated k coefficients were compared to those based on
experimental observations obtained in human studies that
involved calorimetry (for example, whole body 24 h calori-
metry), N balances, and in some cases measurement of H2
and CH4 excretion (Livesey, 2001). In these studies, measure-
ments of energy expenditure were undertaken in subjects
given a control diet or a test diet, which differed from the
control diet in that available carbohydrate was exchanged
for a test substrate (for example, protein, which has a lower k
coefficient than glucose). Test diets, which had lower kdiet
coefficients than control diets, would be expected to be
associated with greater energy expenditure (more heat
production). The increased heat production (Hine) on the
test diet (after adjusting for energy and N balance) was used
to calculate k(nutrient) ((ME–Hine)/ME), assuming that ATP
gain remained unchanged under the conditions of the study,
which involved undertaking a fixed pattern of physical
activity in ambient temperatures of thermal comfort. The
mean results obtained by the theoretical and experimental
approaches are strikingly similar (Table 2). The same type of
approach has been used to establish coefficients for k for the
NME system in animals, and again the similarities between
theoretical and experimental approaches are striking (Live-
sey, 2001). However, as is the case for DE and ME evaluation
of foods, time-consuming studies cannot realistically be
undertaken to establish efficiency values for large numbers
of foods reported in food tables. Therefore, some of the
recent developments and applications of the human NME
system have relied heavily on the theoretical approach.
Detailed theoretical considerations about potential alter-
native pathways for generating ATP gain from the same
substrate are beyond the scope of this paper (for example,
cytosolic vs mitochondrial activation of SCFAs, net lipo-
genesis from glucose; Elia and Livesey, 1988; Livesey and
Elia, 1995; and oxidation of alcohol with alcohol dehydro-
genase or mixed function oxidase). However, alternative
pathways are considered to have small effects on the overall
energy equivalents of ATP. In addition, some processes may
also operate only in unusual circumstances. For example, 24-
h whole-body indirect calorimetry shows that it is unusual
for individuals ingesting a western-type diet to achieve a
non-protein respiratory quotient above 1.0, which would
indicate net lipogenesis from carbohydrate (although persis-
tent overfeeding with large amounts of carbohydrate can do
this, for example, during nutritional repletion of malnour-
ished subjects; Pullicino and Elia, 1991). The energy
equivalent of ATP associated with low to moderate intake
of alcohol was established using the pathway involving
alcohol dehydrogenase, and its validity confirmed by
calorimetry studies (Table 2).
The NME system has been supported by many national
committees in different countries, and the FAO has recom-
mended that it should be considered for food labelling, for
food tables and when calculating practical food needs from
energy requirements. General values for the major macro-
nutrients and specific values for different types of carbohy-
drates are shown in Table 3 (Livesey, 2003a), together with
combustible digestible and metabolizable conversion factors.
Variability in energy values
DE, ME and NME values for specific carbohydrates do not
necessarily apply in all circumstances. For example, in some
individuals, carbohydrates may be totally metabolized by
human tissues after complete absorption by the small
intestine, whereas in others, they are incompletely digested
and absorbed by the small intestine (for example, lactose
malabsorption, which can be elicited more readily certain
ethnic groups). In the latter situation lactose undergoes
colonic fermentation, with some converted into cFE, cGaE
and fermentation heat. The absorption and oxidation of
SCFAs derived from fermentation of lactose is associated
with higher energy equivalents of ATP (less ATP gain) than
when lactose is hydrolyzed and oxidized directly by human
Table 2 A comparison of experimentally obtained and theoreticalvalues of metabolic efficiency of macronutrients relative to glucose(knutrient)
a
Macronutrient(number of studies)
Relative metabolic efficiency (knutrient)
Experimentallyobtained
mean7s.e.m.
Theoretical
Fat (n¼8) 0.9770.01 0.98Protein (n¼9) 0.7970.02 0.80Fermentableunavailablecarbohydrate (n¼8)
0.7170.09 0.76
Alcohol (n¼3) 0.9070.04 0.90
aBased on Livesey (2001).
Physiological aspects of energy metabolismM Elia and JH Cummings
S47
European Journal of Clinical Nutrition
tissues. The overall result is that DE, ME and NME values for
lactose, when there is lactose malabsorption, are lower than
cIE, and lower than the usual values assigned to it, which
assume that all lactose is absorbed from the small bowel
(16.5 kJ/g for cIE, DE and ME values, and 16.3 kJ/g for the
NME). However, this problem is likely to be a minor one,
since individuals with lactose intolerance do not normally
ingest large amounts of lactose because it can produce
undesirable bloating effects and diarrhoea.
The standard DE, ME and NME values obviously
overestimate the actual values in patients with mal-
absorption disorders to an extent that depends on the
type of malabsorption disorder and its severity. In contrast,
the standard values may underestimate the actual
values when nutrients are given intravenously and made
directly available to human tissues. This problem is
addressed in detail elsewhere (Livesey and Elia, 1985,
1988). However, the energy value for glucose, which is
usually the dominant energy source for intravenous
nutrition, remains unaltered, but this may not be so for
other types of carbohydrates that may be lost in urine to a
variable extent.
Calculating energy balance
There is interest in estimating energy balance during growth,
development of obesity and undernutrition, as well as
during their treatment. The energy balance can be calculated
from changes in body composition (Fuller et al., 1992;
Heymsfield et al., 2005), which can provide estimates of fat
and protein mass, and in some cases carbohydrate (glycogen
stores are small, but can be measured accurately and
precisely using nuclear magnetic resonance; Taylor et al.,
1992; Casey et al., 2000). Energy balance can also be
calculated from classic balance studies, which involve
measurement of energy intake and energy expenditure. In
calculating energy balance, it is important not to confuse the
energy values of endogenous and exogenous fuels and also
not to confuse different food energy systems (combustible,
ME and NME systems; Table 4).
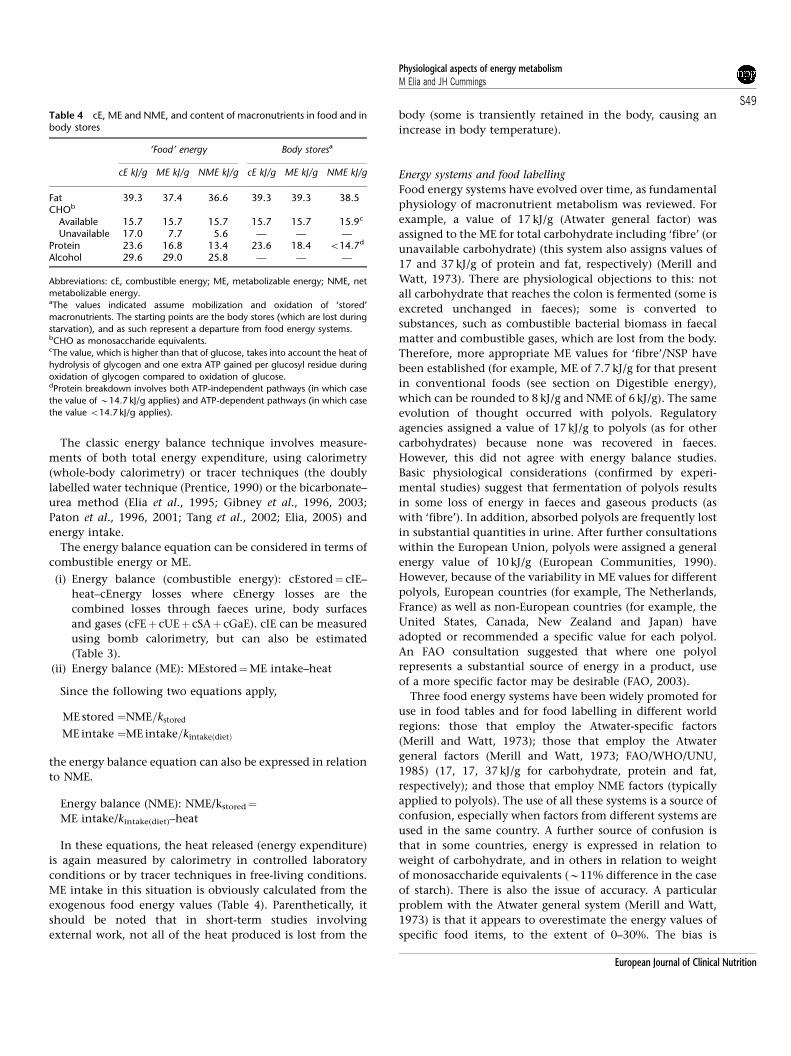
The ME and NME values of nutrients (kJ/g) that are
mobilized from body stores and used for oxidation during
weight loss are higher than the corresponding food energy
values (Table 4), mainly because digestibility does not apply
to the former but it does to the latter. For example, the ME
values of fat in food is 37.4 kJ/g compared to the value of
39.3 kJ/g of stored fat, and for food protein 16.8 kJ/g
compared to 18.4 kJ/g of tissue protein.
Using body composition techniques, the energy balance
equations is
Energy balance ¼Energy storestime point 2 � energy storestime point 1
¼energytime point 2ðcarbohydrate þ fat þ proteinÞ� energytime point 1ðcarbohydrate þ fatþproteinÞ
The energy values for all macronutrients in this equation are
the endogenous food energy values and not the exogenous
food energy values (see Table 4 for combustible energy, ME
and NME values). The body composition approach is usually
only of value in long-term studies where there are large
changes in body composition, which far outweigh measure-
ment precision. In some such studies, the changes in
glycogen stores are small and therefore they are either be
ignored or estimated. The errors associated with this
approach have been assessed (Elia et al., 2003).
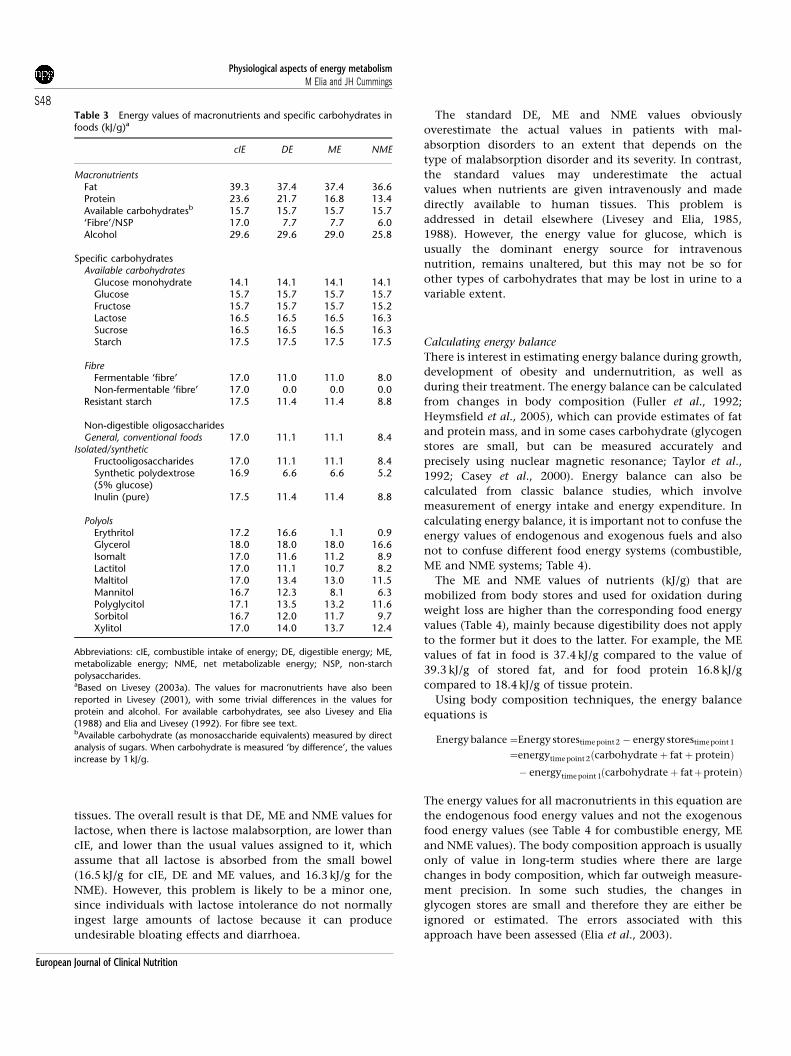
Table 3 Energy values of macronutrients and specific carbohydrates infoods (kJ/g)a
cIE DE ME NME
MacronutrientsFat 39.3 37.4 37.4 36.6Protein 23.6 21.7 16.8 13.4Available carbohydratesb 15.7 15.7 15.7 15.7‘Fibre’/NSP 17.0 7.7 7.7 6.0Alcohol 29.6 29.6 29.0 25.8
Specific carbohydratesAvailable carbohydrates
Glucose monohydrate 14.1 14.1 14.1 14.1Glucose 15.7 15.7 15.7 15.7Fructose 15.7 15.7 15.7 15.2Lactose 16.5 16.5 16.5 16.3Sucrose 16.5 16.5 16.5 16.3Starch 17.5 17.5 17.5 17.5
FibreFermentable ‘fibre’ 17.0 11.0 11.0 8.0Non-fermentable ‘fibre’ 17.0 0.0 0.0 0.0
Resistant starch 17.5 11.4 11.4 8.8
Non-digestible oligosaccharidesGeneral, conventional foods 17.0 11.1 11.1 8.4
Isolated/syntheticFructooligosaccharides 17.0 11.1 11.1 8.4Synthetic polydextrose(5% glucose)
16.9 6.6 6.6 5.2
Inulin (pure) 17.5 11.4 11.4 8.8
PolyolsErythritol 17.2 16.6 1.1 0.9Glycerol 18.0 18.0 18.0 16.6Isomalt 17.0 11.6 11.2 8.9Lactitol 17.0 11.1 10.7 8.2Maltitol 17.0 13.4 13.0 11.5Mannitol 16.7 12.3 8.1 6.3Polyglycitol 17.1 13.5 13.2 11.6Sorbitol 16.7 12.0 11.7 9.7Xylitol 17.0 14.0 13.7 12.4
Abbreviations: cIE, combustible intake of energy; DE, digestible energy; ME,
metabolizable energy; NME, net metabolizable energy; NSP, non-starch
polysaccharides.aBased on Livesey (2003a). The values for macronutrients have also been
reported in Livesey (2001), with some trivial differences in the values for
protein and alcohol. For available carbohydrates, see also Livesey and Elia
(1988) and Elia and Livesey (1992). For fibre see text.bAvailable carbohydrate (as monosaccharide equivalents) measured by direct
analysis of sugars. When carbohydrate is measured ‘by difference’, the values
increase by 1 kJ/g.
Physiological aspects of energy metabolismM Elia and JH Cummings
S48
European Journal of Clinical Nutrition
The classic energy balance technique involves measure-
ments of both total energy expenditure, using calorimetry
(whole-body calorimetry) or tracer techniques (the doubly
labelled water technique (Prentice, 1990) or the bicarbonate–
urea method (Elia et al., 1995; Gibney et al., 1996, 2003;
Paton et al., 1996, 2001; Tang et al., 2002; Elia, 2005) and
energy intake.
The energy balance equation can be considered in terms of
combustible energy or ME.
(i) Energy balance (combustible energy): cEstored¼ cIE–
heat–cEnergy losses where cEnergy losses are the
combined losses through faeces urine, body surfaces
and gases (cFEþ cUEþ cSAþ cGaE). cIE can be measured
using bomb calorimetry, but can also be estimated
(Table 3).
(ii) Energy balance (ME): MEstored¼ME intake–heat
Since the following two equations apply,
ME stored ¼NME=kstored
ME intake ¼ME intake=kintakeðdietÞ
the energy balance equation can also be expressed in relation
to NME.
Energy balance (NME): NME/kstored¼ME intake/kintake(diet)–heat
In these equations, the heat released (energy expenditure)
is again measured by calorimetry in controlled laboratory
conditions or by tracer techniques in free-living conditions.
ME intake in this situation is obviously calculated from the
exogenous food energy values (Table 4). Parenthetically, it
should be noted that in short-term studies involving
external work, not all of the heat produced is lost from the
body (some is transiently retained in the body, causing an
increase in body temperature).
Energy systems and food labelling
Food energy systems have evolved over time, as fundamental
physiology of macronutrient metabolism was reviewed. For
example, a value of 17 kJ/g (Atwater general factor) was
assigned to the ME for total carbohydrate including ‘fibre’ (or
unavailable carbohydrate) (this system also assigns values of
17 and 37 kJ/g of protein and fat, respectively) (Merill and
Watt, 1973). There are physiological objections to this: not
all carbohydrate that reaches the colon is fermented (some is
excreted unchanged in faeces); some is converted to
substances, such as combustible bacterial biomass in faecal
matter and combustible gases, which are lost from the body.
Therefore, more appropriate ME values for ‘fibre’/NSP have
been established (for example, ME of 7.7 kJ/g for that present
in conventional foods (see section on Digestible energy),
which can be rounded to 8 kJ/g and NME of 6 kJ/g). The same
evolution of thought occurred with polyols. Regulatory
agencies assigned a value of 17 kJ/g to polyols (as for other
carbohydrates) because none was recovered in faeces.
However, this did not agree with energy balance studies.
Basic physiological considerations (confirmed by experi-
mental studies) suggest that fermentation of polyols results
in some loss of energy in faeces and gaseous products (as
with ‘fibre’). In addition, absorbed polyols are frequently lost
in substantial quantities in urine. After further consultations
within the European Union, polyols were assigned a general
energy value of 10 kJ/g (European Communities, 1990).
However, because of the variability in ME values for different
polyols, European countries (for example, The Netherlands,
France) as well as non-European countries (for example, the
United States, Canada, New Zealand and Japan) have
adopted or recommended a specific value for each polyol.
An FAO consultation suggested that where one polyol
represents a substantial source of energy in a product, use
of a more specific factor may be desirable (FAO, 2003).
Three food energy systems have been widely promoted for
use in food tables and for food labelling in different world
regions: those that employ the Atwater-specific factors
(Merill and Watt, 1973); those that employ the Atwater
general factors (Merill and Watt, 1973; FAO/WHO/UNU,
1985) (17, 17, 37 kJ/g for carbohydrate, protein and fat,
respectively); and those that employ NME factors (typically
applied to polyols). The use of all these systems is a source of
confusion, especially when factors from different systems are
used in the same country. A further source of confusion is
that in some countries, energy is expressed in relation to
weight of carbohydrate, and in others in relation to weight
of monosaccharide equivalents (B11% difference in the case
of starch). There is also the issue of accuracy. A particular
problem with the Atwater general system (Merill and Watt,
1973) is that it appears to overestimate the energy values of
specific food items, to the extent of 0–30%. The bias is
Table 4 cE, ME and NME, and content of macronutrients in food and inbody stores
‘Food’ energy Body storesa
cE kJ/g ME kJ/g NME kJ/g cE kJ/g ME kJ/g NME kJ/g
Fat 39.3 37.4 36.6 39.3 39.3 38.5CHOb
Available 15.7 15.7 15.7 15.7 15.7 15.9c
Unavailable 17.0 7.7 5.6 — — —Protein 23.6 16.8 13.4 23.6 18.4 o14.7d
Alcohol 29.6 29.0 25.8 — — —
Abbreviations: cE, combustible energy; ME, metabolizable energy; NME, net
metabolizable energy.aThe values indicated assume mobilization and oxidation of ‘stored’
macronutrients. The starting points are the body stores (which are lost during
starvation), and as such represent a departure from food energy systems.bCHO as monosaccharide equivalents.cThe value, which is higher than that of glucose, takes into account the heat of
hydrolysis of glycogen and one extra ATP gained per glucosyl residue during
oxidation of glycogen compared to oxidation of glucose.dProtein breakdown involves both ATP-independent pathways (in which case
the value of B14.7 kJ/g applies) and ATP-dependent pathways (in which case
the value o14.7 kJ/g applies).
Physiological aspects of energy metabolismM Elia and JH Cummings
S49
European Journal of Clinical Nutrition
especially marked for food items containing a high propor-
tion of ‘fibre’ and certain types of protein, both of which may
be prominent in weight-reducing diets (Brown et al., 1998). A
modification of the Atwater general system that takes into
account the presence of unavailable carbohydrate in foods
(Livesey, 1991) has the advantage of overcoming the inaccuracy
of the Atwater general system, while avoiding the complexity of
the Atwater-specific system (Merill and Watt, 1973).
Terminological and methodological issues in carbohydrate
analysis are also important, due to the varied nature of the
techniques that are in use. These are dealt with in other
papers in this consultation (for example, see Measurement of
dietary carbohydrates for food tables and labelling by Englyst
et al., 2007). All carbohydrates can be determined by direct
analysis. Carbohydrate ‘by difference’ (total carbohydrate�unavailable carbohydrate) requires assumptions about the
fate of carbohydrates in the colon that cannot always be
predicted because this will, for example in the case of
starches, be dependent on the physical form of the food,
cooking and cooling, the degree of ripeness and nature of the
starch granule. Therefore, ‘by difference methods’ should not
have a place in carbohydrate analysis. Compared to the
direct method, the indirect method (‘by difference’) has the
effect of increasing the cEI, DE, ME and NME values of
available carbohydrates by B1 kJ/g. As already suggested, the
direct analysis is preferable (FAO, 1998), although this may
pose practical problems in developing countries with poor
access to analytical facilities. Finally, it should be remem-
bered that food labelling applies to food items not diets, and
that some foods may acquire different properties and
different energy values before being ingested. For example,
starch in potato can become resistant if it is cooked and
allowed to cool before being ingested (Englyst and
Cummings, 1987). In contrast, RS changes into ordinary of
starch during the maturation of bananas, which occurs whilst
their skins turn from green to yellow. Although these processes
will affect DE, ME and NME values in different ways, food
labelling cannot adequately take them into account.
The idea that bioenergetic inefficiency results in heat
production is not new, since it was already in existence in
early part of the twentieth century. It is also well known that
agents such as 2,4-dinitrophenol, which uncouple oxidative
phosphorylation, produce a considerable amount of heat.
Therefore, measurement of energy expenditure (heat pro-
duction) does not necessarily reflect useful metabolic or
external work done. The idea of establishing bioenergetic
equivalence of different macronutrients has obvious attrac-
tions to food labelling. The NME (but not the ME) system is
based on the concept that macronutrients contribute
equivalently to energy balance and energy requirements
irrespective of food composition. The FAO acknowledges
that the Atwater-specific and general systems do not take
into account Hine, which is relevant to calculations of energy
requirements, and in the annexe of its report on food energy
(FAO, 2003), it provides two tables to address this issue
(Table 3.1 provides correction factors when ME intakes are
being matched with requirements and Table 3.2 expresses
food needs as the ‘food NME requirement’).
The current labelling of carbohydrates (and more broadly
foods in general) is unsatisfactory because the ME system is
used for some carbohydrates (usually the most abundant
carbohydrates, such as starch and sucrose), but the NME
system is used for polyols and polydextrose in many regions
(and in the same regions that use the ME system). It would
seem more logical to use the same energy system for all
carbohydrates, and indeed for all other nutrients. It has been
argued that since NME values are only B96% of ME values
(NMEB¼0.96 ME), it makes little difference which system is
used (especially since energy intake cannot generally be
assessed with an accuracy of less than 4%). On the other
hand, values for specific foods can be affected by consider-
ably more (up to 30%; for example, those rich in certain
types of protein and ‘fibre’ are used for weight reduction).
These errors may fall outside the range permitted by
legislation in the European Union (Commission, 2006). In
addition, by comparison with the NME system different diets
of the same ME value can be constructed that would result in
differences of 10–15% (for example, diets rich in NSP or
protein, as for example energy-restricted diets in which
normal protein intake represents a high proportion of
energy). Therefore, it would seem sensible to use a consistent
method that is sound at all levels, so that the consumer, the
nutritionist and the researcher are not misled. In addition, it
should be remembered that physiological considerations
that make a difference of only a few percent have already
been taken into account in devising food energy systems, for
example DE of the diet is greater than ME by a few percent,
which is similar to the extent to which ME is greater than
NME. Furthermore, as indicated above, early inaccuracies in
energy values for ‘fibre’/NSP and polyols have been
corrected, even though the changes make only a few percent
difference to the total energy value of the diet. An early
example of implementing small changes involves the At-
water energy factors that replaced the earlier Rubner factors,
for example 2.5% difference for combustible energy of
carbohydrate. Another argument is that errors associated
with measurement of dietary intake and potential errors
associated with the development of RS after cooking are
sources of greater error than the use of the ME system instead
of the NME system. This poses a problem for analysts and
those compiling food composition tables, However, it is
reasonable to suggest that food-labelling policy should aim
to establish a system that avoids bias as far as possible using a
practical user-friendly system. It has also been argued that an
enormous amount of work would have to be undertaken to
change the current ME system into an NME system. On the
other hand, if an attempt is to be made to establish either a
consistent ME or an NME system, some changes will be
necessary. If this involves conversion to a consistent NME
system, the additional changes may not be as great
as anticipated, as the following three equations (round
numbers) indicate.
Physiological aspects of energy metabolismM Elia and JH Cummings
S50
European Journal of Clinical Nutrition

ME (Atwater general system) (Merill and Watt, 1973)¼37Fþ 17CHOtotalþ17P.
ME (modified Atwater general system) (Livesey, 1991)¼37Fþ 16CHOavailable*þ8CHOunavailableþ17P.
NME (Livesey, 2001)¼37Fþ 16CHOavailable*þ6CHOunavailableþ13P.
In these equations, ME and NME are in kJ, the coefficients
are in kJ/g, and F, P and CHO are in g of fat, protein and
carbohydrate, which may be available or unavailable (*¼ as
monosaccharide equivalents).
The key issues are the extent to which the underlying
physiological considerations are sound, the extent to which
they should drive food-labelling policy and the extent to
which food energy system(s) should become consistent
within and between regional jurisdictions.
Carbohydrates, feeding behaviour and energybalance
The above discussion regarding energy values of carbo-
hydrates and energy balance equations gives no indication
about physiological processes that control voluntary food
intake and energy expenditure in different environments.
Do carbohydrates play a special role in processes that affect
energy balance? Many theories of appetite regulation and
energy homeostasis have been proposed, with carbohydrates
playing a key role in several of them. None of these theories
are universally accepted. Some have evolved over time and a
few are continuing to do so. The literature is vast, and
therefore only a brief overview of certain aspects of
carbohydrates physiology will be discussed in this paper.
Since there seems to be so much confusion and conflicting
advice being given to the consumer about the types of foods
that should be used for weight control and energy home-
ostasis, the origins of some concepts and the mechanisms
involved are also discussed. This provides a platform for
considering future research. It is worth emphasizing that
despite the widespread use of a large number of diets that
vary in macronutrient composition, there is continued
growth of obesity and overweight. If a diet was associated
with long-term compliance and overwhelmingly successful
reduction in weight, a decrease in the prevalence of
overweight and obesity might be expected. Several rando-
mized and non-randomized controlled trials have reported
weight reduction over several months when low fat (high-
carbohydrate diets) are used. A review of four separate meta-
analyses of low-fat vs control diets (or the relationship
between the fat content of the diet and weight loss) (Astrup
et al., 2002) reported greater weight loss with the low-fat
diets, and one meta-analysis reported a dose–response
relationship between reduction in percent dietary fat intake
and weight loss. And yet, these results raise a conundrum,
firstly because the meta-analyses consistently show weight
loss (generally only slight to modest mean weight loss of
B2–3 kg), whereas in the general population there is
progressive weight gain; and secondly because the percent
fat intake in the United Kingdom (Henderson et al., 2003)
and the United States (Centres for Disease Control and
Prevention (CDC), 2004) appears to have decreased in recent
years, while obesity and overweight have increased. Several
questions arise from these simple observations. Would the
growth of obesity have been greater if there was no decrease
in the percent fat intake? Is the study population represen-
tative of the general population (for example, one meta-
analysis included separate studies of patients with breast
dysplasia, breast cancer and hypercholesterolaemia (Astrup
et al., 2000))? Are confounding variables such as physical
activity adequately controlled for? Is the dietary compliance
under the study conditions of randomized controlled trials
better than non-study conditions? If the studies had been
extended over longer periods, would there have been a
decrease in dietary compliance (for example, one systematic
review included studies that lasted for only 3 weeks; Yu-Poth
et al., 1999)? Are the effects of these diets mediated by energy
density rather than macronutrient composition (low-fat
diets, especially those rich in fibre tend to have a low-energy
density)? Do the types of carbohydrates used in the diets of
studies carried out over the past 20 or more years reflect
those currently ingested (for example, carbohydrates in soft
drinks and other food items have changed over time)? This
section examines some of these issues from a physiological
perspective, focusing on appetite regulation. It is of course
recognized that there is considerable scope for interaction
between feeding behaviour and other confounding factors
that affect energy expenditure. This section does not aim to
provide a detailed summary of the effectiveness or advan-
tages and disadvantages of the large number of popular
weight-reducing diets (reviewed elsewhere; Freedman et al.,
2001), some of which may suit certain individuals more than
others. It primarily aims to establish some links between
physiology and clinical/public health nutrition, through
examination of feeding behaviour, which has a key role in
energy homeostasis. To do this, it is first necessary to place
the scientific issues in perspective by considering the extent
to which energy balance is regulated in man.
The extent to which energy balance is regulated
Figure 3 shows that the cumulative energy intakes of a
reference male and reference female, both of which were
established using the UK-recommended ME intakes (Depart-
ment of Health, 1991). The figure indicates that 231 GJ
(231 000 MJ) are ingested during a lifetime of 75 years by the
reference male, and 196 GJ (196 000 MJ) by the reference
female. Since the ME of stored fat is B39.4 MJ/kg and that of
fat-free tissue is B3.8 MJ/kg (of which o0.1 MJ/kg is in the
form of glycogen), it can be calculated that the total energy
content of a 65 kg man (15% fat) is 0.594 GJ. This
corresponds to 15.6% of the annual energy intake of a man
Physiological aspects of energy metabolismM Elia and JH Cummings
S51
European Journal of Clinical Nutrition
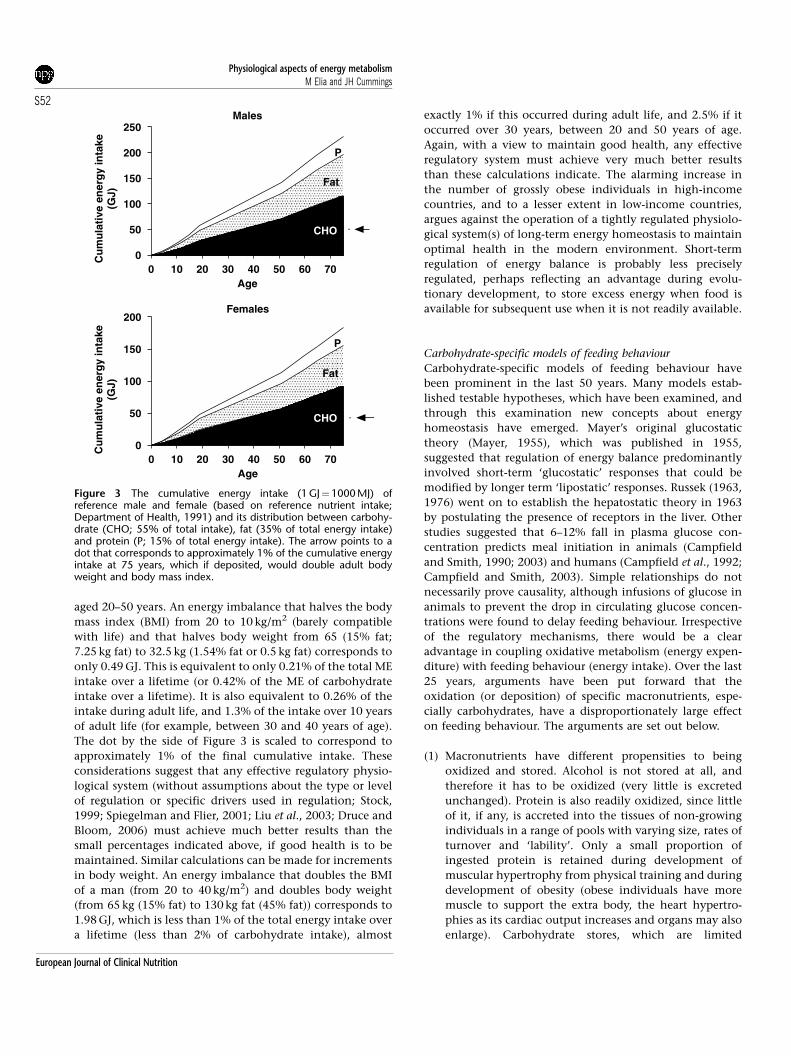
aged 20–50 years. An energy imbalance that halves the body
mass index (BMI) from 20 to 10 kg/m2 (barely compatible
with life) and that halves body weight from 65 (15% fat;
7.25 kg fat) to 32.5 kg (1.54% fat or 0.5 kg fat) corresponds to
only 0.49 GJ. This is equivalent to only 0.21% of the total ME
intake over a lifetime (or 0.42% of the ME of carbohydrate
intake over a lifetime). It is also equivalent to 0.26% of the
intake during adult life, and 1.3% of the intake over 10 years
of adult life (for example, between 30 and 40 years of age).
The dot by the side of Figure 3 is scaled to correspond to
approximately 1% of the final cumulative intake. These
considerations suggest that any effective regulatory physio-
logical system (without assumptions about the type or level
of regulation or specific drivers used in regulation; Stock,
1999; Spiegelman and Flier, 2001; Liu et al., 2003; Druce and
Bloom, 2006) must achieve much better results than the
small percentages indicated above, if good health is to be
maintained. Similar calculations can be made for increments
in body weight. An energy imbalance that doubles the BMI
of a man (from 20 to 40 kg/m2) and doubles body weight
(from 65 kg (15% fat) to 130 kg fat (45% fat)) corresponds to
1.98 GJ, which is less than 1% of the total energy intake over
a lifetime (less than 2% of carbohydrate intake), almost
exactly 1% if this occurred during adult life, and 2.5% if it
occurred over 30 years, between 20 and 50 years of age.
Again, with a view to maintain good health, any effective
regulatory system must achieve very much better results
than these calculations indicate. The alarming increase in
the number of grossly obese individuals in high-income
countries, and to a lesser extent in low-income countries,
argues against the operation of a tightly regulated physiolo-
gical system(s) of long-term energy homeostasis to maintain
optimal health in the modern environment. Short-term
regulation of energy balance is probably less precisely
regulated, perhaps reflecting an advantage during evolu-
tionary development, to store excess energy when food is
available for subsequent use when it is not readily available.
Carbohydrate-specific models of feeding behaviour
Carbohydrate-specific models of feeding behaviour have
been prominent in the last 50 years. Many models estab-
lished testable hypotheses, which have been examined, and
through this examination new concepts about energy
homeostasis have emerged. Mayer’s original glucostatic
theory (Mayer, 1955), which was published in 1955,
suggested that regulation of energy balance predominantly
involved short-term ‘glucostatic’ responses that could be
modified by longer term ‘lipostatic’ responses. Russek (1963,
1976) went on to establish the hepatostatic theory in 1963
by postulating the presence of receptors in the liver. Other
studies suggested that 6–12% fall in plasma glucose con-
centration predicts meal initiation in animals (Campfield
and Smith, 1990; 2003) and humans (Campfield et al., 1992;
Campfield and Smith, 2003). Simple relationships do not
necessarily prove causality, although infusions of glucose in
animals to prevent the drop in circulating glucose concen-
trations were found to delay feeding behaviour. Irrespective
of the regulatory mechanisms, there would be a clear
advantage in coupling oxidative metabolism (energy expen-
diture) with feeding behaviour (energy intake). Over the last
25 years, arguments have been put forward that the
oxidation (or deposition) of specific macronutrients, espe-
cially carbohydrates, have a disproportionately large effect
on feeding behaviour. The arguments are set out below.
(1) Macronutrients have different propensities to being
oxidized and stored. Alcohol is not stored at all, and
therefore it has to be oxidized (very little is excreted
unchanged). Protein is also readily oxidized, since little
of it, if any, is accreted into the tissues of non-growing
individuals in a range of pools with varying size, rates of
turnover and ‘lability’. Only a small proportion of
ingested protein is retained during development of
muscular hypertrophy from physical training and during
development of obesity (obese individuals have more
muscle to support the extra body, the heart hypertro-
phies as its cardiac output increases and organs may also
enlarge). Carbohydrate stores, which are limited
CHO
Males
0
50
100
150
200
250
.
Fat
P
Age
Cu
mu
lati
ve e
ner
gy
inta
ke(G
J)
Females
0 10 20 30 40 50 60 700
50
100
150
200
.
Fat
P
Age
Cu
mu
lati
ve e
ner
gy
inta
ke(G
J)
0 10 20 30 40 50 60 70
CHO
Figure 3 The cumulative energy intake (1 GJ¼1000 MJ) ofreference male and female (based on reference nutrient intake;Department of Health, 1991) and its distribution between carbohy-drate (CHO; 55% of total intake), fat (35% of total energy intake)and protein (P; 15% of total energy intake). The arrow points to adot that corresponds to approximately 1% of the cumulative energyintake at 75 years, which if deposited, would double adult bodyweight and body mass index.
Physiological aspects of energy metabolismM Elia and JH Cummings
S52
European Journal of Clinical Nutrition

(o0.8 kg in the adult), increase after ingestion of a mixed
meal (Elia et al., 1988), but much, if not all of the
increased store, may be mobilized for oxidative purposes
before the next meal. The increased post-prandial oxida-
tion of carbohydrate contrasts with decreased oxidation
of fat, which is the main storage form of energy
(Elia et al., 1988). Fat too can be oxidized before the next
meal, but excess energy intake over time is predomi-
nantly stored as fat, which has very large potential
storage capacity, rather than carbohydrate, which has
a limited storage capacity. Therefore, the oxidative
hierarchy of fuels (alcohol, protein, carbohydrate and
fat) is associated with the reverse hierarchy in storage,
with carbohydrates occupying a fairly central position.
(2) A number of workers have attempted to examine the
relative satiating efficiency of different macronutrients.
They reported that protein is more satiating than
carbohydrate, which in turn is more satiating than fat
(alcohol is enigmatic in that it may actually stimulate
appetite in some circumstances). This hierarchy was
reported to occur at a community level, elucidated
through surveys of dietary intake (de Castro and de
Castro, 1989; de Castro, 1991) (a limitation of such
studies is possible misreporting of dietary intake) and
also at the laboratory level (Weststrate, 1992), where
dietary intake is usually measured by the researchers. It
has also been reported to occur at the level of nutrient
balance in subjects ingesting an oral diet (Stubbs et al.,
1995b) as well as in those receiving nutrients intra-
venously (Gil et al., 1991). The results of some of the
macronutrient balance studies undertaken in metabolic
centres do not appear to be simply due to differences in
sensory cues. For example, in a study of men who were
studied on three separate occasions so that they could
receive a high carbohydrate (low fat), medium carbohy-
drate (medium fat), or low carbohydrate (high fat) diet,
differences in sensory cues (taste, smell) were minimized
by covertly manipulating the diets (Stubbs et al., 1995a).
The proportion of energy from protein was kept constant
across all diets, but the energy density decreased
progressively as proportion of energy from carbohydrate
increased. The subjects ate these covertly manipulated
diets ad libitum while in a whole body calorimeter for 7
days. Average daily balances were 2.58, 0.77 and
�0.27 MJ/day on the low-, medium- and high-carbohy-
drate diets, respectively. Carbohydrate appeared to be
more satiating than fat. It also appeared that oxidation
of carbohydrate and protein predicted the subsequent
day’s intake better than fat oxidation. The effects on
energy balance persisted through the entire 7-day period
of study, apparently without compensation as the study
progressed. Other studies suggested that protein, which
has even less ‘storage capacity’ than carbohydrate, is also
more satiating than fat, and probably also more satiating
than carbohydrate, especially when protein is ingested
in large quantities (41.2 MJ per meal) (Weststrate, 1992).
From such studies, it appeared that macronutrients such
as carbohydrate and protein, whose balance is most
tightly regulated, exerted greater suppressive effects on
subsequent energy intake than fat, the balance of which
is not so tightly regulated.
(3) If the macronutrient hierarchy in satiation parallels the
macronutrient hierarchy in oxidation (inversely with the
hierarchy in storage), as several studies suggest, the
possibility exists that the two are causally linked. In
examining this hypothesis, it is necessary to consider at
least two issues: (i) plausible mechanisms by which such
effects might be mediated and (ii) whether the macro-
nutrient hierarchy on satiety are independent of the
energy density of the diet.
Potential mechanisms by which oxidation and storage are linked
to feeding behaviour. A large number of potential mechan-
isms may be invoked in carbohydrate-specific models of
eating behaviour. A basic consideration is whether the sensor
is linked predominantly to storage of specific macronutrients
(glycogen in the case of carbohydrate) or oxidation.
Flatt (1987) suggested that glycogen exerts a strong
negative feedback on energy intake, giving rise to the
glycogenostatic model of appetite regulation. The model,
which was developed from observations in rodents, has its
attractions because changes in carbohydrate stores can occur
rapidly, from meal to meal, and are associated with changes
in carbohydrate oxidation. Therefore, the model could
provide a plausible physiological basis for feeding behaviour,
which typically involves ingestion of carbohydrate as the
major macronutrient. However, the model does not distin-
guish between liver, which is rapidly lost during starvation,
and muscle glycogen, which appears to be depleted slowly
compared to muscle rapidly depleted during fasting in which
does not appear to be rapidly lost during starvation (rodents
muscle glycogen appears to be depleted much faster during
short-term starvation than in human). In addition, several
human studies have examined the predictions of this model,
and in some circumstances they were unable to confirm
them. For example, changes in feeding behaviour induced by
dietary manipulations that change carbohydrate stores,
without necessarily altering energy balance, or vice versa,
cannot be readily explained by the glycogenostatic theory
(van Stratum et al., 1978; Shetty et al., 1994; Stubbs et al.,
1995a, 1996; Snitker et al., 1997). Some of these studies
found that oxidation of all three macronutrients are
considerably better at predicting subsequent energy intake
than carbohydrate alone (Stubbs et al., 1995b).
The putative signal(s) and sensor(s) associated with the
glycogenostatic model have also not been identified.
Another approach is to examine the effect of blocking
oxidative pathways, either individually or in combination.
Friedman and Stricker (1976) proposed a model that was
based on the balance between oxidation and storage of fuels.
They established an integrative macronutrient model of
Physiological aspects of energy metabolismM Elia and JH Cummings
S53
European Journal of Clinical Nutrition
feeding behaviour, which was consistent with pharmacolo-
gical inhibition of metabolic pathways. However, the model
does not specify the metabolic sensor(s), and therefore a
number of general questions arise. How are fuel oxidation
and/or storage detected? Can the oxidation of one fuel be
distinguished from that of another (a necessary considera-
tion in macronutrient-specific models) and how are signals
integrated to influence feeding behaviour? Another basic
issue is whether it is oxidation of fuels per se or oxidative
phosphorylation (for example, ATP (or other related sub-
stances) that is primarily responsible for feeding behaviour.
The use of drugs that uncouple oxidative phosphorylation,
causing a major increase in oxidation of nutrients without
an increase in ATP generation, could be used as tools for
addressing this last issue. Dinitrophenol administration
in humans was found to have a linear relationship with
metabolic rate and weight loss, so that at a dose of 0.5 g/day
it increased metabolic rate by about 50% and decreased body
weight by almost 1 kg/week (Tainter et al., 1935; Harper et al.,
2001). The use of dinitrophenol to treat obesity in the United
States in the 1930s (Tainter et al., 1935; Harper et al., 2001)
made some subjects very hungry during treatment. If this
were a general effect, it would suggest that oxidation of fuels
per se, was not responsible for providing feedback on energy
intake, and that oxidative phosphorylation was more likely
to be the cause. However, the information on the effects of
dinitrophenol in humans is far from clear, since some
subjects became less hungry during treatment, so that in
reality there was no consistent overall effect on appetite. It is
difficult to assess the significance of these briefly reported
observations, partly because no measurements of dietary
intake were made, and partly because dinitrophenol can
cause a range of side effects which suppress appetite (for
example, nausea, gastrointestinal symptoms, loss of taste
(especially for salt and sweet), skin rashes and a variety of
other symptoms) (Rabinowitch and Fowler, 1934; Tainter
et al., 1935; Harper et al., 2001). In addition, uncoupling
oxidative phosphorylation would not distinguish between
carbohydrates and fat because both are uncoupled by
dinotrophenol.
The effect of blocking specific oxidative pathways on
eating behaviour has also been examined. For example,
humans experience increased hunger when given 2-deoxy-
glucose (50 mg/kg body weight), which blocks glucose
oxidation by competitively inhibiting phosphohexose iso-
merase (EC 5.3.1.9), an enzyme that catalyses one of the
early steps of the glycolytic pathway (Thompson and
Campbell, 1977; Welle et al., 1980; Thompson et al., 1982).
When rats were given 2-deoxyglucose, a dose-dependent
increase in food intake was observed (Friedman and Tordoff,
1986). When rats are given methyl palmoxirate, which
blocks fat oxidation by inhibiting the transport of long-
chain fatty acids across the inner mitochondrial membrane
(necessary for mitochondrial fat oxidation), there was also
an increase in food intake (Friedman et al., 1990). Separate
sensory systems for detecting carbohydrate and fat oxidation
have been identified through investigations that have
combined surgical lesions of the nervous system and
administration of pharmacological agents that inhibit either
fat or carbohydrate oxidation (Titter and Calingasan, 1994).
Some inhibitors of glucose oxidation act both centrally in
the brain and peripherally (2-deoxyglucose), whereas others
do not penetrate the blood–brain barrier, and therefore
inhibit glucose oxidation only in peripheral tissues (for
example, 2.5-anhydro-D mannitol). Investigations using
such tools suggest that fatty acid oxidation is monitored
peripherally, whereas glucose oxidation is monitored both
peripherally and centrally. The area postrema and nucleus of
the solitary tract receive signals from both systems (the vagus
nerve relays signals from the periphery). However, lesions
that destroy the sensory but not the motor nucleus abolishes
mercaptoacetate (lipoprivic), but not the 2-deoxyglucose
(glucoprivic)-induced feeding. It is not clear to what extent
these distinct pathways, and their interactions, which have
been identified in animals (Titter and Calingasan, 1994), also
operate in humans.
Feeding behaviour and energy density. Several of the studies
that established a satiating hierarchy of macronutrients did
not control the energy density of the diet. Since high-
carbohydrate/low-fat diets tend to be less energy dense than
low-carbohydrate/high-fat diets, it is possible that energy
density rather than a macronutrient hierarchy is responsible
for many of the differential effects on satiety. If this were the
case generally, macronutrient-specific models of feeding
behaviour would decline in importance and give way to
new alternatives, but perhaps complementary models of
feeding behaviour. Few long-term physiological studies have
been undertaken to address this specific issue, but two are
noteworthy. The first is the study of van Stratum et al. (1978),
which was already published at the time when the macro-
nutrient hierarchy and glycogenostatic models of feeding
behaviour were being actively explored. It reported that
isoenergetically dense high-fat and high-carbohydrate diets
had similar effects on energy intake over 2 weeks in 22
Trappistine nuns. The second study of Stubbs et al. (1996),
involving men who were also studied over a period of 2
weeks, confirmed the results obtained on the Trappistine
nuns. Both of these studies covertly manipulated the diets to
conceal taste differences. A number of short-term studies
(Johnstone et al., 1996; Stubbs et al., 1996), including those
involving single preloads (Stubbs et al., 1996), found that
there may still be some subtle macronutrient effects that are
independent of energy density. Protein was still considered
by some workers to be more satiating than other macro-
nutrients when taken in doses of 41.2 MJ per meal
(Weststrate, 1992), although even this was challenged by a
recent short-term study with a crossover design (Raben et al.,
2003). It measured the ad libitum intake of a high-protein,
high-carbohydrate, high-fat and high-alcohol meals over a
period of 5 h in the same subjects on separate occasions. The
energy intake from the high-protein meal, which included
Physiological aspects of energy metabolismM Elia and JH Cummings
S54
European Journal of Clinical Nutrition

B1.4 MJ from protein in men, did not differ significantly
from the other meals, which had similar energy density and
‘dietary fibre’ content (although they differed in their
sensory attributes, such as taste and after taste). There was
also no difference in intake among the 10 women who
consumed B0.7 MJ of protein from the high-protein meal.
This study did not covertly manipulate the meals to conceal
taste. Nevertheless, all the above observations taken together
raise questions about the predictive value of macro-
nutrient-specific models of feeding behaviour, at least under
laboratory conditions, which may not necessarily apply to
free-living conditions, for reasons that will emerge later.
Inevitably, attention is focused on the weight and energy
density of foods, including ready-to-eat foods, which have
recently flooded the market in developed countries.
Before considering these issues further, it is worth briefly
reflecting on the likely limitations of physiological processes
controlling feeding behaviour that place disproportionate
importance on a single nutrient (for example, carbohydrate).
Such a system would regulate energy balance poorly because
it would be unable to adapt adequately to situations
associated with changes in the proportions of different
macronutrients in the food supply. Therefore, it is not
surprising that specific macronutrient models of feeding
behaviour were not found to be robust in some circum-
stances, particularly those involving covert manipulation of
diets with the same energy density but different macronu-
trient composition (see above). In addition, pharmacological
inhibition of both fat and glucose oxidation in animals were
found to elicit a massive increase in food intake, compared to
inhibition of either fat or carbohydrate oxidative pathways
(Friedman and Tordoff, 1986). This suggests that the
regulatory system is responsive to oxidation of both fat
and carbohydrate, and that oxidation of each substrate
compensates for the other, when the availability of one of
them is reduced. Therefore, eating behaviour does not
unconditionally depend on the oxidation of one nutrient,
and indeed it would be surprising if it did. Furthermore, the
satiating effect of the Eskimo diet (fat and protein) (Mowat,
1981) would argue against the operation of a simple
carbohydrate oxidation or storage model of feeding beha-
viour to the exclusion of other macronutrients.
Energy density, weight of food and carbohydrates
Several reports suggest that under ad libitum feeding condi-
tions (mainly under laboratory conditions), people tend to
consume a fixed weight or volume of food (Duncan et al.,
1983; Lissner et al., 1987; Tremblay et al., 1991; Tremblay,
1992; Poppitt, 1995; Rolls and Bell, 1999; Bell and Rolls,
2001). This implies that when foods or diets differ in energy
density, energy intake will be affected. Indeed, it has been
suggested that this is a major mechanism for determining
energy intake at different stages of the life cycle (for example,
compared to young adults, older adults reduce energy intake
by largely decreasing the energy density of the food eaten). If
satiety was mainly determined by the weight of food eaten,
then those who consume high-energy density foods would
be expected to feel satiated only after increased energy
intake, whereas those consuming low-energy density foods
would feel satiated despite lower energy intake. This
argument has been promoted by several workers (Poppitt,
1995; Poppitt and Prentice, 1996; Prentice and Poppitt, 1996;
Rolls and Bell, 1999). It is argued that in real-life energy
dense foods tend to be more palatable and less satiating than
foods with low-energy density. Typically, palatable snacks are
energy dense, and those rich in both fat and available
carbohydrates, which are rapidly digested and absorbed, are
said to be particularly palatable (Drewnowski, 1998). Inter-
estingly, available carbohydrate and fat also provide more
NME per unit ME than does the diet as a whole or either
protein or NSP or other carbohydrates fermented in the large
bowel. Therefore, when using the ME system, high-fat, high-
available carbohydrate foods (or diets) are more fattening
than isoenergetic high-protein, high-fibre foods. In addition,
foods of low-energy density (often rich in NSP and water)
were less palatable in these studies.
An examination of 1032 foods revealed that the strongest
predictors of energy density are water, which is negatively
related to energy density, and fat (g per 100 g food), which is
positively related to energy density (Stubbs et al., 2000). The
carbohydrate and protein content of foods (g per 100 g food)
are both positively related to energy density, but the
association is much weaker than those obtained with fat or
water (Figure 4). This weak relationship with carbohydrate is
understandable because it is possible for foods containing a
large proportion of energy from carbohydrate to have either
a low-energy density (for example, vegetables) or high-
energy density (some sweet snacks). Diet surveys do not
generally report the energy density of the food eaten, and
this precludes extensive analyses and interpretation of data
0 25 50 75 100
0
500
1000
1500
2000
2500
3000
3500
4000 Fat (r2=75)
Protein (r2=13.9)
Carbohydrate (r2=1.9)
Water (r2=66.7)
Weight (g/100g)
En
erg
y d
ensi
ty (k
J/10
0g)
Figure 4 Relationship between energy density (outcome variable)and % weight of dietary macronutrients and water of 1032 ready-to-eat foods (Stubbs et al., 2000). The prediction equationsare as follows: Energy density (ED)¼462.6þ (35.5� fat); ED¼781.4þ (12.2�protein); ED¼654.5þ (12.5� carbohydrate); andED¼2034–(21.2�water). The values in parentheses, derived fromregression are r2�100.
Physiological aspects of energy metabolismM Elia and JH Cummings
S55
European Journal of Clinical Nutrition
in free-living conditions. However, below is a summary of
some observations, including some in free-living conditions,
which need to be taken into account in models of
energy homeostasis in free-living conditions. The role of
different types of carbohydrates on satiety, energy intake and
energy balance are then considered in the light of these
observations.
(1) The idea that energy intake and energy balance are
largely determined by energy density or weight of food
eaten has enormous implications for the control of
feeding behaviour and energy balance, because it implies
that normally energy intake is a secondary or passive
manifestation of the drive to eat a constant weight of
food. This would not be an ideal evolutionary strategy
for survival. The energy density of the food eaten by our
ancestors is likely to have varied from a low-energy
density (berries, fruits) to high-energy density (fatty fish,
animal meat and fat), depending on location, season and
other environmental changes, including natural disas-
ters. Too much reliance on weight of food eaten, rather
than on energy eaten, would bring about poor regulation
in energy homeostasis, at least in the long term.
(2) A recent epidemiological study (Ledikwe et al., 2006)
reported that US adults consuming a low-energy-dense
diet are likely to consume more food by weight, and at
the same time less energy intake (assessed by 24 h recall)
than those consuming a higher energy-dense diet.
Normal weight individuals were found to consume diets
with a lower energy density than obese individuals, but
causality is difficult to assess from the available informa-
tion. This study is of course subject to potential problems
associated with misreporting, which are briefly discussed
below.
(3) If free-living individuals primarily eat a constant weight
of food, with energy intake as a passive outcome, then
the within-subject day-to-day coefficient of variation for
weight of food ingested would be expected to be lower
than that for energy intake. This was not found to be the
case. In an analysis of 7-day-weighed food intakes in 73
subjects, the coefficients of variation were found to be
slightly higher for weight of food ingested rather than
energy intake (23 vs 21%, respectively, or 21 vs 20.5%,
when drinks were added in the analysis) (Stubbs et al.,
2000; Stubbs and Whybrow, 2004). It would be valuable
to know the extent to which coefficients of variation of
ingested energy relative to ingested weight of food
depended on the environmental conditions. Studies to
address this issue are subject to the problem of
misreporting of dietary intake. One review concluded
that there is no accurate method of measuring dietary
intake (Westerterp and Goris, 2002). Another extensive
review (Livingstone and Black, 2003) expressed dietary
energy intake per day as a fraction of energy expenditure
measured by the doubly labelled water method. The
results for 7-day-weighed food intake were variable
according to the study. For example, in one study in
women aged 60 years, the values were 1.0770.08 (s.d.)
in unrestrained eaters and 0.9470.05 in restrained eaters
(Bathalon et al., 2000), whereas in another study
(Kaskoun et al., 1994) in 15 and 18-year-old males, the
value was 0.7770.023.
(4) Laboratory studies have been undertaken in which diets
with different energy densities are covertly manipulated
to maintain the same palatability (Titter and Calingasan,
1994). In such environments, studies suggest that a large
proportion of the variability in energy intake (440%)
can be explained by energy density of the diet (Prentice
and Poppitt, 1996; Rolls and Bell, 1999; Stubbs et al.,
2000) compared to only a much smaller proportion in
free-living conditions (for example, only 7% according
to one study; Stubbs and Whybrow, 2004). There are
several possible explanations for the discrepancy be-
tween laboratory and free-living studies. (i) It is easier to
covertly manipulate diets of different energy densities or
macronutrient composition at the lower end of the
energy density range. Studies that have varied the energy
density of foods at constant palatability (Drewnowski,
1998) have used diets containing 2.5–4.4 kJ/g and
compared them with diets containing 5.6–7.0 kJ/g. They
have not extended to the higher energy density range.
To give the readers a feel for the energy density of
specific foods that can make up diets, here are some
values: chocolate cake, hamburger and chips, which can
make up a meal, fall in the range of 12–18 kJ/g;
chocolate, decreases in the range of 22–24 kJ/g; raw
vegetables and soft drinks B2 kJ/g for; the full potential
range is from 0 (water) to B39 kJ/g (pure oil or fat). This
means that the energy density (and the variety) of foods/
diets in free-living conditions are more variable than
those predetermined (lower values) in the laboratory.
There is also some evidence that specific macronutrient
effects are more likely to exert effects at the lower end of
the energy density spectrum (Westerterp-Plantenga,
2001). (ii) Learned cues, which influence eating beha-
viour, are absent or dramatically reduced in laboratory
studies, because such studies often use foods that are
unfamiliar or covertly manipulated. (iii) Energy density
is fixed in some laboratory conditions, but not usually in
free-living conditions. (iv) Measurement of dietary
intake is likely to be more accurate under laboratory
than in free-living conditions. (iv) There appear to be a
longer-term compensatory mechanisms for the increase
in energy intake induced by ad libitum intake of high-
energy-density foods (Stubbs et al., 2004). A reduction in
the weight of food eaten appears to be an important
compensatory mechanism. (v) Some free-living studies
have reported an association between energy density of
the diet and increased intake. A recent study (de Castro,
2004) involving 952 subjects who provided 7-day food
diaries, reported such a relationship, but found no
relationship between energy density of the consumed
Physiological aspects of energy metabolismM Elia and JH Cummings
S56
European Journal of Clinical Nutrition
food and body weight, height or BMI. Since high-energy
density appears to be related to greater overall intake in
the short term, the author suggested that there may be
compensation over the long term with no net effect on
body size. An alternative possibility is that increased
activity may determine the energy density of the diet:
large volumes of bulky diets may be less acceptable to
individuals who require a lot of energy.
(5) Analyses of energy intake in free-living conditions using
multiple regression models suggest that there are multi-
ple determinants of energy intake, of which energy
density is one, and percent energy from individual
macronutrients, including carbohydrate, is another
(Stubbs and Whybrow, 2004). From this and other
works, it appears that macronutrients have effects on
energy intake that are independent of the energy density
of the food consumed. One study reported that specific
macronutrients influence intake, when foods contain
little water (high-energy density) and not when they
contain a lot of water (low-energy density) (Westerterp-
Plantenga, 2001). This could provide an explanation
why laboratory studies, which have covertly manipu-
lated diets at the lower end of the energy density range,
have a strong predictive effect on energy intake.
(6) Substitution of sugar for artificial sweeteners offers a way
of separating palatability from energy density of foods.
But even here the effects are not clear-cut. For example,
there is little epidemiological evidence to suggest that
intense sweeteners are causally linked to BMI. In
addition, most intervention studies with intense sweet-
eners are of short duration (less than 1 or 2 days, and
often only a few hours), with the exception of a few
studies, which suggested that the intense sweetener,
aspartame, reduced energy intake in metabolic units
(Porikos et al., 1977, 1982) or free-living conditions
(Tordoff and Alleva, 1990a). Some short-term studies
using drinks (Blundell and Rogers, 1994) or gum (Tordoff
and Alleva, 1990b) suggested that intense sweeteners
might actually stimulate appetite. One study found that
aspartame-sweetened water transiently increased appe-
tite in lean men, but aspartame-sweetened soft drinks
suppressed appetite (Black et al., 1993; Black and
Anderson, 1994). Other studies report that sweeteners
have the same effect as water (Rogers et al., 1988; Rodin,
1990; Canty and Chan, 1991), whereas others report
suppression of overall intake when compared with soft
drinks containing sugar (Rolls, 1997). Yet, other studies
suggest that there is an increased intake when an
unpalatable food item is made more palatable by
addition of a sweetener. Methodological problems are
at least partly responsible for the variable results
obtained. In addition, the responses to sweet foods and
drinks depend on dietary restraint (Lavin et al., 1997)
and they can be conditioned. Intense sweeteners may
mimic the ingestive effects of sugars on satiety but not
the post-ingestive effects. For example, animal studies
suggest that initial dislike for a bitter taste of a sucrose
octa acetate solution is reversed once the animals learn
to associate this taste with positive post-ingestive effects
(Sclafani, 1987, 2001). Finally, a 10-week study involving
overweight men and women, who consumed 28% of
their energy as sucrose (mostly as beverages), showed an
increase in body weight (1.6 kg), which was not observed
in a similar group of subjects who consumed artificial
sweeteners (Raben et al., 2002).Overall it appears that
intense sweeteners do not reliably affect appetite and
energy intake, but more longer term studies in free-living
conditions are required.
From the above, it appears that the control of appetite
operates through a redundant system that does not rely
overwhelmingly on one or two major factors, such as energy
density or on a specific macronutrient. Rather it depends on
multiple factors that can interact, compensate or override
each other, depending on environmental exposures and
their duration. Given the fundamental importance of eating
for survival, this is not surprising. The factors that influence
eating behaviours include sensory factors, diet composition
and variety of available food items, eating environment and
individual subject characteristics, such as age, habitual
dietary intake and prior social conditioning. It has been
difficult to establish the relative importance of these factors,
which are likely to differ with the environmental setting, for
example, developed or developing countries. However, it is
clear that feeding behaviour is influenced by both nutri-
tional and non-nutritional factors. In addition, it appears
that there is a good defence against development of under-
weight (in the absence of disease) (Garrow, 1988), but less
good defence against development of overweight (Blundell
and Stubbs, 1999), especially in an environment where the
availability of abundant and varied food is coupled with
limited physical activity. This defence needs to be very tight
because deposition if only 1% of the lifetime cumulative
energy intake were deposited in the reference male or female
(equivalent to the dot by the side of Figure 3), it would
double adult body weight and BMI, and adversely affect
health.
Effect of different types of carbohydrate on feeding behaviour and
energy homeostasis
With this background, the role of different types of
carbohydrates on eating behaviour might not be expected
to have overwhelming effects on long-term energy home-
ostasis. The following summary based on intervention
studies is generally consistent with this view.
Non-starch polysaccharides (dietary fibre). The majority of
studies comparing the effects of carbohydrates on energy
balance and weight loss have been undertaken with NSP in
various forms, probably because there are several potential
ways in which NSP might induce a negative energy balance.
Physiological aspects of energy metabolismM Elia and JH Cummings
S57
European Journal of Clinical Nutrition
The following are potential mechanisms: compared to
available carbohydrates, NSP has a lower energy density
(kJ/g; see above); foods containing NSP are often made from
whole grains or whole foods such as fruit and vegetables and
are thus bulky with a low-energy density, which may
promote satiety; some types of NSP are viscous and can
delay gastric emptying, causing feelings of increased fullness
and satiety; NSP affects the intestinal absorption of other
macronutrients, such as fat, although there is little evidence
for significant losses in this way in humans; and delayed
colonic metabolism of NSP after meal ingestion may delay
the onset of hunger before the next meal (although the
possible role of SCFAs and other potential signals from the
colon appear to have been little investigated in humans).
Results of more than 50 studies have been summarized in
several reviews (Blundell and Burley, 1987; Stevens, 1988;
Burley and Blundell, 1990; Levine and Billington, 1994), but
it is difficult to establish firm overarching conclusions that
apply to all circumstances. There are several reasons for this:
the type and amount of NSP used in different studies have
varied; the intervention has sometimes involved adminis-
tration of tablets of extracted NSP and at other times diets
rich in NSP; the age and adiposity of the study population
have varied; and study designs have varied from open trials
to double-blind control trials. Nevertheless, it appears that
dietary supplementation with extracted NSP to a level that
can be tolerated has at best a modest effect in reducing body
weight over a period of several months or longer. Bulky NSP-
rich diets with a low-energy density might be expected to
encourage weight loss, or prevent weight gain, by promoting
satiety, but such diets are often less palatable and less likely
to be consumed. Better modelling techniques of the avail-
able data, including dose–response curves (for example,
studied by meta-regression), may shed further light on
possible effects of NSP on energy intake and body weight.
Starch and sugars. A few short-term preload studies have
examined the effects of different types of hexose-based
sugars on appetite and found little difference between them.
Comparisons between sugars and high glycaemic index (GI)
starches using short-term preloading protocols or 7-day
protocols (Mazlam, 2001) suggest no major differences in
satiety. However, a study comparing a high-starch diet with a
high-sucrose diet found that the ad libitum intake over 14
days was lower and weight loss greater with the high-starch
diet than the high-sucrose diet, which scored better on
palatability (Raben et al., 1997). Another study (Raben et al.,
1994) found that exchange of digestible starch for RS in a
meal reduced satiety as well as post-prandial glycaemia and
insulinaemia. The authors acknowledged that the differences
in satiety may be due to texture and palatability of the meal,
but it can be difficult to separate the sensory properties of
diets from their macronutrient composition. However, it
appears from other studies that sensory-specific satiety is
related more to the sensory characteristics of a food than to
its macronutrient composition (Johnson and Vickers, 1993).
As indicated in section above, energy density (see section
Energy density, weight of food and carbohydrates) is also a
potentially confounding variable. There is a lack of long-
term studies. The CARMEN multicentre trial (Saris et al.,
2000) compared the effects of ad libitum intake of low-fat
diets rich in either complex carbohydrates or simple
carbohydrates. Body weight loss in the low-fat simple
carbohydrate and low-fat complex carbohydrate groups did
not differ significantly (0.9 and 1.8 kg, respectively). There
were also no significant differences in circulating lipids.
Since the distribution of complex carbohydrate between
starch and NSP was not reported, it is not possible to assess
the effects of starch vs sugars. Therefore, it appears that there
is lack of convincing evidence from long-term studies that
starch offers advantages over sugars in weight reduction.
Polyols. There appears to be little information on the effect
of polyols relative to other carbohydrates on weight loss or
on satiety and other appetite sensations. One study found
that replacement of sucrose with increasing doses of isomalt
(12, 24 and 48 g per day), which is mostly unavailable
carbohydrate, resulted in weight loss of about 2 kg over a
period of 12 weeks (Spengler and Boehme, 1984).
Low vs high glycaemic index (GI carbohydrates, foods and
diets). Numerous reports have examined the role of differ-
ent carbohydrates, foods and diets with varying GI on
appetite and satiety (Raben et al., 1994; Anderson et al., 2002;
Kaplan and Greenwood, 2002; Anderson and Woodend,
2003; Ball et al., 2003), and weight control (Pawlak et al.,
2002; Raben, 2002; Ludwig, 2003; Warren et al., 2003). The
overall results do not appear to be consistent, although
many short-term studies (o1 day) suggest that low-GI
carbohydrates and foods promote satiety. One review
concluded that short-term feeding trials generally show an
inverse association between GI and satiety, and medium-
term clinical trials show less weight loss on high-GI (or high
glycaemic load) diets compared to low-GI (or low glycaemic
load) diets (Pawlak et al., 2002). However, the differences in
weight between control and intervention groups were small.
Another review (Pawlak et al., 2002) (presented as part of a
debate) systematically examined 31 short-term studies (o1
day) and reported that in 15 of these, low-GI foods promoted
satiety or reduced hunger, and in the remaining 16 low-GI
foods either reduced or made no difference to satiety. Low-GI
foods reduced ad libitum food intake in seven studies, but did
not do so in eight other studies. The same systematic review
examined results from 20 longer term studies (up to 6
months). Weight loss was favoured by the low-GI diets in
four studies, by the high-GI diets in two studies and there
was no significant difference between the low and high-GI
diets in the remaining 14 studies. The average weight loss
was only 1.5 kg on the low-GI diets and 1.6 kg on the high-GI
diets. Not surprisingly, the author concluded that there was
no evidence that low-GI foods were superior to high-GI
foods for long-term weight control. The overall differences in
Physiological aspects of energy metabolismM Elia and JH Cummings
S58
European Journal of Clinical Nutrition

results may relate not only to the duration of the studies, but
also to the energy density and sensory attributes of foods or
diets, as well as the age of subjects, which has ranged from
the young age of pre-pubertal children (Warren et al., 2003)
to that of elderly people . The sensory attributes of foods are
particularly important in free-living studies, because poorly
palatable diets are likely to be associated with poor
compliance. The obligatory ingestion of a diet or a meal
when used as a preload under short-term laboratory condi-
tions may well produce different results when the same diet
is promoted for longer term use under free-living conditions.
Ingestion of such a diet is not obligatory in free-living
conditions, and therefore a diet may show efficacy in
laboratory conditions but not effectiveness in free-living
conditions. In addition, a recent study (Alfenas and Mattes,
2005) examined the effect of consuming only low- or high-
GI foods ad libitum in the laboratory for 8 days in either high
(three foods per meal) or low (one food per meal) variety
conditions. It appeared that differential appetite sensations
and glycaemic responses to foods tested in isolation were not
preserved under conditions of longer term ad libitum
ingestion of mixed meals. The potential interactions
between different foods are much greater in free-living
conditions than in laboratory conditions. In summary, the
evidence suggesting that low-GI foods favour weight loss is
stronger in short-term than in long-tem studies. It would be
valuable to examine dose–response curves, especially in the
long term, partly because there are fewer long-term studies,
and partly because they are more relevant to health.
Liquid vs solid carbohydrates. Several papers and reviews
(Mattes, 1996, 2006; DiMeglio and Mattes, 2000) suggest
that supplemental energy provided as carbohydrates in fluids
is less precisely compensated than when solid foods are
manipulated. The reasons for the difference in energy
compensation are not clear but may involve the rate at
which these are ingested (liquids can be ingested several
times more rapidly than solid food items), their energy
density and sensory attributes, and gastric emptying rates,
which are generally faster for liquids than solids. Reactive
hypoglycaemia may also be implicated. One short-term
study lasting a few hours examined the effect of ingesting
the same quantity of available carbohydrate at the same rate
in the form of an apple, puree apple or juice without the cell
wall material or ‘fibre’. The juice was less satiating than the
puree, which in turn was less satiating than the apple. These
changes were associated with greater insulin responses,
which peaked at 30 min (juice4puree4apple) and a greater
subsequent rebound hypoglycaemia (also juice4puree4apple) from similar peak glucose concentrations (measured
in venous rather than arterial blood, which could confound
interpretation) (Haber et al., 1977). There are few long-term
studies, but in 1958 Fryer (Fryer, 1958) reported the effects of
supplementing the diet of 20 college students for 2 months
with a carbohydrate-rich drink (1.8 MJ/day). Dietary com-
pensation for the extra liquid energy intake was only about
half complete by 2 months. Other studies (observational or
epidemiological) have shown that the compensation that
does occur displaces the intake of protein and micronu-
trients from the diet, the full significance of which is still
somewhat uncertain. The above intervention trials are
complemented by epidemiological studies, such as the
Nurses’ Health Study II in the United States (Schulze et al.,
2004), which reported that higher consumption of sugar-
sweetened beverages is associated with greater weight gain
(4–5 kg over 4 years in those who increased consumption
from one or fewer drinks per week to one or more drinks per
day) and greater risk of type II diabetes. Conversely, weight
gain was smaller among women who decreased their intake
of sugar-sweetened drinks (0–1.5 kg over 4-year periods).
Epidemiological studies in children (for example, US Grow-
ing Up Today Study; Berkey et al., 2004) also show a link
between sugar-added beverages and weight gain. The link
between soft drinks and childhood obesity has been
reviewed recently (James and Kerr, 2005). Finally, a long-
term intervention trial in England (The Christchurch obesity
prevention project in schools (CHOPPS); James et al., 2004)
reported that the results of a cluster randomized control trial
involving 644 children aged 7–11 years. A focused educa-
tional program at school over a year reported the average 3-
day consumption of carbonated drinks decreased by 0.6
glasses (average glass size 250 ml) in the intervention group
and increased by 0.2 glasses in the control group, with the
result that in the percentage of overweight and obese
children at the end of the year increased by 7.5% in the
control group and decreased by 0.2% in the intervention
group. In summary, there is epidemiological, physiological
evidence, as well as interventional evidence linking sugar-
sweetened beverages and weight gain.
The need to expand the physiological evidence base
The early growth of the obesity epidemic in developed
countries some 30 years ago was associated with ingestion of
high-fat, low-carbohydrate diets. Many workers felt that the
macronutrient composition of the diets had a large part to
play in this, and physiological studies that varied the
carbohydrate to fat ratios (without controlling for
energy density or GI) in laboratory studies were consistent
with this notion. However, the recent trend in many
developed countries, such as the United States (Centres
for Disease Control and Prevention (CDC), 2004) and
the United Kingdom (Henderson et al., 2003), for a
decrease in the proportion of dietary energy from fat
and an increase from carbohydrate, has not prevented
the growth in obesity and overweight, which has continued
to rise unabated. It is possible that without this change
an even greater rise would have occurred. These trends
have also been associated with exposure to an increased
variety of foods and drinks containing different types of
carbohydrates, carbohydrate combinations, sweeteners
and sweet-bulking agents. Advances in technology can
Physiological aspects of energy metabolismM Elia and JH Cummings
S59
European Journal of Clinical Nutrition
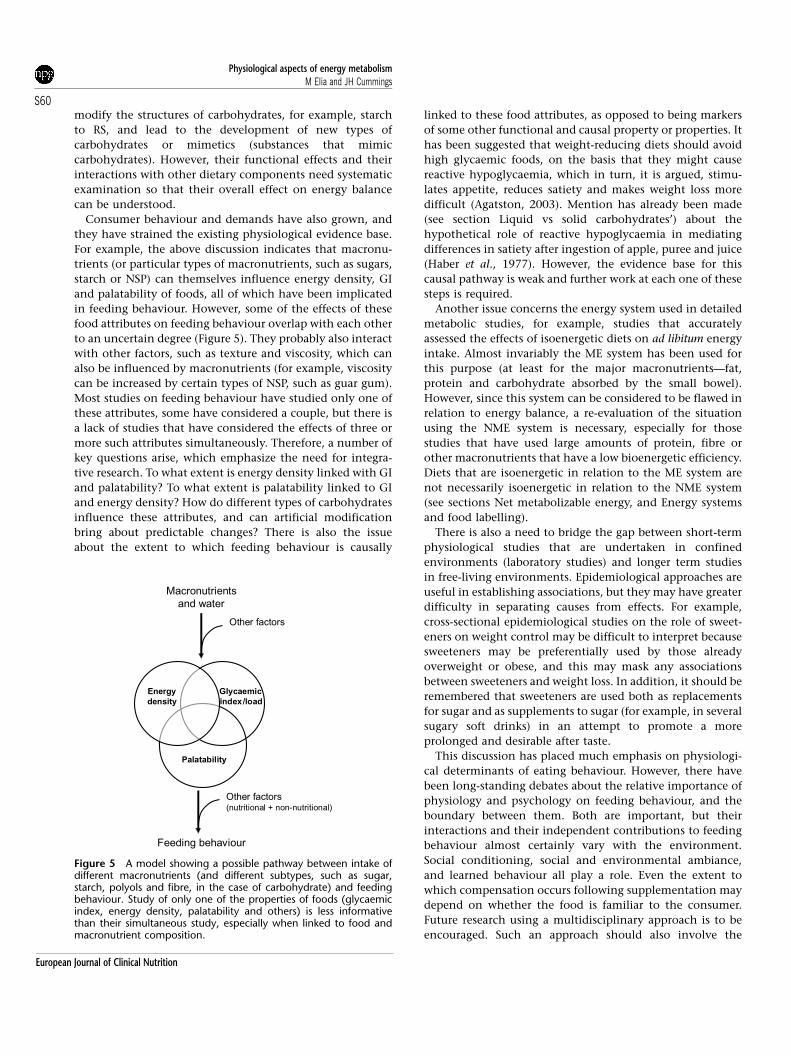
modify the structures of carbohydrates, for example, starch
to RS, and lead to the development of new types of
carbohydrates or mimetics (substances that mimic
carbohydrates). However, their functional effects and their
interactions with other dietary components need systematic
examination so that their overall effect on energy balance
can be understood.
Consumer behaviour and demands have also grown, and
they have strained the existing physiological evidence base.
For example, the above discussion indicates that macronu-
trients (or particular types of macronutrients, such as sugars,
starch or NSP) can themselves influence energy density, GI
and palatability of foods, all of which have been implicated
in feeding behaviour. However, some of the effects of these
food attributes on feeding behaviour overlap with each other
to an uncertain degree (Figure 5). They probably also interact
with other factors, such as texture and viscosity, which can
also be influenced by macronutrients (for example, viscosity
can be increased by certain types of NSP, such as guar gum).
Most studies on feeding behaviour have studied only one of
these attributes, some have considered a couple, but there is
a lack of studies that have considered the effects of three or
more such attributes simultaneously. Therefore, a number of
key questions arise, which emphasize the need for integra-
tive research. To what extent is energy density linked with GI
and palatability? To what extent is palatability linked to GI
and energy density? How do different types of carbohydrates
influence these attributes, and can artificial modification
bring about predictable changes? There is also the issue
about the extent to which feeding behaviour is causally
linked to these food attributes, as opposed to being markers
of some other functional and causal property or properties. It
has been suggested that weight-reducing diets should avoid
high glycaemic foods, on the basis that they might cause
reactive hypoglycaemia, which in turn, it is argued, stimu-
lates appetite, reduces satiety and makes weight loss more
difficult (Agatston, 2003). Mention has already been made
(see section Liquid vs solid carbohydrates’) about the
hypothetical role of reactive hypoglycaemia in mediating
differences in satiety after ingestion of apple, puree and juice
(Haber et al., 1977). However, the evidence base for this
causal pathway is weak and further work at each one of these
steps is required.
Another issue concerns the energy system used in detailed
metabolic studies, for example, studies that accurately
assessed the effects of isoenergetic diets on ad libitum energy
intake. Almost invariably the ME system has been used for
this purpose (at least for the major macronutrients—fat,
protein and carbohydrate absorbed by the small bowel).
However, since this system can be considered to be flawed in
relation to energy balance, a re-evaluation of the situation
using the NME system is necessary, especially for those
studies that have used large amounts of protein, fibre or
other macronutrients that have a low bioenergetic efficiency.
Diets that are isoenergetic in relation to the ME system are
not necessarily isoenergetic in relation to the NME system
(see sections Net metabolizable energy, and Energy systems
and food labelling).
There is also a need to bridge the gap between short-term
physiological studies that are undertaken in confined
environments (laboratory studies) and longer term studies
in free-living environments. Epidemiological approaches are
useful in establishing associations, but they may have greater
difficulty in separating causes from effects. For example,
cross-sectional epidemiological studies on the role of sweet-
eners on weight control may be difficult to interpret because
sweeteners may be preferentially used by those already
overweight or obese, and this may mask any associations
between sweeteners and weight loss. In addition, it should be
remembered that sweeteners are used both as replacements
for sugar and as supplements to sugar (for example, in several
sugary soft drinks) in an attempt to promote a more
prolonged and desirable after taste.
This discussion has placed much emphasis on physiologi-
cal determinants of eating behaviour. However, there have
been long-standing debates about the relative importance of
physiology and psychology on feeding behaviour, and the
boundary between them. Both are important, but their
interactions and their independent contributions to feeding
behaviour almost certainly vary with the environment.
Social conditioning, social and environmental ambiance,
and learned behaviour all play a role. Even the extent to
which compensation occurs following supplementation may
depend on whether the food is familiar to the consumer.
Future research using a multidisciplinary approach is to be
encouraged. Such an approach should also involve the
Feeding behaviour
Macronutrients
and water
Energy
density
Palatability
Glycaemic
index/load
Other factors (nutritional + non-nutritional)
Other factors
Figure 5 A model showing a possible pathway between intake ofdifferent macronutrients (and different subtypes, such as sugar,starch, polyols and fibre, in the case of carbohydrate) and feedingbehaviour. Study of only one of the properties of foods (glycaemicindex, energy density, palatability and others) is less informativethan their simultaneous study, especially when linked to food andmacronutrient composition.
Physiological aspects of energy metabolismM Elia and JH Cummings
S60
European Journal of Clinical Nutrition
ecologist, who is pre-occupied with why animals evolved
with the behavioural programmes that control food intake.
In contrast, the physiologist is pre-occupied with more
immediate determinants of feeding behaviour. Both can
provide important insights into mechanisms of eating
behaviour and possible ways for combating over- and
undernutrition.
Requirements for dietary carbohydrate
Using the brain’s requirement of glucose as a basis for
considering carbohydrate requirements, the Institute of
Medicine has estimated the average requirement to be
100 g/day, and the Recommended Dietary Allowance to be
130 g/day day, for both men and women aged 19 years and
above (Institute of Medicine, 2005). Estimated average
requirement typically represents only 10–20% of total energy
requirements, which vary according to weight and physical
activity (FAO/WHO/UNU Expert Consultation, 2004). How-
ever, high-fat, high-protein diets are not considered healthy
and many national and international bodies have set limits
and ranges for carbohydrate intake based mainly on supply-
ing energy needs for the individual that would not be
supplied by recommended amounts of fat and protein. In its
report ‘Diet and Prevention of Chronic Diseases’, WHO/FAO
recommended that carbohydrate provides 55–75% of total
energy (WHO, 2003). The upper limit is thought to allow
adequate protein and fat intake, whereas the lower limit
allows a maximum energy intake from fat of 30% and
protein of 15%.
The partial replacement of carbohydrate with monoun-
saturated fats in diabetic diets has been seen to be
beneficial (Garg, 1998). This has motivated European and
UK diabetes associations to implement this advice for people
with diabetes (Diabetes and Nutrition Study Group of
European Association for the Study of Diabetes, 2000;
Connor et al., 2003). They recommend that 40–60% of total
energy should come from carbohydrate, and that carbohy-
drate plus monounsaturated fat should provide 60–70% of
energy. This allows 20% of energy to come from mono-
unsaturates.
WHO/FAO, and other bodies, also suggest that there
should be a limit on the intake of free sugars at o10% of
energy. This arises from the relation of sugar to dental caries,
an increasing problem in the developing world, and that
FAO/WHO ‘considered that studies showing no effect of free
sugars on excess weight have significant limitations’ (Nishi-
da et al., 2004). The 10% figure is given as a maximum, and
one would expect therefore that sugar intakes on average
would be less than this for populations as a whole.
Carbohydrate and physical performance
Carbohydrate feeding both before and during exercise can
improve performance through a variety of mechanisms
(Jeukendrup, 2004).
Carbohydrates in the large bowel
Quantitative aspects
The principal carbohydrates that reach the human large
bowel are the NSP, RS, non-a-glucan oligosaccharides (short-
chain carbohydrates), and some polyols and modified
starches. In many populations of the world, there is primary
low lactase activity in the small bowel.
The amount of these carbohydrates that arrive in the
caecum is difficult to calculate because dietary intakes of
most, except NSP, are largely unknown. NSP in the diet in
European countries is between 11 and 33 g/day (Cummings
and Frolich, 1993; Bingham et al., 2003) and all of this will
reach the colon. Intakes of NSP in Mexicans are reported
as 22 and 17 g/day in rural men and women, and 18 and
16 g/day in urban men and women (Sanchez-Catillo et al.,
1997). In a West African village, intakes (corrected to 100%
energy intake) were in the range of 25–28 g/day for men and
21–24 g/day for women, and 10–13 g/day in children of
unspecified age, but sharing meals with adults (Hudson and
Englyst, 1993). Other data, reported by Cassidy et al. (1994)
give NSP intakes for Australia of 12–13g/day, India 15–21 g/day,
Ireland 9–11 g/day, Japan 11 g/day and the United States
12–17 g/day. Higher intakes may occur in vegetarians and
populations with high intakes of fruit and vegetables such as
some Pacific Islanders.
Resistant starch intakes are much more difficult to
determine. This is because almost any handling of starchy
foods from diet collections, that is mixing with water,
heating, homogenization, freezing or cooling, will affect RS
content. Present estimates for countries with westernized
diets are in the range of 3–10 g/day (Champ et al., 2003;
Goldring, 2004). Clearly this is very diet dependent. A couple
of relatively unripe bananas will readily provide 20 g RS. A
single biscuit made with potato flour would give 10 g.
Estimates for developing countries for RS intakes are 9–10
to 30–40 g/day where starch intakes are high (Stephen et al.,
1995). The amount of RS that escapes digestion also varies
between people, partly dependent on transit time through
the small bowel (Stephen et al., 1983; Silvester et al., 1995).
Modified starches are also likely to reach the colon because
of their ether and ester bonds or increased cross-linking and
substitutions. These starches are used in small amounts by
the food industry for their functional properties and intakes
are unlikely to be more than 2–3 g/day.
Almost no data have been reported of intakes of the non-a-
glucan oligosaccharides or short-chain carbohydrates. Fruc-
tooligosaccharide and inulin intakes were estimated at
between 1 and 10 g/day in European countries by Van Loo
et al. (1995), but one must add to this the other oligosac-
charides in beans, peas, non-wheat cereals and milk. Again, a
meal containing 100 g of Jerusalem artichokes would provide
16–20 g of inulin, and babies living on breast milk will be
getting 15 g/l of oligosaccharides (Miller and McVeagh,
1999). Average oligosaccharide intakes for westernized diets
could, therefore, be in excess of 10 g/day.
Physiological aspects of energy metabolismM Elia and JH Cummings
S61
European Journal of Clinical Nutrition

Polyols, such as lactitol, isomalt, maltitol, sorbitol,
manitol, erythritol and xylitol, are mostly used as low-
calorie substitutes for sugar in foodstuffs and confectionary.
Daily intake of these carbohydrates is unknown but is likely
to average only 2–3 g. However, people selecting sugar-free
products including diabetics and those trying to lose weight
may easily consume 20 g/day, so variation in intakes may
well be great. Intakes are limited because of gastrointestinal
intolerance (Lee et al., 2001). Even when intakes are known,
the amount of these carbohydrates reaching the colon is
difficult to calculate because their absorption varies between
2 and 90%, whereas some, such as erythritol, are almost
completely excreted by kidney (Livesey, 2003b).
Overall, therefore, carbohydrate reaching the colon in people
on westernized diets is probably in the range of 20–40g/day,
whereas in countries with high cereal intakes or higher intakes
of fruit and vegetables, this could reach 50 g/day.
Virtually, all carbohydrate that enters the large bowel will
be fermented by the commensal bacteria that live in the
colon at densities of up to 1012/g. The extensive fermenta-
tion of NSP has been known for many years (Cummings,
1981), while recovery of oligosaccharides from faeces is
effectively nil (Cummings et al., 2001). Similar data are also
available for RS with only very resistant retrograded starches
partly surviving, the amount depending on colonic transit
time, although occasional individuals are unable to digest
some RS fractions (Cummings et al., 1996). Microcrystalline
cellulose may resist fermentation because of its highly
condensed structure, an observation that led to the belief
that cellulose was not digested in the human gut. This is
because microcrystalline cellulose was used in many early
experiments of cellulose digestion. However, cellulose
naturally present in the cell wall of food is completely
fermented unless in association with large amounts of lignin.
Other polysaccharides of the plant cell wall are also readily
fermented, even when given in purified forms such as pectin
or guar gum. This process is facilitated by the ability of these
latter substances to form gels readily accessible to the
microbiota.
Fermentation
Fermentation is an anaerobic process and, therefore, pro-
duces unique end products. These include principally the
SCFAs acetate, propionate and butyrate (Cummings, 1995;
Cummings et al., 1995). They are rapidly absorbed. Butyrate
is the major energy source for the colonic epithelial cell, in
contrast to glutamine for the small bowel and glucose for
most other tissues. Butyrate also has differentiating proper-
ties in the cell, arresting cell division through its ability to
regulate gene expression (Siavoshian et al., 2000). This
property provides a credible link between the dietary intake
of fermented carbohydrates, such as NSP, and protection
against colorectal cancer (Bingham et al., 2003).
Propionate is absorbed and passes to the liver where it is
taken up and metabolized aerobically. This molecule is not
seen as having significant regulatory properties in humans,
although it may moderate hepatic lipid metabolism (Todesco
et al., 1991; Stephen, 1993). However, in ruminant animals,
propionate is crucial to life because it is used to synthesize
glucose in the liver.
Acetate is the major SCFA produced in all types of
fermentation, the molar ratio of acetate:propionate:butyrate
is around 60:20:20. Acetate is rapidly absorbed, stimulating
sodium absorption and passes to the liver and then into the
blood from where it is available as an energy source. Fasting
blood acetate levels are about 50 mmol/l, rising 8–12 h later to
100–300 mmol/l after meals containing fermentable carbohy-
drate. Acetate is rapidly cleared from the blood with a half-
life of only a few minutes and is metabolized principally by
skeletal and cardiac muscle and the brain. Acetate spares free
fatty acid oxidation in humans and its absorption does not
stimulate insulin release. Another precursor of blood acetate
is alcohol.
Fermentation also gives rise to the gases hydrogen and
carbon dioxide. Much of the hydrogen is converted to
methane by bacteria, and both hydrogen and methane are
excreted in breath and flatus. Gas production, especially if
rapid, is one of the principal complaints of people unused to
eating foods containing significant amounts of fermentable
carbohydrate. Another product of fermentation is microbial
biomass or microbial growth (Stephen and Cummings,
1980). These bacteria are excreted in faeces and this is one
of the principal mechanisms of laxation by NSP. Lactate is
also produced from fermentation, usually during rapid
breakdown of soluble carbohydrates such as oligosacchar-
ides. Both D- and L-lactate are produced and both are
absorbed. Some ethyl alcohol is produced during hind gut
fermentation, although it is more characteristic of fermenta-
tion due to yeasts as in brewing and wine making.
Bowel habit
Carbohydrates in the colon have additional health benefits
beyond providing energy through SCFA absorption. The best
documented effect is that of NSP on bowel habit. Table 5 is a
compilation of faecal weight data from around 120 papers
published between 1932 and 1992 detailing 150 separate
studies (Cummings et al., 2004). It shows the average
increase in stool output expressed as grams of stool (wet
weight) per gram of ‘fibre’ fed using weighted means from
published data. Wheat bran as a source comes out as the
most effective with raw bran at 7.2 g/g more effective than
cooked bran, 4.4 (Po0.05), but has the disadvantage of
containing 3% phytate—a known inhibitor of the absorption
of divalent cations (calcium, magnesium, zinc and iron).
Fruit and vegetables are remarkably effective, 6.0 g/g, and
with wheat bran are well ahead of the rest. After fruit and
vegetables comes psyllium at 4.0 g/g and then the league
table progresses through oats 3.4, other gums and mucilages
3.1, corn 2.9, legumes (mainly soya) 1.5 and lastly pectin 1.3.
The overall differences among the various sources of NSP are
Physiological aspects of energy metabolismM Elia and JH Cummings
S62
European Journal of Clinical Nutrition
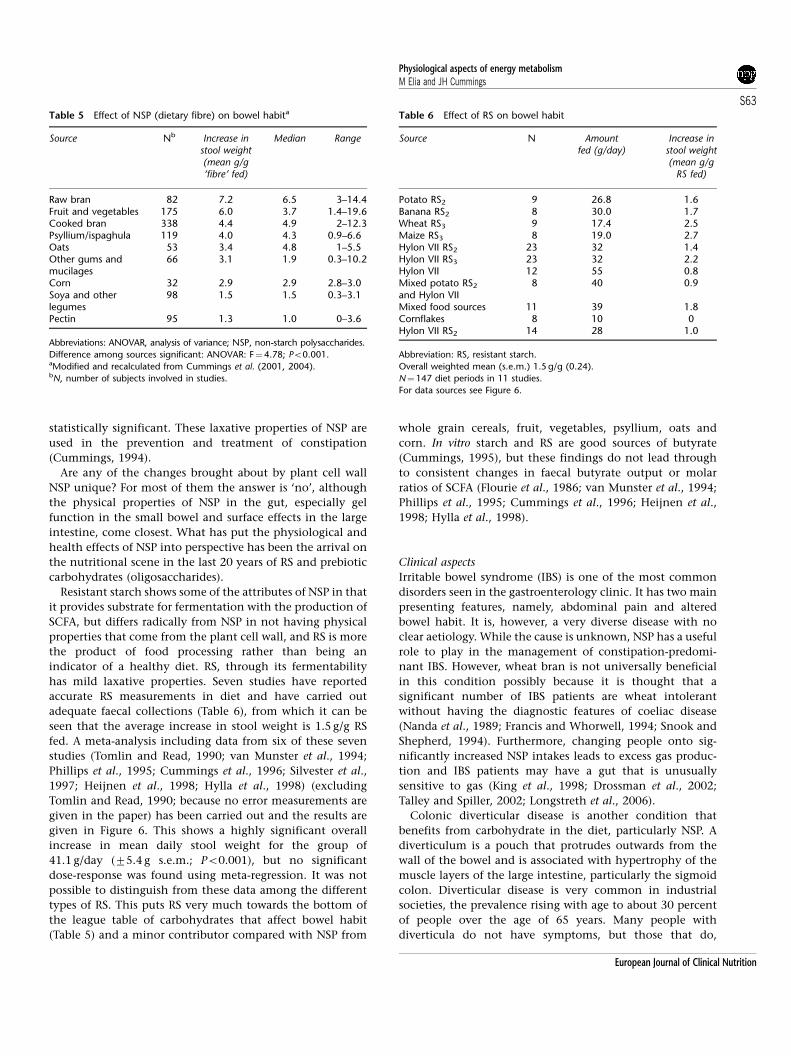
statistically significant. These laxative properties of NSP are
used in the prevention and treatment of constipation
(Cummings, 1994).
Are any of the changes brought about by plant cell wall
NSP unique? For most of them the answer is ‘no’, although
the physical properties of NSP in the gut, especially gel
function in the small bowel and surface effects in the large
intestine, come closest. What has put the physiological and
health effects of NSP into perspective has been the arrival on
the nutritional scene in the last 20 years of RS and prebiotic
carbohydrates (oligosaccharides).
Resistant starch shows some of the attributes of NSP in that
it provides substrate for fermentation with the production of
SCFA, but differs radically from NSP in not having physical
properties that come from the plant cell wall, and RS is more
the product of food processing rather than being an
indicator of a healthy diet. RS, through its fermentability
has mild laxative properties. Seven studies have reported
accurate RS measurements in diet and have carried out
adequate faecal collections (Table 6), from which it can be
seen that the average increase in stool weight is 1.5 g/g RS
fed. A meta-analysis including data from six of these seven
studies (Tomlin and Read, 1990; van Munster et al., 1994;
Phillips et al., 1995; Cummings et al., 1996; Silvester et al.,
1997; Heijnen et al., 1998; Hylla et al., 1998) (excluding
Tomlin and Read, 1990; because no error measurements are
given in the paper) has been carried out and the results are
given in Figure 6. This shows a highly significant overall
increase in mean daily stool weight for the group of
41.1 g/day (75.4 g s.e.m.; Po0.001), but no significant
dose-response was found using meta-regression. It was not
possible to distinguish from these data among the different
types of RS. This puts RS very much towards the bottom of
the league table of carbohydrates that affect bowel habit
(Table 5) and a minor contributor compared with NSP from
whole grain cereals, fruit, vegetables, psyllium, oats and
corn. In vitro starch and RS are good sources of butyrate
(Cummings, 1995), but these findings do not lead through
to consistent changes in faecal butyrate output or molar
ratios of SCFA (Flourie et al., 1986; van Munster et al., 1994;
Phillips et al., 1995; Cummings et al., 1996; Heijnen et al.,
1998; Hylla et al., 1998).
Clinical aspects
Irritable bowel syndrome (IBS) is one of the most common
disorders seen in the gastroenterology clinic. It has two main
presenting features, namely, abdominal pain and altered
bowel habit. It is, however, a very diverse disease with no
clear aetiology. While the cause is unknown, NSP has a useful
role to play in the management of constipation-predomi-
nant IBS. However, wheat bran is not universally beneficial
in this condition possibly because it is thought that a
significant number of IBS patients are wheat intolerant
without having the diagnostic features of coeliac disease
(Nanda et al., 1989; Francis and Whorwell, 1994; Snook and
Shepherd, 1994). Furthermore, changing people onto sig-
nificantly increased NSP intakes leads to excess gas produc-
tion and IBS patients may have a gut that is unusually
sensitive to gas (King et al., 1998; Drossman et al., 2002;
Talley and Spiller, 2002; Longstreth et al., 2006).
Colonic diverticular disease is another condition that
benefits from carbohydrate in the diet, particularly NSP. A
diverticulum is a pouch that protrudes outwards from the
wall of the bowel and is associated with hypertrophy of the
muscle layers of the large intestine, particularly the sigmoid
colon. Diverticular disease is very common in industrial
societies, the prevalence rising with age to about 30 percent
of people over the age of 65 years. Many people with
diverticula do not have symptoms, but those that do,
Table 5 Effect of NSP (dietary fibre) on bowel habita
Source Nb Increase instool weight(mean g/g‘fibre’ fed)
Median Range
Raw bran 82 7.2 6.5 3–14.4Fruit and vegetables 175 6.0 3.7 1.4–19.6Cooked bran 338 4.4 4.9 2–12.3Psyllium/ispaghula 119 4.0 4.3 0.9–6.6Oats 53 3.4 4.8 1–5.5Other gums andmucilages
66 3.1 1.9 0.3–10.2
Corn 32 2.9 2.9 2.8–3.0Soya and otherlegumes
98 1.5 1.5 0.3–3.1
Pectin 95 1.3 1.0 0–3.6
Abbreviations: ANOVAR, analysis of variance; NSP, non-starch polysaccharides.
Difference among sources significant: ANOVAR: F¼ 4.78; Po0.001.aModified and recalculated from Cummings et al. (2001, 2004).bN, number of subjects involved in studies.
Table 6 Effect of RS on bowel habit
Source N Amountfed (g/day)
Increase instool weight(mean g/g
RS fed)
Potato RS2 9 26.8 1.6Banana RS2 8 30.0 1.7Wheat RS3 9 17.4 2.5Maize RS3 8 19.0 2.7Hylon VII RS2 23 32 1.4Hylon VII RS3 23 32 2.2Hylon VII 12 55 0.8Mixed potato RS2
and Hylon VII8 40 0.9
Mixed food sources 11 39 1.8Cornflakes 8 10 0Hylon VII RS2 14 28 1.0
Abbreviation: RS, resistant starch.
Overall weighted mean (s.e.m.) 1.5 g/g (0.24).
N¼ 147 diet periods in 11 studies.
For data sources see Figure 6.
Physiological aspects of energy metabolismM Elia and JH Cummings
S63
European Journal of Clinical Nutrition

complain of lower abdominal pain and changes in bowel
habit. High NSP-containing diets were introduced in the
1960s and their use revolutionized the management of this
condition (Painter et al., 1972). Wheat bran is thought to be
more effective than other sources of NSP or bulk laxatives,
although bran is not a panacea and may aggregate gas
production, feelings of abdominal distension and incom-
plete emptying of the rectum (Stollman and Raskin, 2004).
The role of carbohydrate in the prevention of colorectal
cancer is dealt with elsewhere in this consultation.
Prebiotics
Definition
‘A prebiotic is a non-digestible food ingredient that benefi-
cially affects the host by selectively stimulating the growth
and/or activity of one of a limited number of bacteria
in the colon, and thus improves host health’ (Gibson and
Roberfroid, 1995). This use of the term ‘non-digestible’ in
this context is meant to convey the idea of carbohydrates
that are not digested and absorbed in the small intestine. As
such it conflicts with the use of the term digestion referred to
in the section on DE where ‘digestibility is defined as the
proportion of combustible energy that is absorbed over the
entire length of the gastrointestinal tract.’ (see below).
Physiology and microbiology
The main candidate prebiotics are all non-a-glucan oligo-
saccharides. They are present in the normal diet, as described
above, at intakes of 5–10 g/day. Those that have been shown
to be prebiotic are fructooligosaccharides, galactooligo-
saccharides and lactulose. The ability of fructooligosacchar-
ides, galactooligosaccharides and inulin, when taken in
relatively small amounts in the diet of around 5–15 g/day,
to alter the composition of the flora to one dominated by
bifidobacteria and lactobacilli is now well established
(Gibson et al., 2004; Roberfroid, 2005).
Prebiotic carbohydrates are important because of the new
concept of a healthy or balanced gut flora. A healthy, or
‘balanced’ microbiota is one that is predominantly sacchar-
olytic and comprises significant numbers of bifidobacteria
and lactobacilli (Cummings et al., 2004). This concept is
based on a number of observations. The genera Bifidobacter-
ium and Lactobacillus do not contain any known pathogens,
and they are primarily carbohydrate-fermenting bacteria,
unlike other groups such as bacteroides and clostridia that
are also proteolytic and amino-acid fermenting. The pro-
ducts of carbohydrate fermentation, principally SCFAs are
beneficial to host health, while those of protein breakdown
and amino acid fermentation, which include ammonia,
phenols, indoles, thiols, amines and sulphides, are not
(Cummings and Macfarlane, 1991). Furthermore, lactic
acid-producing bacteria such as bifidobacteria and lactoba-
cilli play a significant role in the maintenance of coloniza-
tion resistance, through a variety of mechanisms (Gibson
et al., 2005). Equally importantly, the exclusively breast-fed
neonate has a microflora dominated by bifidobacteria,
which is part of the baby’s defence against pathogenic
microorganisms, and which is an important primer for their
immune system. This microflora is nurtured by oligosacchar-
ides in breast milk, which can be considered to be the
original prebiotics.
Study name RS (dose) Difference in means and 95% CI
RS Control
Cummings et al., 1996 Banana RS2 (30.0g) 8 12
Cummings et al., 1996 Maize RS2 (19.0g) 8 12
Cummings et al., 1996 Potato RS2 (26.8g) 9 12
Cummings et al., 1996 Wheat RS3 (17.4g) 9 12
Heijnen et al., 1998 Hylon VII RS2 (32.0g) 23 22
Heijnen et al., 1998 Hylon VII RS3 (32.0g) 23 22
Hylla et al., 1998 Hylon VII (55g) 12 12
Silvester et al., 1997 Potato starch + Hylon VII (40g) 8 8
Phillips et al., 1995 Mixed diet (38.6g) 11 11
Van Munster et al., 1994 Hylon VII RS2 (28g) 13 13
124 136
-150.00 -75.00 0.00 75.00 150.00
Favours control Favours RS
Figure 6 Meta-analysis (fixed effect model) of effect of various sources of resistant starch on bowel habit (stool weight). Point estimateþ41.1 g/day; 95% CI: þ30.5 to þ51.7 g/day. The test of overall effect was highly significant (P¼o0.001), and the test of heterogeneity wasnot significant (I2¼0%; P¼0.971).
Physiological aspects of energy metabolismM Elia and JH Cummings
S64
European Journal of Clinical Nutrition
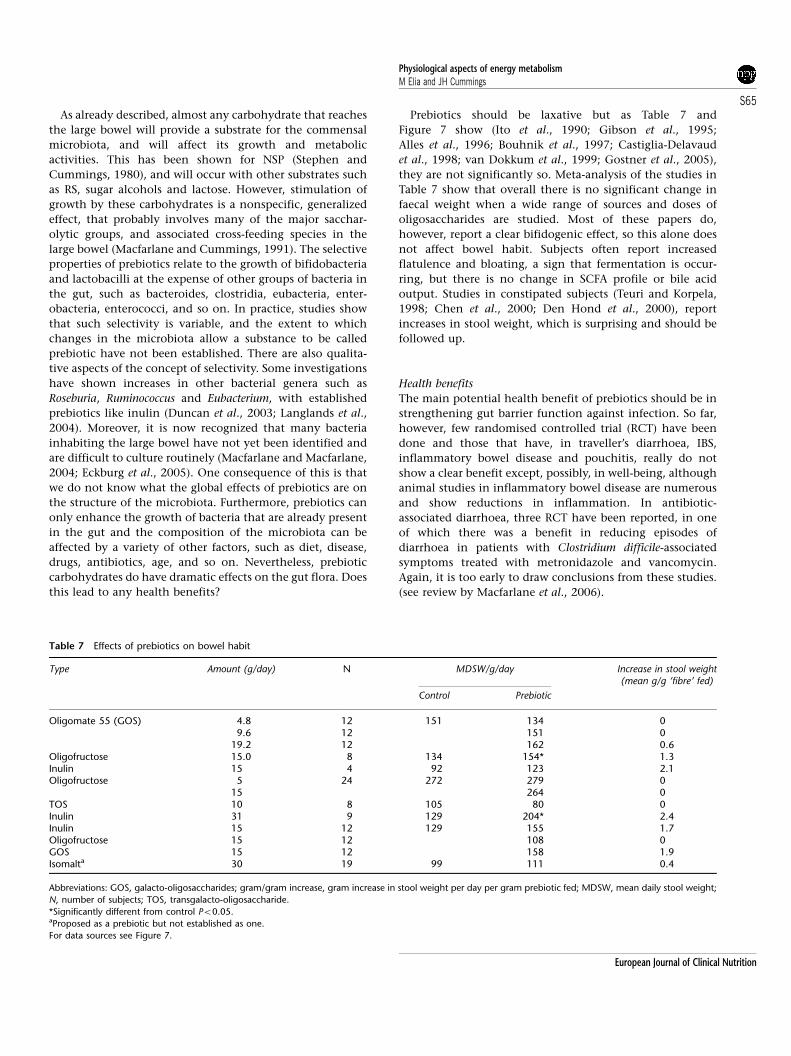
As already described, almost any carbohydrate that reaches
the large bowel will provide a substrate for the commensal
microbiota, and will affect its growth and metabolic
activities. This has been shown for NSP (Stephen and
Cummings, 1980), and will occur with other substrates such
as RS, sugar alcohols and lactose. However, stimulation of
growth by these carbohydrates is a nonspecific, generalized
effect, that probably involves many of the major sacchar-
olytic groups, and associated cross-feeding species in the
large bowel (Macfarlane and Cummings, 1991). The selective
properties of prebiotics relate to the growth of bifidobacteria
and lactobacilli at the expense of other groups of bacteria in
the gut, such as bacteroides, clostridia, eubacteria, enter-
obacteria, enterococci, and so on. In practice, studies show
that such selectivity is variable, and the extent to which
changes in the microbiota allow a substance to be called
prebiotic have not been established. There are also qualita-
tive aspects of the concept of selectivity. Some investigations
have shown increases in other bacterial genera such as
Roseburia, Ruminococcus and Eubacterium, with established
prebiotics like inulin (Duncan et al., 2003; Langlands et al.,
2004). Moreover, it is now recognized that many bacteria
inhabiting the large bowel have not yet been identified and
are difficult to culture routinely (Macfarlane and Macfarlane,
2004; Eckburg et al., 2005). One consequence of this is that
we do not know what the global effects of prebiotics are on
the structure of the microbiota. Furthermore, prebiotics can
only enhance the growth of bacteria that are already present
in the gut and the composition of the microbiota can be
affected by a variety of other factors, such as diet, disease,
drugs, antibiotics, age, and so on. Nevertheless, prebiotic
carbohydrates do have dramatic effects on the gut flora. Does
this lead to any health benefits?
Prebiotics should be laxative but as Table 7 and
Figure 7 show (Ito et al., 1990; Gibson et al., 1995;
Alles et al., 1996; Bouhnik et al., 1997; Castiglia-Delavaud
et al., 1998; van Dokkum et al., 1999; Gostner et al., 2005),
they are not significantly so. Meta-analysis of the studies in
Table 7 show that overall there is no significant change in
faecal weight when a wide range of sources and doses of
oligosaccharides are studied. Most of these papers do,
however, report a clear bifidogenic effect, so this alone does
not affect bowel habit. Subjects often report increased
flatulence and bloating, a sign that fermentation is occur-
ring, but there is no change in SCFA profile or bile acid
output. Studies in constipated subjects (Teuri and Korpela,
1998; Chen et al., 2000; Den Hond et al., 2000), report
increases in stool weight, which is surprising and should be
followed up.
Health benefits
The main potential health benefit of prebiotics should be in
strengthening gut barrier function against infection. So far,
however, few randomised controlled trial (RCT) have been
done and those that have, in traveller’s diarrhoea, IBS,
inflammatory bowel disease and pouchitis, really do not
show a clear benefit except, possibly, in well-being, although
animal studies in inflammatory bowel disease are numerous
and show reductions in inflammation. In antibiotic-
associated diarrhoea, three RCT have been reported, in one
of which there was a benefit in reducing episodes of
diarrhoea in patients with Clostridium difficile-associated
symptoms treated with metronidazole and vancomycin.
Again, it is too early to draw conclusions from these studies.
(see review by Macfarlane et al., 2006).
Table 7 Effects of prebiotics on bowel habit
Type Amount (g/day) N MDSW/g/day Increase in stool weight(mean g/g ‘fibre’ fed)
Control Prebiotic
Oligomate 55 (GOS) 4.8 12 151 134 09.6 12 151 0
19.2 12 162 0.6Oligofructose 15.0 8 134 154* 1.3Inulin 15 4 92 123 2.1Oligofructose 5 24 272 279 0
15 264 0TOS 10 8 105 80 0Inulin 31 9 129 204* 2.4Inulin 15 12 129 155 1.7Oligofructose 15 12 108 0GOS 15 12 158 1.9Isomalta 30 19 99 111 0.4
Abbreviations: GOS, galacto-oligosaccharides; gram/gram increase, gram increase in stool weight per day per gram prebiotic fed; MDSW, mean daily stool weight;
N, number of subjects; TOS, transgalacto-oligosaccharide.
*Significantly different from control Po0.05.aProposed as a prebiotic but not established as one.
For data sources see Figure 7.
Physiological aspects of energy metabolismM Elia and JH Cummings
S65
European Journal of Clinical Nutrition
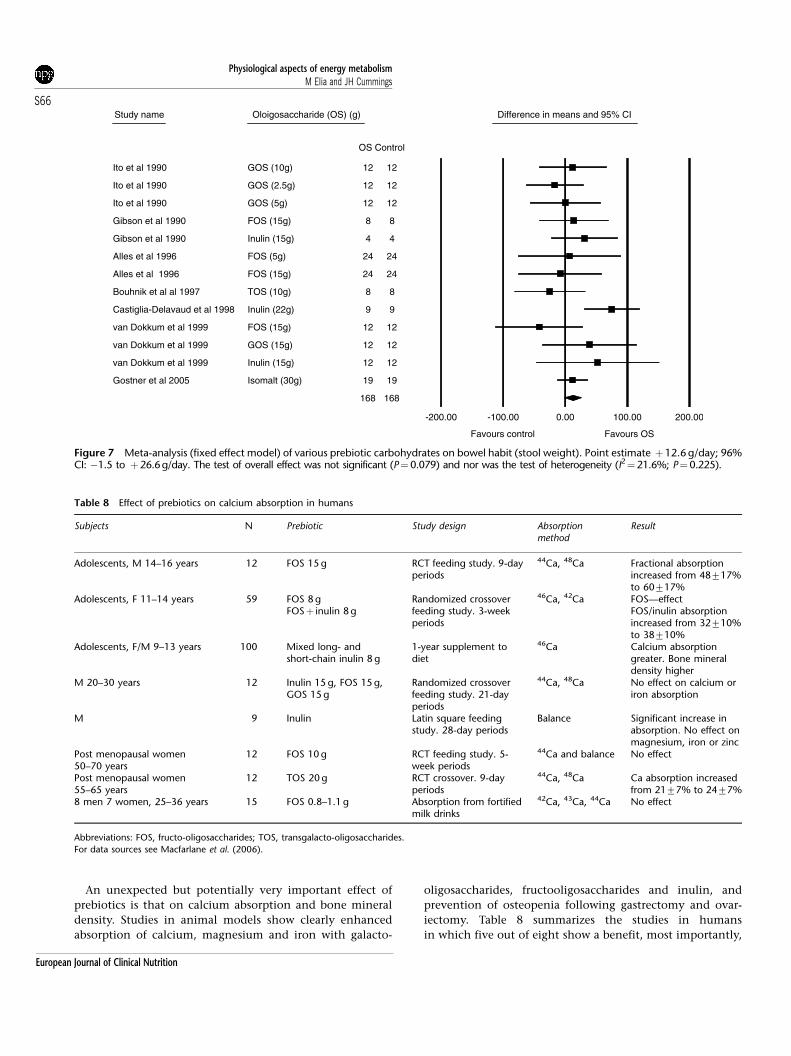
An unexpected but potentially very important effect of
prebiotics is that on calcium absorption and bone mineral
density. Studies in animal models show clearly enhanced
absorption of calcium, magnesium and iron with galacto-
oligosaccharides, fructooligosaccharides and inulin, and
prevention of osteopenia following gastrectomy and ovar-
iectomy. Table 8 summarizes the studies in humans
in which five out of eight show a benefit, most importantly,
Study name Oloigosaccharide (OS) (g) Difference in means and 95% CI
OS Control
Ito et al 1990 GOS (10g) 12 12
Ito et al 1990 GOS (2.5g) 12 12
Ito et al 1990 GOS (5g) 12 12
Gibson et al 1990 FOS (15g) 8 8
Gibson et al 1990 Inulin (15g) 4 4
Alles et al 1996 FOS (5g) 24 24
Alles et al 1996 FOS (15g) 24 24
Bouhnik et al al 1997 TOS (10g) 8 8
Castiglia-Delavaud et al 1998 Inulin (22g) 9 9
van Dokkum et al 1999 FOS (15g) 12 12
van Dokkum et al 1999 GOS (15g) 12 12
van Dokkum et al 1999 Inulin (15g) 12 12
Gostner et al 2005 Isomalt (30g) 19 19
168 168
-200.00 -100.00 0.00 100.00 200.00
Favours control Favours OS
Figure 7 Meta-analysis (fixed effect model) of various prebiotic carbohydrates on bowel habit (stool weight). Point estimate þ12.6 g/day; 96%CI: �1.5 to þ26.6g/day. The test of overall effect was not significant (P¼0.079) and nor was the test of heterogeneity (I2¼21.6%; P¼0.225).
Table 8 Effect of prebiotics on calcium absorption in humans
Subjects N Prebiotic Study design Absorptionmethod
Result
Adolescents, M 14–16 years 12 FOS 15 g RCT feeding study. 9-dayperiods
44Ca, 48Ca Fractional absorptionincreased from 48717%to 60717%
Adolescents, F 11–14 years 59 FOS 8 gFOSþ inulin 8 g
Randomized crossoverfeeding study. 3-weekperiods
46Ca, 42Ca FOS—effectFOS/inulin absorptionincreased from 32710%to 38710%
Adolescents, F/M 9–13 years 100 Mixed long- andshort-chain inulin 8 g
1-year supplement todiet
46Ca Calcium absorptiongreater. Bone mineraldensity higher
M 20–30 years 12 Inulin 15 g, FOS 15 g,GOS 15 g
Randomized crossoverfeeding study. 21-dayperiods
44Ca, 48Ca No effect on calcium oriron absorption
M 9 Inulin Latin square feedingstudy. 28-day periods
Balance Significant increase inabsorption. No effect onmagnesium, iron or zinc
Post menopausal women50–70 years
12 FOS 10 g RCT feeding study. 5-week periods
44Ca and balance No effect
Post menopausal women55–65 years
12 TOS 20 g RCT crossover. 9-dayperiods
44Ca, 48Ca Ca absorption increasedfrom 2177% to 2477%
8 men 7 women, 25–36 years 15 FOS 0.8–1.1 g Absorption from fortifiedmilk drinks
42Ca, 43Ca, 44Ca No effect
Abbreviations: FOS, fructo-oligosaccharides; TOS, transgalacto-oligosaccharides.
For data sources see Macfarlane et al. (2006).
Physiological aspects of energy metabolismM Elia and JH Cummings
S66
European Journal of Clinical Nutrition

in adolescents. Possible mechanisms are discussed elsewhere
(Macfarlane et al., 2006). How specific this effect on calcium
absorption is to this class of fermented carbohydrate remains
to be seen. Lactose has traditionally been thought to
promote calcium absorption, although this is not a consis-
tent finding (Zittermann et al., 2000).
Other possible health benefits of prebiotics are now being
explored in many situations, facilitated by their safety and
ease of use. A substantial literature is accumulating on
prebiotics and cancer. However, much of the published work
is in animals where the role of prebiotics looks to be
beneficial, whereas human studies are mostly concerned
with identification of early biomarkers of risk (Pool-Zobel,
2005). Prebiotics are now being added to follow-on feeds for
infants (Fanaro et al., 2005), a practice which arises from the
clear benefits to children of probiotics in preventing and
ameliorating the symptoms of acute infectious diarrhoea,
and in atopic disease. Their use to prevent necrotizing
enterocolitis shows promise in animal models (Butel et al.,
2002). Prebiotics clearly change the gut microbiota of infants
and alter large bowel function, but large clinical trials are
awaited. Another area of importance is lipid metabolism
where prebiotic studies in animals have shown reduced
blood levels of cholesterol and triglycerides and beneficial
effects on fatty liver. Clinical trials in humans have not
yielded such consistent results (Williams and Jackson, 2002;
Beylot, 2005). However, the effects on hepatic lipid metabo-
lism are worth further study. There is also great interest in
prebiotics in the pet food and animal feed industry
(Flickinger and Fahey, 2002), where improved control of
gastrointestinal infection is reported and enhanced growth
performance is seen in poultry especially. Other areas of
interest include prebiotics and immunomodulation and the
gut immune system, glycaemic control, behavioural effects,
especially cognitive performance, and the enhancement of
probiotic activity in synbiotics.
Prebiotics bring a new dimension to dietary carbohydrates,
which might not have been predicted. Their ability to
change the composition of the gut flora towards one that
should protect against infection and their effect on calcium
absorption are very important for public health. However,
much work needs to be done in determining intakes of
prebiotics in individuals and populations, on their mechan-
isms of action in the gut and potential effect on the immune
system, inflammation and cancer.
Digestibility concepts
Within the nutrition community there is an awareness that
the digestion (mechanical, chemical and enzymic break-
down) of food and absorption of products takes place in
characteristically different regions of the gut. Of particular
consequence has been the division of digestive processes
into those that take place in the small bowel vs the large
bowel. Small bowel digestion and absorption occurs for most
nutrients, whereas the large bowel, through the versatility of
its anaerobic bacteria, deals mainly with carbohydrates such
as NSP, non-a-glucan short-chain carbohydrates (oligosac-
charides), RS and polyols.
The end products of carbohydrate breakdown vary in
different regions of the gut with sugars appearing in blood
and insulin secretion stimulated after small bowel absorp-
tion, while from the colon the process of fermentation yields
SCFAs, which metabolically are entirely different (Remesy
et al., 1995). Other divisions within the gut are also valid,
especially between duodenum/jejunum and ileum with, for
example, iron being absorbed in the duodenum and upper
jejunum and vitamin B12 in the terminal ileum. These
patterns of digestion are significant for health and extend
across the animal kingdom depending largely on the
anatomy of the gut. For example, in ruminants, fermenta-
tion takes place primarily in the upper gut (the stomach
and rumen).
Knowledge of the importance of this contrasting physiol-
ogy linked to different regions of the gut has led to suggested
classifications of nutrients, especially carbohydrates on the
basis of the apparent site of their digestion and absorption.
An example is fibre, originally the cell wall carbohydrates of
plants such as cellulose, hemicellulose and pectin. However,
as our understanding of carbohydrate digestion has in-
creased, it has become clear that while regional differences in
function occur, there is no such clarity in regional differ-
ences in carbohydrate digestion. Most carbohydrates can
reach the colon, for example, lactose, polyols, short-chain
carbohydrates, some starches and all NSP. For some of these,
for example, polyols or starch, the amount can vary between
meals and individuals, depending on factors such as dose
and transit time (Stephen et al., 1983; Cummings and
Englyst, 1991; Silvester et al., 1995; Cummings et al., 1996;
Livesey, 2003b). To describe carbohydrates by the region of
their digestion in the gut is, therefore, not an exact science.
Moreover, the gut acts as a single organ in digestion.
Internal regulation of gut digestive processes occurs through
neuro-endocrine loops between different regions. A classic
example is the gastro-colic reflex, but much more intricate
feedback occurs between regions of the gut (Cooke and
Reddix, 1994; Nightingale et al., 1996; Camilleri, 2006).
Furthermore, as already indicated in the discussion of
energy values of food, ‘digestibility is defined as the
proportion of combustible energy that is absorbed over the
entire length of the gastrointestinal tract’. Other terms in use
include ‘true digestibility’ (small bowel), ‘fermentable’ (large
bowel) and ‘apparent digestibility’ (whole gut).
There is a strong case for looking at carbohydrate digestion
as an integrated whole gut process. For the purposes of
classifying food as carbohydrates, both their DE and
digestion and absorption should be seen as a single
integrated system. This is not to underestimate the impor-
tance of regional differences in these processes and their
subsequent metabolic effects, but the digestion and classifi-
cation of carbohydrate should be based on their chemistry
Physiological aspects of energy metabolismM Elia and JH Cummings
S67
European Journal of Clinical Nutrition
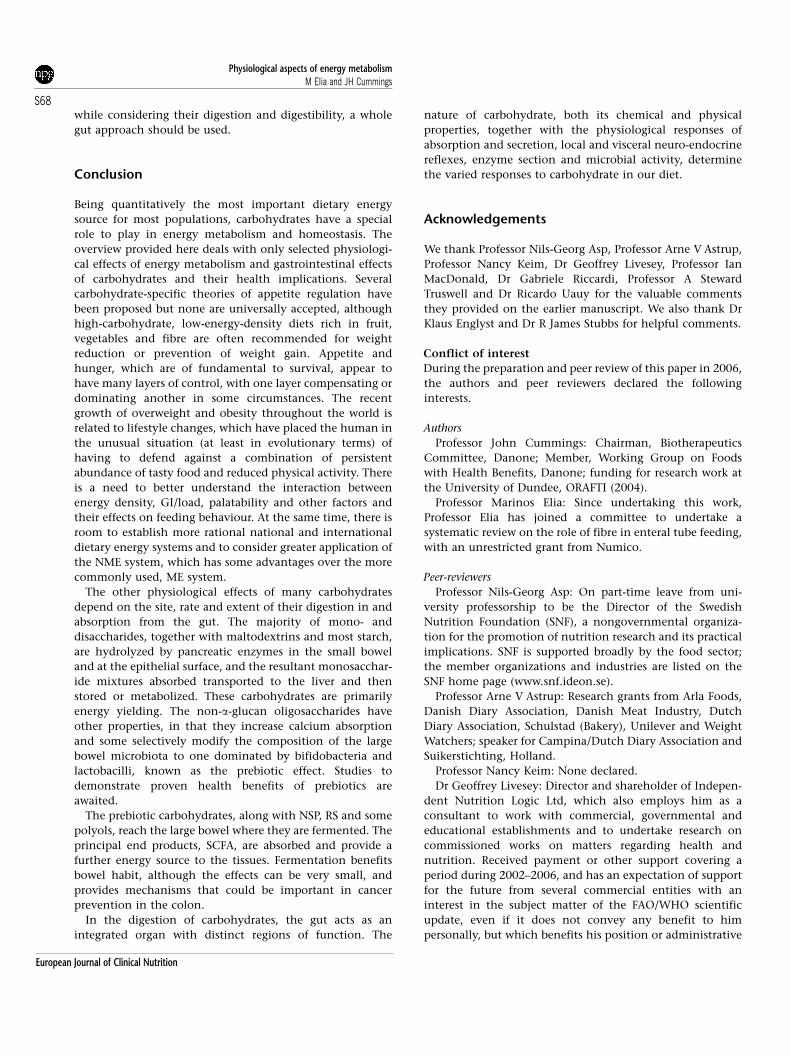
while considering their digestion and digestibility, a whole
gut approach should be used.
Conclusion
Being quantitatively the most important dietary energy
source for most populations, carbohydrates have a special
role to play in energy metabolism and homeostasis. The
overview provided here deals with only selected physiologi-
cal effects of energy metabolism and gastrointestinal effects
of carbohydrates and their health implications. Several
carbohydrate-specific theories of appetite regulation have
been proposed but none are universally accepted, although
high-carbohydrate, low-energy-density diets rich in fruit,
vegetables and fibre are often recommended for weight
reduction or prevention of weight gain. Appetite and
hunger, which are of fundamental to survival, appear to
have many layers of control, with one layer compensating or
dominating another in some circumstances. The recent
growth of overweight and obesity throughout the world is
related to lifestyle changes, which have placed the human in
the unusual situation (at least in evolutionary terms) of
having to defend against a combination of persistent
abundance of tasty food and reduced physical activity. There
is a need to better understand the interaction between
energy density, GI/load, palatability and other factors and
their effects on feeding behaviour. At the same time, there is
room to establish more rational national and international
dietary energy systems and to consider greater application of
the NME system, which has some advantages over the more
commonly used, ME system.
The other physiological effects of many carbohydrates
depend on the site, rate and extent of their digestion in and
absorption from the gut. The majority of mono- and
disaccharides, together with maltodextrins and most starch,
are hydrolyzed by pancreatic enzymes in the small bowel
and at the epithelial surface, and the resultant monosacchar-
ide mixtures absorbed transported to the liver and then
stored or metabolized. These carbohydrates are primarily
energy yielding. The non-a-glucan oligosaccharides have
other properties, in that they increase calcium absorption
and some selectively modify the composition of the large
bowel microbiota to one dominated by bifidobacteria and
lactobacilli, known as the prebiotic effect. Studies to
demonstrate proven health benefits of prebiotics are
awaited.
The prebiotic carbohydrates, along with NSP, RS and some
polyols, reach the large bowel where they are fermented. The
principal end products, SCFA, are absorbed and provide a
further energy source to the tissues. Fermentation benefits
bowel habit, although the effects can be very small, and
provides mechanisms that could be important in cancer
prevention in the colon.
In the digestion of carbohydrates, the gut acts as an
integrated organ with distinct regions of function. The
nature of carbohydrate, both its chemical and physical
properties, together with the physiological responses of
absorption and secretion, local and visceral neuro-endocrine
reflexes, enzyme section and microbial activity, determine
the varied responses to carbohydrate in our diet.
Acknowledgements
We thank Professor Nils-Georg Asp, Professor Arne V Astrup,
Professor Nancy Keim, Dr Geoffrey Livesey, Professor Ian
MacDonald, Dr Gabriele Riccardi, Professor A Steward
Truswell and Dr Ricardo Uauy for the valuable comments
they provided on the earlier manuscript. We also thank Dr
Klaus Englyst and Dr R James Stubbs for helpful comments.
Conflict of interest
During the preparation and peer review of this paper in 2006,
the authors and peer reviewers declared the following
interests.
Authors
Professor John Cummings: Chairman, Biotherapeutics
Committee, Danone; Member, Working Group on Foods
with Health Benefits, Danone; funding for research work at
the University of Dundee, ORAFTI (2004).
Professor Marinos Elia: Since undertaking this work,
Professor Elia has joined a committee to undertake a
systematic review on the role of fibre in enteral tube feeding,
with an unrestricted grant from Numico.
Peer-reviewers
Professor Nils-Georg Asp: On part-time leave from uni-
versity professorship to be the Director of the Swedish
Nutrition Foundation (SNF), a nongovernmental organiza-
tion for the promotion of nutrition research and its practical
implications. SNF is supported broadly by the food sector;
the member organizations and industries are listed on the
SNF home page (www.snf.ideon.se).
Professor Arne V Astrup: Research grants from Arla Foods,
Danish Diary Association, Danish Meat Industry, Dutch
Diary Association, Schulstad (Bakery), Unilever and Weight
Watchers; speaker for Campina/Dutch Diary Association and
Suikerstichting, Holland.
Professor Nancy Keim: None declared.
Dr Geoffrey Livesey: Director and shareholder of Indepen-
dent Nutrition Logic Ltd, which also employs him as a
consultant to work with commercial, governmental and
educational establishments and to undertake research on
commissioned works on matters regarding health and
nutrition. Received payment or other support covering a
period during 2002–2006, and has an expectation of support
for the future from several commercial entities with an
interest in the subject matter of the FAO/WHO scientific
update, even if it does not convey any benefit to him
personally, but which benefits his position or administrative
Physiological aspects of energy metabolismM Elia and JH Cummings
S68
European Journal of Clinical Nutrition
unit, such as a grant or fellowship or payment for the
purpose of financing a post or consultancy.
Professor Ian MacDonald: None declared.
Dr Gabriele Riccardi: None declared.
Professor A Steward Truswell: None declared.
Professor Ricardo Uauy: Scientific Adviser on a temporary
basis for Unilever and Wyeth; Scientific Editorial/Award
Adviser for Danone, DSM, Kelloggs, and Knowles and Bolton
on an ad hoc basis.
References
Agatston A (2003). The South Beach Diet. Headline Book Publishing:London.
Alfenas RC, Mattes RD (2005). Influence of glycemic index/load onglycemic response, appetite, and food intake in healthy humans.Diabetes Care 28, 2123–2129.
Alles MS, Hautvast JG, Nagengast FM, Hartemink R, Van Laere KM,Jansen JB (1996). Fate of fructo-oligosaccharides in the humanintestine. Br J Nutr 76, 211–221.
Anderson GH, Catherine NL, Woodend DM, Wolever TM (2002).Inverse association between the effect of carbohydrates on bloodglucose and subsequent short-term food intake in young men. AmJ Clin Nutr 76, 1023–1030.
Anderson GH, Woodend D (2003). Effect of glycemic carbohydrateson short-term satiety and food intake. Nutr Rev 61, S17–S26.
AOAC (2002). AOAC Official Methods of AOAC International, 17th edn.Gaithersburg, MD, USA.
Armstrong DG (1969). Cell bioenergetics and energy metabolism. In:Lenkeit W, Breiren D, Crassman E (eds). Handbuch Der Tierernah-rung. Parey Publishing: Hamburg.
Astrup A, Buemann B, Flint A, Raben A (2002). Low-fat diets andenergy balance: how does the evidence stand in 2002? Proc NutrSoc 61, 299–309.
Astrup A, Grunwald GK, Melanson EL, Saris WH, Hill JO (2000). Therole of low-fat diets in body weight control: a meta-analysis of adlibitum dietary intervention studies. Int J Obes Relat Metab Disord24, 1545–1552.
Ball SD, Keller KR, Moyer-Mileur LJ, Ding YW, Donaldson D, JacksonWD (2003). Prolongation of satiety after low versus moderately highglycemic index meals in obese adolescents. Pediatrics 111, 488–494.
Bar A (1990). Factorial calculation model for the estimation of thephysiological caloric value of polyols. In: Hosoya N (ed). Proceed-ings of the International Symposium on the Caloric Evaluation ofCarbohydrates. The Japanese Association for of Dietetic andEnriched Foods: Tokyo, pp 209–379.
Bathalon GP, Tucker KL, Hays NP, Vinken AG, Greenberg AS, McCroryMA et al. (2000). Psychological measures of eating behavior and theaccuracy of 3 common dietary assessment methods in healthypostmenopausal women. Am J Clin Nutr 71, 739–745.
Bell EA, Rolls BJ (2001). Energy density of foods affects energy intakeacross multiple levels of fat content in lean and obese women. Am JClin Nutr 73, 1010–1018.
Berkey CS, Rockett HR, Field AE, Gillman MW, Colditz GA (2004). Sugar-added beverages and adolescent weight change. Obes Res 12, 778–788.
Bernier J, Pascal G (1990). Valeur energetique des polyols (surcresalcools). Med Nutr 26, 221–238.
Beylot M (2005). Effects of inulin-type fructans on lipid metabolismin man and in animal models. Br J Nutr 93 (Suppl 1), S163–S168.
Bingham SA, Day NE, Luben R, Ferrari P, Slimani N, Norat T et al.(2003). Dietary fibre in food and protection against colorectalcancer in the European prospective investigation into cancer andnutrition (EPIC): an observational study. Lancet 361, 1496–1501.
Black JL (2000). Modelling growth and lactation in pigs. In:Theodorou KM, France J (eds). Feeding Systems and Feed EvaluationModels. Wallingford, Oxon, UK, pp 363–391.
Black RM, Anderson GH (1994). Sweeteners, food intake andselection. In: Fernstrom JD, Miller GD (eds). Appetite and BodyWeight Regulation: Sugar, Fat and Macronutrient Substitutes. BocaRaton, FL.
Black RM, Leiter LA, Anderson GH (1993). Consuming aspartamewith and without taste: differential effects on appetite and foodintake of young adult males. Physiol Behav 53, 459–466.
Blaxter KB (1989). Energy Metabolism in Animals and Man. CambridgeUniversity Press: Cambridge.
Blaxter KL (1971). Methods of measuring the energy metabolismof animals and interpretation of results obtained. Fed Proc 30,1436–1443.
Blundell JE, Burley VJ (1987). Satiation, satiety and the action of fibreon food intake. Int J Obes 11 (Suppl 1), 9–25.
Blundell JE, Rogers PJ (1994). Sweet carbohydrate substitutes(intense sweeteners) and control of appetite: scientific issues. In:Fernstrom JD, Miller GD (eds). Appetite and Body Weight Regulation:Sugar, Fat and Macronutrient Susbstitutes. Boca Raton, FL.
Blundell JE, Stubbs RJ (1999). High and low carbohydrate and fatintakes: limits imposed by appetite and palatability andtheir implications for energy balance. Eur J Clin Nutr 53 (Suppl 1),S148–S165.
Bouhnik Y, Flourie B, D’Agay-Abensour L, Pochart P, Gramet G,Durand M et al. (1997). Administration of transgalacto-oligosaccharides increases fecal bifidobacteria and modifiescolonic fermentation metabolism in healthy humans. J Nutr 127,444–448.
British Nutrition Foundation (1990). Energy from complex carbohy-drates. In: BNF Task Force on Complex Carbohydrates in Foods.Chapman and Hall: London.
Brown J, Livesey G, Roe M, Faulks R, Poppitt S, Wilkinson J et al.(1998). Metabolizable energy of high non-starch polysaccharide-maintenance and weight-reducing diets in men: experimentalappraisal of assessment systems. J Nutr 128, 986–995.
Burley VJ, Blundell JE (1990). Action of dietary fibre on the satietycascade. In: Kritchevsky D, Bonfield C, Anderson JW (eds). DietaryFibre. Chemistry, Physiology and Health Effects. Plenum Press: NewYork, NY.
Butel MJ, Waligora-Dupriet AJ, Szylit O (2002). Oligofructose andexperimental model of neonatal necrotising enterocolitis. Br J Nutr87 (Suppl 2), S213–S219.
Camilleri M (2006). Integrated upper gastrointestinal response tofood intake. Gastroenterology 131, 640–658.
Campfield LA, Smith FJ (1990). Transient declines in blood glucosesignal meal initiation. Int J Obes 14 (Suppl 3), 15–31; discussion31–34.
Campfield LA, Smith FJ (2003). Blood glucose dynamics and controlof meal initiation: a pattern detection and recognition theory.Physiol Rev 83, 25–58.
Campfield LA, Smith FJ, Rosenbaum M (1992). Human hunger: isthere a role for blood glucose dynamics? Appetite 18, 244.
Canty DJ, Chan MM (1991). Effects of consumption of caloric vsnoncaloric sweet drinks on indices of hunger and food consump-tion in normal adults. Am J Clin Nutr 53, 1159–1164.
Casey A, Mann R, Banister K, Fox J, Morris PG, Macdonald IA et al.(2000). Effect of carbohydrate ingestion on glycogen resynthesisin human liver and skeletal muscle, measured by (13)C MRS. AmJ Physiol Endocrinol Metab 278, E65–E75.
Cassidy A, Bingham SA, Cummings JH (1994). Starch intake andcolorectal cancer risk: an international comparison. Br J Cancer 69,937–942.
Castiglia-Delavaud C, Verdier E, Besle JM, Vernet J, Boirie Y, BeaufrereB et al. (1998). Net energy value of non-starch polysaccharideisolates (sugarbeet fibre and commercial inulin) and their impacton nutrient digestive utilization in healthy human subjects. BrJ Nutr 80, 343–352.
Centres for Disease Control and Prevention (CDC) (2004). Trends inintake of energy and macronutrients—United States, 1971–2000.MMWR Morb Mortal Wkly Rep 53, 80–82.
Physiological aspects of energy metabolismM Elia and JH Cummings
S69
European Journal of Clinical Nutrition
Champ M, Langkilde A-M, Brouns F et al. (2003). Advances in dietaryfibre characterization. 2. Consumption, chemistry, physiology andmeasurement of resistant starch; implications for food health andfood labelling. Nutr Res Rev 16, 143–161.
Chen H-L, Lu Y-H, Lin JJ, Ko L-Y (2000). Effects of fructooligo-saccharide on bowel function and indicators of nutritional statusin constipated elderly men. Nutr Res 20, 1725–1733.
Commission E (2006). Directive 90/496/EEC on Nutrition Labelling ofFoodstuffs: Discussion Paper on Revision of Technical Issues. Servicesfor the European Commission.
Connor H, Annan F, Bunn E, Frost G, McGough N, Sarwar T et al.(2003). The implementation of nutritional advice for people withdiabetes. Diabet Med 20, 786–807.
Cooke HJ, Reddix RA (1994). Neural regulation of intestinalelectrolyte transport. In: Johnson LR, Alpers DH, Christensen J,Jacobson ED, Walsh JH (eds). Physiology of the Gastrointestinal Tract.Raven Press, New York, pp 2083–2132.
Cummings JH (1981). Dietary fibre. Br Med Bull 37, 65–70.Cummings JH (1994). Non-starch polysaccharides (dietary fibre)
including bulk laxatives in constipation. In: Kamm MA, Lennard-Jones JE (eds). Constipation. Wrightson Biomedical Publishing Ltd:Petersfield, UK, pp 307–314.
Cummings JH (1995). Short-chain fatty acids. In: Gibson GR,Macfarlane GT (eds). Human Colonic Bacteria. CRC Press: BocaRaton, FL, pp 101–130.
Cummings JH, Antoine JM, Azpiroz F, Bourdet-Sicard R, BrandtzaegP, Calder PC et al. (2004). PASSCLAIM—gut health and immunity.Eur J Nutr 43 (Suppl 2), II118–II173.
Cummings JH, Beatty ER, Kingman SM, Bingham SA, Englyst HN(1996). Digestion and physiological properties of resistant starchin the human large bowel. Br J Nutr 75, 733–747.
Cummings JH, Englyst HN (1991). Measurement of starch fermen-tation in the human large intestine. Can J Physiol Pharmacol 69,121–129.
Cummings JH, Frolich W (1993). Dietary Fibre Intakes in Europe: ASurvey Conducted by Members of the Management Committee of COST92. Metabolic and Physiological Aspects of Dietary Fibre in Food.Brussels.
Cummings JH, Hill MJ, Jenkins DJ, Pearson JR, Wiggins HS (1976).Changes in fecal composition and colonic function due to cerealfiber. Am J Clin Nutr 29, 1468–1473.
Cummings JH, Macfarlane GT (1991). The control and consequencesof bacterial fermentation in the human colon. J Appl Bacteriol 70,443–459.
Cummings JH, Macfarlane GT, Englyst HN (2001). Prebioticdigestion and fermentation. Am J Clin Nutr 73, 415S–420S.
Cummings JH, Rombeau JL, Sakata T (1995). Physiological and ClinicalAspects of Short-Chain Fatty Acids. Cambridge University Press:Cambridge.
Cummings JH, Southgate DA, Branch WJ, Wiggins HS, Houston H,Jenkins DJ et al. (1979). The digestion of pectin in the human gutand its effect on calcium absorption and large bowel function. Br JNutr 41, 477–485.
de Castro JM (1991). Seasonal rhythms of human nutrient intake andmeal pattern. Physiol Behav 50, 243–248.
de Castro JM (2004). Dietary energy density is associatedwith increased intake in free-living humans. J Nutr 134,335–341.
de Castro JM, de Castro ES (1989). Spontaneous meal patterns ofhumans: influence of the presence of other people. Am J Clin Nutr50, 237–247.
Den Hond E, Geypens B, Ghoos Y (2000). Effect of high performancechicory inulin on constipation. Nutr Res 20, 731–736.
Department of Health (1991). Dietary Reference Values for Food, Energyand Nutrients for the United Kingdom. HMSO: London.
Diabetes and Nutrition Study Group of European Association for theStudy of Diabetes (2000). Recommendations for the nutritionalmanagement of patients with diabetes mellitus. Eur J Clin Nutr 54,353–355.
DiMeglio DP, Mattes RD (2000). Liquid versus solid carbohydrate:effects on food intake and body weight. Int J Obes Relat MetabDisord 24, 794–800.
Drewnowski A (1998). Energy density, palatability, and satiety:implications for weight control. Nutr Rev 56, 347–353.
Drossman DA, Camilleri M, Mayer EA, Whitehead WE (2002). AGAtechnical review on irritable bowel syndrome. Gastroenterology123, 2108–2131.
Druce M, Bloom SR (2006). The regulation of appetite. Arch Dis Child91, 183–187.
Duncan KH, Bacon JA, Weinsier RL (1983). The effects of high andlow energy density diets on satiety, energy intake, and eating timeof obese and nonobese subjects. Am J Clin Nutr 37, 763–767.
Duncan SH, Scott KP, Ramsay AG, Harmsen HJ, Welling GW, StewartCS et al. (2003). Effects of alternative dietary substrates oncompetition between human colonic bacteria in an anaerobicfermentor system. Appl Environ Microbiol 69, 1136–1142.
Dutch Nutrition Council (1987). The Energy Values of Polyols. Recom-mendations of the Committee on Polyols. Nutrition Council: The Hague.
Eckburg PB, Bik EM, Bernstein CN, Purdom E, Dethlefsen L, SargentM et al. (2005). Diversity of the human intestinal microbial flora.Science 308, 1635–1638.
Elia M (2005). Insights into energy requirements in disease. PublicHealth Nutr 8, 1037–1052.
Elia M, Folmer P, Schlatmann A, Goren A, Austin S (1988).Carbohydrate, fat, and protein metabolism in muscle and in thewhole body after mixed meal ingestion. Metabolism 37, 542–551.
Elia M, Jones MG, Jennings G, Poppitt SD, Fuller NJ, Murgatroyd PRet al. (1995). Estimation of energy expenditure from specificactivity of urine urea during lengthy subcutaneous NaH14CO3infusion. Am J Physiol 269, E172–E182.
Elia M, Livesey G (1988). Theory and validity of indirect calorimetryduring net lipid synthesis. Am J Clin Nutr 47, 591–607.
Elia M, Livesey G (1992). Energy expenditure and fuel selection inbiological systems: the theory and practice of calculations basedon indirect calorimetry and tracer methods. World Rev Nutr Diet70, 68–131.
Elia M, Stratton R, Stubbs J (2003). Techniques for the study of energybalance in man. Proc Nutr Soc 62, 529–537.
Englyst HN, Cummings JH (1987). Digestion of polysaccharidesof potato in the small intestine of man. Am J Clin Nutr 45,423–431.
Englyst KN, S Liu, Englyst HN (2007). Nutritional characterisationand measurement of dietary carbohydrates. Eur J Clin Nutr 61(Suppl 1), S19–S39.
European Communities (1990). Directive 90/496/EEC. Nutritionlabelling for foodstuffs. Off J Eur Commun L276, 40–44.
Fanaro S, Boehm G, Garssen J, Knol J, Mosca F, Stahl B et al. (2005).Galacto-oligosaccharides and long-chain fructo-oligosaccharides asprebiotics in infant formulas: a review. Acta Paediatr Suppl 94, 22–26.
FAO (1998). Carbohydrates in human nutrition. Report of a Joint FAO/WHO Expert Consultation. FAO Food and Nutrition Paper No. 66.FAO: Rome.
FAO (2003). Food Energy—Methods of Analysis and Conversion Factors.FAO: Rome.
FAO/WHO/UNU (1985). Energy and Protein Requirements. WHO:Geneva.
FAO/WHO/UNU (2004). Human Energy Requirements. Food andNutrition Technical Series 1. FAO: Rome.
FASEB (1994). The Evaluation of the Energy of Certain Sugar Alcohols Usedas Food Ingredients. Life Science Research Office: Bethesda, MD.
Finley JW, Leveille GA (1996). Macronutrient substitutes. In:Zeigler EE, Filer LJ (eds). Present Knowledge in Nutrition. ILSI Press:Washington, DC, pp 581–595.
Flatt JP (1978). The biochemistry of energy expenditure. In: Bray GA(ed). Recent Advances in Obesity Research. Newman PublicationsLimited: London, pp 221–228.
Flatt JP (1980). Energetics of intermediary metabolism. In: Assessmentof Energy Metabolism in Health and Disease. Report of the First ROSS
Physiological aspects of energy metabolismM Elia and JH Cummings
S70
European Journal of Clinical Nutrition
Conference on Medical Research. Ross Laboratories: Columbus, OH,pp 77–87.
Flatt JP (1987). The difference in the storage capacities forcarbohydrate and for fat, and its implications in the regulationof body weight. Ann N Y Acad Sci 499, 104–123.
Flatt JP (1992). Energy costs of ATP synthesis. In: Kinney JM, TuckerHN (eds). Energy Metabolism: Tissue Determinants and CellularCorollaries. Raven Press: New York, pp 319–343.
Flickinger EA, Fahey Jr GC (2002). Pet food and feed applications ofinulin, oligofructose and other oligosaccharides. Br J Nutr 87(Suppl 2), S297–S300.
Flourie B, Florent C, Jouany JP, Thivend P, Etanchaud F, Rambaud JC(1986). Colonic metabolism of wheat starch in healthy humans.Effects on fecal outputs and clinical symptoms. Gastroenterology90, 111–119.
Francis CY, Whorwell PJ (1994). Bran and irritable bowel syndrome:time for reappraisal. Lancet 344, 39–40.
Freedman MR, King J, Kennedy E (2001). Popular diets: a scientificreview. Obes Res 9 (Suppl 1), 1S–40S.
Friedman MI, Ramirez I, Bowden CR, Tordoff MG (1990). Fuelpartitioning and food intake: role for mitochondrial fatty acidtransport. Am J Physiol 258, R216–R221.
Friedman MI, Stricker EM (1976). The physiological psychology ofhunger: a physiological perspective. Psychol Rev 83, 409–431.
Friedman MI, Tordoff MG (1986). Fatty acid oxidation and glucoseutilization interact to control food intake in rats. Am J Physiol 251,R840–R845.
Fryer JH (1958). The effects of a late-night caloric supplement uponbody weight and food intake in man. Am J Clin Nutr 6, 354–364.
Fuller NJ, Jebb SA, Laskey MA, Coward WA, Elia M (1992). Four-component model for the assessment of body composition inhumans: comparison with alternative methods and evaluation ofthe density and hydration of fat-free mass. Clin Sci 82, 687–693.
Garg A (1998). High-monounsaturated-fat diets for patients withdiabetes mellitus: a meta-analysis. Am J Clin Nutr 67, 577S–582S.
Garrow JS (1988). Obesity and Related Diseases. Churchill Livingstone:Edinburgh.
Gibney E, Elia M, Jebb SA, Murgatroyd P, Jennings G (1996). Totalenergy expenditure in patients with small cell lung cancer: resultsof a validated study using the bicarbonate-urea method. Metabo-lism 46, 1412–1417.
Gibney ER, Murgatroyd P, Wright A, Jebb S, Elia M (2003).Measurement of total energy expenditure in grossly obese women:comparison of the bicarbonate-urea method with whole-bodycalorimetry and free-living doubly labelled water. Int J Obes RelatMetab Disord 27, 641–647.
Gibson GR, Beatty ER, Wang X, Cummings JH (1995). Selectivestimulation of bifidobacteria in the human colon by oligofructoseand inulin. Gastroenterology 108, 975–982.
Gibson GR, McCartney AL, Rastall RA (2005). Prebiotics andresistance to gastrointestinal infections. Br J Nutr 93 (Suppl 1),S31–S34.
Gibson GR, Probert HM, Van Loo J, Rastall RA, Roberfroid M (2004).Dietary modulation of the human colonic microbiota: updatingthe concept of prebiotics. Nutr Res Rev 17, 259–275.
Gibson GR, Roberfroid MB (1995). Dietary modulation of the humancolonic microbiota: introducing the concept of prebiotics. J Nutr125, 1401–1412.
Gil KM, Skeie B, Kvetan V, Askanazi J, Friedman MI (1991). Parenteralnutrition and oral intake: effect of glucose and fat infusions. JPEN JParenter Enteral Nutr 15, 426–432.
Goldring JM (2004). Resistant starch: safe intakes and legal status.J AOAC Int 87, 733–739.
Gostner A, Schaffer V, Theis S, Menzel T, Luhrs H, Melcher R et al.(2005). Effects of isomalt consumption on gastrointestinal andmetabolic parameters in healthy volunteers. Br J Nutr 94, 575–581.
Haber GB, Heaton KW, Murphy D, Burroughs LF (1977). Depletionand disruption of dietary fibre. Effects on satiety, plasma-glucose,and serum-insulin. Lancet 2, 679–682.
Harper JA, Dickinson K, Brand MD (2001). Mitochondrial uncou-pling as a target for drug development for the treatment of obesity.Obes Rev 2, 255–265.
Heijnen ML, van Amelsvoort JM, Deurenberg P, Beynen AC (1998).Limited effect of consumption of uncooked (RS2) or retrograded(RS3) resistant starch on putative risk factors for colon cancer inhealthy men. Am J Clin Nutr 67, 322–331.
Henderson L, Gregory J, Irving K, Swan G (2003). The National Diet &Nutrition Survey: Adults Aged 19 to 64 Years. Energy, Protein,Carbohydrate, Fat and Alcohol Intake. The Stationery Office:London.
Heymsfield SB, Lohman TG, Wang W, Going SB (2005). Human BodyComposition, 2nd edn. Human Kinetics: Champaign, IL.
Hudson GJ, Englyst HN (1993). UK and some other countries. In:Cummings JH, Frolich W (eds). Dietary Fibre Intakes in Europe.CEC—Directorate General, Science, Research & Development:Brussels, pp 83–87.
Hylla S, Gostner A, Dusel G, Anger H, Bartram HP, Christl SU et al.(1998). Effects of resistant starch on the colon in healthyvolunteers: possible implications for cancer prevention. Am J ClinNutr 67, 136–142.
Institute of Medicine (2005). Dietary Reference Intakes for Energy,Carbohydrate, Fiber, Fat, Fatty Acids, Protein, and Amino Acids. TheNational Academies Press: Washington, DC.
Ito M, Deguchi Y, Miyamori A, Matsumoto K, Kiluchi H, MatsumotoK et al. (1990). Effects of administration of galactooligosaccharideson the human faecal microflora, stool weight and abdominalsensation. Microb Ecol Health Dis 3, 285–292.
James J, Kerr D (2005). Prevention of childhood obesity by reducingsoft drinks. Int J Obes (Lond) 29 (Suppl 2), S54–S57.
James J, Thomas P, Cavan D, Kerr D (2004). Preventing childhoodobesity by reducing consumption of carbonated drinks: clusterrandomised controlled trial. BMJ 328, 1237.
Japanese Ministry of Health and Welfare (1991). Japanese Ministryof Health and Welfare Official Notice: Evaluation of the Energy Value ofIndigestible Carbohydrates in Nutritive Foods. Docket Number Ei-shin71. Japanese Ministry of Health and Welfare: Tokyo.
Jeukendrup AE (2004). Carbohydrate intake during exercise andperformance. Nutrition 20, 669–677.
Johnson J, Vickers Z (1993). Effects of flavor and macronutrientcomposition of food servings on liking, hunger and subsequentintake. Appetite 21, 25–39.
Johnstone AM, Stubbs RJ, Harbron CG (1996). Effect of overfeedingmacronutrients on day-to-day food intake in man. Eur J Clin Nutr50, 418–430.
Kaplan RJ, Greenwood CE (2002). Influence of dietary carbohydratesand glycaemic response on subjective appetite and food intake inhealthy elderly persons. Int J Food Sci Nutr 53, 305–316.
Kaskoun MC, Johnson RK, Goran MI (1994). Comparison of energyintake by semiquantitative food-frequency questionnaire withtotal energy expenditure by the doubly labeled water method inyoung children. Am J Clin Nutr 60, 43–47.
King TS, Elia M, Hunter JO (1998). Abnormal colonic fermentation inirritable bowel syndrome. Lancet 352, 1187–1189.
Langlands SJ, Hopkins MJ, Coleman N, Cummings JH (2004).Prebiotic carbohydrates modify the mucosa associated microfloraof the human large bowel. Gut 53, 1610–1616.
Lavin JH, French SJ, Read NW (1997). The effect of sucrose- andaspartame-sweetened drinks on energy intake, hunger and foodchoice of female, moderately restrained eaters. Int J Obes RelatMetab Disord 21, 37–42.
Ledikwe JH, Blanck HM, Kettel Khan L, Serdula MK, Seymour JD,Tohill BC et al. (2006). Dietary energy density is associated withenergy intake and weight status in US adults. Am J Clin Nutr 83,1362–1368.
Lee A, Livesey G, Storey D, Zumbe A (eds). (2001). Internationalsymposium on low-digestible carbohydrates. Br J Nutr 85, S1–S64.
Levine AS, Billington CJ (1994). Appetite and Body Weight Regulation:Sugar, Fat, and Macronutrient Substitutes. CRC Press: Boca Raton, FL.
Physiological aspects of energy metabolismM Elia and JH Cummings
S71
European Journal of Clinical Nutrition
Life Sciences Research Office (1994). The Evaluation of the Energy ofCertain Sugar Alcohols used as Food Ingredients. Life Sciences ResearchOffice, Federation of American Societies for Experimental Biology.Bethesda, MD.
Lissner L, Levitsky DA, Strupp BJ, Kalkwarf HJ, Roe DA (1987).Dietary fat and the regulation of energy intake in human subjects.Am J Clin Nutr 46, 886–892.
Liu YJ, Araujo S, Recker RR, Deng HW (2003). Molecular and geneticmechanisms of obesity: implications for future management. CurrMol Med 3, 325–340.
Livesey G (1984). The energy equivalents of ATP and the energyvalues of food proteins and fats. Br J Nutr 51, 15–28.
Livesey G (1986). ATP yields from proteins, fats and carbohydratesand mitochondrial efficiency in vivo. In: Barry EM, Blondheim SH,Eliahou HE, Shafir E (eds). Recent Advances in Obesity Research. V.John Libbey: London, Paris.
Livesey G (1991). Calculating the energy values of foods: towardsnew empirical formulae based on diets with varied intakes ofunavailable complex carbohydrates. Eur J Clin Nutr 45, 1–12.
Livesey G (1992). The energy values of dietary fibre and sugaralcohols for man. Nutr Res Rev 5, 61–84.
Livesey G (2001). A perspective on food energy standards fornutrition labelling. Br J Nutr 85, 271–287.
Livesey G (2002). Thermogenesis associated with fermentablecarbohydrate in humans, validity of indirect calorimetry, andimplications of dietary thermogenesis for energy requirements,food energy and body weight. Int J Obes Relat Metab Disord 26,1553–1569.
Livesey G (2003a). Analytical issues in food energy and composition.Energy in food labeling—including regulatory and trade issues.Posited with FAO.
Livesey G (2003b). Health potential of polyols as sugar replacers,with emphasis on low glycaemic properties. Nutr Res Rev 16,163–191.
Livesey G, Elia M (1985). Food energy values for artificial feeds forman. Clin Nutr 4, 99–111.
Livesey G, Elia M (1988). Estimation of energy expenditure, netcarbohydrate oxidation and net fat oxidation and synthesis byindirect calorimetry. Evaluation of some errors with specialreference to the detailed composition of fuels. Am J Clin Nutr 47,608–623.
Livesey G, Elia M (1995). Short chain fatty acids as an energy sourcein the colon: metabolism and clinical implications. In: CummingsJH, Rombeau JL, Sakata TT (eds). Physiological and Clinical Aspectsof Short Chain Fatty Acids. Cambridge University Press: Cambridge,pp 1427–1482.
Livingstone MB, Black AE (2003). Markers of the validity of reportedenergy intake. J Nutr 133 (Suppl 3), 895S–920S.
Longstreth GF, Thompson WG, Chey WD, Houghton LA, Mearin F,Spiller RC (2006). Functional bowel disorders. Gastroenterology130, 1480–1491.
Ludwig DS (2003). Dietary glycemic index and the regulation of bodyweight. Lipids 38, 117–121.
Macfarlane GT, Cummings JH (1991). The colonic flora, fermenta-tion and large bowel digestive function. In: Phillips SF, PembertonJH, Shorter RG (eds). The Large Intestine: Physiology, Pathophysiologyand Disease. Raven Press: New York, pp 51–92.
Macfarlane S, Macfarlane GT (2004). Bacterial diversity in the humangut. Adv Appl Microbiol 54, 261–289.
Macfarlane S, Macfarlane GT, Cummings JH (2006). Prebiotics in thegastrointestinal tract. Aliment Pharmacol Ther 24, 701–714.
Mattes R (2006). Fluid calories and energy balance: the good, the bad,and the uncertain. Physiol Behav 89, 66–70.
Mattes RD (1996). Dietary compensation by humans for supple-mental energy provided as ethanol or carbohydrate in fluids.Physiol Behav 59, 179–187.
Matthews SB, Waud JP, Roberts AG, Campbell AK (2005). Systemiclactose intolerance: a new perspective on an old problem. PostgradMed J 81, 167–173.
Mayer J (1955). Regulation of energy intake and the body weight: theglucostatic theory and the lipostatic hypothesis. Ann N Y Acad Sci63, 15–43.
Mazlam N (2001). Effect of Fat and Carbohydrate on Energy Intake andMacronutrient Selection in Humans. PhD thesis, University ofAberdeen.
Merill AL, Watt BK (1973). Energy Value of Foods: Basis and Derivation.United States Department of Agriculture: Washington, DC.
Miller JB, McVeagh P (1999). Human milk oligosaccharides: 130reasons to breast-feed. Br J Nutr 82, 333–335.
Montalto M, Curigliano V, Santoro L, Vastola M, Cammarota G,Manna R et al. (2006). Management and treatment of lactosemalabsorption. World J Gastroenterol 12, 187–191.
Mowat F (1981). People of the Deer. Seal Books: Toronto.Nanda R, James R, Smith H, Dudley CR, Jewell DP (1989).
Food intolerance and the irritable bowel syndrome. Gut 30,1099–1104.
Nasrallah SM, Iber FL (1969). Mannitol absorption and metabolismin man. Am J Med Sci 258, 80–88.
Nightingale JM, Kamm MA, van der Sijp JR, Ghatei MA, Bloom SR,Lennard-Jones JE (1996). Gastrointestinal hormones in shortbowel syndrome. Peptide YY may be the ‘colonic brake’ to gastricemptying. Gut 39, 267–272.
Nishida C, Uauy R, Kumanyika S, Shetty P (2004). The joint WHO/FAO expert consultation on diet, nutrition and the prevention ofchronic diseases: process, product and policy implications. PublicHealth Nutr 7, 245–250.
Painter NS, Almeida AZ, Colebourne KW (1972). Unprocessedbran in treatment of diverticular disease of the colon. BMJ 2,137–140.
Paton NI, Angus B, Chaowagul W, Simpson AJ, Suputtamongkol Y,Elia M et al. (2001). Protein and energy metabolism in chronicbacterial infection: studies in melioidosis. Clin Sci (Lond) 100,101–110.
Paton NI, Elia M, Jebb SA, Jennings G, Macallan DC, Griffin GE(1996). Total energy expenditure and physical activity measuredwith the bicarbonate-urea method in patients with humanimmunodeficiency virus infection. Clin Sci (Lond) 91, 241–245.
Paul AA, Southgate DAT (1978). McCance and Widdowson’s TheComposition of Foods, 4th edn. HMSO: London.
Pawlak DB, Ebbeling CB, Ludwig DS (2002). Should obese patients becounselled to follow a low-glycaemic index diet? Yes. Obes Rev 3,235–243.
Phillips J, Muir JG, Birkett A, Lu ZX, Jones GP, O’Dea K et al. (1995).Effect of resistant starch on fecal bulk and fermentation-depen-dent events in humans. Am J Clin Nutr 62, 121–130.
Pool-Zobel BL (2005). Inulin-type fructans and reduction in coloncancer risk: review of experimental and human data. Br J Nutr 93(Suppl 1), S73–S90.
Poppitt SD, Prentice AM (1996). Energy density and its role in thecontrol of food intake: evidence from metabolic and communitystudies. Appetite 26, 153–174.
Poppitt SD (1995). Energy density of diets and obesity. Int J Obes RelatMetab Disord 19 (Suppl 5), S20–S26.
Poppitt SD, Livesey G, Faulks RM, Roe M, Prentice AM, Elia M (1996).Circadian patterns of total 24-h hydrogen and methane excretionin humans ingesting nonstarch polysaccharide (NSP) diets and theimplications for indirect calorimetric and D2 18O methodologies.Eur J Clin Nutr 50, 524–534.
Porikos KP, Booth G, Van Itallie TB (1977). Effect of covert nutritivedilution on the spontaneous food intake of obese individuals: apilot study. Am J Clin Nutr 30, 1638–1644.
Porikos KP, Hesser MF, van Itallie TB (1982). Caloric regulation innormal-weight men maintained on a palatable diet of conven-tional foods. Physiol Behav 29, 293–300.
Prentice AM (1990). The doubly-labelled water method for measur-ing energy expenditure. Technical recommendations for use inhumans: a consensus report by the IDECG Working GroupInternational Atomic Energy Agency NAHRES-4.
Physiological aspects of energy metabolismM Elia and JH Cummings
S72
European Journal of Clinical Nutrition
Prentice AM, Poppitt SD (1996). Importance of energy density andmacronutrients in the regulation of energy intake. Int J Obes RelatMetab Disord 20 (Suppl 2), S18–S23.
Pullicino E, Elia M (1991). Intravenous carbohydrate over-feeding: amethod for rapid nutritional repletion. Clin Nutr 10, 146–154.
Raben A (2002). Should obese patients be counselled to follow a low-glycaemic index diet? No. Obes Rev 3, 245–256.
Raben A, Agerholm-Larsen L, Flint A, Holst JJ, Astrup A (2003). Mealswith similar energy densities but rich in protein, fat, carbohydrate,or alcohol have different effects on energy expenditure andsubstrate metabolism but not on appetite and energy intake. AmJ Clin Nutr 77, 91–100.
Raben A, Macdonald I, Astrup A (1997). Replacement of dietary fat bysucrose or starch: effects on 14 d ad libitum energy intake, energyexpenditure and body weight in formerly obese and never-obesesubjects. Int J Obes Relat Metab Disord 21, 846–859.
Raben A, Tagliabue A, Christensen NJ, Madsen J, Holst JJ, Astrup A(1994). Resistant starch: the effect on postprandial glycemia,hormonal response, and satiety. Am J Clin Nutr 60, 544–551.
Raben A, Vasilaras TH, Moller AC, Astrup A (2002). Sucrose comparedwith artificial sweeteners: different effects on ad libitum foodintake and body weight after 10 wk of supplementation inoverweight subjects. Am J Clin Nutr 76, 721–729.
Rabinowitch IM, Fowler AF (1934). Dinitrophenol. Can Med Assoc J30, 128–133.
Remesy C, Demigne C, Morand C (1995). Metabolism of short-chainfatty acids in the liver. In: Cummings JH, Rombeau JL, Sakata T(eds). Physiological and Clinical Aspects of Short-Chain Fatty Acids.Cambridge University Press: Cambridge, pp 171–190.
Roberfroid M (2005). Inulin-Type Fructans. Functional Food Ingredients.CRC Press: Boca Raton, FL.
Rodin J (1990). Comparative effects of fructose, aspartame, glucose,and water preloads on calorie and macronutrient intake. Am J ClinNutr 51, 428–435.
Rogers PJ, Carlyle JA, Hill AJ, Blundell JE (1988). Uncoupling sweettaste and calories: comparison of the effects of glucose and threeintense sweeteners on hunger and food intake. Physiol Behav 43,547–552.
Rolls BJ (1997). Fat and sugar substitutes and the control of foodintake. In: Rolls BJ, Anderson, GH, Steffen DG (eds). NutritionalImplications of Macronutrient Substitutes. New York Academy ofSciences: New York, NY, pp 180–193.
Rolls BJ, Bell EA (1999). Intake of fat and carbohydrate: role of energydensity. Eur J Clin Nutr 53 (Suppl 1), S166–S173.
Rumpler WV, Baer DJ, Rhodes DG (1998). Energy available from cornoil is not different than that from beef tallow in high- or low-fiberdiets fed to humans. J Nutr 128, 2374–2382.
Russek M (1963). Participation of hepatic glucoreceptors in thecontrol of intake of food. Nature 197, 79–80.
Russek M (1976). Hepatic glucoreceptors in the short-term control offeeding. Acta Physiol Pol 27, 147–156.
Sanchez-Catillo C, Grubb D, Solano ML, Franklin F, James WPT(1997). Non-starch polysaccharide intakes in Mexican villagersand residents of Mexico City. Br J Nutr 77, 345–357.
Saris WH, Astrup A, Prentice AM, Zunft HJ, Formiguera X,Verboeket-van de Venne WP et al. (2000). Randomized controlledtrial of changes in dietary carbohydrate/fat ratio and simple vscomplex carbohydrates on body weight and blood lipids:the CARMEN study. The Carbohydrate Ratio Managementin European National diets. Int J Obes Relat Metab Disord 24,1310–1318.
Schulz AR (1975). Computer-based method for calculation of theavailable energy of proteins. J Nutr 105, 200–207.
Schulz AR (1978). Simulation of energy metabolism in the simple-stomached animal. Br J Nutr 39, 235–254.
Schulze MB, Manson JE, Ludwig DS, Colditz GA, Stampfer MJ, WillettWC et al. (2004). Sugar-sweetened beverages, weight gain, andincidence of type 2 diabetes in young and middle-aged women.JAMA 292, 927–934.
Sclafani A (1987). Carbohydrate-induced hyperphagia and obesity inthe rat: effects of saccharide type, form, and taste. NeurosciBiobehav Rev 11, 155–162.
Sclafani A (2001). Psychobiology of food preferences. Int J Obes RelatMetab Disord 25 (Suppl 5), S13–S16.
Shetty PS, Prentice AM, Goldberg GR, Murgatroyd PR, McKenna AP,Stubbs RJ et al. (1994). Alterations in fuel selection and voluntaryfood intake in response to isoenergetic manipulation of glycogenstores in humans. Am J Clin Nutr 60, 534–543.
Siavoshian S, Segain JP, Kornprobst M, Bonnet C, Cherbut C,Galmiche JP et al. (2000). Butyrate and trichostatin A effects onthe proliferation/differentiation of human intestinal epithelialcells: induction of cyclin D3 and p21 expression. Gut 46, 507–514.
Silvester KR, Bingham SA, Pollock JR, Cummings JH, O’Neill IK(1997). Effect of meat and resistant starch on fecal excretion ofapparent N-nitroso compounds and ammonia from the humanlarge bowel. Nutr Cancer 29, 13–23.
Silvester KR, Englyst HN, Cummings JH (1995). Ileal recovery ofstarch from whole diets containing resistant starch measured invitro and fermentation of ileal effluent. Am J Clin Nutr 62, 403–411.
Snitker S, Larson DE, Tataranni PA, Ravussin E (1997). Ad libitum foodintake in humans after manipulation of glycogen stores. Am J ClinNutr 65, 941–946.
Snook J, Shepherd HA (1994). Bran supplementation in thetreatment of irritable bowel syndrome. Aliment Pharmacol Ther 8,511–514.
Southgate DA (1969). Determination of carbohydrates in foods. II.Unavailable carbohydrates. J Sci Food Agric 20, 331–335.
Spengler M, Boehme K (1984). Tolerance and Acceptance of IsomaltStudy 26 report no. 13850, Wupperpal, Germany (Rn Study 26, editor:Bayer AG Pharmaceuticals Division).
Spiegelman BM, Flier JS (2001). Obesity and the regulation of energybalance. Cell 104, 531–543.
Stephen A (1993). Proprionate—sources and effect on lipid metabo-lism. In: Binder HJ, Cummings JH, Soergel KH (eds). Short-ChainFatty Acids. Falk Symposium. Kluwer Academic Publishers, Dor-drecht, pp 260–271.
Stephen AM, Cummings JH (1980). Mechanism of action of dietaryfibre in the human colon. Nature 284, 283–284.
Stephen AM, Haddad AC, Phillips SF (1983). Passage of carbohydrateinto the colon. Direct measurements in humans. Gastroenterology85, 589–595.
Stephen AM, Sieber GM, Gerster YA, Morgan DR (1995). Intake ofcarbohydrate and its components—international comparisons,trends over time, and effects of changing to low-fat diets. Am J ClinNutr 62, 851S–867S.
Stevens J (1988). Does dietary fiber affect food intake and bodyweight? J Am Diet Assoc 88, 939–942; 945.
Stock MJ (1999). Gluttony and thermogenesis revisited. Int J ObesRelat Metab Disord 23, 1105–1117.
Stollman N, Raskin JB (2004). Diverticular disease of the colon.Lancet 363, 631–639.
Stubbs J, Ferres S, Horgan G (2000). Energy density of foods: effectson energy intake. Crit Rev Food Sci Nutr 40, 481–515.
Stubbs RJ, Harbron CG, Murgatroyd PR, Prentice AM (1995a). Covertmanipulation of dietary fat and energy density: effect on substrateflux and food intake in men eating ad libitum. Am J Clin Nutr 62,316–329.
Stubbs RJ, Harbron CG, Prentice AM (1996). Covert manipulation ofthe dietary fat to carbohydrate ratio of isoenergetically dense diets:effect on food intake in feeding men ad libitum. Int J Obes RelatMetab Disord 20, 651–660.
Stubbs RJ, Hughes DA, Johnstone AM, Whybrow S, Horgan GW, KingN et al. (2004). Rate and extent of compensatory changes in energyintake and expenditure in response to altered exercise and dietcomposition in humans. Am J Physiol Regul Integr Comp Physiol286, R350–R358.
Stubbs RJ, Ritz P, Coward WA, Prentice AM (1995b). Covertmanipulation of the ratio of dietary fat to carbohydrate and
Physiological aspects of energy metabolismM Elia and JH Cummings
S73
European Journal of Clinical Nutrition
energy density: effect on food intake and energy balance in free-living men eating ad libitum. Am J Clin Nutr 62, 330–337.
Stubbs RJ, Whybrow S (2004). Energy density, diet composition andpalatability: influences on overall food energy intake in humans.Physiol Behav 81, 755–764.
Tainter ML, Stockton AB, Cutting WC (1935). Dinitrophenol in thetreatment of obesity. Final report. JAMA 105, 332–337.
Talley NJ, Spiller R (2002). Irritable bowel syndrome: a littleunderstood organic bowel disease? Lancet 360, 555–564.
Tang NL, Chung ML, Elia M, Hui E, Lum CM, Luk JK et al. (2002).Total daily energy expenditure in wasted chronic obstructivepulmonary disease patients. Eur J Clin Nutr 56, 282–287.
Taylor R, Price TB, Rothman DL, Shulman RG, Shulman GI (1992).Validation of 13C NMR measurement of human skeletal muscleglycogen by direct biochemical assay of needle biopsy samples.Magn Reson Med 27, 13–20.
Teuri U, Korpela R (1998). Galacto-oligosaccharides relieve constipa-tion in elderly people. Ann Nutr Metab 42, 319–327.
Thompson DA, Campbell RG (1977). Hunger in humans induced by2-deoxy-D-glucose: glucoprivic control of taste preference andfood intake. Science 198, 1065–1068.
Thompson DA, Welle SL, Lilavivat U, Penicaud L, Campbell RG(1982). Opiate receptor blockade in man reduces 2-deoxy-D-glucose-induced food intake but not hunger, thirst, and hypother-mia. Life Sci 31, 847–852.
Titter S, Calingasan NY (1994). Neural Substrates for Metabolic Controlof Feeding. CRC Press: Boca Raton, FL.
Todesco T, Rao AV, Bosello O, Jenkins DJ (1991). Propionate lowersblood glucose and alters lipid metabolism in healthy subjects. Am JClin Nutr 54, 860–865.
Tomlin J, Read NW (1990). The effect of resistant starch on colonfunction in humans. Br J Nutr 64, 589–595.
Tordoff MG, Alleva AM (1990a). Effect of drinking soda sweetenedwith aspartame or high-fructose corn syrup on food intake andbody weight. Am J Clin Nutr 51, 963–969.
Tordoff MG, Alleva AM (1990b). Oral stimulation with aspartameincreases hunger. Physiol Behav 47, 555–559.
Tremblay A (1992). Human obesity: a defect in lipid oxidation or inthermogenesis? Int J Obes Relat Metab Disord 16, 953–957.
Tremblay A, Lavallee N, Almeras N, Allard L, Despres JP, Bouchard C(1991). Nutritional determinants of the increase in energy intakeassociated with a high-fat diet. Am J Clin Nutr 53, 1134–1137.
Truswell AS, Seach JM, Thorburn AW (1988). Incomplete absorptionof pure fructose in healthy subjects and the facilitating effect ofglucose. Am J Clin Nutr 48, 1424–1430.
van Dokkum W, Wezendonk B, Srikumar TS, van den Heuvel EG(1999). Effect of nondigestible oligosaccharides on large-bowelfunctions, blood lipid concentrations and glucose absorption inyoung healthy male subjects. Eur J Clin Nutr 53, 1–7.
van Loo J, Coussement P, de Leenheer L, Hoebregs H, Smits G(1995). On the presence of inulin and oligofructose asnatural ingredients in the western diet. Crit Rev Food Sci Nutr 35,525–552.
van Munster IP, Tangerman A, Nagengast FM (1994). Effect ofresistant starch on colonic fermentation, bile acid metabolism,and mucosal proliferation. Dig Dis Sci 39, 834–842.
van Stratum P, Lussenburg RN, van Wezel LA, Vergroesen AJ, CremerHD (1978). The effect of dietary carbohydrate: fat ratio on energyintake by adult women. Am J Clin Nutr 31, 206–212.
Warren JM, Henry CJ, Simonite V (2003). Low glycemic indexbreakfasts and reduced food intake in preadolescent children.Pediatrics 112, e414.
Warwick PM, Baines J (2000). Point of view: energy factors for foodlabelling and other purposes should be derived in a consistentfashion for all food components. Br J Nutr 84, 897–902.
Welle SL, Thompson DA, Campbell RG, Lilavivathana U (1980).Increased hunger and thirst during glucoprivation in humans.Physiol Behav 25, 397–403.
Westerterp KR, Goris AH (2002). Validity of the assessment of dietaryintake: problems of misreporting. Curr Opin Clin Nutr Metab Care 5,489–493.
Westerterp-Plantenga MS (2001). Analysis of energy density of foodin relation to energy intake regulation in human subjects. Br J Nutr85, 351–361.
Weststrate JA (1992). Effect of Nutrients on the Regulation of Food Intake.Unilever Vlaardingen, The Netherlands.
WHO (2003). Diet, nutrition and the prevention of chronic diseases.Report of a Joint WHO/FAO Expert Consultation. WHO TechnicalReport Series No. 916. World Health Organization: Geneva.
Williams CM, Jackson KG (2002). Inulin and oligofructose: effects onlipid metabolism from human studies. Br J Nutr 87 (Suppl 2),S261–S264.
Yu-Poth S, Zhao G, Etherton T, Naglak M, Jonnalagadda S, Kris-Etherton PM (1999). Effects of the national cholesterol educationprogram’s step I and step II dietary intervention programs oncardiovascular disease risk factors: a meta-analysis. Am J Clin Nutr69, 632–646.
Zittermann A, Bock P, Drummer C, Scheld K, Heer M, Stehle P (2000).Lactose does not enhance calcium bioavailability in lactose-tolerant, healthy adults. Am J Clin Nutr 71, 931–936.
Physiological aspects of energy metabolismM Elia and JH Cummings
S74
European Journal of Clinical Nutrition