Embed Size (px)
Citation preview
Physiological effects of tapering in highly trained athletes
B. SHEPLEY, J. D. MAcDOUGALL, N. CIPRIANO, J. R. SUTTON, M. A. TARNOPOLSKY, AND G. COATES Departments of Physical Education and Medicine, McMaster University, Hamilton, Ontario L8S 4K1, Canada
SHEPLEY, B., J. D. MACDOUGALL, N. CIPRIANO, J. R. SUTTON, M. A. TARNOPOLSKY, AND G. COATES. PhysioZogicaZ effects of tapering in highly trained athletes. J. Appl. Physiol. 72(2): 706-711,1992.-This study examined some of the physio- logical and performance effects of three different tapers in highly trained athletes. After 8 wk of training, nine male mid- dle-distance runners were randomly assigned to one of three different 7-day tapers: a high-intensity low-volume taper (HIT), a low-intensity moderate-volume taper (LIT), or a rest- only taper (ROT). After the first taper, subjects resumed train- ing for 4 wk and performed a second taper and then resumed training for 4 wk and completed the remaining taper, so that each subject underwent all three tapers. Performance was mea- sured before and after each taper by a treadmill run to fatigue at a velocity equivalent each subject’s best 1,500-m time. Volun- tary isometric strength and evoked contractile properties of the quadriceps were measured before and after each taper, as were muscle glycogen concentration and citrate synthase activity (from needle biopsies) and total blood and red cell volume by 1251 and 51Cr tagging. Maximal 0, consumption was unaffected by all three tapers, but running time to fatigue increased signifi- cantly after HIT (+22%). It was unaffected by LIT (+6%) and ROT (-3%) procedure. Citrate synthase activity increased sig- nificantly with HIT and decreased significantly with ROT. Muscle glycogen concentration increased significantly after ROT and HIT, and strength increased after all three tapers. Total blood volume increased significantly after HIT and de- creased after ROT. Red cell volume also increased significantly after HIT. We conclude that highly trained middle-distance runners can improve their performance as a result of a taper where intensity is maintained and volume greatly reduced. The improvement may be due to increased oxidative enzyme activ- ity and/or increases in blood and red cell volume.
reduced training; training volume; training intensity; blood vol- ume; running performance; fatigue
TAPER is the term commonly used to describe a reduction in training before competition. It is believed by many athletes and coaches that, after a period of high-intensity and/or high-volume training, performance on a given oc- casion can be enhanced if it is preceded by a brief period in which the training load is sharply reduced. Athletes frequently describe this period as a stage of “overcom- pensation” or “supercompensation,” and it has become common practice to incorporate a taper over several or more days before a major competition. Despite the wide acceptance of this practice and numerous anecdotal ac- counts attesting to its effectiveness, little is known re-
garding the physiological changes that occur as the result of a taper.
Although there have been several investigations of the effects of reduced training by trained athletes (7,17) and controls (14, 15) and of detraining by previously trained subjects (8, 9), such manipulations are more chronic in nature and do not mimic the short-term reduction in training employed by athletes immediately before an im- portant competition. Theoretically, training load could be reduced by decreasing training volume, training in- tensity, or any combination of the two. To our knowl- edge, the effectiveness of different types of taper on per- formance has not been systematically investigated. Until knowledge of the physiological effects of the taper pro- cess is available, fundamental questions regarding the optimum duration for the taper, the optimum combina- tion of intensity vs. volume, or alteration of the taper for different sports must remain unanswered.
The primary purpose of this study was to investigate some of the physiological and performance effects of a 7-day training taper by highly trained middle-distance runners. An additional purpose was to examine the effec- tiveness of different types of taper on performance of these athletes. These included a taper where both train- ing intensity and volume were reduced, a taper where training intensity was maintained but volume sharply reduced, and a rest-only taper where the athletes did no training over the 7 days before testing.
METHODS
Subjects. Nine highly trained cross-country and mid- dle-distance runners served as subjects. They were all members of the McMaster University cross-country and/or track teams and competed in both sports. Data were collected over the 5-mo period between the end of the fall cross-country season and the beginning of the summer track season. All subjects were fully informed of the purposes of the study and the associated risks as required by the Human Ethics Committee of McMaster University. Subjects ranged in age from 21 to 24 yr and in maximal 0, consumption (V02,,,) from 66 to 71 ml l kg-l l min.
Design. Subjects trained intensively six times per week for 8 wk. During the final 2 wk of this training period, their running volume was 80 km/wk. Approximately one-third of this distance was comprised of high-inten-
706 0161-7567/92 $2.00 Copyright 0 1992 the American Physiological Society
TAPERING BY TRAINED ATHLETES 707
sity (95100% VO 2 ,,) interval running. and the re- mainder by continuous running at -73% VO, m8X. Inter- vals consisted of distances of 800-1,200 m followed by ~3 min of recovery and were performed two or three times per week. Subjects were then randomly assigned to one of three different 7-day taper procedures. The study employed a repeated-measures design so that each sub- ject performed each of the three tapers, separated by 4 wk of training. Thus, after the first taper, subjects re- sumed training for 4 wk and performed a second taper and then resumed training for 4 wk and performed the remaining taper. The 4-wk training schedules were iden- tical to that of the 4 wk preceding the first taper.
The taper procedures included a high-intensity (low- volume) taper, a low-intensity taper, and a rest-only taper. Subjects did not train on day 1 or 6 of the two exercise tapers. The high-intensity taper (HIT) con- sisted of a series of intense 500-m intervals over 5 days. Training on each day was preceded by an 800-m jog at -50% V0 2 max and standard stretching exercises. Each 500-m interval was completed in 70-76 s (equivalent to 115-120% ire 2maK) and separated by a 6- to ‘I-min walk- ing recovery. Five repeats were performed on the 1st day, four on the 2nd day, three on the 3rd day, and so on for a total 5-day running volume of 7.5 km (not including the distance covered in warm-up).
The low-intensity taper (LIT) consisted of continuous running at a pace equivalent to 57-60% i702max during each of the 5 days of the taper. On the 1st day subjects ran 10 km, and on each successive day they reduced this distance by 20% (2 km), for a total 5-day running volume of 30 km (not including warmup). For the rest-only taper (ROT), subjects did no running over the 6-day pe- riod. All training and tapering sessions were directly su- pervised by the university cross-country coach, a co-in- vestigator for the study.
The measurement sequence for each taper period was as follows. 1) After a normal training day, subjects re- frained from training for 1 day, during which measure- ments of voluntary and evoked strength and an estimate of total blood volume were made. 2) On the following day, a needle biopsy was taken from the vastus lateralis using the Bergstrom technique (3) and subjects performed a treadmill run to exhaustion. 3) Over the next 5 days, they then participated in one of the three designated taper procedures. 4) On day 6, no exercise was performed and strength and blood volume measures were repeated as above. 5) On day 7, a posttaper needle biopsy sample was taken and the treadmill run to exhaustion was repeated. All pre- and posttaper measurements were made at the same time of day (+30 min). Subjects were instructed to maintain the same diets and energy intakes over all three tapers.
Measurements. The criterion running performance test was a timed run to exhaustion on a level treadmill at a constant velocity equivalent to each athlete’s average running velocity for his best 1,500-m race of that year. On the basis of the prediction equation of McMiken and Daniels (20), this velocity represented an energy require- ment equivalent to ~115% VO, max. Before the test, sub- jects performed a standard warm-up on the treadmill (12 min at 6 mph) and 3 min of stretching. They then stepped
onto the treadmill, which was rotating at the preset veloc- ity; timing began when they released their grasp of the handrail and terminated when they regrasped the hand- rail or began to stumble. Heart rate was continuously recorded throughout the test, as was 0, uptake (VO,) by means of a computerized open-circuit system that calcu- lated VO, on-line every 20 s. Subjects received verbal en- couragement throughout the run but were not allowed to view a clock or to receive any feedback regarding their performance times until completion of the entire study. Five minutes after termination of the test, a blood sam- ple was taken by venipuncture for determination of plasma lactate concentration. Before the first taper, all subjects had performed the test on at least four occasions and were thus thoroughly familiar with the procedure.
Total blood volume was assessed on the nonexercise day before and after each taper by radioactive (1251) albu- min tagging and red cell volume by 51Cr tagging. Hemo- globin and hematoc after each taper.
rit were also determined before and
The needle biopsy samples taken before and after each taper were directly frozen in liquid nitrogen and subse- quently assayed for glycogen concentration (2) and ci- trate synthase activity (19). One subject refused to un- dergo the biopsy procedure on his final taper but com- pleted all other aspects of the study. Muscle data are thus confined to eight subjects.
Maximum voluntary isometric strength andpercutane- ously nerve-stimulated evoked contractile properties of the right knee extensors were measured on a custom- made dynamometer as previously described (22). Evoked contractile measurements included peak twitch torque, time to peak torque, and half-relaxation time. In addi- tion, the extent of voluntary motor unit activation was measured by the interpolated twitch method (1). For this method, a supramaximal stimulus is delivered during a maximum voluntary contraction and the magnitude of the interpolated twitch, compared with that evoked at rest, is used to calculate motor unit activation.
Statistical significance was determined by analysis of variance with a repeated-measures design. When a signif- icant main effect was detected, data were further ana- lyzed with a Tukey post hoc analysis with P < 0.05 set as the acceptable level of significance.
RESULTS
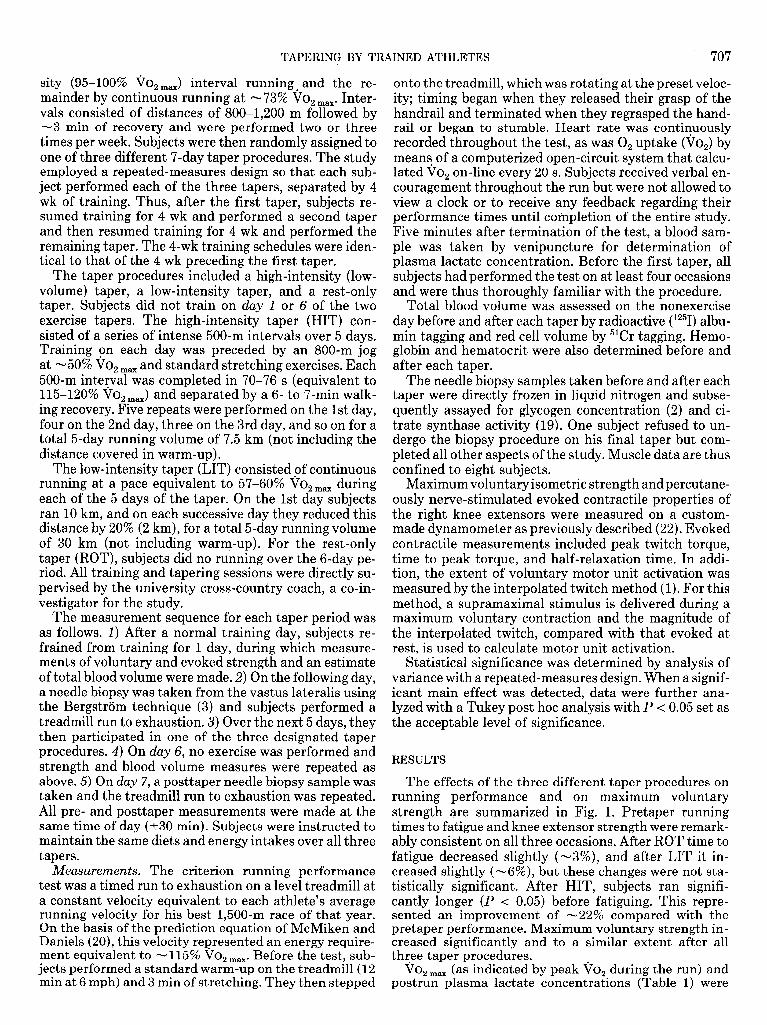
The effects of the three different taper procedures on running performance and on maximum voluntary strength are summarized in Fig. 1. Pretaper running times to fatigue and knee extensor strength were remark- ably consistent on all three occasions. After ROT time to fatigue decreased slightly (-3%), and after LIT it in- creased slightly (-6%), but these changes were not sta- tistically significant. After HIT, subjects ran signifi- cantly longer (P < 0.05) before fatiguing. This repre- sented an improvement of ~22% compared with the pretaper performance. Maximum voluntary strength in- creased significantly and to a similar extent after all three taper procedures. 1 vo 211aax (as indicated by peak VO, during the run) and postrun plasma lactate concentrations (Table 1) were
708 TAPERING BY TRAINED ATHLETES
400 - ci Q)
f 300 3 c9 i= 4 200 um 0 I-- 100 W =E F
r
,c
L
\ Aert Only I Low lntenslty Taper ~ C High lntenalty Taper
F 350 z
z
: 3oo z F x 250 W
iii 2 200 -
Pre Post Taper Taper
Pr0 Post Taper Taper
Pre Post Taper Taper
FIG. 1. Performance characteristics before and after each taper procedure (n = 9). Top: time to fatigue during treadmill running at a velocity equivalent to each subject’s best 1,500-m time. Bottom: maxi- mum voluntary isometric strength for knee extensors of 1 leg. Values are means * SD. * Significant pre- to posttaper differences, P < 0.05.
not affected by any of the taper procedures. Peak twitch torque was -10,19, and 13% higher and motor unit acti- vation -0.5, 1.5, and 0.5% higher after ROT, LIT, and HIT, respectively, but these changes were not statisti- cally significant.
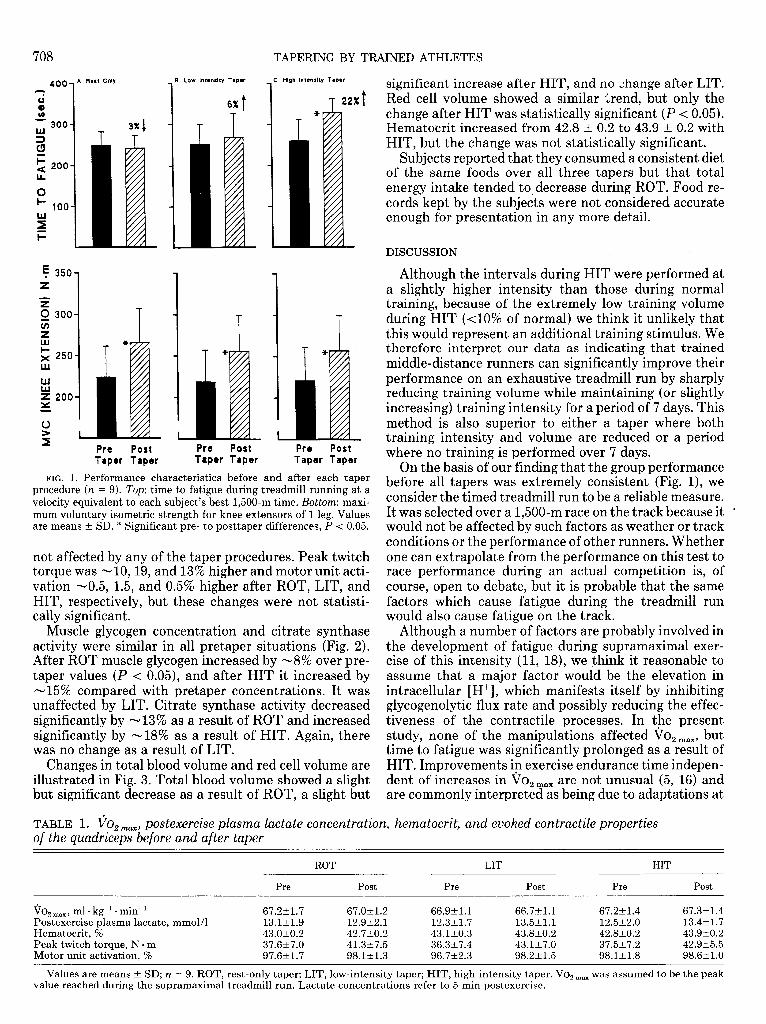
Muscle glycogen concentration and citrate synthase activity were similar in all pretaper situations (Fig. 2). After ROT muscle glycogen increased by -8% over pre- taper values (P < 0.05), and after HIT it increased by -15% compared with pretaper concentrations. It was unaffected by LIT. Citrate synthase activity decreased significantly by -13% as a result of ROT and increased significantly by -18% as a result of HIT. Again, there was no change as a result of LIT.
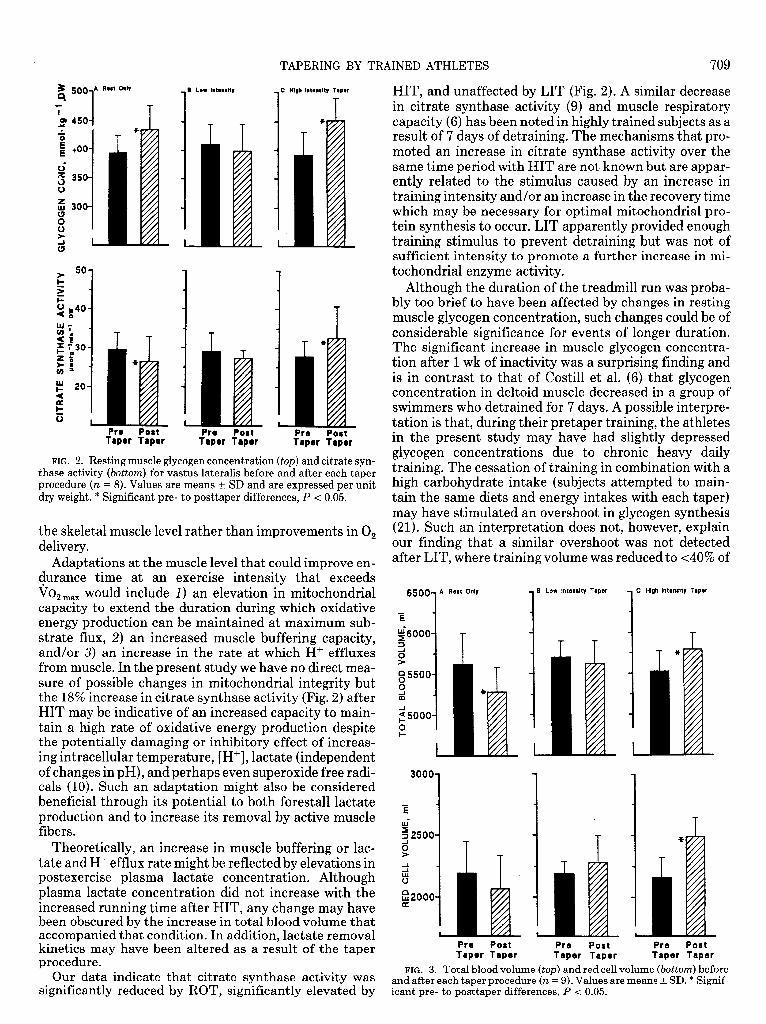
Changes in total blood volume and red cell volume are illustrated in Fig. 3. Total blood volume showed a slight but significant decrease as a result of ROT, a slight but
significant increase after HIT, and no Lhange after LIT. Red cell volume showed a similar Lrend, but only the change after HIT was statistically significant (P < 0.05). Hematocrit increased from 42.8 t 0.2 to 43.9 t 0.2 with HIT, but the change was not statistically significant.
Subjects reported that they consumed a consistent diet of the same foods over all three tapers but that total energy intake tended to decrease during ROT. Food re- cords kept by the subjects were not considered accurate enough for presentation in any more detail.
DISCUSSION
Although the intervals during HIT were performed at a slightly higher intensity than those during normal training, because of the extremely low training volume during HIT (~10% of normal) we think it unlikely that this would represent an additional training stimulus. We therefore interpret our data as indicating that trained middle-distance runners can significantly improve their performance on an exhaustive treadmill run by sharply reducing training volume while maintaining (or slightly increasing) training intensity for a period of 7 days. This method is also superior to either a taper where both training intensity and volume are reduced or a period where no training is performed over 7 days.
On the basis of our finding that the group performance before all tapers was extremely consistent (Fig. I), we consider the timed treadmill run to be a reliable measure. It was selected over a 1,500-m race on the track because it would not be affected by such factors as weather or track conditions or the performance of other runners. Whether one can extrapolate from the performance on this test to race performance during an actual competition is, of course, open to debate, but it is probable that the same factors which cause fatigue during the treadmill run would also cause fatigue on the track.
Although a number of factors are probably involved in the development of fatigue during supramaximal exer- cise of this intensity (11, 18), we think it reasonable to assume that a major factor would be the elevation in intracellular [H+], which manifests itself by inhibiting glycogenolytic flux rate and possibly reducing the effec- tiveness of the contractile processes. In the present study, none of the manipulations affected Vozmax, but time to fatigue was significantly prolonged as a result of HIT. Improvements in exercise endurance time indepen- dent of increases in Vozrnax are not unusual (5, 16) and are commonly interpreted as being due to adaptations at
TABLE 1. vOzmaX, postexercise plasma lactate concentration, hematocrit, and evoked contractile properties of the quadriceps before and after taper
ROT LIT HIT
Pre Post Pre Post Pre Post
i'o, max, ml. kg-’ l min-’ 67.2t1.7 67.0t1.2 66.9kl.l 66.7tl.l 67.2t1.4 67.3k1.4 Postexercise plasma lactate, mmol/l 13.lrt1.9 12.9t2.1 12.3t1.7 13.5tl.l 12.5+2.0 13.4t1.7 Hematocrit, % 43.0k0.2 42.7t0.2 43.1t0.3 43.8t0.2 42.8t0.2 43.9t0.2 Peak twitch torque, N l m 37.6k7.0 41.3t7.5 36.3k7.4 43.127.0 37.5k7.2 42.9k5.5 Motor unit activation, % 97.6t1.7 98.1t1.3 96.7k2.3 98.2t1.5 98.1t1.8 98.6kl.O
Values are means t SD; n = 9. ROT, rest-only taper; LIT, low-intensity taper; HIT, high-intensity taper. VO, max was assumed to be the peak value reached during the supramaximal treadmill run. Lactate concentrations refer to 5 min postexercise.
TAPERING BY TRAINED ATHLETES 709
g 500 A Root Only I Low Intonrity C High Intonrity Tapor
. w
I 1 T 1 1 T
s;
GO g-P NO v)”
r 20 4
e G
PI. POM Pr. Port Pro Taper Taper
Post Taper Taper Taper Taper
FIG . 2. Resting muscle glycogen concentration thase activity (bottom) for vastus lateralis before
(top) and citrate syn- and after each taper
procedure (n = 8). Values are means t SD and are expressed per unit dry weight. * Significant pre- to posttaper difference&P < 0.65.
the skeletal muscle level rather than improvements in 0, delivery.
Adaptations at the muscle level that could improve en- durance time at an exercise intensity that exceeds . vo 2 max would include 1) an elevation in mitochondrial capacity to extend the duration during which oxidative energy production can be maintained at maximum sub- strate flux, 2) an increased muscle buffering capacity, and/or 3) an increase in the rate at which H+ effluxes from must le. In the pre sent st ‘udy we have no direct mea- sure of possible changes in mitochondrial integrity but the 18% increase in citrate synthase activity (Fig. 2) after HIT may be indicative of an increased capacity to main- tain a high rate of oxidative energy production despite the potentially damaging or inhibitory effect of increas- ing intracellular temperature, [H+], lactate (independent of changes in pH), and perhaps even superoxide free radi- cals (10). Such an adaptation might also be considered beneficial through its potential to both forestall lactate production and to increase its fibers.
removal by active muscle
Theoretically, an increase in muscle buffering or lac- tate and H+ efflu .x rate might be reflected by elevations in postexercise plasma lactate concentration. Although plasma lactate concentration did not increase with the increased running time after HIT, any change may have been obscured by the increa se in total blood volume that accompanied that condition . . In a .ddition, lactate removal kinetics may have been altered as a result of the taper procedure.
Our data indicate that citrate synthase activity was significantlv reduced bv ROT. significantlv elevated bv
HIT, and unaffected by LIT (Fig. 2). A similar decrease in citrate synthase activity (9) and muscle respiratory capacity (6) has been noted in highly trained subjects as a result of 7 days of d .etraining. The mechanisms that pro- moted an increase in citrate synthase activity over the same time period with HIT are not known but are appar- ently related to the stimulus caused by an increase in training intensity and/or an increase in the recovery time which may be necessary for optimal mitochondrial pro- tein synthesis to occur. LIT apparently provided enough training stimulus to prevent detraining but was not of sufficient intensity to promote a further increase in mi- tochondrial enzyme activity.
Although the duration of the treadmill run was proba- bly too brief to have been affected by changes in resting muscle glycogen concentration, such changes could be of considerable significance for events of longer duration. The significant increase in muscle glycogen concentra- tion after 1 wk of inactivity was a surprising finding and is in contrast to that of Costill et al. (6) that glycogen concentration in deltoid muscle decreased in a group of swimmers who detrained for 7 days. A possible interpre- tation is that, during their pretaper training, the athletes in the present study may have had slightly depressed glycogen concentrations due to chronic heavy daily training. The cessation of training in combination with a high carbohydrate intake (subjects attempted to main- tain the same diets and energy intakes with each taper) may have stimulated an overshoot in glycogen synthesis (21). Such an interpretation does not; however, explain our finding that a similar overshoot was not detected after LIT, where training volume was reduced to ~40% of
6500
1 A Rbrt Only
1 8 Low lntenslty Taper
1 C High lntenslty Taper
3 1 1 1 %6000- 3 6 >
$j 5500- 0 iii
fj 5000-
?
Pro Post Pre Post Taper Taper Taper Taper
Pro Post Taper Taper
FIG. 3. Total blood volume (top) and red cell volume (bottom) before and after each taper procedure (n = 9). Values are means f. SD. * Signif- icant nre- to nosttaper differences. P < 0.05.
710 TAPERING BY TRAINED ATHLETES
that in the previous week. The overshoot in glycogen syn- thesis after HIT may relate to its depletion pattern dur- ing the higher intensity training as well as to the provi- sion of adequate time for glycogen resynthesis afforded by the reduced training volume.
Pretaper measurements of voluntary strength were ex- tremely consistent after each training cycle (Fig. 2). Our finding that this measure increased significantly as a re- sult of all three taper procedures (and especially after ROT) suggests that voluntary strength of the quadriceps is suppressed by chronic intensive running training but recovers when training is reduced or discontinued. A simi- lar finding has been noted in a group of swimmers who increased their power output on a biokinetic swim bench after 14 days of reduced swimming training (7). Although in the present study neither achieved statistical signifi- cance, both twitch torque and maximum motor unit acti- vation showed a tendency to increase as a result of all three tapers. We interpret this as indicating that the sup- pressed strength found during periods of intense training may be a result of both alterations at the muscle level and inhibition at the level of the central nervous system. In the present study, it is doubtful whether the changes in voluntary strength influenced running performance, since strength increased after all three tapers while per- formance was significantly improved only after HIT. Such changes could, however, have implications for shorter distance events or team sports.
Increases in total blood volume similar to those after HIT have been observed after as little as 3 days of train- ing (12) but were not accompanied by the increases in red cell volume found in the present study. This change in red cell volume was somewhat surprising, since the 6 days over which it occurred represent what is considered to be the minimal time course for maturation of erythro- cytes after initiation of hematopoiesis (4). One interpre- tation of our data is that, during periods of heavy train- ing, both red cell production rate and red cell destruction rate may be elevated (13). The sudden reduction in train- ing volume might decrease the incidence of intravascular hemolysis and improve the reticuloendothelial system’s capacity for reuptake of dying erythrocytes (13), result- ing in a transient period during which there is a net in- crease in erythrocytes. Such an explanation leads, of course, to the question as to why red cell volume did not increase as a result of the other two tapers. Perhaps the training volume in LIT was sufficient to offset this mech- anism and perhaps an increased red cell volume would have been detected after ROT had we examined blood characteristics over a shorter time period (e.g., 2-3 days). The changes in blood and red cell volume did not affect . vo 2max but may have influenced treadmill performance by altering blood buffering capacity.
In summary, our data indicate that highly trained mid- dle-distance runners can improve their performance as a result of a taper period during which training volume is greatly reduced but training intensity remains high. The improvement may be the result of an increase in muscle oxidative enzyme activity and/or an increase in blood and red cell volume. In addition, a reduction in training volume results in an increase in muscle strength and gly- cogen concentration. The reduced training volume appar-
ently allows sufficient recovery and adaptation (super- compensation) to occur, whereas the brief high-intensity training provides enough stimulus to prevent detraining. The time course, volumes, and intensities for the training tapers used in the present study were arbitrarily selected, and further investigations are warranted to determine the optimal combinations that would result in the great- est improvement in performance.
We thank the athletes who participated in this study for their pa- tience and cooperation.
This study was supported by the Applied Research Program of Sport Canada and the Natural Sciences and Engineering Research Council of Canada.
Address reprint requests to J. D. MacDougall.
Received 11 January 1991; accepted in final form 11 September 1991.
REFERENCES
1.
2.
3.
4.
5.
6.
7.
8.
9.
10.
11.
12.
13.
14.
15.
16.
17.
18.
BELANGER, A. Y., AND A. J. MCCOMAS. Extent of motor unit acti- vation during effort. J. Appl. Physiol. 51: 1131-1135, 1981. BERGMEYER, H. (Editor). Methods of Enzymatic Analysis (3rd ed.). Deerfield Beach, FL: UCH, 1985, vol. VI, p. U-17. BERGSTROM, C. J. Muscle electrolytes in man. Stand. J. Clin. Lab. Inuest. Suppl. 68: l-110, 1962. BERNE, R. M., AND M. N. LEVY. Physiology (2nd ed.). Toronto, Canada: Mosby, 1988, p. 364-365. BLOMQUIST, C. G., AND B. SALTIN. Cardiovascular adaptations to physical training. Annu. Rev. Physiol. 45: 169-189, 1983. COSTILL, D. L., W. J. FINK, M. HARGREAVES, D. S. KING, R. THOMAS, AND R. FIELDING. Metabolic characteristics of skeletal muscle during detraining from competitive swimming. Med. Sci. Sports Exercise 17: 339-343, 1985. COSTILL, D. L., D. S. KING, R. THOMAS, AND M. HARGREAWZS. Effects of reduced training on muscular power in swimmers. Physi- cian Sports Med. 13: 91-101, 1985. COYLE, E. F., W. H. MARTIN III, S. A. BLOOMFIELD, 0. H. LOWRY, AND J. 0. HOLLOSZY. Effects of detraining on responses to submax- imal exercise. J. Appl. Physiol. 59: 853-859, 1985. COYLE, E. F., W. H. MARTIN III, D. R. SINACORE, M. J. JOYNER, J. M. HAGBERG, AND J. 0. HOLLOSZY. Time course of loss of adapta- tions after stopping prolonged intense endurance training. J. Appl. Physiol. 57: 1857-1864, 1984. GOLLNICK, P. D. Skeletal muscle morphology: adaptations to al- tered demands. In: Future Directions In Exercise and Sport Science Research, edited by J. S. Skinner, C. B. Corbin, C. M. Landers, P. E. Martin, and C. L. Wells. Champaign, IL: Human Kinetics, 1989, p. 275-292. GREEN, H. J. Neuromuscular aspects of fatigue. Can. J. Sport Sci. Suppl. 1: 75-195, 1987. GREEN, H. J., L. L. JONES, AND D. C. PAINTER. Effects of short- term training on cardiac function during prolonged exercise. Med. Sci. Sports Exercise 22: 488-493, 1990. HALLBERG, L., AND B. MAGNUSSON. The etiology of “sports ane- mia” (Editorial). Acta Med. Stand. 216: 145-148, 1984. HICKSON, R. C., C. FOSTER, M. L. POLLOCK, T. M. GALASSI, AND S. RICH. Reduced training intensities and loss of aerobic power, endur- ance, and cardiac growth. J. Appl. Physiol. 58: 492-499, 1985. HICKSON, R. C., C. KANAKIS, JR., J. R. DAVIS, A. M. MOORE, AND S. RICH. Reduced training duration effects on aerobic power, endur- ance, and cardiac growth. J. Appl. Physiol. 53: 225-229, 1982. HOLLOSZY, J. O., AND E. F, COYLE. Adaptations of skeletal muscle to endurance exercise and their metabolic consequences. J. Appl. Physiol. 56: 831-838, 1984. HOUMARD, J. A., J. P. KIRWAN, M. G. FLYNN, AND J. B. MITCHELL. Effects of reduced training on submaximal and maximal running responses. Int. J. Sports Med. 10: 30-33, 1989. HULTMAN, E., M. BERGSTROM, L. L. SPRIET, AND K. SODERLUND. Energy metabolism and fatigue. In: Biochemistry of Exercise VII, edited by A. W. Taylor, P. D. Gollnick, H. J. Green, C. D. Ianuzzo, E. G. Noble, G. Metivier, and J. R. Sutton. Champaign, IL: Human Kinetics, 1990, p. 73-92.
TAPERING BY TRAINED ATHLETES 711
19. LOWRY, 0. H., AND J. V. PASSONNEAU. A FZexibZe System of Enzy- Supercompensation of muscle glycogen in trained and untrained matic Analysis. New York: Academic, 1972. subjects. Can. J. Appl. Sport Sci. 11: 42-47, 1986.
20. MCMIKEN, D. F., AND J. T. DANIELS. Aerobic requirements and 22. TARNOPOLSKY, M. A., S. A. ATKINSON, J. D. MACDOUGALL, D. G. maximum aerobic power in treadmill and track running. 2Med. Sci. SALE, AND J. R. SUTTON. Physiological responses to caffeine dur- Sport Exercise 8: 14-17, 1976. ing endurance running in habitual caffeine users. Med. Sci. Sports
21. ROEDDE, S., J. D. MACDOUGALL, J. R. SUTTON, AND H. J. GREEN. Exercise 21: 418-424, 1989.