Embed Size (px)
Citation preview
pic
pic pic
Spending and Health Workforce
Physiotherapists in Canada, 2011—National and Jurisdictional Highlights

Our VisionBetter data. Better decisions. Healthier Canadians.
Our MandateTo lead the development and maintenance of comprehensive and integrated health information that enables sound policy and effective health system management that improve health and health care.
Our ValuesRespect, Integrity, Collaboration, Excellence, Innovation
1
Physiotherapists in Canada, 2011—National and Jurisdictional Highlights
Table of Contents About CIHI’s Physiotherapist Database ....................................................................................... iii
Want to Know More? .................................................................................................................... v
CIHI’s Definition of the Physiotherapist Workforce in Canada ...................................................... 1
Canada Highlights ......................................................................................................................... 2
Newfoundland and Labrador Highlights ........................................................................................ 4
Prince Edward Island Highlights ................................................................................................... 6
Nova Scotia Highlights .................................................................................................................. 7
New Brunswick Highlights ............................................................................................................. 8
Quebec Highlights ....................................................................................................................... 10
Ontario Highlights ....................................................................................................................... 12
Manitoba Highlights .................................................................................................................... 13
Saskatchewan Highlights ............................................................................................................ 14
Alberta Highlights ........................................................................................................................ 15
British Columbia Highlights ......................................................................................................... 16
Yukon Highlights ......................................................................................................................... 18

iii
Physiotherapists in Canada, 2011—National and Jurisdictional Highlights
About CIHI’s Physiotherapist Database In order to determine the number of health professionals required in any jurisdiction, it is necessary to understand the current supply and how that supply is changing. Since 2007, the Physiotherapist Database (PTDB) has collected information on the supply, distribution, demographics, geography, education and employment of physiotherapists in Canada.
This PTDB publication will provide the reader with highlights on the physiotherapist workforce, including information on selected demographic, geographic, education and employment dimensions in Canada, and specific jurisdictions.

v
Physiotherapists in Canada, 2011—National and Jurisdictional Highlights
Want to Know More? Other PTDB documents that may be of interest and are available free of charge, in English and French, on CIHI’s website (www.cihi.ca) include the following:
Physiotherapists in Canada, 2011
Data tables
Database Guide
Previous reports Physiotherapists in Canada series (2007 to 2010)
Reference documents Data Dictionary
Data Submission Specifications Manual
Privacy Impact Assessment
For more information, please contact
PTDB Program Lead, Health Human Resources Canadian Institute for Health Information 495 Richmond Road, Suite 600 Ottawa, Ontario K2A 4H6 Phone: 613-241-7860 Fax: 613-241-8120
Email: [email protected] Website: www.cihi.ca

1
Physiotherapists in Canada, 2011—National and Jurisdictional Highlights
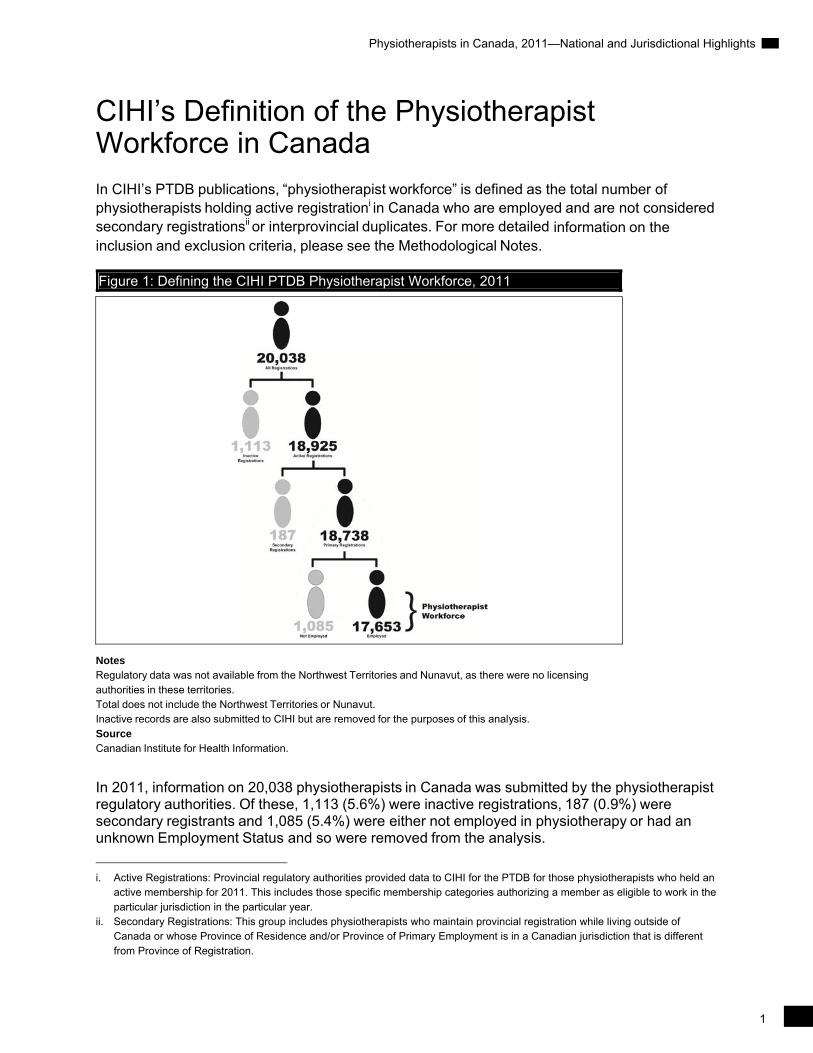
CIHI’s Definition of the Physiotherapist Workforce in Canada In CIHI’s PTDB publications, “physiotherapist workforce” is defined as the total number of physiotherapists holding active registrationi in Canada who are employed and are not considered secondary registrationsii or interprovincial duplicates. For more detailed information on the inclusion and exclusion criteria, please see the Methodological Notes.
Figure 1: Defining the CIHI PTDB Physiotherapist Workforce, 2011
Notes Regulatory data was not available from the Northwest Territories and Nunavut, as there were no licensing authorities in these territories. Total does not include the Northwest Territories or Nunavut. Inactive records are also submitted to CIHI but are removed for the purposes of this analysis. Source Canadian Institute for Health Information.
In 2011, information on 20,038 physiotherapists in Canada was submitted by the physiotherapist regulatory authorities. Of these, 1,113 (5.6%) were inactive registrations, 187 (0.9%) were secondary registrants and 1,085 (5.4%) were either not employed in physiotherapy or had an unknown Employment Status and so were removed from the analysis. i. Active Registrations: Provincial regulatory authorities provided data to CIHI for the PTDB for those physiotherapists who held an
active membership for 2011. This includes those specific membership categories authorizing a member as eligible to work in the particular jurisdiction in the particular year.
ii. Secondary Registrations: This group includes physiotherapists who maintain provincial registration while living outside of Canada or whose Province of Residence and/or Province of Primary Employment is in a Canadian jurisdiction that is different from Province of Registration.
Physiotherapists in Canada, 2011—National and Jurisdictional Highlights
2
Canada Highlights Physiotherapist Workforce, 2011 Data for the 2011 physiotherapist workforce in the Northwest Territories and Nunavut was not available for this publication. Specific analyses may exclude some jurisdictions due to data quality concerns; therefore, caution should be exercised when interpreting results. All exclusions are detailed in the footnotes for these highlights.
Supply
The supply of registered physiotherapists in Canada grew by 7.5% between 2007 and 2011 (excluding the Northwest Territories and Nunavut), reaching a total of 17,653 employed physiotherapists. All jurisdictions have experienced an increase in the supply number since 2007, the highest being in P.E.I. (24.0%), followed by British Columbia (19.2%).
The per-population supply of physiotherapists in Canada has been consistent since 2007. For the country as a whole, the rate was 51.1iii per 100,000 population in 2011. Yukon (97.4) and British Columbia (62.2) had the highest rates per 100,000 population, whereas P.E.I. (42.4) and Newfoundland and Labrador (43.0) had the lowest.
Demographics
More than three-quarters of physiotherapists in 2011 were female (77.1%),iii slightly less than in 2007 (78.7%). Gender distribution varied slightly by province, with the highest percentage of male physiotherapists located in British Columbia (25.5%) and Newfoundland and Labrador (23.6%).
The average age of physiotherapists in Canada in 2011 was 41.9.iii The average age has remained relatively stable, with only a slight increase every year since 2007, from 41.2 that year to 41.9 in 2011.
Education
For their current education in physiotherapy, the majority of physiotherapists had a baccalaureate degree (74.7%). The remainder had a diploma (7.9%) or a master’s degree (16.9%), while only 87 (0.5%) had a doctorate.iii
Canadian-educated physiotherapists completed their basic education in physiotherapy across 13 universities in 7 provinces.iii
Of Canadian-educated physiotherapists, more than one-third (36.4%) of employed physiotherapists in Canada completed their basic education in physiotherapy in Ontario, while 27.9% did so in Quebec.iii
iii. Excludes the Northwest Territories and Nunavut.
3
Physiotherapists in Canada, 2011—National and Jurisdictional Highlights
A total of 30.8% of physiotherapists reported having additional post-secondary education outside of physiotherapy, the majority of whom (79.1%) obtained it prior to studying physiotherapy.iv
More than one-tenth (11.9%) of practising physiotherapists were educated outside of Canada.iii
Nearly one in five (19.7%) of all international graduates in physiotherapy employed in Canada received their basic education in physiotherapy in the United Kingdom of Great Britain and Northern Ireland; the other top countries were India (15.2%) and the United States (10.0%).iii
The proportion of physiotherapists classified as new graduates (4.8%)—having a graduation year of 2010 or 2011iii—has shown a slight decline since 2007 (down from 5.9%).
Employment
The majority of physiotherapists worked for a single employer (77.8%), while the remainder had at least two employers.
More male physiotherapists (26.8%) had multiple employers, compared with their female counterparts (20.7%).iv
More than one-third of employed physiotherapists worked on a part-time basis at their primary job (34.4%), based on the jurisdictions included in full-time/part-time status analysis.v
Findings indicate that the physiotherapist workforce was employed almost equally in hospital settings (39.7%) and group or solo professional practice settings (36.9%), with community settings accounting for 12.9%.iii
Almost half (49.5%) of physiotherapists worked in the public sector, while 42.3% worked in the private sector.vi
A high number (40.9%) of physiotherapists worked in the area of musculoskeletal and integumentary systems, followed by general practice (26.3%).vi
Geography and Mobility
Most (89.2%) employers of physiotherapists were located in urban areas, while an almost equal proportion was located in rural and remote areas (4.1% and 3.9%, respectively).iii
iii. Excludes the Northwest Territories and Nunavut. iv. Excludes Nova Scotia, the Northwest Territories and Nunavut. v. Excludes P.E.I., Quebec, the Northwest Territories and Nunavut. vi. Excludes P.E.I., the Northwest Territories and Nunavut.
Physiotherapists in Canada, 2011—National and Jurisdictional Highlights
4
Newfoundland and Labrador Highlights Physiotherapist Workforce, 2011 Supply
The supply of physiotherapists in Newfoundland and Labrador grew by 14.0% between 2007 and 2011 and reached a total of 220 employed physiotherapists in 2011.
The ratio of physiotherapists per 100,000 population showed an increase, from 38.1 in 2007 to 43.0 in 2011. Despite this increase, Newfoundland and Labrador had the second-lowest physiotherapist per population ratio, after P.E.I. (42.4), compared with all other jurisdictions included in this analysis.
Demographics
Newfoundland and Labrador had the second-highest percentage of male physiotherapists (23.6%), after B.C. (25.5%), in 2011.
Physiotherapists in Newfoundland and Labrador had an average age of 39.6, the youngest among the jurisdictions in this analysis.
Newfoundland and Labrador had the lowest percentage of physiotherapists older than age 50 (15.5%) of all jurisdictions in this analysis.
Education
Newfoundland and Labrador did not have a university with a physiotherapy program.
Of Canadian-educated physiotherapists, the majority (75.1%) of physiotherapists employed in Newfoundland and Labrador received their basic education in physiotherapy from Dalhousie University.
In Newfoundland and Labrador, 11.8% of the workforce was composed of international graduates.
Employment
Newfoundland and Labrador had the highest percentage of physiotherapists with full-time employment status associated with their primary job (91.4%) and a similar percentage (85.9%) in a permanent employment setting.
In Newfoundland and Labrador, 17.3% of the physiotherapist workforce indicated that they had multiple employers, lower than the percentage for all jurisdictions included in this analysis (22.1%).iv
The majority of Newfoundland and Labrador’s physiotherapist workforce (54.5%) worked in a hospital setting. In comparison, 39.7%iii of physiotherapists from all of the jurisdictions included in the analysis worked in a hospital setting.
iii. Excludes the Northwest Territories and Nunavut. iv. Excludes Nova Scotia, the Northwest Territories and Nunavut.
5
Physiotherapists in Canada, 2011—National and Jurisdictional Highlights
A total of 40.9% of physiotherapists in Newfoundland and Labrador reported working 1,250 to 1,749 hours a year—much higher than the percentage for all jurisdictions included in this analysis (29.1%).vii
Geography and Mobility
In Newfoundland and Labrador, the majority of physiotherapists (84.1%) were located in urban areas.
vii. Excludes Quebec, the Northwest Territories and Nunavut.
Physiotherapists in Canada, 2011—National and Jurisdictional Highlights
6
Prince Edward Island Highlights Physiotherapist Workforce, 2011 Supply
The supply of physiotherapists in P.E.I. has grown by 24.0% since 2007 and reached a total of 62 employed physiotherapists in 2011.
This increase has positively affected the ratio of physiotherapists per population, at 42.4 per 100,000 population in 2011; however, P.E.I.’s ratio is the lowest of all jurisdictions included in the analysis.
Demographics
The average age of physiotherapists in P.E.I. was 42.1.
After B.C. (33.0%), P.E.I. had the second-highest proportion (29.0%) of physiotherapists older than age 50.
Education
P.E.I. did not have a university with a physiotherapy program.
Of Canadian-educated physiotherapists, the majority (72.9%) of physiotherapists employed in P.E.I. obtained their basic education in physiotherapy from Dalhousie University.
A large percentage of physiotherapists (72.6%) in P.E.I. had a baccalaureate degree as their current education.
Employment
In P.E.I., 48.4% of the physiotherapist workforce was employed in hospital settings; this was higher than the average percentage (39.7%)iii for the participating jurisdictions.
Geography and Mobility
In P.E.I., 90.3% of physiotherapists were employed in urban areas and 9.7% in rural or remote areas.
iii. Excludes the Northwest Territories and Nunavut.
7
Physiotherapists in Canada, 2011—National and Jurisdictional Highlights
Nova Scotia Highlights Physiotherapist Workforce, 2011 Supplyviii
Nova Scotia had 571 employed physiotherapists in 2011, which translated to 60.3 physiotherapists per 100,000 population. This ratio was higher than the average of all jurisdictions included in the analysis (51.1).iii
Demographics
Nova Scotia had a high proportion of female physiotherapists (78.1%).
Physiotherapists in Nova Scotia had an average age of 41.5.
Education
Nova Scotia had one university (Dalhousie University) offering a physiotherapy program.
Of Canadian-educated physiotherapists, almost all of the physiotherapists (95.2%) employed in Nova Scotia received their basic education in physiotherapy in Nova Scotia, whereas 4.8% completed their basic education in Quebec.
Of all the jurisdictions included in the analysis, Nova Scotia had one of the lowest percentages of physiotherapists classified as new graduates (3.2%).
Employment
A total of 74.5% of physiotherapists in Nova Scotia worked on a full-time basis; the average for all jurisdictions included in the analysis was 63.7%.v
In Nova Scotia, 41.2% of physiotherapists worked in a hospital setting.
Nova Scotia had a slightly higher proportion of physiotherapists working in the private sector (50.6%) than in the public sector (46.8%).
Geography and Mobility
Nova Scotia had the second-highest percentage (22.4%) of physiotherapist employers located in rural and remote areas, after New Brunswick (23.7%).
iii. Excludes the Northwest Territories and Nunavut. v. Excludes P.E.I., Quebec, the Northwest Territories and Nunavut. viii. For 2007 and 2008, aggregate data for Nova Scotia was provided by the Nova Scotia College of Physiotherapists and excludes
out-of-province and non-practising registrants. For 2009, aggregate data for Nova Scotia was provided by the Nova Scotia College of Physiotherapists and excludes inactive and non-practising registration types, as defined by the college. For 2010 and 2011, record-level data on active practising physiotherapists was provided by the Nova Scotia College of Physiotherapists. Data on only employed physiotherapists is included in the analysis. The decline in the number of physiotherapists in Nova Scotia in 2009 and 2010 is due to the reasons stated above.
Physiotherapists in Canada, 2011—National and Jurisdictional Highlights
8
New Brunswick Highlights Physiotherapist Workforce, 2011 Supply
The supply of physiotherapists in New Brunswick grew by 4.8% between 2007 and 2011, with a total of 455 employed physiotherapists in 2011.
The ratio of physiotherapists in New Brunswick increased from 58.2 per 100,000 population in 2007 to 60.2 per 100,000 population in 2011, one of the highest across all the jurisdictions included in this analysis.
Demographics
The proportion of females in the physiotherapist workforce in New Brunswick declined slightly to 77.8% in 2011.
The average age for physiotherapists in New Brunswick has shown an increase over the past few years, from 38.8 in 2007 to 41.0 in 2011.
Education
New Brunswick did not have a university with a physiotherapy program.
Of Canadian-educated physiotherapists, more than half (55.5%) of physiotherapists employed in New Brunswick received their basic education in physiotherapy from Dalhousie University, while about one-quarter (25.8%) completed their education in Quebec universities.
New Brunswick had 12 new graduates in 2011, representing 2.6% of its physiotherapist workforce.
Employment
More than three-quarters of physiotherapists in New Brunswick had a full-time job in physiotherapy (77.4%), compared with 63.7%v across all jurisdictions included in this analysis.
More than one-tenth (12.3%) of New Brunswick’s employed physiotherapists indicated that they had multiple employers.
Almost half of the physiotherapists in New Brunswick (48.4%) worked in hospital settings, followed by professional practice settings (34.1%).
Almost one-third of physiotherapists in New Brunswick (31.4%) worked between 1,250 and 1,749 hours per year. New Brunswick had the second-lowest percentage (8.4%) of physiotherapists who worked more than 2,000 hours every year.
More than half (55.2%) of the physiotherapists in New Brunswick indicated that they had bilingual capacity (ability to provide service in English and French).
v. Excludes P.E.I., Quebec, the Northwest Territories and Nunavut.
9
Physiotherapists in Canada, 2011—National and Jurisdictional Highlights
Geography and Mobility
New Brunswick had the highest percentage of physiotherapists located in rural and remote areas (23.7%) across all jurisdictions included in this analysis. The percentage for all of the jurisdictions included in the analysis was much lower, at 8.0%.iii
iii. Excludes the Northwest Territories and Nunavut.
Physiotherapists in Canada, 2011—National and Jurisdictional Highlights
10
Quebec Highlights Physiotherapist Workforce, 2011 Supply
The supply of physiotherapists in Quebec grew by 4.8% between 2007 and 2011.
Quebec had 47.8 physiotherapists per 100,000 population in 2011. This ratio has remained relatively stable since 2007 (47.4 physiotherapists per 100,000 population).
The Ordre professionnel de la physiothérapie du Québec includes two categories of professionals: physiotherapists and physical rehabilitation therapists (PRTs). As of August 31, 2011, there were 2,150 PRTs working in Quebec.
Demographics
In 2011, one in five physiotherapists in Quebec was male. The female-to-male ratio (77.3:22.7) has remained consistent with the average ratio across all jurisdictions in this analysis.
Physiotherapists in Quebec had an average age of 40.7, up slightly from 39.5 in 2007 but younger than the average age of 41.9iii for all jurisdictions in this analysis.
Education
Quebec had three universities offering physiotherapy programs (McGill University, Université de Montréal and Université Laval).
Quebec had the highest proportion of physiotherapists (95.6%) reporting “baccalaureate” as their current education, 20 percentage points above the average for all jurisdictions in this analysis (74.7%).iii
Of Canadian-educated physiotherapists, almost all (92.5%) of the physiotherapists in Quebec received their basic education from a university in Quebec, followed by 7.2% from a university in Ontario.
Quebec had 4.7% of its physiotherapist workforce classified as new graduates (having graduated in 2010 or 2011).
Only 1.9% of physiotherapists in Quebec indicated that they were internationally educated, compared with an average of 11.9%iii for the jurisdictions included in the analysis.
Employment
In Quebec, 24.0% of employed physiotherapists indicated that they had more than one employer.
Slightly more Quebec physiotherapists worked in hospitals (41.5%) than in professional practice settings (40.7%).
iii. Excludes the Northwest Territories and Nunavut.
11
Physiotherapists in Canada, 2011—National and Jurisdictional Highlights
All (100%) physiotherapists employed in Quebec indicated their ability to provide service in French; 80.2% were bilingual (English and French) whereas 19.7% were unilingual (French only).
Geography and Mobility
The majority of physiotherapist employers (91.7%) in Quebec were located in urban areas, comparable to the percentage for all jurisdictions included in this analysis (89.1%).iii
iii. Excludes the Northwest Territories and Nunavut.
Physiotherapists in Canada, 2011—National and Jurisdictional Highlights
12
Ontario Highlights Physiotherapist Workforce, 2011 Supply
As the province with the largest population, the supply in Ontario increased to 6,158 employed physiotherapists in 2011, which translated to 45.9 physiotherapists per 100,000 population.
Demographics
Ontario had a similar proportion of females in the workforce (77.7%) as the average of all jurisdictions included in the analysis (77.1%).iii
Physiotherapists in Ontario had an average age of 42.0, similar to the average of 41.9iii for all jurisdictions included in this analysis.
Education
Ontario had five universities offering physiotherapy programs (University of Ottawa, Queen’s University, McMaster University, University of Toronto and the University of Western Ontario).
Of Canadian-educated physiotherapists, at least four out of five physiotherapists (86.2%) employed in Ontario received their basic education in physiotherapy in Ontario, whereas 7.1% completed their basic education in Quebec.
Almost one-fifth (19.2%) of the physiotherapists in Ontario were international graduates, the highest percentage among the jurisdictions. The proportion for all the jurisdictions included in the analysis was 11.9%.iii
In 2011, 294 (4.8%) physiotherapists in Ontario were classified as new graduates (having graduated in 2010 or 2011).
Employment
Almost one-third of physiotherapists in Ontario (32.1%) worked on a part-time basis for their primary employment; this was comparable to the average of all jurisdictions (34.4%)v included in the analysis.
Ontario had the highest percentage of employed physiotherapists with multiple employers (25.8%).
Ontario also had the highest percentage of physiotherapists who were self-employed (32.3%).
Geography and Mobility
After Yukon (100%), Ontario had the second-highest percentage (92.8%) of physiotherapist employers located in urban areas.
iii. Excludes the Northwest Territories and Nunavut. v. Excludes P.E.I., Quebec, the Northwest Territories and Nunavut.
13
Physiotherapists in Canada, 2011—National and Jurisdictional Highlights
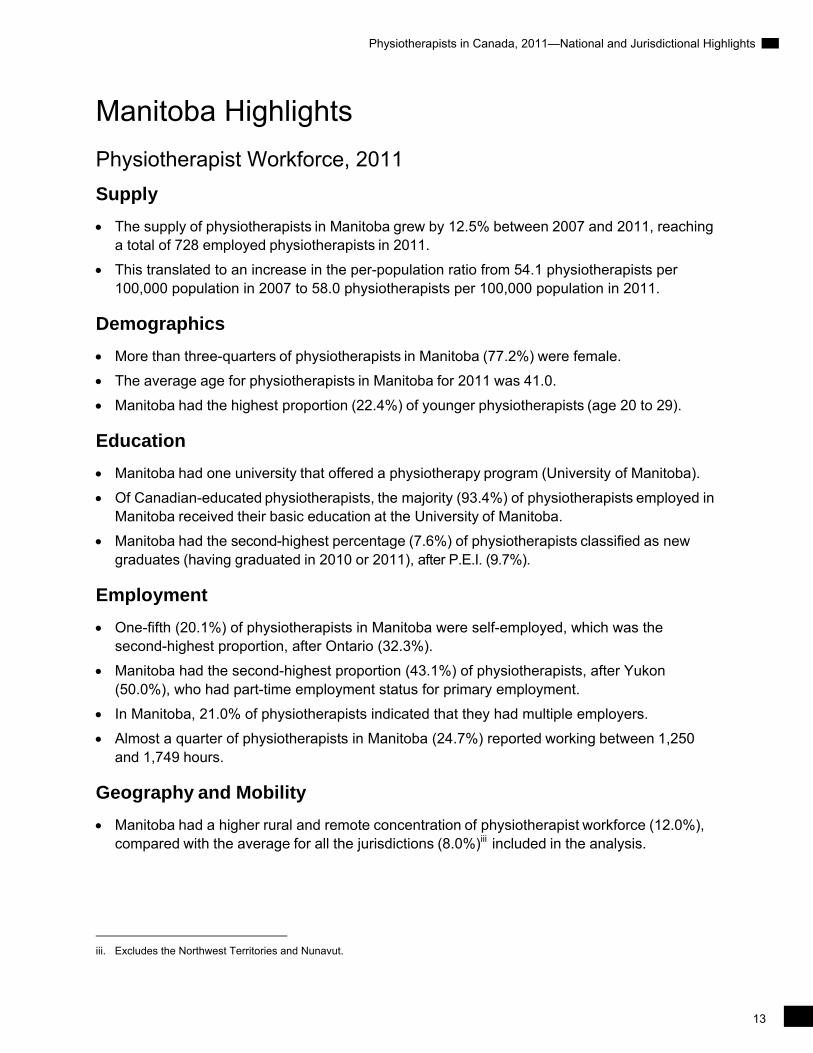
Manitoba Highlights Physiotherapist Workforce, 2011 Supply
The supply of physiotherapists in Manitoba grew by 12.5% between 2007 and 2011, reaching a total of 728 employed physiotherapists in 2011.
This translated to an increase in the per-population ratio from 54.1 physiotherapists per 100,000 population in 2007 to 58.0 physiotherapists per 100,000 population in 2011.
Demographics
More than three-quarters of physiotherapists in Manitoba (77.2%) were female.
The average age for physiotherapists in Manitoba for 2011 was 41.0.
Manitoba had the highest proportion (22.4%) of younger physiotherapists (age 20 to 29).
Education
Manitoba had one university that offered a physiotherapy program (University of Manitoba).
Of Canadian-educated physiotherapists, the majority (93.4%) of physiotherapists employed in Manitoba received their basic education at the University of Manitoba.
Manitoba had the second-highest percentage (7.6%) of physiotherapists classified as new graduates (having graduated in 2010 or 2011), after P.E.I. (9.7%).
Employment
One-fifth (20.1%) of physiotherapists in Manitoba were self-employed, which was the second-highest proportion, after Ontario (32.3%).
Manitoba had the second-highest proportion (43.1%) of physiotherapists, after Yukon (50.0%), who had part-time employment status for primary employment.
In Manitoba, 21.0% of physiotherapists indicated that they had multiple employers.
Almost a quarter of physiotherapists in Manitoba (24.7%) reported working between 1,250 and 1,749 hours.
Geography and Mobility
Manitoba had a higher rural and remote concentration of physiotherapist workforce (12.0%), compared with the average for all the jurisdictions (8.0%)iii included in the analysis.
iii. Excludes the Northwest Territories and Nunavut.
Physiotherapists in Canada, 2011—National and Jurisdictional Highlights
14
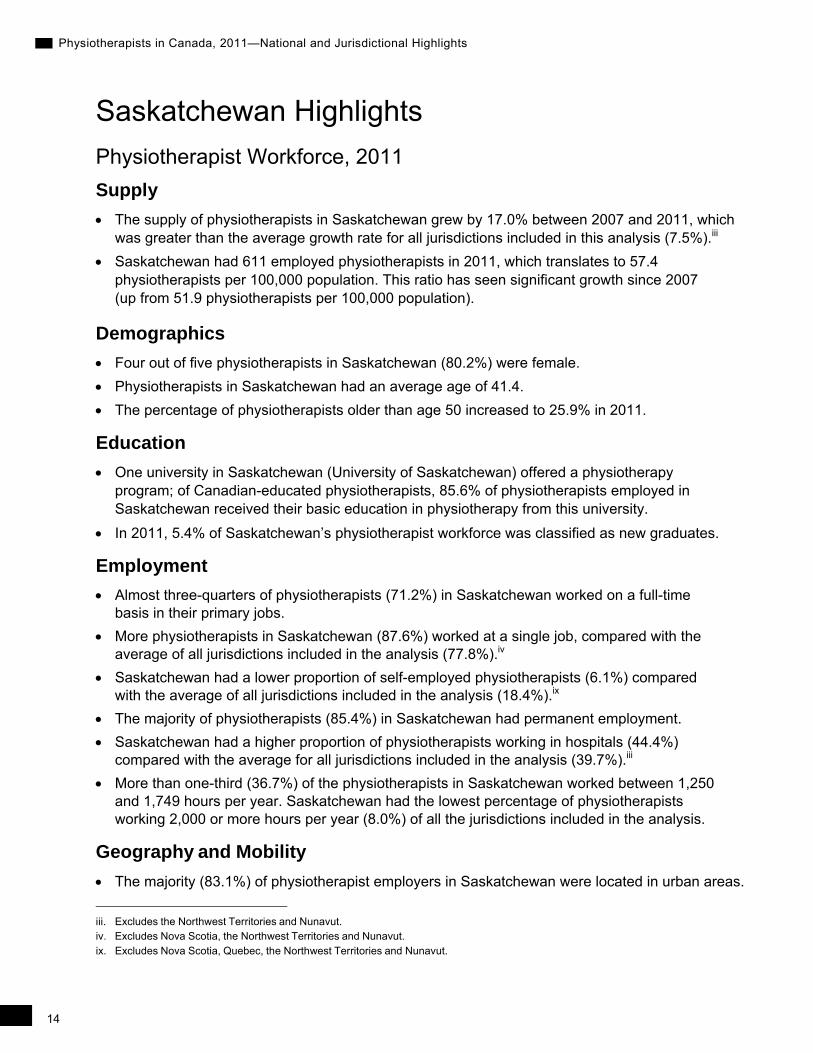
Saskatchewan Highlights Physiotherapist Workforce, 2011 Supply
The supply of physiotherapists in Saskatchewan grew by 17.0% between 2007 and 2011, which was greater than the average growth rate for all jurisdictions included in this analysis (7.5%).iii
Saskatchewan had 611 employed physiotherapists in 2011, which translates to 57.4 physiotherapists per 100,000 population. This ratio has seen significant growth since 2007 (up from 51.9 physiotherapists per 100,000 population).
Demographics
Four out of five physiotherapists in Saskatchewan (80.2%) were female. Physiotherapists in Saskatchewan had an average age of 41.4. The percentage of physiotherapists older than age 50 increased to 25.9% in 2011.
Education
One university in Saskatchewan (University of Saskatchewan) offered a physiotherapy program; of Canadian-educated physiotherapists, 85.6% of physiotherapists employed in Saskatchewan received their basic education in physiotherapy from this university.
In 2011, 5.4% of Saskatchewan’s physiotherapist workforce was classified as new graduates.
Employment
Almost three-quarters of physiotherapists (71.2%) in Saskatchewan worked on a full-time basis in their primary jobs.
More physiotherapists in Saskatchewan (87.6%) worked at a single job, compared with the average of all jurisdictions included in the analysis (77.8%).iv
Saskatchewan had a lower proportion of self-employed physiotherapists (6.1%) compared with the average of all jurisdictions included in the analysis (18.4%).ix
The majority of physiotherapists (85.4%) in Saskatchewan had permanent employment. Saskatchewan had a higher proportion of physiotherapists working in hospitals (44.4%)
compared with the average for all jurisdictions included in the analysis (39.7%).iii More than one-third (36.7%) of the physiotherapists in Saskatchewan worked between 1,250
and 1,749 hours per year. Saskatchewan had the lowest percentage of physiotherapists working 2,000 or more hours per year (8.0%) of all the jurisdictions included in the analysis.
Geography and Mobility
The majority (83.1%) of physiotherapist employers in Saskatchewan were located in urban areas. iii. Excludes the Northwest Territories and Nunavut. iv. Excludes Nova Scotia, the Northwest Territories and Nunavut. ix. Excludes Nova Scotia, Quebec, the Northwest Territories and Nunavut.
15
Physiotherapists in Canada, 2011—National and Jurisdictional Highlights
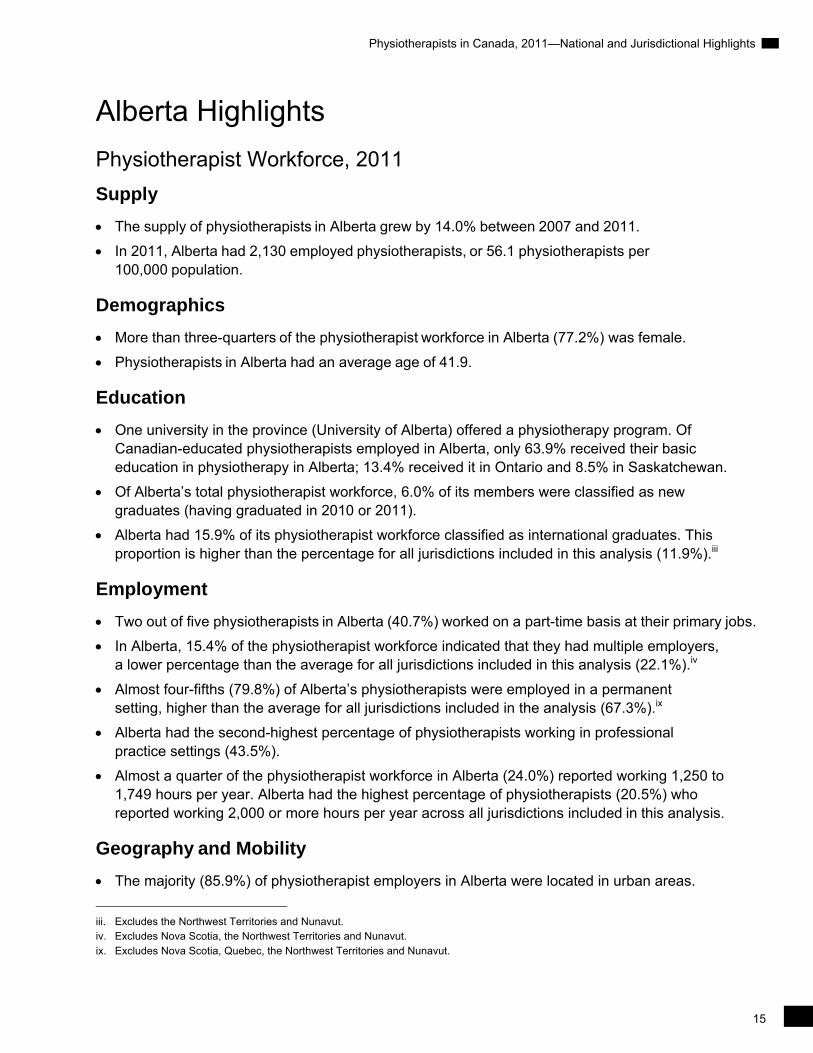
Alberta Highlights Physiotherapist Workforce, 2011 Supply
The supply of physiotherapists in Alberta grew by 14.0% between 2007 and 2011.
In 2011, Alberta had 2,130 employed physiotherapists, or 56.1 physiotherapists per 100,000 population.
Demographics
More than three-quarters of the physiotherapist workforce in Alberta (77.2%) was female.
Physiotherapists in Alberta had an average age of 41.9.
Education
One university in the province (University of Alberta) offered a physiotherapy program. Of Canadian-educated physiotherapists employed in Alberta, only 63.9% received their basic education in physiotherapy in Alberta; 13.4% received it in Ontario and 8.5% in Saskatchewan.
Of Alberta’s total physiotherapist workforce, 6.0% of its members were classified as new graduates (having graduated in 2010 or 2011).
Alberta had 15.9% of its physiotherapist workforce classified as international graduates. This proportion is higher than the percentage for all jurisdictions included in this analysis (11.9%).iii
Employment
Two out of five physiotherapists in Alberta (40.7%) worked on a part-time basis at their primary jobs.
In Alberta, 15.4% of the physiotherapist workforce indicated that they had multiple employers, a lower percentage than the average for all jurisdictions included in this analysis (22.1%).iv
Almost four-fifths (79.8%) of Alberta’s physiotherapists were employed in a permanent setting, higher than the average for all jurisdictions included in the analysis (67.3%).ix
Alberta had the second-highest percentage of physiotherapists working in professional practice settings (43.5%).
Almost a quarter of the physiotherapist workforce in Alberta (24.0%) reported working 1,250 to 1,749 hours per year. Alberta had the highest percentage of physiotherapists (20.5%) who reported working 2,000 or more hours per year across all jurisdictions included in this analysis.
Geography and Mobility
The majority (85.9%) of physiotherapist employers in Alberta were located in urban areas.
iii. Excludes the Northwest Territories and Nunavut. iv. Excludes Nova Scotia, the Northwest Territories and Nunavut. ix. Excludes Nova Scotia, Quebec, the Northwest Territories and Nunavut.
Physiotherapists in Canada, 2011—National and Jurisdictional Highlights
16
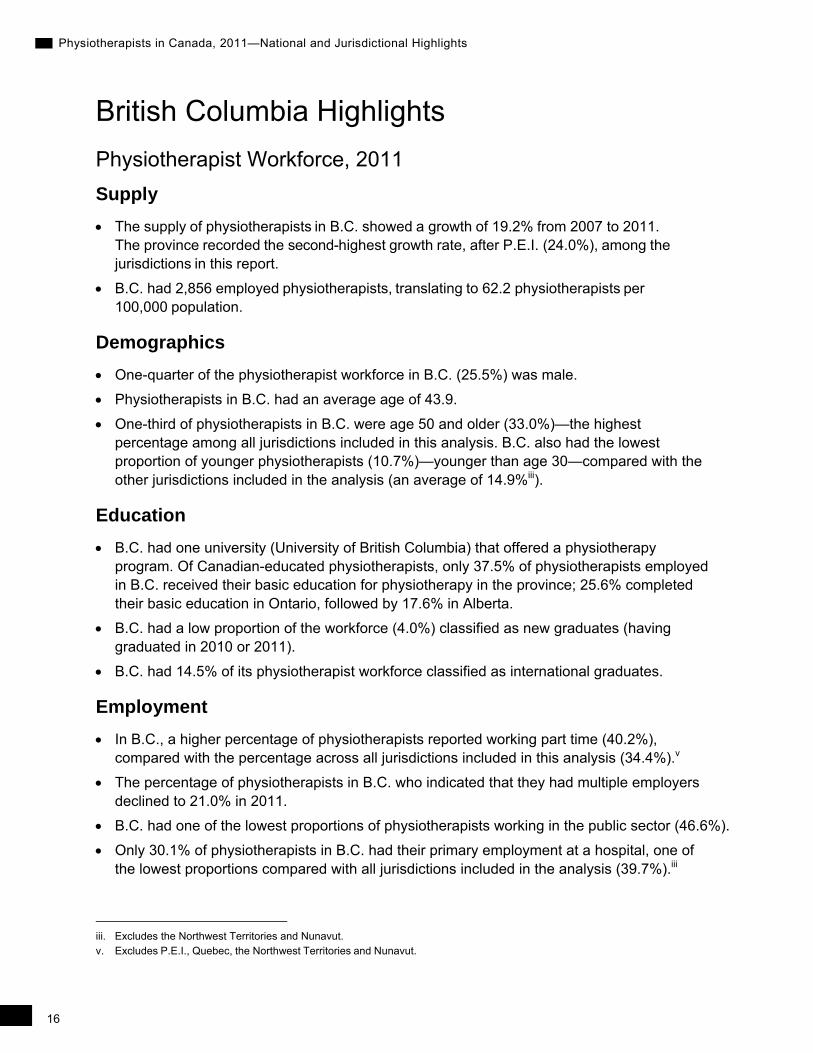
British Columbia Highlights Physiotherapist Workforce, 2011 Supply
The supply of physiotherapists in B.C. showed a growth of 19.2% from 2007 to 2011. The province recorded the second-highest growth rate, after P.E.I. (24.0%), among the jurisdictions in this report.
B.C. had 2,856 employed physiotherapists, translating to 62.2 physiotherapists per 100,000 population.
Demographics
One-quarter of the physiotherapist workforce in B.C. (25.5%) was male.
Physiotherapists in B.C. had an average age of 43.9.
One-third of physiotherapists in B.C. were age 50 and older (33.0%)—the highest percentage among all jurisdictions included in this analysis. B.C. also had the lowest proportion of younger physiotherapists (10.7%)—younger than age 30—compared with the other jurisdictions included in the analysis (an average of 14.9%iii).
Education
B.C. had one university (University of British Columbia) that offered a physiotherapy program. Of Canadian-educated physiotherapists, only 37.5% of physiotherapists employed in B.C. received their basic education for physiotherapy in the province; 25.6% completed their basic education in Ontario, followed by 17.6% in Alberta.
B.C. had a low proportion of the workforce (4.0%) classified as new graduates (having graduated in 2010 or 2011).
B.C. had 14.5% of its physiotherapist workforce classified as international graduates.
Employment
In B.C., a higher percentage of physiotherapists reported working part time (40.2%), compared with the percentage across all jurisdictions included in this analysis (34.4%).v
The percentage of physiotherapists in B.C. who indicated that they had multiple employers declined to 21.0% in 2011.
B.C. had one of the lowest proportions of physiotherapists working in the public sector (46.6%).
Only 30.1% of physiotherapists in B.C. had their primary employment at a hospital, one of the lowest proportions compared with all jurisdictions included in the analysis (39.7%).iii
iii. Excludes the Northwest Territories and Nunavut. v. Excludes P.E.I., Quebec, the Northwest Territories and Nunavut.
17
Physiotherapists in Canada, 2011—National and Jurisdictional Highlights
B.C. had the highest percentage of physiotherapists working in a professional practice setting (44.3%).
More than 10% of physiotherapists in B.C. indicated that they could provide service in both official languages (11.0%).
Almost one-third of physiotherapists in B.C. reported working between 1,250 and 1,749 hours a year (31.4%).
Geography and Mobility
B.C. had one of the lower proportions of physiotherapists working in an urban area (87.1%).
Physiotherapists in Canada, 2011—National and Jurisdictional Highlights
18
Yukon Highlights Physiotherapist Workforce, 2011 Supply
The supply of physiotherapists in Yukon grew by 13.3% between 2007 and 2011.
Yukon had 34 employed physiotherapists, which amounted to 97.4 physiotherapists per 100,000 population in 2011.
Demographics
Physiotherapists in Yukon had an average age of 42.7.
More than one-third of physiotherapists in Yukon (35.3%) were age 40 to 49, representing the highest percentage in this age group across all jurisdictions included in this analysis.
Education
Of Canadian-educated physiotherapists, two out of five physiotherapists in Yukon (41.9%) received their basic education in physiotherapy in Ontario, followed by 22.6% in Alberta.
Employment
Yukon had the lowest proportion of physiotherapists (50.0%) with full-time employment.
Yukon had the second-lowest proportion of physiotherapists (64.7%) with permanent employment, after Ontario (50.3%).
Yukon had the highest proportion of physiotherapists (61.8%) working in the public sector.
Geography and Mobility
All physiotherapist employers in Yukon were located in urban areas.
Production of this report is made possible by financial contributions from Health Canada and provincial and territorial governments. The views expressed herein do not necessarily represent the views of Health Canada or any provincial or territorial government.
All rights reserved.
The contents of this publication may be reproduced unaltered, in whole or in part and by any means, solely for non-commercial purposes, provided that the Canadian Institute for Health Information is properly and fully acknowledged as the copyright owner. Any reproduction or use of this publication or its contents for any commercial purpose requires the prior written authorization of the Canadian Institute for Health Information. Reproduction or use that suggests endorsement by, or affiliation with, the Canadian Institute for Health Information is prohibited.
For permission or information, please contact CIHI:
Canadian Institute for Health Information495 Richmond Road, Suite 600Ottawa, Ontario K2A 4H6
Phone: 613-241-7860Fax: [email protected]
ISBN 978-1-77109-081-0 (PDF)
© 2012 Canadian Institute for Health Information
How to cite this document:Canadian Institute for Health Information, Physiotherapists in Canada, 2011—
National and Jurisdictional Highlights (Ottawa, Ont.: CIHI, 2012).
Cette publication est aussi disponible en français sous le titre Les physiothérapeutes au Canada 2011 — faits saillants, provinciaux et territoriaux.ISBN 978-1-77109-082-7 (PDF)
www.cihi.caAt the heart of data
Talk to UsCIHI Ottawa495 Richmond Road, Suite 600Ottawa, Ontario K2A 4H6Phone: 613-241-7860
CIHI Toronto4110 Yonge Street, Suite 300Toronto, Ontario M2P 2B7Phone: 416-481-2002
CIHI Victoria 880 Douglas Street, Suite 600 Victoria, British Columbia V8W 2B7 Phone: 250-220-4100
CIHI Montréal1010 Sherbrooke Street West, Suite 300Montréal, Quebec H3A 2R7Phone: 514-842-2226
CIHI St. John’s140 Water Street, Suite 701St. John’s, Newfoundland and Labrador A1C 6H6Phone: 709-576-7006