Embed Size (px)
DESCRIPTION
Pick up a warm up from the front!. April 21 th , 2014. Math IIIWarm Up 4/21/14. The twenty highest dams have heights of 240, 335, 260, 300, 285, 262, 272, 225, 242, 261, 233, 250, 243, 237, 236, 243, 234, 235, 226, and 261 meters. - PowerPoint PPT Presentation
Citation preview

Pick up a warm up from the front!
April 21th, 2014
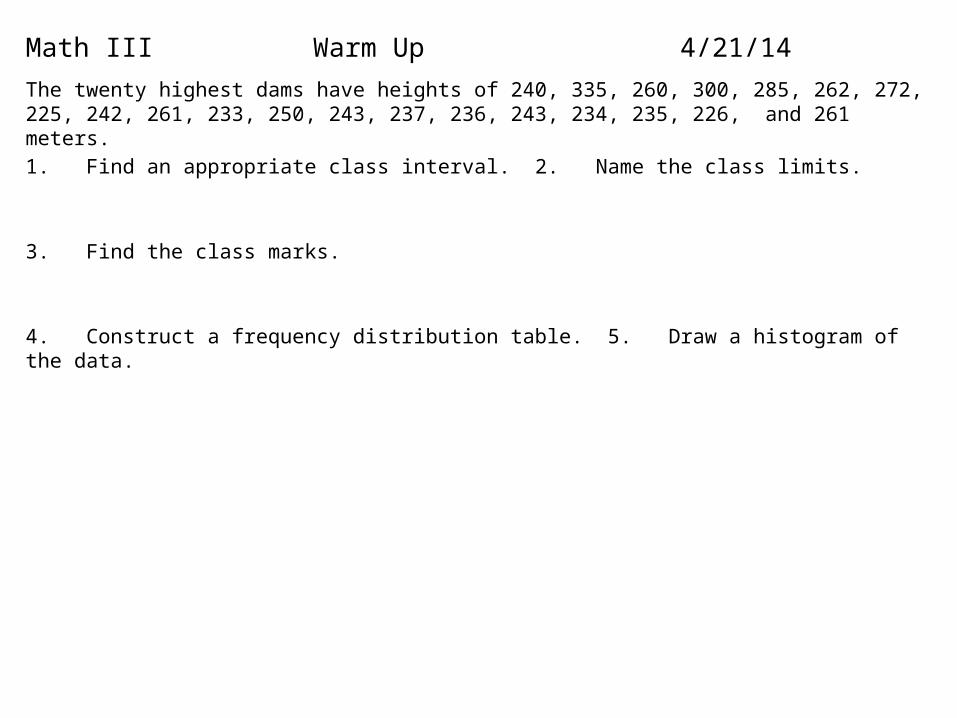
Math III Warm Up 4/21/14
The twenty highest dams have heights of 240, 335, 260, 300, 285, 262, 272, 225, 242, 261, 233, 250, 243, 237, 236, 243, 234, 235, 226, and 261 meters.1. Find an appropriate class interval. 2. Name the class limits.
3. Find the class marks.
4. Construct a frequency distribution table. 5. Draw a histogram of the data.

Math III Warm Up 4/21/14
Questions over Assignment?
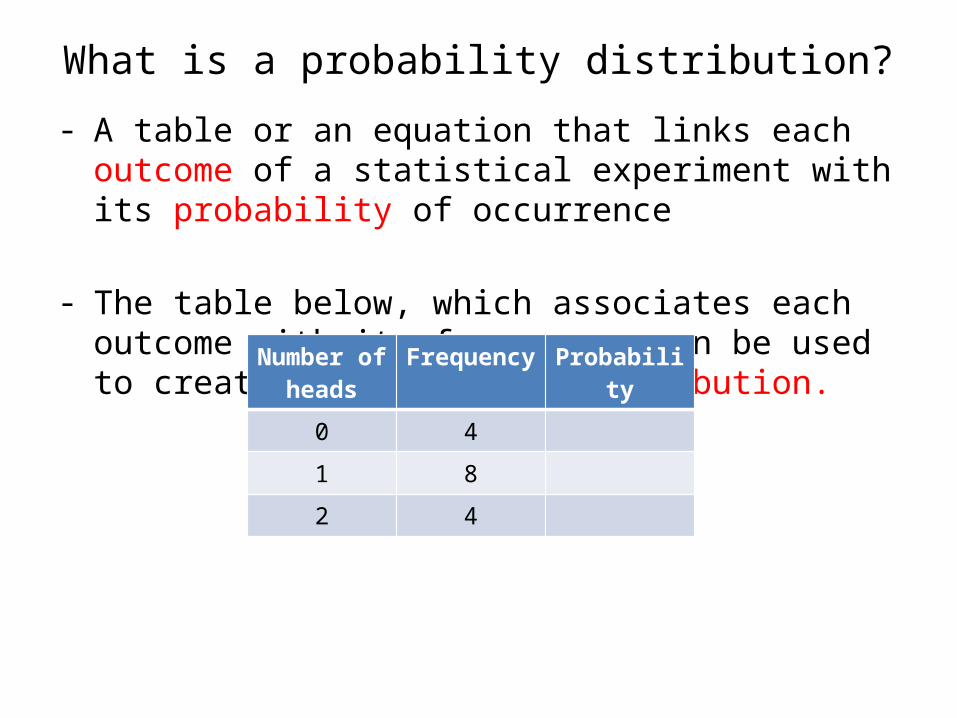
What is a probability distribution?- A table or an equation that links each outcome of a
statistical experiment with its probability of occurrence
- The table below, which associates each outcome with its frequency, can be used to create a probability distribution.
Number of heads
Frequency Probability
0 4
1 8
2 4
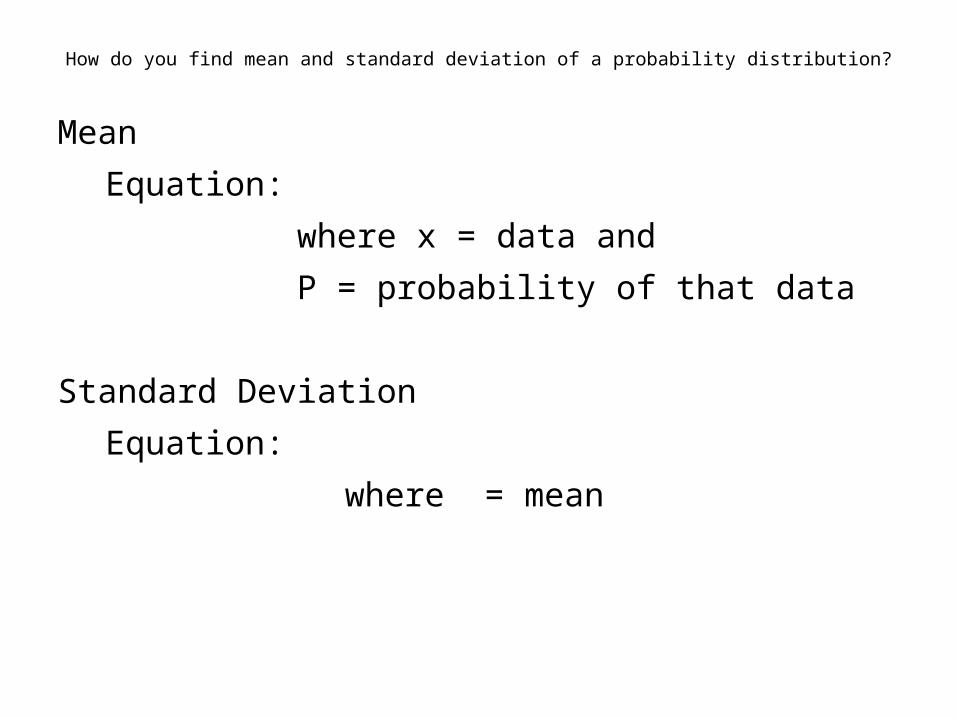
How do you find mean and standard deviation of a probability distribution?
MeanEquation:
where x = data and P = probability of that data
Standard Deviation Equation:
where = mean
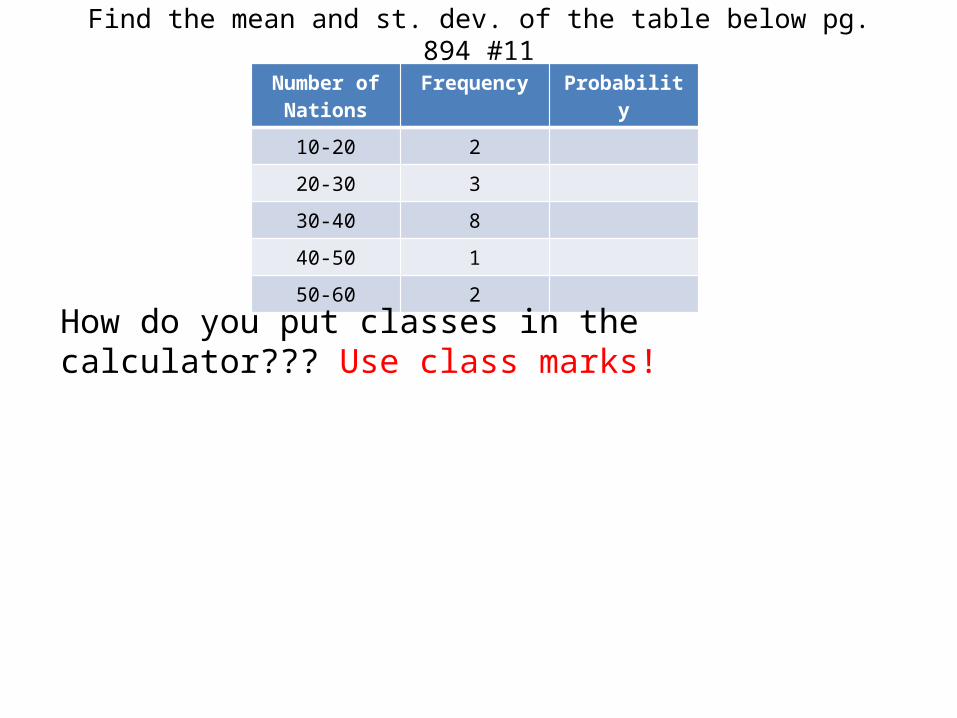
Find the mean and st. dev. of the table below pg. 894 #11Number of
NationsFrequency Probability
10-20 220-30 330-40 840-50 150-60 2
How do you put classes in the calculator??? Use class marks!

Assignment: Work on Please be Discrete Learning Task #1&2