Embed Size (px)
Citation preview
Pilot forest inventory in Costa Rica
for the
Global Forest Survey (GFS) Initiative of FAO FRA
Report to FAO FRA
by Christoph Kleinn and Carla Ramírez, CATIE
Guido Chaves and Sonia Lobo, SINAC
November 2001
GFS – experiences from a pilot study in Costa Rica
Table of contents
ACKNOWLEDGEMENTS ............................................................................................. 3
INTRODUCTION............................................................................................................. 4
OBJECTIVES OF PILOT STUDY................................................................................. 4
PREPARATION ............................................................................................................... 5 COORDINATION WITH SINAC AND ORGANIZATION OF STAFF ......................................... 5 LAND USE CLASSIFICATION APPLIED ............................................................................... 5 DEFINITION OF POPULATION AND SAMPLING FRAME ........................................................ 7
STEP 1: AERIAL PHOTO INTERPRETATION......................................................... 7
PROCEDURE ..................................................................................................................... 7 RESULTS: AERIAL PHOTO INTERPRETATION ..................................................................... 9 ASSESSMENT OF ACCURACY OF AERIAL PHOTO INTERPRETATION................................ 11
STEP 2: FIELD INVENTORY...................................................................................... 12 DESIGN .......................................................................................................................... 12 VARIABLES .................................................................................................................... 16 PREPARATION OF FIELD WORK AND ACTIVITIES RELATED TO FIELD WORK..................... 16 OBSERVATIONS.............................................................................................................. 19 RESULTS: FIELD SURVEY OF BIOPHYSICAL ATTRIBUTES ............................................... 19 TIME CONSUMPTION FOR FIELD WORK ........................................................................... 28 RESULTS: FIELD SURVEY – INCLUDING THE 250 EXTENSION OF FIELD PLOTS................. 29
General remarks ....................................................................................................... 29 Comparison............................................................................................................... 29 Conclusion ................................................................................................................ 30
ESTIMATION OF CARBON STORAGE ................................................................................ 30
STEP 3: SURVEY OF FOREST USE ATTRIBUTES................................................ 32
CONCLUSIONS ............................................................................................................. 32 EVALUATION OF THE DESIGN USED ................................................................................ 32
Interpretation of aerial photographs, and inventory of biophysical attributes ........ 32 Interviews.................................................................................................................. 33
CONSIDERATION FOR RE-MEASUREMENTS IN COSTA RICA............................................. 34 MAJOR LESSONS LEARNED FOR A TRANSFER TO OTHER REGIONS / COUNTRIES............... 35
General observations ................................................................................................ 35 Particularities of Costa Rica .................................................................................... 37
GFS Report – Pilot Inventory in Costa Rica p. 2
GFS – experiences from a pilot study in Costa Rica
APPENDIX...................................................................................................................... 38
ANNEX 1 ........................................................................................................................ 39 A1-1 Land Use Classification System Used.............................................................. 39 A1-2 Variables assessed and codes (as of data base)............................................... 40 A1-3 Structure of Documentation ............................................................................. 45
ANNEX 2 (DOCUMENTS COME SEPARATELY) ................................................................. 46 A2-1 Aerial Photographs: Interpretation and Observations ................................... 46 A2-2 Field Manual................................................................................................... 46 A2-3 Set of Form Sheets........................................................................................... 46 A2-4 GPS Instructions ............................................................................................. 46 A2-5 Information paper presented to INBIO and SINAC at Sept. 12, 2001 to start discussion with national institutions......................................................................... 46
ACKNOWLEDGEMENTS
The planning and implementation of a forest inventory is always an undertaking that depends on the dedication and enthusiasm of many actors, in the office and in the field.
The authors wish to express their sincerest thanks to our colleagues in CATIE who worked directly in the GFS inventory: Marco Chaves, Juan José Rodriguez, Alejandro Cedeño, and William Arreaga, to the Costarrican Forest Consultants who carried out the field work: Jorge Fallas, Miguel Garcia, Igancio Retana, Manuel Solís, Alexis Romero, and Marco Chaves, and of course to all their helpers in the field.
And, our thanks go, of course, also to the many land owners contacted who (mostly) were extremely interested and cooperating, and permitted us to access their lands to carry out the field measurements. Many of them were also ready to be interviewed and allowed us to collect systematic information on their view of the forest and tree resource.
Our sincere thanks go also to the FRA team in FAO for entrusting us with this pilot inventory work and for the permanent and efficient feedback. We extend our particular thanks to Mr. Mohamed Saket, our direct counterpart, for an excellent cooperation and to Dr. Peter Holmgren, who was the overall coordinator.
GFS Report – Pilot Inventory in Costa Rica p. 3
GFS – experiences from a pilot study in Costa Rica
INTRODUCTION
The GFS pilot inventory in Costa Rica was carried out under a Letter of Agreement (LoA) between FAO FRA and CATIE where SINAC, the Costa Rican authority among others in charge of the forests was principal counterpart on the national level.
Background is the idea of the FRA program to introduce new approaches into the generation of global forest and natural resources information, focusing on the enforcement of capacity on a national level which is considered the key to improving forest information quality.
In many tropical countries, including Costa Rica, the need for up-to-date information on the natural resources is generally accepted , and Costa Rica is a country in which a whole series of corresponding activities has been carried out. There is actually no deficit in figures on forest area,. However, figures are frequently contradictory, and what is called “forest inventory” turns practically generally to be out to be a satellite imagery based mapping study. To the knowledge of the authors, however, no study has been carried out recently that includes a comprehensive field phase, and that allows to come up with estimations of classical forest mensurational attributes like species composition, basal area, volume, biomass or carbon stored on a country level.
In addition the actual focus in forest policy and planning looks more and more towards the land owner’s attitude to forest, so that it was considered relevant to not only concentrate on the traditional biophysical attributes, but to also include as one of the novel components of the exercise some attributes that are related to the use of the forests.
OBJECTIVES OF PILOT STUDY
Overall objective is generating concrete experiences in installing an inventory on national level that combines biophysical and forest use aspects, that may serve as an example in other countries.
Under this general objective, there are several major technical objectives:
• Plan, prepare, carry out, and analyze a field inventory of biophysical attributes.
• Establish a cooperation with institutions in Costa Rica.
• Capacity building of and awareness building among national forest experts in forest assessments and forest inventory techniques.
• (Plan, prepare, carry out, and analyze a field inventory of forest use attributes: this under the responsibility of an external consultant)
GFS Report – Pilot Inventory in Costa Rica p. 4
GFS – experiences from a pilot study in Costa Rica
PREPARATION
COORDINATION WITH SINAC AND ORGANIZATION OF STAFF
Cooperation with SINAC was continued as described in the report to LoA I. All important decisions were taken after communication and in coordination with SINAC officials. SINAC helped actively in identification of the “forest use” consultant, instructed their local and regional offices to help our field crews and issued formal permits that are required to enter National Parks.
Frequent meetings were hold in SINAC headquarters in San José, and some times also in CATIE. Overall, interest of and cooperation with SINAC was entirely successful. The understanding of the study’s intentions and objectives, and the enthusiasm of the professionals in charge of the pilot study makes one confident that the idea of a permanent inventory remains alive and will be pursued actively.
In CATIE, technical staff was contracted to cover all aspects of planning, supervision, analysis and reporting. One forest engineer on a MSc level was contracted to work as technical coordinator of the study. Three foresters (BSc level) assisted in office and field work (preparation of materials for field crews, participation in supervision field trips, interpretation of aerial photographs, data checking and preparation of analysis). Two further colleagues helped part time in document preparation, image printing etc.). CATIE then contracted forest consultants (6 in total) for field work. These field crew leaders had good local experience as they usually are contracted by forest owners to write management plans for them. These consultants (field crew leaders) received thorough training, in house and in the field, and were then responsible, permanently in contact with the CATIE staff and also with SINAC, for all aspects of field inventory, including the measurement of the biophysical data set and the interviews. They hired the field helpers and used their own transport and measuring equipment.
LAND USE CLASSIFICATION APPLIED
The classification of land use that was finally applied had been elaborated by professionals of FAO, SINAC, UNA and CATIE on the occasion of the GFS workshop held in Costa Rica in November 2000.
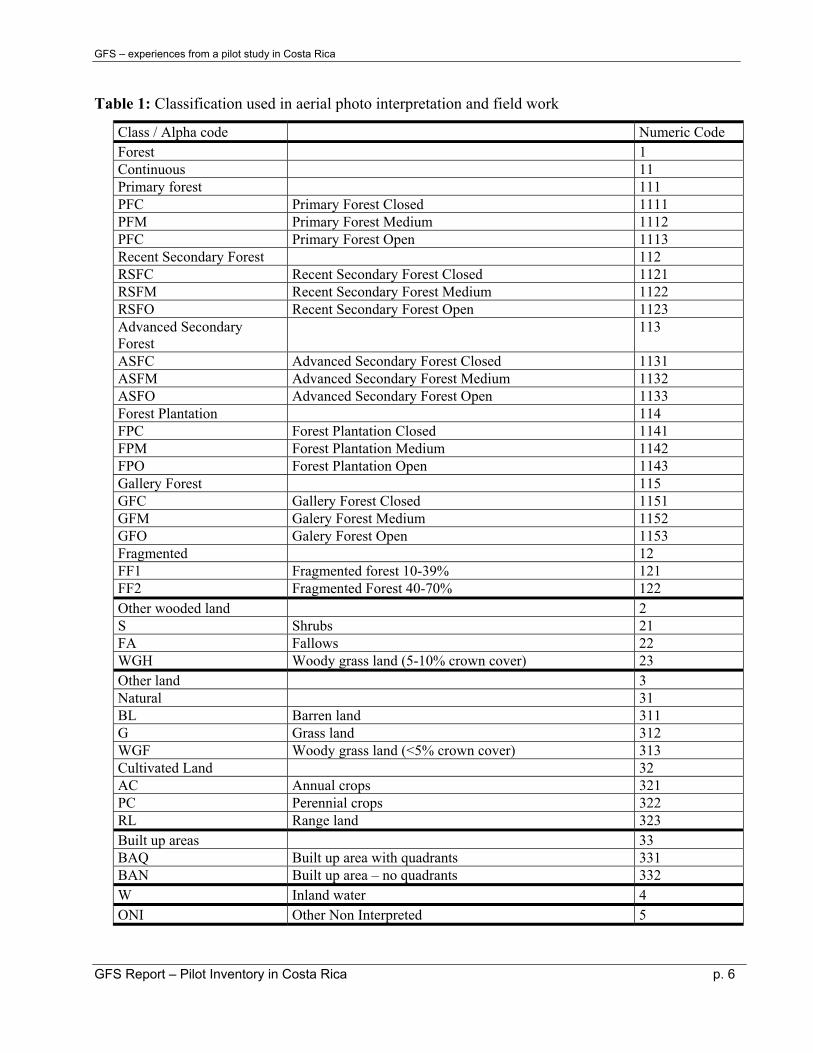
A multi-level approach was chosen, where the FAO definitions were respected, but where it was also accepted that under the broad classes of forest, other wooded land, other land, and inland-water the countries should have the possibility to tailor their own specific sub-classes. This was also done in Costa Rica resulting in the classes that are given in Table 1.
The usefulness of the classification proposed was validated during photo interpretation and field work, where some interesting findings came out:
• Contrary to our initial expectations, we found “open” forest classes (cover 10-40%), mainly for young secondary forest.
GFS Report – Pilot Inventory in Costa Rica p. 5
GFS – experiences from a pilot study in Costa Rica
Table 1: Classification used in aerial photo interpretation and field work
Class / Alpha code Numeric Code Forest 1 Continuous 11 Primary forest 111 PFC Primary Forest Closed 1111 PFM Primary Forest Medium 1112 PFC Primary Forest Open 1113 Recent Secondary Forest 112 RSFC Recent Secondary Forest Closed 1121 RSFM Recent Secondary Forest Medium 1122 RSFO Recent Secondary Forest Open 1123 Advanced Secondary Forest
113
ASFC Advanced Secondary Forest Closed 1131 ASFM Advanced Secondary Forest Medium 1132 ASFO Advanced Secondary Forest Open 1133 Forest Plantation 114 FPC Forest Plantation Closed 1141 FPM Forest Plantation Medium 1142 FPO Forest Plantation Open 1143 Gallery Forest 115 GFC Gallery Forest Closed 1151 GFM Galery Forest Medium 1152 GFO Galery Forest Open 1153 Fragmented 12 FF1 Fragmented forest 10-39% 121 FF2 Fragmented Forest 40-70% 122 Other wooded land 2 S Shrubs 21 FA Fallows 22 WGH Woody grass land (5-10% crown cover) 23 Other land 3 Natural 31 BL Barren land 311 G Grass land 312 WGF Woody grass land (<5% crown cover) 313 Cultivated Land 32 AC Annual crops 321 PC Perennial crops 322 RL Range land 323 Built up areas 33 BAQ Built up area with quadrants 331 BAN Built up area – no quadrants 332 W Inland water 4 ONI Other Non Interpreted 5
GFS Report – Pilot Inventory in Costa Rica p. 6
GFS – experiences from a pilot study in Costa Rica
• Gallery forest was finally defined as an own class. The justification is, that it is difficult to assign it to any other class, as gallery forests show many different characteristics (sometimes more primary and untouched, sometimes no understory at all, some times clearly secondary). In addition, the elongated shape of gallery forests along creeks and other waters make them have a very distinct ecological meaning: they probably offer more diverse living conditions as other forests of the same area, and they can easily serve as biological mini-corridors.
• For analysis, we created the class “trof land”, where trof stands for Tree Resources Outside Forests; this class comprises all lands where there is the chance that trees are found – mainly cultivated lands, and excluding water, high mountain areas, barren land, etc.
DEFINITION OF POPULATION AND SAMPLING FRAME
Population of interest is defined as the continental territory of Costa Rica, and the population of trees and forest on it.
For the interpretation of the aerial photographs, only a partial coverage was available, so that the sampling frame is restricted to them, covering about 2/3 of the area of continental Costa Rica. Area estimates coming from the aerial photo survey do therefore only refer to a part of Costa Rica. It is the Northern Zone where, due to frequent cloud cover, there were no aerial photographs available.
For the field work, all Costa Rica was planned to be the sampling frame. However, due to access problems in remote areas, some sample locations could not be visited, what modifies the sampling frame also for the field phase. As these non-response areas are mainly those in the center of closed forest areas (National Parks), this affects above all the estimates for primary forest. Therefore, estimates for primary forest do base more than expected on observations outside national parks; the primary forests in remote areas are under-represented in the sample plots. For area estimations, we obviously used “primary forest” as forest type; however, no imputation or other attempt of data generation was undertaken, but there were simply no tree data for these plots.
In both cases, for the aerial photo survey and for the field phase, the actual sampling frame has to be taken into account when making an interpretation of the results.
STEP 1: AERIAL PHOTO INTERPRETATION
PROCEDURE
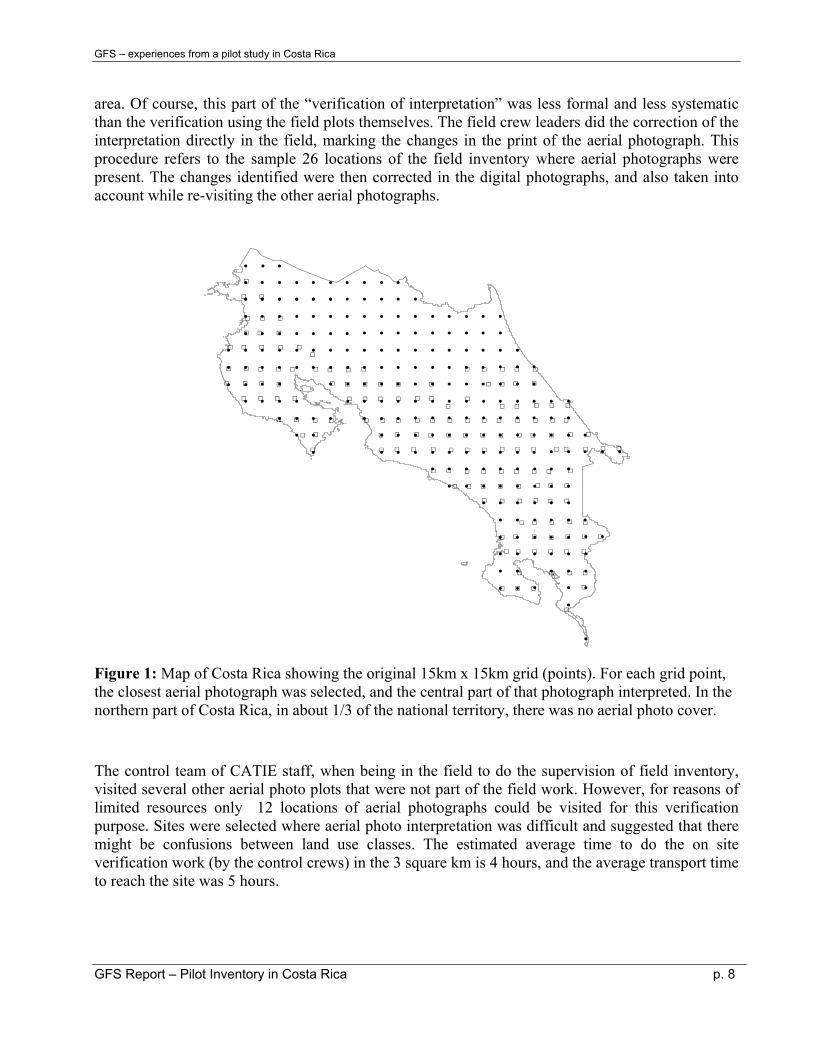
Design and interpretation procedure of aerial photo interpretation and analysis is given in detail in “REPORT II GFS”. Figure 1 shows the sample grid used. In the context of the LoA of this report, the formerly made interpretation was re-visited to allow for integration of the experiences made in the field.
The field crew leaders had prints of the aerial photos of each sample site with them and checked the interpretation of the land uses intersected by the field plots. They also had the instruction to check the land uses in the direct vicinity, particularly in terrain that allowed to have an view over a larger
GFS Report – Pilot Inventory in Costa Rica p. 7
GFS – experiences from a pilot study in Costa Rica
area. Of course, this part of the “verification of interpretation” was less formal and less systematic than the verification using the field plots themselves. The field crew leaders did the correction of the interpretation directly in the field, marking the changes in the print of the aerial photograph. This procedure refers to the sample 26 locations of the field inventory where aerial photographs were present. The changes identified were then corrected in the digital photographs, and also taken into account while re-visiting the other aerial photographs.
U
U U U U
U U U U
U U U U U U
U U U U U U U
U U U U U
U U U U U U
U U U U
U
U U U U
U U U U U U U U U
U U U U U U U U U U U U U U U U
U U U U U U U U U U U U U U U
U U U U U U U U U U U U U U U U
U U U U U U U U U U
UU
U U U U U
U U U U U U U U U U U U U U
U U U U U U U U U U U U U U
U U U U UU
U U U
U U U
UU
U
#
#
# # # # #
# # # # #
# # # # # #
# # # # # # #
# # # # # #
# # # # # #
# # # # # # # #
# # # # # # # # #
# # # # # # # # # # # # # # # #
# # # # # # # # # # # # # # #
# # # # # # # # # # # # # # # # #
# # # # # # # # # # # # # # # # # #
# # # # # # # # # # # # # # # # #
# # # # # # # # # # # # # # # # # # #
# # # # # # # # # # # # # # # # # #
# # # # # # # # # # # # # # # #
# # # # # # # # # # # # # # # #
# # # # # # # # # # #
# # # # # # # # # #
# # #
# # # # # #
Figure 1: Map of Costa Rica showing the original 15km x 15km grid (points). For each grid point, the closest aerial photograph was selected, and the central part of that photograph interpreted. In the northern part of Costa Rica, in about 1/3 of the national territory, there was no aerial photo cover.
The control team of CATIE staff, when being in the field to do the supervision of field inventory, visited several other aerial photo plots that were not part of the field work. However, for reasons of limited resources only 12 locations of aerial photographs could be visited for this verification purpose. Sites were selected where aerial photo interpretation was difficult and suggested that there might be confusions between land use classes. The estimated average time to do the on site verification work (by the control crews) in the 3 square km is 4 hours, and the average transport time to reach the site was 5 hours.
GFS Report – Pilot Inventory in Costa Rica p. 8
GFS – experiences from a pilot study in Costa Rica
RESULTS: AERIAL PHOTO INTERPRETATION
Preliminary results of the photo interpretation were delivered in a former report (March 2001). Details of aerial photograph selection, preparation, and interpretation procedure are given there.
Having acquired comprehensive field experience, the interpretation was re-done. All 159 photographs were re-visited for interpretation and a series of corrections and enhancements made, including the new class “gallery forest” which – to the judgement of the authors – should be treated as a separate class even though its overall cover percentage might appear little (an estimated less than 3%). Major confusions could be reduced, which refers mainly to land use classes prone to mis-classification, including young secondary forest and range land, which may be confused with range land and forest, respectively.
Table 2 shows major characteristics of the 159 aerial photographs used for interpretation. While the idea was in the beginning to establish aerial photo plots of 3km side length in the field, we finally decided to utilize plots that are of fixed size in the aerial photos to avoid different degrees of geometric distortion (due to not having orthorectified the photographs). The fixed size of the aerial photo plots in the photographs made that the actual size in the field varied from 2.72km side length to 4.52km with the actual scale of the photograph varying from about 1:32,000 to 1:53,000.
Table 2: General characteristics of aerial photographs used for interpretation and estimation of cover.
Mean Minimum Maximum
Side length of AP plot [km] 3.73 2.72 4.52Area of AP Plot [km2] 14.03 7.38 20.39
Scale 1: 43549 31684 52687
The results of the revised interpretation of the aerial photographs are given in detail (per land use class) in , a breakdown according to forest classes is in Table 4, and a gross breakdown into forest and non-forest in Table 5. The percent standard error given is the simple standard error, not the width of the confidence interval; and the standard error is given in % of the area estimate, not as % area. The absolute standard error of the estimates is low for those land use types that were more evenly found over the 159 aerial photo plots, and higher for those that show a bigger spatial variability; the relative standard error (in percent) does then also depend of the area estimation itself.
Table 3
GFS Report – Pilot Inventory in Costa Rica p. 9
GFS – experiences from a pilot study in Costa Rica
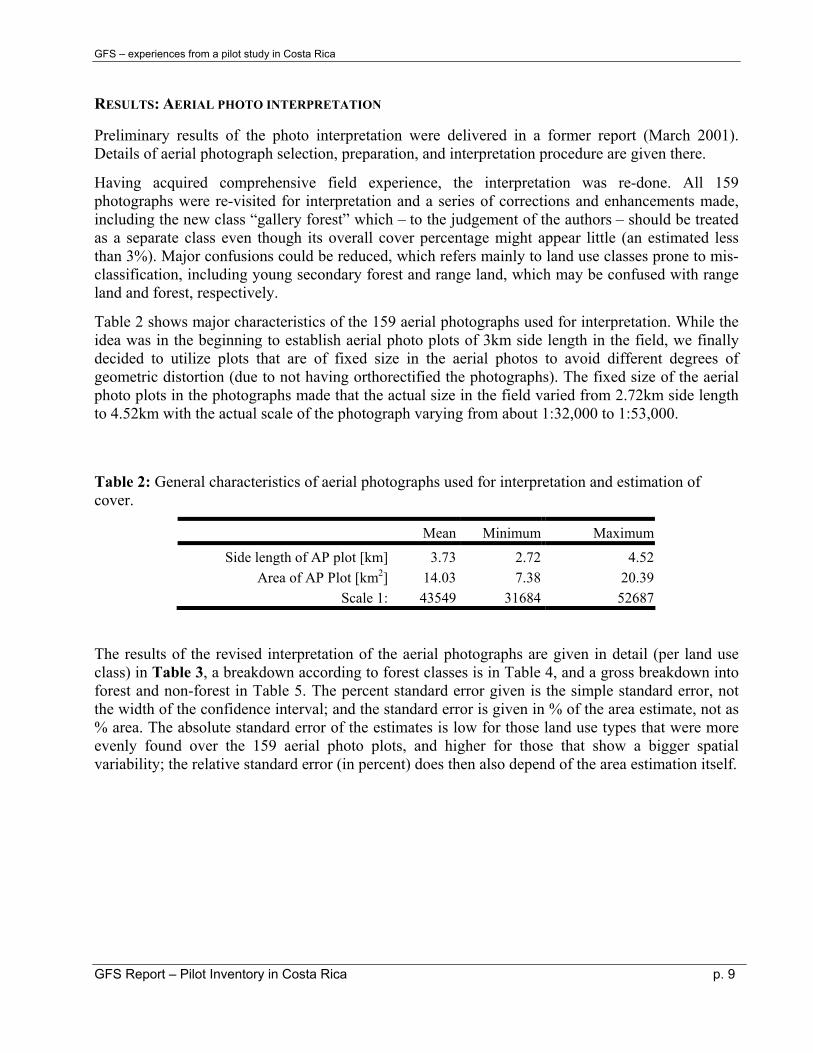
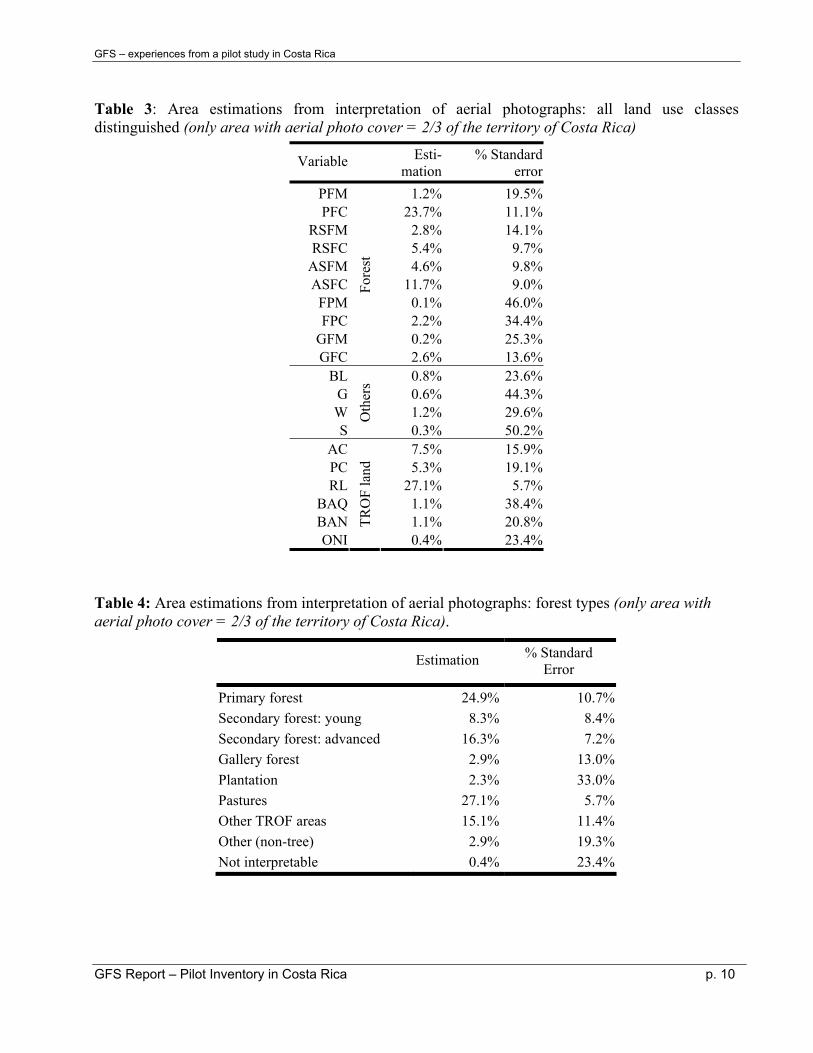
Table 3: Area estimations from interpretation of aerial photographs: all land use classes distinguished (only area with aerial photo cover = 2/3 of the territory of Costa Rica)
Variable Esti-mation
% Standard error
PFM 1.2% 19.5%PFC 23.7% 11.1%
RSFM 2.8% 14.1%RSFC 5.4% 9.7%
ASFM 4.6% 9.8%ASFC 11.7% 9.0%FPM 0.1% 46.0%FPC 2.2% 34.4%
GFM 0.2% 25.3%GFC
Fore
st
2.6% 13.6%BL 0.8% 23.6%
G 0.6% 44.3%W 1.2% 29.6%S
Oth
ers
0.3% 50.2%AC 7.5% 15.9%PC 5.3% 19.1%RL 27.1% 5.7%
BAQ 1.1% 38.4%BAN 1.1% 20.8%ONI
TRO
F la
nd
0.4% 23.4%
Table 4: Area estimations from interpretation of aerial photographs: forest types (only area with aerial photo cover = 2/3 of the territory of Costa Rica).
Estimation % Standard Error
Primary forest 24.9% 10.7% Secondary forest: young 8.3% 8.4% Secondary forest: advanced 16.3% 7.2% Gallery forest 2.9% 13.0% Plantation 2.3% 33.0% Pastures 27.1% 5.7% Other TROF areas 15.1% 11.4% Other (non-tree) 2.9% 19.3% Not interpretable 0.4% 23.4%
GFS Report – Pilot Inventory in Costa Rica p. 10

GFS – experiences from a pilot study in Costa Rica
Table 5: Area estimations from interpretation of aerial photographs: forest – non-forest (only area with aerial photo cover = 2/3 of the territory of Costa Rica).
Esti- mation
% Standard Error
Forest 54.6% 3.8%TROF land 42.1% 5.2%
Others 2.9% 20.7%Non interpretable 0.4% 25.0%
The sample frame must be considered when interpreting these results. A forest cover of 54.6% was determined for the area covered by aerial photographs. However, this refers only to about 2/3 of the territory of Costa Rica, which is roughly 34,000km
2 of the national continental territory of Costa
Rica). For the missing about 17,000km2 no immediate estimation can be derived from the aerial photo plot interpretation. In 1992/1993, a forest inventory in the Northern Zone of Costa Rica was carried out that gave an estimated about 25% of forest area (total inventory area was 6000km2). This is about only 1/3 of the missing 17,000km2 ), not including, for example, the densely forested northern slopes of the Cordillera Central. Therefore, if we extrapolate this 25% to the entire no-response area, we are likely to deal with a lower limit. Combining the two figures, one from our aerial photo interpretation of 2/3 of the area and one from this older inventory results in (54.6% * 2/3) + (25% * 1/3) = 44.7% as an approximation of forest area for the whole of Costa Rica.
ASSESSMENT OF ACCURACY OF AERIAL PHOTO INTERPRETATION
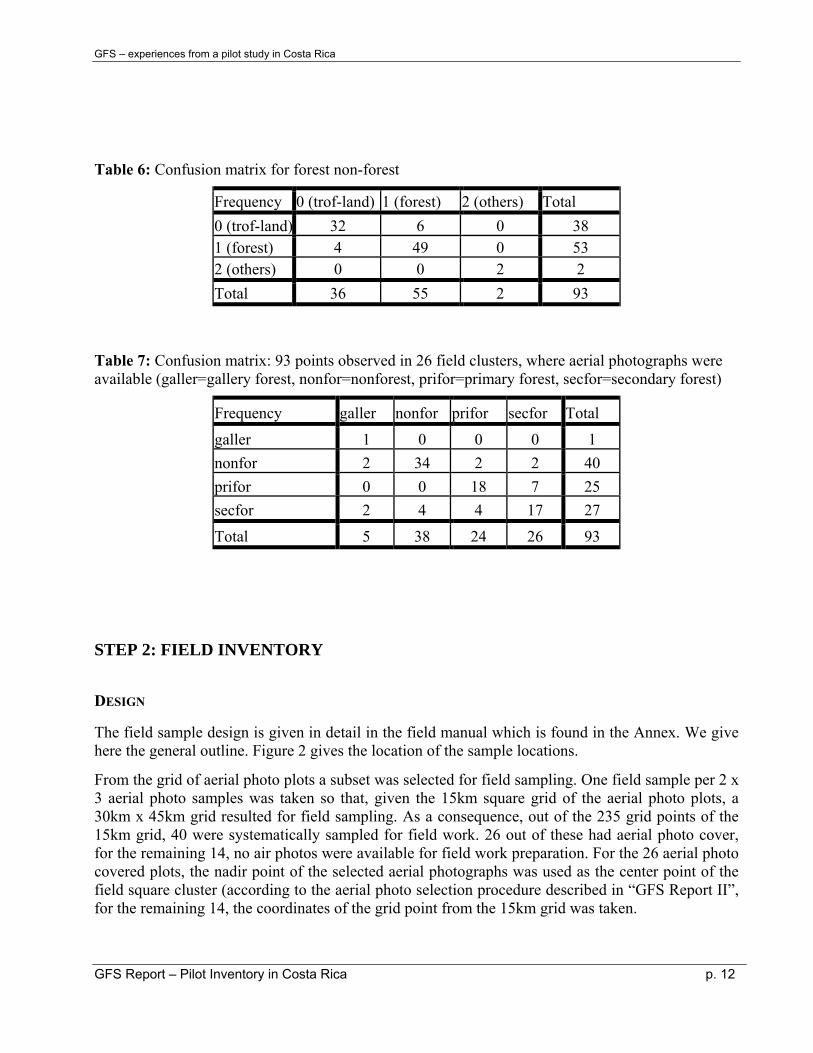
The field visit of a subset of air photo plots allowed to make an accuracy assessment. Though it was not the major purpose of the field work to do an air photo interpretation accuracy assessment, some general observations can be made from Table 6 and Table 7.
For the “simple” forest/non-forest differentiation, an overall accuracy of 83/93 was reached which corresponds to 89.2% ( ). Broken down to forest classes the overall accuracy is 70/93, which is about 75.3%. ( ). The data are based on 93 cluster corners in the 26 field clusters. In some clusters, no field observations could be made, for access problems. The non-accessible cluster sub-plots were practically all in densely forested area, where we may assume that the classification into the class “forest” would have been confirmed by the field observations. In that sense, what is given in Table 6 and Table 7 may be interpreted as a lower bound of the true accuracy.
Table 6Table 7
It should be observed that this accuracy assessment embraces both locational and thematic accuracy, and also confusions that have to do with a real change in land use (the aerial photographs were about 4 years old).
GFS Report – Pilot Inventory in Costa Rica p. 11
GFS – experiences from a pilot study in Costa Rica
Table 6: Confusion matrix for forest non-forest
Frequency 0 (trof-land) 1 (forest) 2 (others) Total 0 (trof-land) 32 6 0 38 1 (forest) 4 49 0 53 2 (others) 0 0 2 2 Total 36 55 2 93
Table 7: Confusion matrix: 93 points observed in 26 field clusters, where aerial photographs were available (galler=gallery forest, nonfor=nonforest, prifor=primary forest, secfor=secondary forest)
Frequency galler nonfor prifor secfor Total
galler 1 0 0 0 1 nonfor 2 34 2 2 40 prifor 0 0 18 7 25 secfor 2 4 4 17 27
Total 5 38 24 26 93
STEP 2: FIELD INVENTORY
DESIGN
The field sample design is given in detail in the field manual which is found in the Annex. We give here the general outline. Figure 2 gives the location of the sample locations.
From the grid of aerial photo plots a subset was selected for field sampling. One field sample per 2 x 3 aerial photo samples was taken so that, given the 15km square grid of the aerial photo plots, a 30km x 45km grid resulted for field sampling. As a consequence, out of the 235 grid points of the 15km grid, 40 were systematically sampled for field work. 26 out of these had aerial photo cover, for the remaining 14, no air photos were available for field work preparation. For the 26 aerial photo covered plots, the nadir point of the selected aerial photographs was used as the center point of the field square cluster (according to the aerial photo selection procedure described in “GFS Report II”, for the remaining 14, the coordinates of the grid point from the 15km grid was taken.
GFS Report – Pilot Inventory in Costa Rica p. 12
GFS – experiences from a pilot study in Costa Rica
#
#
# # # # # # #
# # # # #
#
% % % % % % % %
%
% % % %
%
% % % % U
%
% % % % % % %
1 1 8 1 2 0 1 22 124 126 128 130 1 3 2
1 5 3
17 1 9 2 1 23
3
36 38 4 1 4 3
5
6 9 72 74 76 78 8 0 8 2
1 6 2
166
1 8 4 1 8 6 188 190 192 194 196
2 1 9 2 2 1 2 2 3 225 227
4 0
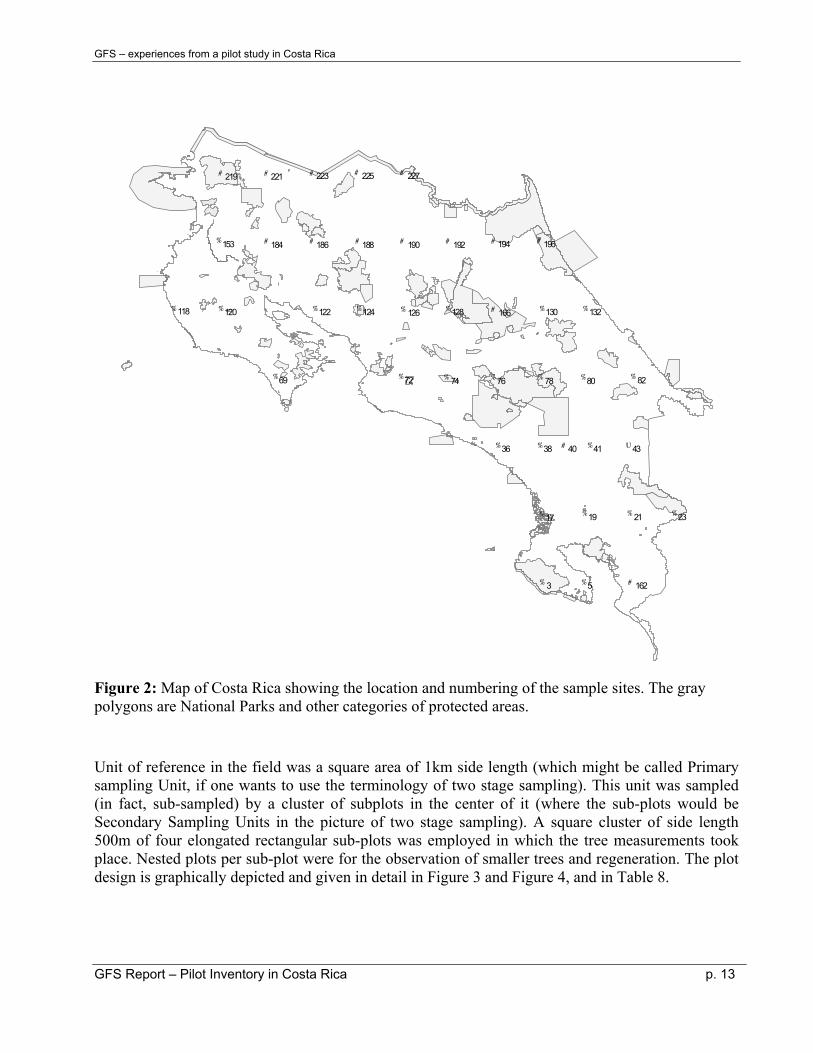
Figure 2: Map of Costa Rica showing the location and numbering of the sample sites. The gray polygons are National Parks and other categories of protected areas.
Unit of reference in the field was a square area of 1km side length (which might be called Primary sampling Unit, if one wants to use the terminology of two stage sampling). This unit was sampled (in fact, sub-sampled) by a cluster of subplots in the center of it (where the sub-plots would be Secondary Sampling Units in the picture of two stage sampling). A square cluster of side length 500m of four elongated rectangular sub-plots was employed in which the tree measurements took place. Nested plots per sub-plot were for the observation of smaller trees and regeneration. The plot design is graphically depicted and given in detail in Figure 3 and Figure 4, and in Table 8.
GFS Report – Pilot Inventory in Costa Rica p. 13
GFS – experiences from a pilot study in Costa Rica
In the field inventory, there were four levels of information gathered:
• Sample site / reference unit (1 km2)
• Sub-plots within cluster
• Units of land use within sub-plots
• Trees, either individual tree measurements in the two larger plot areas, or density measurements (counts) in the regeneration plots.
#
1
2 3
4
500 m
500 m
N
1 km
1km
Unidad de muestreo (Um)Parcela o conglomerado Subparcela
#
Centro del punto de muestreo
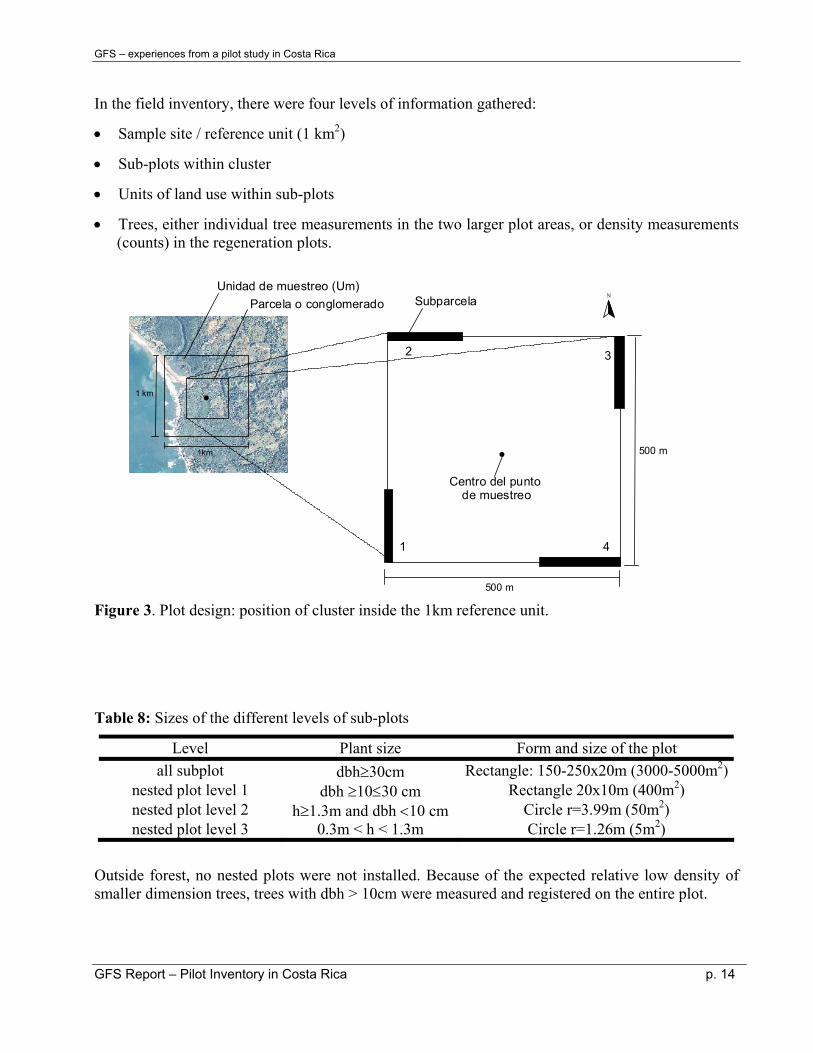
Figure 3. Plot design: position of cluster inside the 1km reference unit.
Table 8: Sizes of the different levels of sub-plots
Level Plant size Form and size of the plot all subplot dbh≥30cm Rectangle: 150-250x20m (3000-5000m2)
nested plot level 1 dbh ≥10≤30 cm Rectangle 20x10m (400m2) nested plot level 2 h≥1.3m and dbh <10 cm Circle r=3.99m (50m2) nested plot level 3 0.3m < h < 1.3m Circle r=1.26m (5m2)
Outside forest, no nested plots were not installed. Because of the expected relative low density of smaller dimension trees, trees with dbh > 10cm were measured and registered on the entire plot.
GFS Report – Pilot Inventory in Costa Rica p. 14
GFS – experiences from a pilot study in Costa Rica
4
500 m
500 m
1
N
####S#
indicador AFB 50 m
Subparcela (Sp)150 m
Subparcela extra AFB 100 m
20 m
#
10 mPuntos de medición (Pm)
# #
#
PAN 1 (20 x 10 m)
#
Carril central#
PAN 2 ( r = 3.99 m)
#
PAN 3 (r = 1.26 m)
#
Puntoinicial
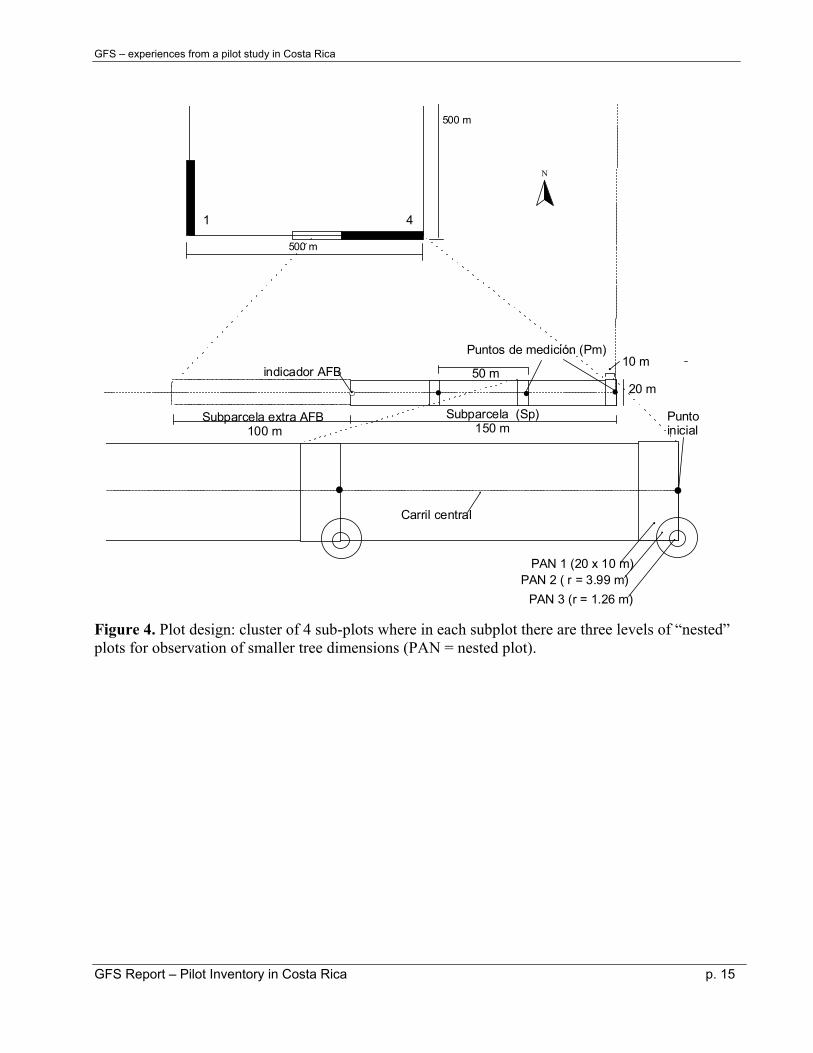
Figure 4. Plot design: cluster of 4 sub-plots where in each subplot there are three levels of “nested” plots for observation of smaller tree dimensions (PAN = nested plot).
GFS Report – Pilot Inventory in Costa Rica p. 15
GFS – experiences from a pilot study in Costa Rica
The plots were established as permanent plots in such a way that they can easily be re-located; therefore it was part of the plot design to establish permanent markers (aluminum tubes), to sketch sample maps showing well visible reference points, and to take – wherever possible – a series of GPS measurements. Where available, the aerial photographs and the printing of the cluster on it will be an important help in re-location.
VARIABLES
The list of variables is in Annex 1. All listed variables were measured. Analysis done for this report, concentrated on the major dasometric variables.
PREPARATION OF FIELD WORK AND ACTIVITIES RELATED TO FIELD WORK
• A total number of 40 sample locations were selected for field work.
34 locations were visited and completely measured,
because of access problems for cluster 43, this one was not realized, but it was planned to shift it to cluster 40, which then also presented serious problems - only one circular plot could be established as, for topographic reasons and a (minor) accident in the field the field team was not able to complete the entire cluster,
three clusters could not be completed for access problems: in cluster 76, only two sub-plots were measured, in cluster 78 three, and in cluster 80 only one,
in cluster 126 one sub-plot could not be visited and measured due to access denial through the owner.
In what follows the organization of the field work is described:
Compiling all necessary information.
• 21 aerial photographs that were scanned with high resolution (corresponding to an about 1m ground resolution) were orthorectified. For the remaining 5 photographs (of the 26 for field measurements) an orthorectification could not be done due to lack of good ground reference points.
Therefore, in a total of 19 field locations, only maps could be used for locating the sample points (the 5 not-orthorectified photographs and the 14 without aerial photo cover)
• Sample points were defined in the field according to the central point of the aerial photographs. Geographic coordinates (Lat-Lon) were calculated to allow for GPS application.
• The entire plot design was printed onto the aerial photographs and maps in order to help the field crew with the orientation in the field (examples of aerial photographs are in the Annex, and a complete set in the project materials delivered).
• A detailed field manual was written, discussed, reviewed, tested. Also, a detailed manual about the use of the GPS was written, as the contracted foresters had no comprehensive experiences.
GFS Report – Pilot Inventory in Costa Rica p. 16
GFS – experiences from a pilot study in Costa Rica
• Design an elaboration of form sheets to accommodate the set of attributes to observe in the field. A relatively small format was chosen to facilitate working with it in the field. A portion of form sheets was printed on waterproof paper to enable the field crews to continue working in rain.
Five different form sheets were developed according to the five levels of information (Cluster=Tract, Subplots, Stands, Trees and Reference points)
• A data base was designed to enter the field data; the structure of the data base followed the definition of FAO FRA. Data were stored in EXCEL.
• The field crew leaders contracted received a 2 days training in CATIE (early April).
• A workshop was organized in which ideas and definitions of the GFS initiative and also of the pilot study were explained and discussed. The field manual was also gone through in detail, and the use of the form sheets developed.
• The use of GPS, of the aerial photographs, and of the prepared sections of the topographic maps was trained.
• A list of those SINAC officers was set up who served as contact points for the field crew leaders in the regional SINAC offices.
• Each one of the field crew leaders was accompanied to the first field plot he realized; one or two CATIE experts were present. This was deemed necessary to guarantee a high level of standardization of the field procedures.
Activities for which each field crew leader was responsible for:
• Contacts to SINAC officers in the regional offices.
• First visit to the sample site to familiarize themselves with the area, contact the owners and have a first talk with them. Frequently, the regional SINAC officers accompanied the field crew leaders in this first trip. On this first trip field helpers and tree spotters were identified and contracted, where possible exactly from the same locality/farm where the sample was.
• Search of the starting point of the cluster, using GPS and the documentation provided by CATIE. The way to the starting point was described in a form sheet and marked with permanent marks for re-location.
• Measurements in the sub-plots.
• Possibly unclear details were written down to be discussed on telephone with the CATIE group in the evening.
• Field photographs were taken of typical aspects. Exact location of the photographer and direction of taking was recorded.
• Interview with the land owner.
• Organization of the information gathered, entering the data in the data base prepared by CATIE, and elaboration of a report and documentation of the data and experiences of the sample plot.
GFS Report – Pilot Inventory in Costa Rica p. 17

GFS – experiences from a pilot study in Costa Rica
Activities of supervision and verification:
• The data and documents submitted by the field crew leaders were archived and checked for completeness. A first and superficial check of correctness was done upon arrival of the data.
• The field crews were accompanied in the field to supervise and discuss problematic issues. In most cases, this sort of control was preferred over the independent control measurements which lack the character of training. In total, 20 sample points were visited for supervision by the CATIE team.
• Seven sample points were visited independently (verification)
• For each supervision visit a brief report was composed analyzing the findings and impressions. These reports were then circulated to all field crew leaders so that all had always about the same level of information about the development of the discussions in the project.
This flow of information was laborious but considered a necessary feedback.
• In each field visit additional terrestrial photographs were taken, above all when discussing problems of land use classification.
• A midterm meeting was organized in CATIE to have a common forum for discussion of problems and difficulties, with respect to field work and application of the methodology.
Activities with respect to data management:
• The geographic information (based on the GPS coordinates) was entered into a data base in the programs Surfer and ArcView for posterior easier access to the information. All sub-plots are georeferenced and accordingly registered. The tree coordinates within single sub-plots have been estimated in the field, and tree maps were produced for each sub-plot. All this plot description will help to re-locate the sample locations at later points in time.
• At the end all individual data bases prepared by the field crew leaders were combined into one single data base. This data base was checked step by step for consistency and correctness before entering in the analysis
Training and Capacity Building Activities:
• Training and capacity building accompanies necessarily each forest inventory. Our activities did also extend towards an awareness building, as the idea, concepts, and justification of large area forest inventories is not so well-known in Costa Rica and the region. On the contrary, little confidence was there with respect to what can be concluded from a study with such a low sampling intensity.
• For a number of reasons, we worked with several field crews. Thus, many foresters were trained in the inventory procedure, but learned as well about the GFS initiative, the FRA Programme, and the general background and justification of large area forest assessments. These training activities reached the 6 field crew leaders and their technicians. About 15 foresters have benefited from this training.
GFS Report – Pilot Inventory in Costa Rica p. 18
GFS – experiences from a pilot study in Costa Rica
• In CATIE, a core group worked on the planning of the field work, on the documentation of the project and its results, on data management and data analysis. A total of 9 persons contributed in CATIE and received corresponding training.
• Several meetings and workshops were held with participation of foresters and experts from other sectors of different institutions in Costa Rica.
OBSERVATIONS
The maximum time consumed for the measurement of one cluster was ten days (Corcovado), with a total of 5 days for field work. The most rapid clusters were done in a total of 7.5 days, 2.5 days for field work, and those were clusters that came to lie completely in pineapple and in banana plantations.
Apart from Corcovado, the most difficult field conditions were found in Tapantí, Pejibaye and Chirripó; none of tose could be completed as it was too tedious to move from one subplot to the next one.
The geo-referenciation of the aerial photographs facilitated the use of geographical data in the field, the use of GPS and the location of the plots. However, in some cases there were not enough reference points on the 1:50,000 topographic maps that were used for this purpose as to allow for proper georeferencing. Possibly, the new 1:25,000 maps will improve the situation (they are not available as of October 2001).
Defining clear what the variables are, for what and how they are measured is of the most relevance to homogenize the assessment by the field teams. We had to re-discuss several variables in the course of the field work. This is a typical characteristic of a pilot study but must be avoided in final inventory implementation, as it may cause confusion and inconsistencies.
The permanent supervision and presence of the CATIE staff in the field was very important; errors and inconsistencies could be detected
RESULTS: FIELD SURVEY OF BIOPHYSICAL ATTRIBUTES
The results of the analysis of the field survey are presented in Table 9 to Table 22, where basal area is always given in m2/ha and volumen in m3/ha.
All results must be interpreted keeping in mind the relatively low sampling intensity. However, statistical validity is there. All results presented refer to the whole reference area (which is Costa Rica). Further geographical subdivisions would naturally reduce precision as less samples would come to lie in these sub-regions. For the dasometric variables, the relative standard error for the estimations is given. For the calculation of this standard error, the estimator for random sampling was employed. This is standard as for systematic sampling there is no design based unbiased estimation for the variance. It is known, however, that application of random sampling estimators leads to a conservative precision estimate; meaning that we are likely to be much more precise than the values given in the tables. Yet, how much better, can not be determined.
GFS Report – Pilot Inventory in Costa Rica p. 19
GFS – experiences from a pilot study in Costa Rica
The analysis is focused on the forestry key variables basal area, volume, and tree density. For volume the formula of Lojan was used, the standard formula that is applied in Costa Rica. It gives the commercial stem volume. This was calculated for all trees with a dbh>30cm:
log Vol =2.03986 log dbh + 0.779 log h – 4.07682
Given the relevance of biomass and carbon estimations in the context of the UNFCCC, an estimation of carbon stored was also calculated. We used for that a still unpublished biomass formula of a research project currently concluded in CATIE, that bases upon biomass measurements of a total of about 75 forest and non-forest trees < >. From dry weight to carbon we used then the conversion factor 0.5. These calculations must be seen as approximations to above ground tree carbon.
2tree dry weight[kg] = -136.80 + 0.61446d
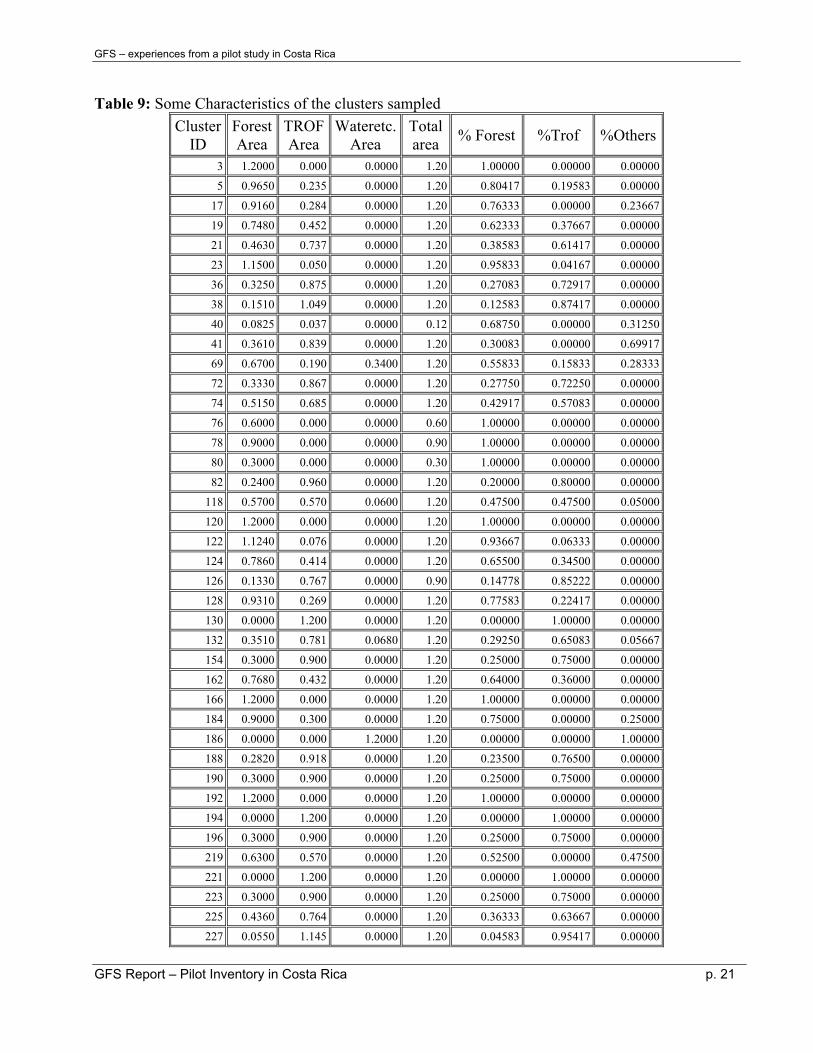
Table 9 gives some basic characteristics of the clusters sampled, specifying the total area of the subplots sampled, and the corresponding absolute and relative area in forest, trof-land, and others. Of the 38 clusters, 7 were completely in forest, and 4 completely outside forest, while in 27 both forest and non-forest were found in the field plots. This is an indication for a fairly fragmented landscape, where there are more bigger compact forest blocks than bigger completely forest-free areas, or (the known fact) that there are still some major closed forest areas (above all in the national parks), and that forest fragments are in most regions of the country.
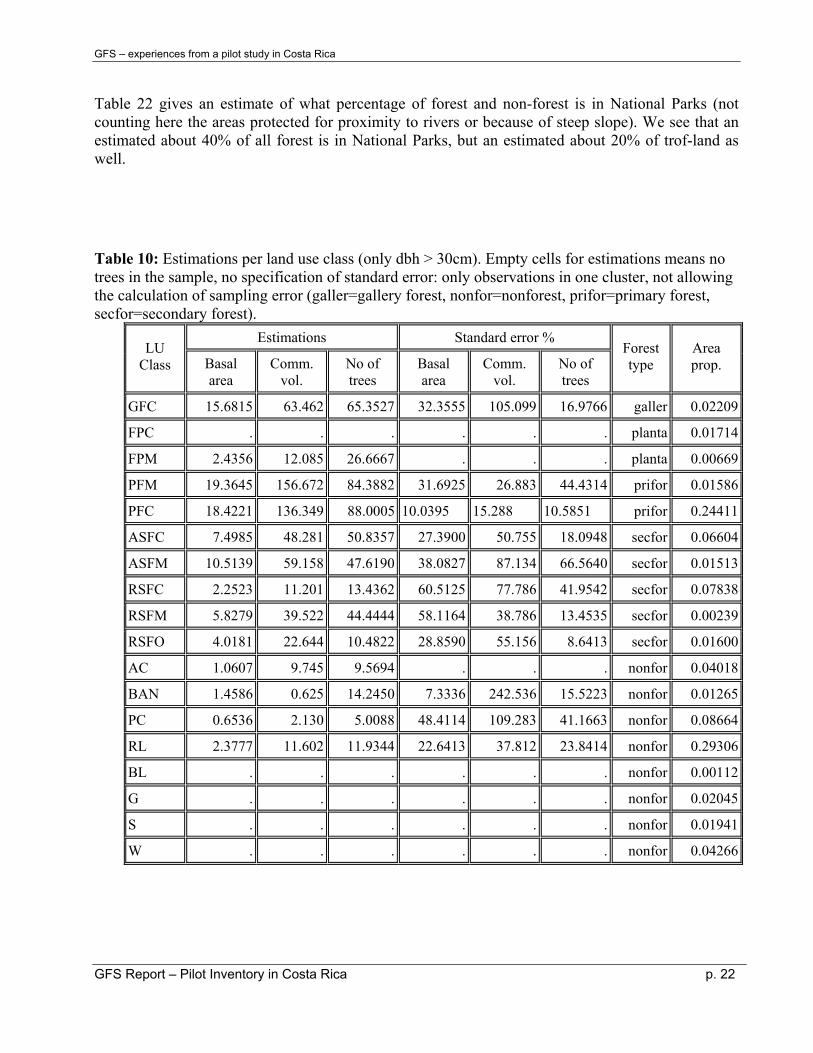
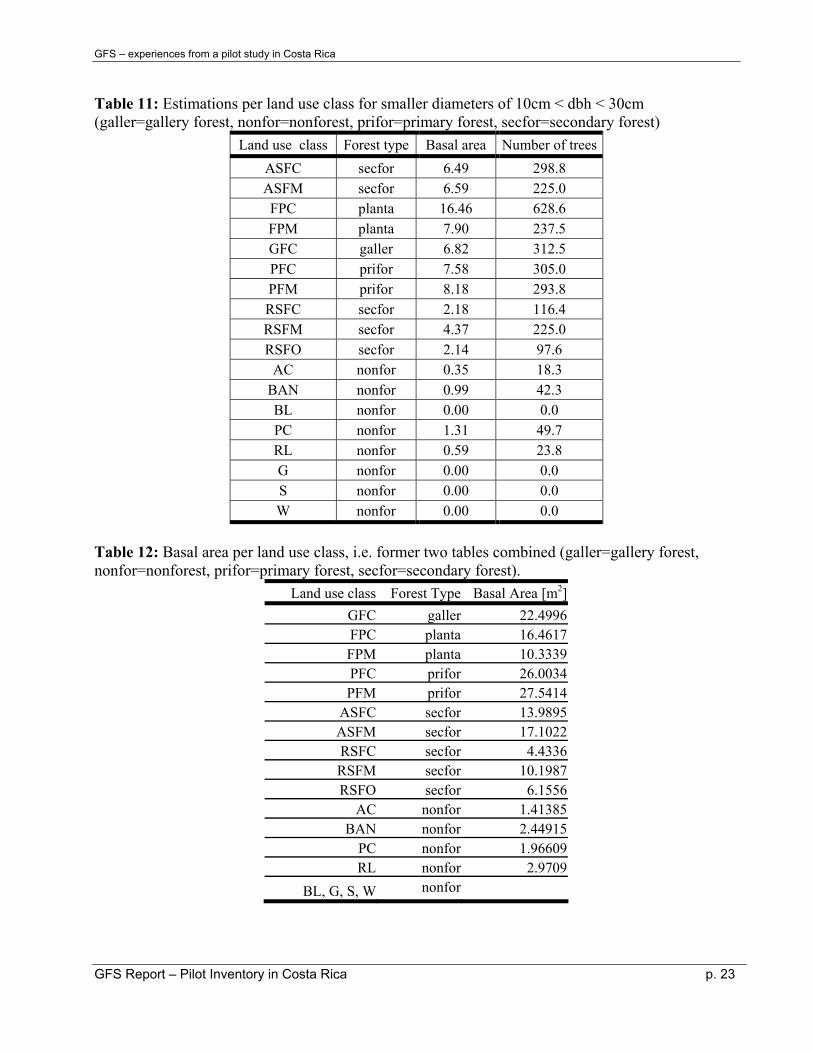
Table 10 to Table 12 give estimates per land use class. Table 10 presents estimates and relative standard errors for basal area, commercial volume, and number of trees, where also the corresponding area estimations are listed in the rightmost column. Table 11 gives basal area and number of trees for the class 10cm<dbh<30cm (frequently denominated “established regeneration”), and Table 12 gives the total basal area, combining the values of Table 10 and Table 11.
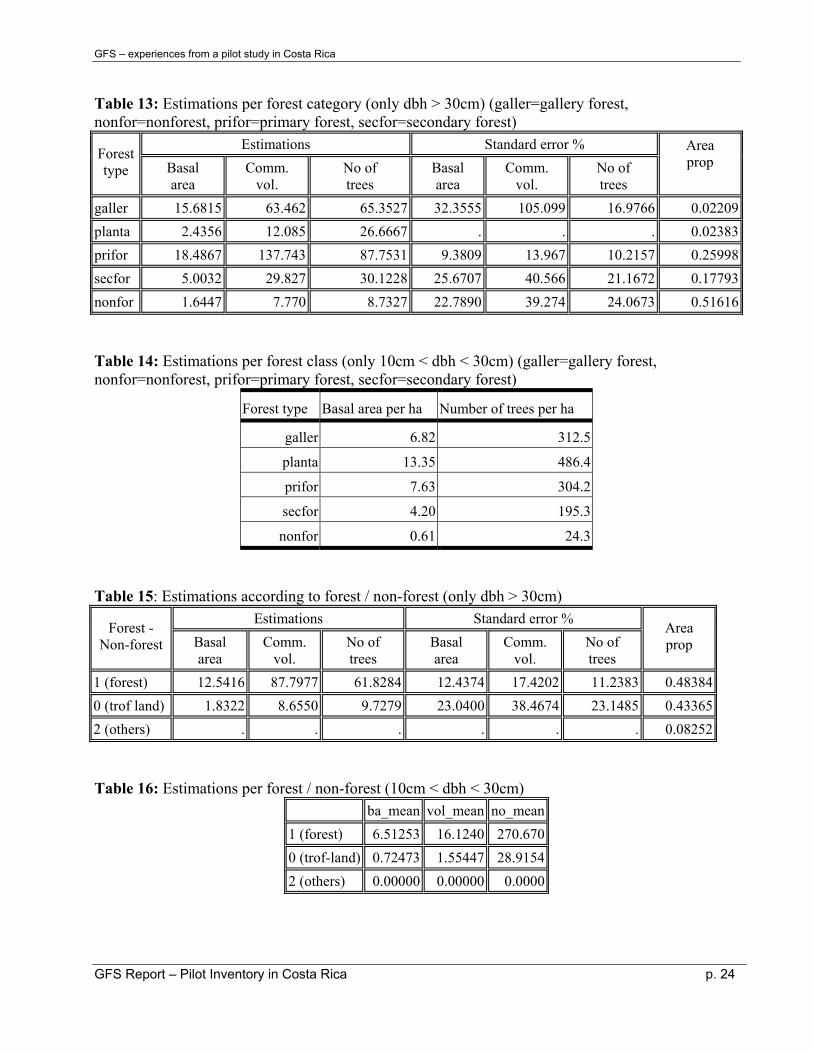
Table 13 and Table 14 give the corresponding estimations summarized according to forest type and Table 15 and Table 16 finally for forest/non-forest. When reading the “primary forest” data, one should take into consideration that several primary forest plots could not be accessed, particularly in the middle of National Parks. Therefore, this data is missing, and the statistics calculated for primary forest are somewhat biased towards “primary forests outside National Parks”, or better, “primary forests with reasonable accessibility”.
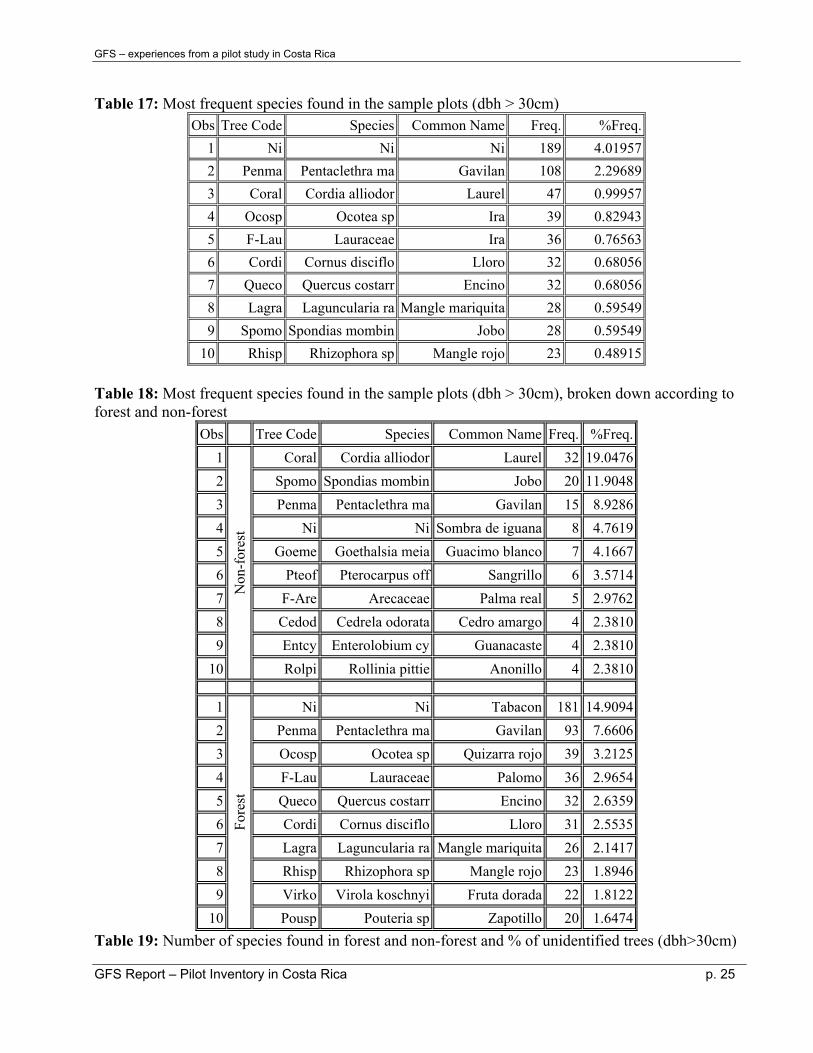
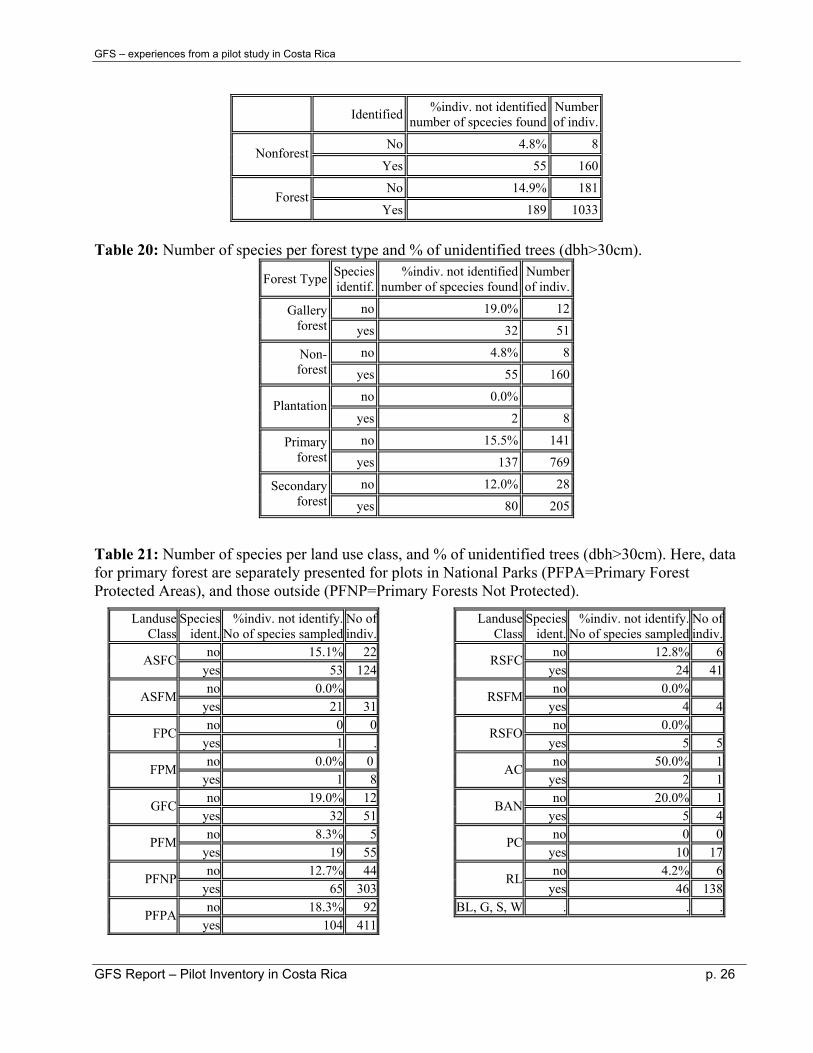
Table 17 to Table 21 give information about the species found. These are purely descriptive listings and give simply the number of species as found in the plots. Interesting (and clearly expected) that the percentage of unidentified trees is much higher in forest than outside forest. This can easily be explained, as outside forest frequently the commercial species are left as remnant trees, and the commercial species are usually better known than the non-commercial.
In Table 21 the data for closed primary forest (PFC) are separately presented for those plots that were in National Parks (PFPA=Primary Forest Protected Areas), and those outside the Parks (PFNP=Primary Forests Not Protected). Interesting to note – and actually expected – that in the National Parks the number of species is higher, and the percentage unidentified trees, as well. However, it must be taken into account that in PFNP there were about 350 trees measured, and in PFPA there were about 500, which may explain ion part the differences found.
GFS Report – Pilot Inventory in Costa Rica p. 20
GFS – experiences from a pilot study in Costa Rica
Table 9: Some Characteristics of the clusters sampled Cluster
ID Forest Area
TROF Area
Wateretc.Area
Total area % Forest %Trof %Others
3 1.2000 0.000 0.0000 1.20 1.00000 0.00000 0.00000
5 0.9650 0.235 0.0000 1.20 0.80417 0.19583 0.00000
17 0.9160 0.284 0.0000 1.20 0.76333 0.00000 0.23667
19 0.7480 0.452 0.0000 1.20 0.62333 0.37667 0.00000
21 0.4630 0.737 0.0000 1.20 0.38583 0.61417 0.00000
23 1.1500 0.050 0.0000 1.20 0.95833 0.04167 0.00000
36 0.3250 0.875 0.0000 1.20 0.27083 0.72917 0.00000
38 0.1510 1.049 0.0000 1.20 0.12583 0.87417 0.00000
40 0.0825 0.037 0.0000 0.12 0.68750 0.00000 0.31250
41 0.3610 0.839 0.0000 1.20 0.30083 0.00000 0.69917
69 0.6700 0.190 0.3400 1.20 0.55833 0.15833 0.28333
72 0.3330 0.867 0.0000 1.20 0.27750 0.72250 0.00000
74 0.5150 0.685 0.0000 1.20 0.42917 0.57083 0.00000
76 0.6000 0.000 0.0000 0.60 1.00000 0.00000 0.00000
78 0.9000 0.000 0.0000 0.90 1.00000 0.00000 0.00000
80 0.3000 0.000 0.0000 0.30 1.00000 0.00000 0.00000
82 0.2400 0.960 0.0000 1.20 0.20000 0.80000 0.00000
118 0.5700 0.570 0.0600 1.20 0.47500 0.47500 0.05000
120 1.2000 0.000 0.0000 1.20 1.00000 0.00000 0.00000
122 1.1240 0.076 0.0000 1.20 0.93667 0.06333 0.00000
124 0.7860 0.414 0.0000 1.20 0.65500 0.34500 0.00000
126 0.1330 0.767 0.0000 0.90 0.14778 0.85222 0.00000
128 0.9310 0.269 0.0000 1.20 0.77583 0.22417 0.00000
130 0.0000 1.200 0.0000 1.20 0.00000 1.00000 0.00000
132 0.3510 0.781 0.0680 1.20 0.29250 0.65083 0.05667
154 0.3000 0.900 0.0000 1.20 0.25000 0.75000 0.00000
162 0.7680 0.432 0.0000 1.20 0.64000 0.36000 0.00000
166 1.2000 0.000 0.0000 1.20 1.00000 0.00000 0.00000
184 0.9000 0.300 0.0000 1.20 0.75000 0.00000 0.25000
186 0.0000 0.000 1.2000 1.20 0.00000 0.00000 1.00000
188 0.2820 0.918 0.0000 1.20 0.23500 0.76500 0.00000
190 0.3000 0.900 0.0000 1.20 0.25000 0.75000 0.00000
192 1.2000 0.000 0.0000 1.20 1.00000 0.00000 0.00000
194 0.0000 1.200 0.0000 1.20 0.00000 1.00000 0.00000
196 0.3000 0.900 0.0000 1.20 0.25000 0.75000 0.00000
219 0.6300 0.570 0.0000 1.20 0.52500 0.00000 0.47500
221 0.0000 1.200 0.0000 1.20 0.00000 1.00000 0.00000
223 0.3000 0.900 0.0000 1.20 0.25000 0.75000 0.00000
225 0.4360 0.764 0.0000 1.20 0.36333 0.63667 0.00000
227 0.0550 1.145 0.0000 1.20 0.04583 0.95417 0.00000
GFS Report – Pilot Inventory in Costa Rica p. 21
GFS – experiences from a pilot study in Costa Rica
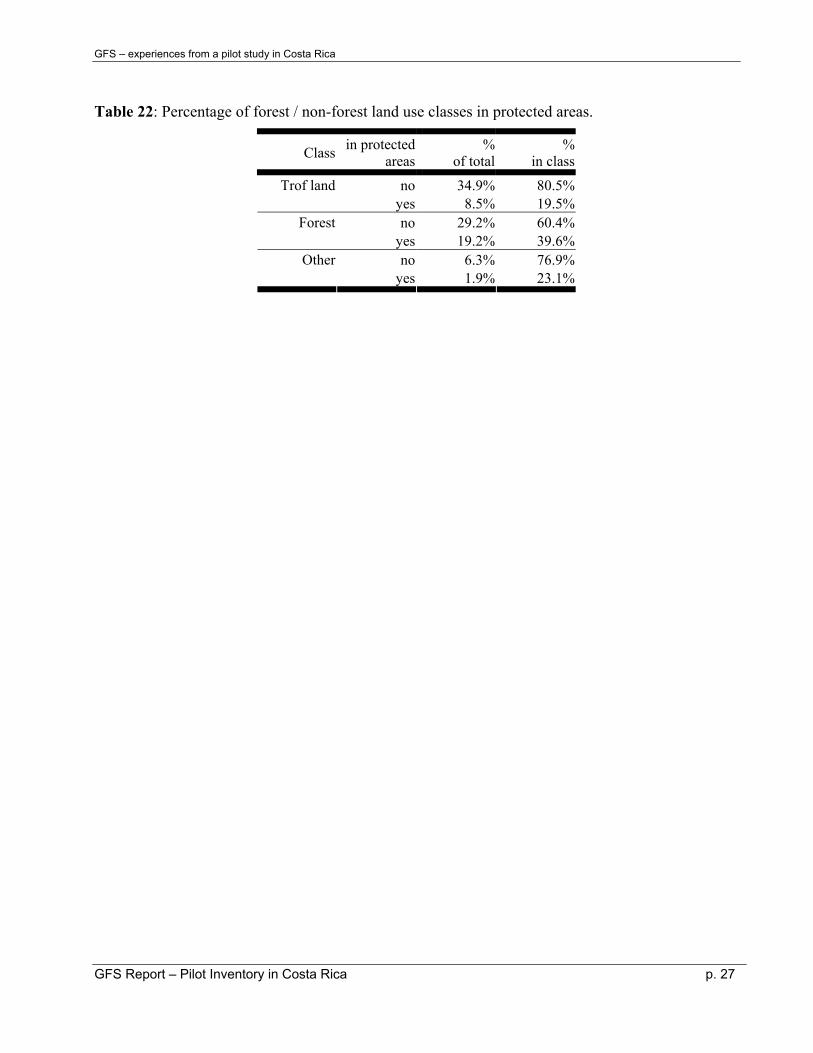
Table 22 gives an estimate of what percentage of forest and non-forest is in National Parks (not counting here the areas protected for proximity to rivers or because of steep slope). We see that an estimated about 40% of all forest is in National Parks, but an estimated about 20% of trof-land as well.
Table 10: Estimations per land use class (only dbh > 30cm). Empty cells for estimations means no trees in the sample, no specification of standard error: only observations in one cluster, not allowing the calculation of sampling error (galler=gallery forest, nonfor=nonforest, prifor=primary forest, secfor=secondary forest).
Estimations Standard error % LU
Class Basal area
Comm. vol.
No of trees
Basal area
Comm. vol.
No of trees
Foresttype
Area prop.
GFC 15.6815 63.462 65.3527 32.3555 105.099 16.9766 galler 0.02209
FPC . . . . . . planta 0.01714
FPM 2.4356 12.085 26.6667 . . . planta 0.00669
PFM 19.3645 156.672 84.3882 31.6925 26.883 44.4314 prifor 0.01586
PFC 18.4221 136.349 88.0005 10.0395 15.288 10.5851 prifor 0.24411
ASFC 7.4985 48.281 50.8357 27.3900 50.755 18.0948 secfor 0.06604
ASFM 10.5139 59.158 47.6190 38.0827 87.134 66.5640 secfor 0.01513
RSFC 2.2523 11.201 13.4362 60.5125 77.786 41.9542 secfor 0.07838
RSFM 5.8279 39.522 44.4444 58.1164 38.786 13.4535 secfor 0.00239
RSFO 4.0181 22.644 10.4822 28.8590 55.156 8.6413 secfor 0.01600
AC 1.0607 9.745 9.5694 . . . nonfor 0.04018
BAN 1.4586 0.625 14.2450 7.3336 242.536 15.5223 nonfor 0.01265
PC 0.6536 2.130 5.0088 48.4114 109.283 41.1663 nonfor 0.08664
RL 2.3777 11.602 11.9344 22.6413 37.812 23.8414 nonfor 0.29306
BL . . . . . . nonfor 0.00112
G . . . . . . nonfor 0.02045
S . . . . . . nonfor 0.01941
W . . . . . . nonfor 0.04266
GFS Report – Pilot Inventory in Costa Rica p. 22
GFS – experiences from a pilot study in Costa Rica
Table 11: Estimations per land use class for smaller diameters of 10cm < dbh < 30cm (galler=gallery forest, nonfor=nonforest, prifor=primary forest, secfor=secondary forest)
Land use class Forest type Basal area Number of trees ASFC secfor 6.49 298.8 ASFM secfor 6.59 225.0 FPC planta 16.46 628.6 FPM planta 7.90 237.5 GFC galler 6.82 312.5 PFC prifor 7.58 305.0 PFM prifor 8.18 293.8 RSFC secfor 2.18 116.4 RSFM secfor 4.37 225.0 RSFO secfor 2.14 97.6
AC nonfor 0.35 18.3 BAN nonfor 0.99 42.3 BL nonfor 0.00 0.0 PC nonfor 1.31 49.7 RL nonfor 0.59 23.8 G nonfor 0.00 0.0 S nonfor 0.00 0.0 W nonfor 0.00 0.0
Table 12: Basal area per land use class, i.e. former two tables combined (galler=gallery forest, nonfor=nonforest, prifor=primary forest, secfor=secondary forest).
Land use class Forest Type Basal Area [m2]GFC galler 22.4996FPC planta 16.4617FPM planta 10.3339PFC prifor 26.0034PFM prifor 27.5414
ASFC secfor 13.9895ASFM secfor 17.1022RSFC secfor 4.4336RSFM secfor 10.1987RSFO secfor 6.1556
AC nonfor 1.41385BAN nonfor 2.44915
PC nonfor 1.96609RL nonfor 2.9709
BL, G, S, W nonfor
GFS Report – Pilot Inventory in Costa Rica p. 23
GFS – experiences from a pilot study in Costa Rica
Table 13: Estimations per forest category (only dbh > 30cm) (galler=gallery forest, nonfor=nonforest, prifor=primary forest, secfor=secondary forest)
Estimations Standard error % Forest type Basal
area Comm.
vol. No of trees
Basal area
Comm. vol.
No of trees
Area prop
galler 15.6815 63.462 65.3527 32.3555 105.099 16.9766 0.02209planta 2.4356 12.085 26.6667 . . . 0.02383prifor 18.4867 137.743 87.7531 9.3809 13.967 10.2157 0.25998secfor 5.0032 29.827 30.1228 25.6707 40.566 21.1672 0.17793nonfor 1.6447 7.770 8.7327 22.7890 39.274 24.0673 0.51616 Table 14: Estimations per forest class (only 10cm < dbh < 30cm) (galler=gallery forest, nonfor=nonforest, prifor=primary forest, secfor=secondary forest)
Forest type Basal area per ha Number of trees per ha
galler 6.82 312.5
planta 13.35 486.4
prifor 7.63 304.2
secfor 4.20 195.3
nonfor 0.61 24.3 Table 15: Estimations according to forest / non-forest (only dbh > 30cm)
Estimations Standard error % Forest - Non-forest Basal
area Comm.
vol. No of trees
Basal area
Comm. vol.
No of trees
Area prop
1 (forest) 12.5416 87.7977 61.8284 12.4374 17.4202 11.2383 0.483840 (trof land) 1.8322 8.6550 9.7279 23.0400 38.4674 23.1485 0.433652 (others) . . . . . . 0.08252 Table 16: Estimations per forest / non-forest (10cm < dbh < 30cm)
ba_mean vol_mean no_mean1 (forest) 6.51253 16.1240 270.6700 (trof-land) 0.72473 1.55447 28.91542 (others) 0.00000 0.00000 0.0000
GFS Report – Pilot Inventory in Costa Rica p. 24
GFS – experiences from a pilot study in Costa Rica
Table 17: Most frequent species found in the sample plots (dbh > 30cm)
Obs Tree Code Species Common Name Freq. %Freq. 1 Ni Ni Ni 189 4.01957 2 Penma Pentaclethra ma Gavilan 108 2.29689 3 Coral Cordia alliodor Laurel 47 0.99957 4 Ocosp Ocotea sp Ira 39 0.82943 5 F-Lau Lauraceae Ira 36 0.76563 6 Cordi Cornus disciflo Lloro 32 0.68056 7 Queco Quercus costarr Encino 32 0.68056 8 Lagra Laguncularia ra Mangle mariquita 28 0.59549 9 Spomo Spondias mombin Jobo 28 0.59549
10 Rhisp Rhizophora sp Mangle rojo 23 0.48915 Table 18: Most frequent species found in the sample plots (dbh > 30cm), broken down according to forest and non-forest
Obs Tree Code Species Common Name Freq. %Freq. 1 Coral Cordia alliodor Laurel 32 19.0476 2 Spomo Spondias mombin Jobo 20 11.9048 3 Penma Pentaclethra ma Gavilan 15 8.9286 4 Ni Ni Sombra de iguana 8 4.7619 5 Goeme Goethalsia meia Guacimo blanco 7 4.1667 6 Pteof Pterocarpus off Sangrillo 6 3.5714 7 F-Are Arecaceae Palma real 5 2.9762 8 Cedod Cedrela odorata Cedro amargo 4 2.3810 9 Entcy Enterolobium cy Guanacaste 4 2.3810
10
Non
-for
est
Rolpi Rollinia pittie Anonillo 4 2.3810
1 Ni Ni Tabacon 181 14.9094 2 Penma Pentaclethra ma Gavilan 93 7.6606 3 Ocosp Ocotea sp Quizarra rojo 39 3.2125 4 F-Lau Lauraceae Palomo 36 2.9654 5 Queco Quercus costarr Encino 32 2.6359 6 Cordi Cornus disciflo Lloro 31 2.5535 7 Lagra Laguncularia ra Mangle mariquita 26 2.1417 8 Rhisp Rhizophora sp Mangle rojo 23 1.8946 9 Virko Virola koschnyi Fruta dorada 22 1.8122
10
Fore
st
Pousp Pouteria sp Zapotillo 20 1.6474 Table 19: Number of species found in forest and non-forest and % of unidentified trees (dbh>30cm)
GFS Report – Pilot Inventory in Costa Rica p. 25
GFS – experiences from a pilot study in Costa Rica
Identified %indiv. not identifiednumber of spcecies found
Number of indiv.
No 4.8% 8 Nonforest
Yes 55 160
No 14.9% 181 Forest
Yes 189 1033
Table 20: Number of species per forest type and % of unidentified trees (dbh>30cm).
Forest Type Speciesidentif.
%indiv. not identifiednumber of spcecies found
Number of indiv.
no 19.0% 12Gallery forest yes 32 51
no 4.8% 8Non-forest yes 55 160
no 0.0% Plantation
yes 2 8
no 15.5% 141Primary forest yes 137 769
no 12.0% 28Secondary forest yes 80 205
Table 21: Number of species per land use class, and % of unidentified trees (dbh>30cm). Here, data for primary forest are separately presented for plots in National Parks (PFPA=Primary Forest Protected Areas), and those outside (PFNP=Primary Forests Not Protected).
Landuse Class
Species ident.
%indiv. not identify.No of species sampled
No of indiv.
no 15.1% 22ASFC yes 53 124no 0.0% ASFM
yes 21 31no 0 0FPC
yes 1 .no 0.0% 0 FPM
yes 1 8no 19.0% 12GFC
yes 32 51no 8.3% 5PFM
yes 19 55no 12.7% 44PFNP
yes 65 303no 18.3% 92PFPA
yes 104 411
LanduseClass
Speciesident.
%indiv. not identify.No of species sampled
No of indiv.
no 12.8% 6RSFCyes 24 41no 0.0% RSFM
yes 4 4no 0.0% RSFO
yes 5 5no 50.0% 1AC
yes 2 1no 20.0% 1BAN
yes 5 4no 0 0PC
yes 10 17no 4.2% 6RL
yes 46 138BL, G, S, W . . .
GFS Report – Pilot Inventory in Costa Rica p. 26
GFS – experiences from a pilot study in Costa Rica
Table 22: Percentage of forest / non-forest land use classes in protected areas.
Class in protected areas
%of total
% in class
no 34.9% 80.5% Trof landyes 8.5% 19.5% no 29.2% 60.4% Forest
yes 19.2% 39.6% no 6.3% 76.9% Other
yes 1.9% 23.1%
GFS Report – Pilot Inventory in Costa Rica p. 27
GFS – experiences from a pilot study in Costa Rica
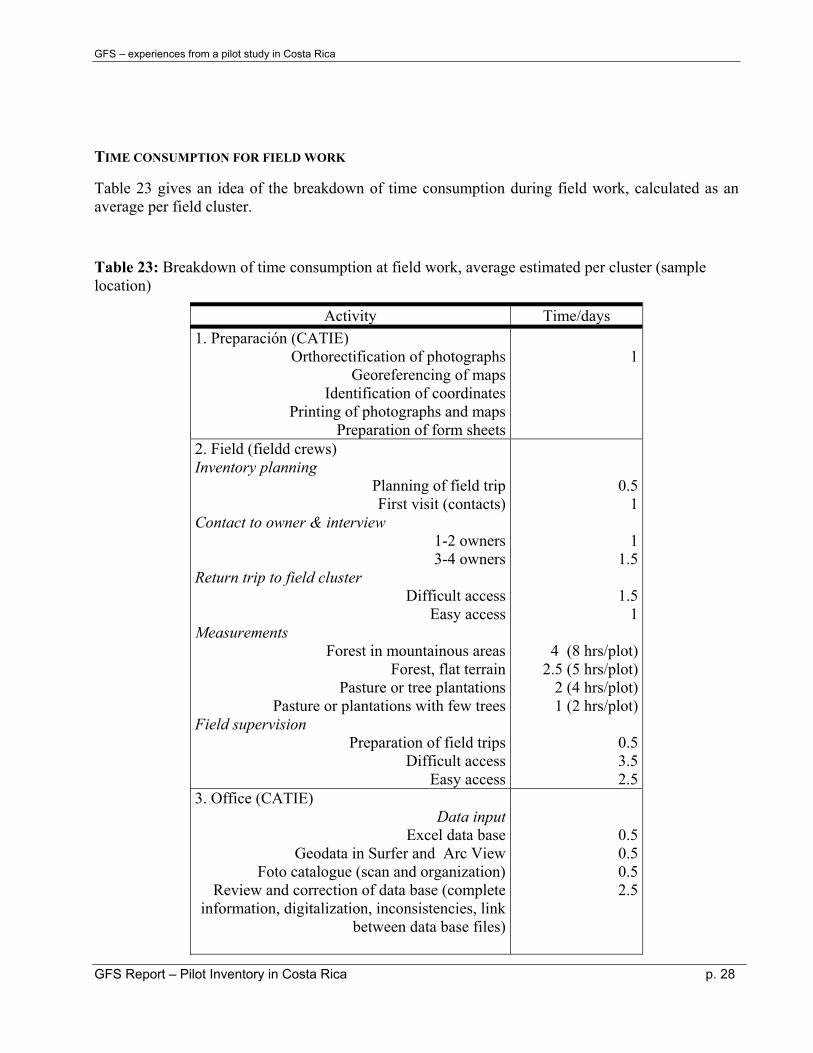
TIME CONSUMPTION FOR FIELD WORK
Table 23
Table 23: Breakdown of time consumption at field work, average estimated per cluster (sample location)
gives an idea of the breakdown of time consumption during field work, calculated as an average per field cluster.
Activity Time/days 1. Preparación (CATIE)
Orthorectification of photographs Georeferencing of maps
Identification of coordinatesPrinting of photographs and maps
Preparation of form sheets
1
2. Field (fieldd crews) Inventory planning
Planning of field trip First visit (contacts)
Contact to owner & interview 1-2 owners3-4 owners
Return trip to field cluster Difficult access
Easy accessMeasurements
Forest in mountainous areasForest, flat terrain
Pasture or tree plantationsPasture or plantations with few trees
Field supervision Preparation of field trips
Difficult accessEasy access
0.5 1
1 1.5
1.5
1
4 (8 hrs/plot) 2.5 (5 hrs/plot)
2 (4 hrs/plot) 1 (2 hrs/plot)
0.5 3.5 2.5
3. Office (CATIE) Data input
Excel data baseGeodata in Surfer and Arc View
Foto catalogue (scan and organization)Review and correction of data base (complete
information, digitalization, inconsistencies, link between data base files)
0.5 0.5 0.5 2.5
GFS Report – Pilot Inventory in Costa Rica p. 28
GFS – experiences from a pilot study in Costa Rica
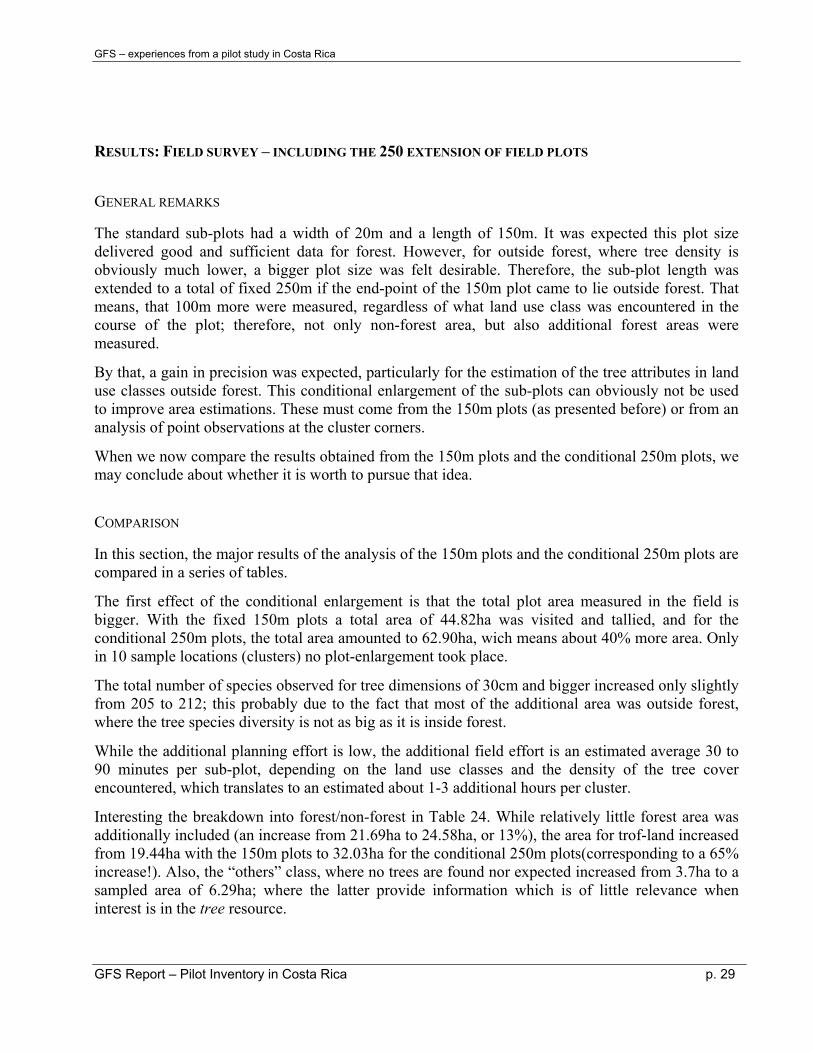
RESULTS: FIELD SURVEY – INCLUDING THE 250 EXTENSION OF FIELD PLOTS
GENERAL REMARKS
The standard sub-plots had a width of 20m and a length of 150m. It was expected this plot size delivered good and sufficient data for forest. However, for outside forest, where tree density is obviously much lower, a bigger plot size was felt desirable. Therefore, the sub-plot length was extended to a total of fixed 250m if the end-point of the 150m plot came to lie outside forest. That means, that 100m more were measured, regardless of what land use class was encountered in the course of the plot; therefore, not only non-forest area, but also additional forest areas were measured.
By that, a gain in precision was expected, particularly for the estimation of the tree attributes in land use classes outside forest. This conditional enlargement of the sub-plots can obviously not be used to improve area estimations. These must come from the 150m plots (as presented before) or from an analysis of point observations at the cluster corners.
When we now compare the results obtained from the 150m plots and the conditional 250m plots, we may conclude about whether it is worth to pursue that idea.
COMPARISON
In this section, the major results of the analysis of the 150m plots and the conditional 250m plots are compared in a series of tables.
The first effect of the conditional enlargement is that the total plot area measured in the field is bigger. With the fixed 150m plots a total area of 44.82ha was visited and tallied, and for the conditional 250m plots, the total area amounted to 62.90ha, wich means about 40% more area. Only in 10 sample locations (clusters) no plot-enlargement took place.
The total number of species observed for tree dimensions of 30cm and bigger increased only slightly from 205 to 212; this probably due to the fact that most of the additional area was outside forest, where the tree species diversity is not as big as it is inside forest.
While the additional planning effort is low, the additional field effort is an estimated average 30 to 90 minutes per sub-plot, depending on the land use classes and the density of the tree cover encountered, which translates to an estimated about 1-3 additional hours per cluster.
Interesting the breakdown into forest/non-forest in Table 24. While relatively little forest area was additionally included (an increase from 21.69ha to 24.58ha, or 13%), the area for trof-land increased from 19.44ha with the 150m plots to 32.03ha for the conditional 250m plots(corresponding to a 65% increase!). Also, the “others” class, where no trees are found nor expected increased from 3.7ha to a sampled area of 6.29ha; where the latter provide information which is of little relevance when interest is in the tree resource.
GFS Report – Pilot Inventory in Costa Rica p. 29
GFS – experiences from a pilot study in Costa Rica
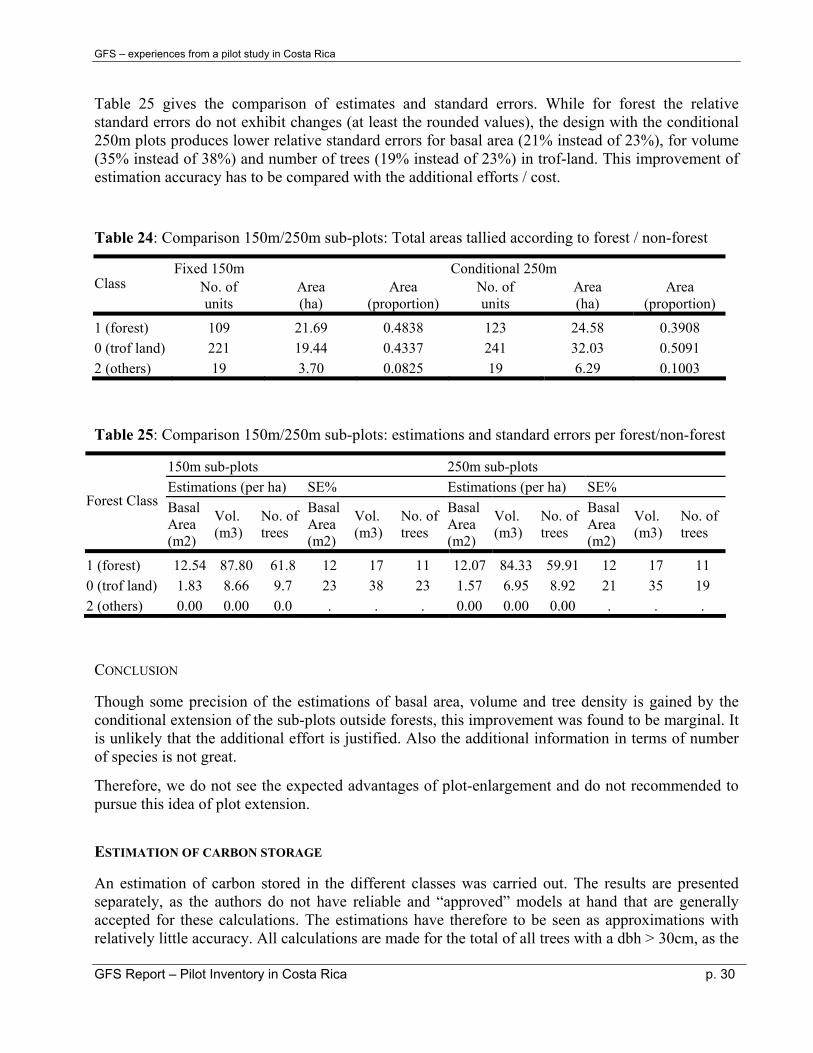
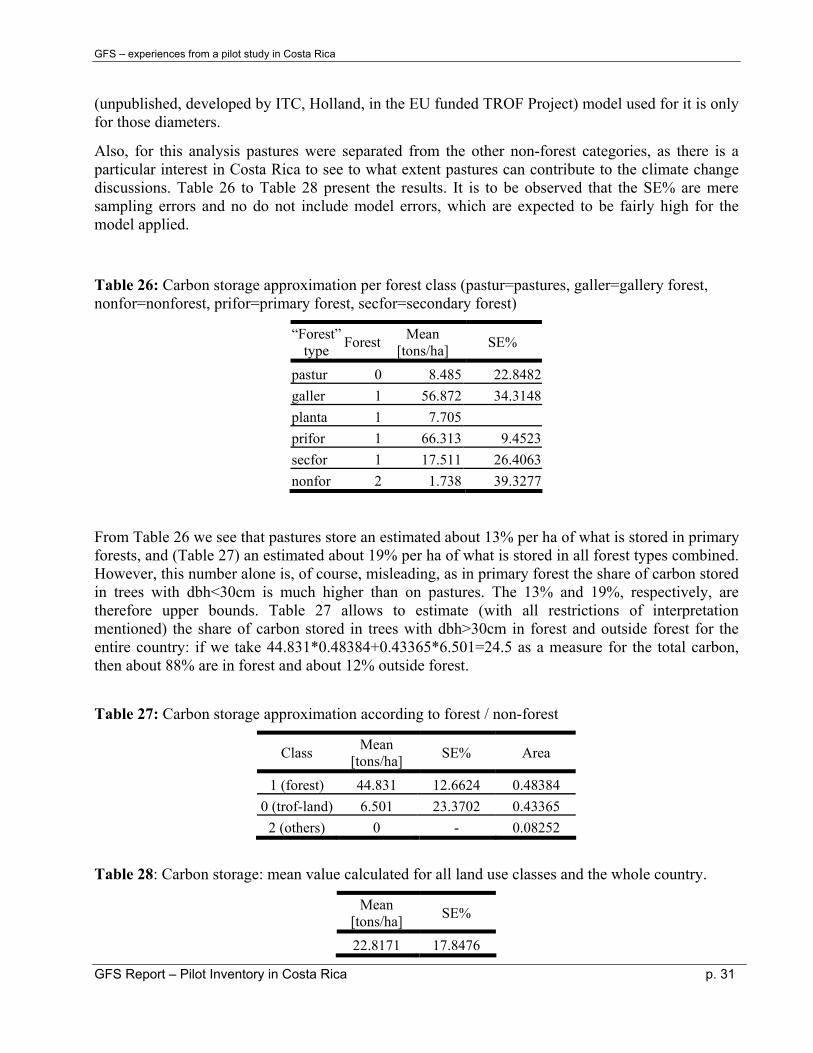
Table 25
Table 25: Comparison 150m/250m sub-plots: estimations and standard errors per forest/non-forest
gives the comparison of estimates and standard errors. While for forest the relative standard errors do not exhibit changes (at least the rounded values), the design with the conditional 250m plots produces lower relative standard errors for basal area (21% instead of 23%), for volume (35% instead of 38%) and number of trees (19% instead of 23%) in trof-land. This improvement of estimation accuracy has to be compared with the additional efforts / cost.
Table 24: Comparison 150m/250m sub-plots: Total areas tallied according to forest / non-forest
Fixed 150m Conditional 250m Class No. of
units Area (ha)
Area (proportion)
No. of units
Area (ha)
Area (proportion)
1 (forest) 109 21.69 0.4838 123 24.58 0.3908 0 (trof land) 221 19.44 0.4337 241 32.03 0.5091 2 (others) 19 3.70 0.0825 19 6.29 0.1003
150m sub-plots 250m sub-plots Estimations (per ha) SE% Estimations (per ha) SE%
Forest Class Basal Area (m2)
Vol. (m3)
No. of trees
Basal Area (m2)
Vol. (m3)
No. of trees
Basal Area (m2)
Vol. (m3)
No. of trees
Basal Area (m2)
Vol. (m3)
No. of trees
1 (forest) 12.54 87.80 61.8 12 17 11 12.07 84.33 59.91 12 17 11 0 (trof land) 1.83 8.66 9.7 23 38 23 1.57 6.95 8.92 21 35 19 2 (others) 0.00 0.00 0.0 . . . 0.00 0.00 0.00 . . .
CONCLUSION
Though some precision of the estimations of basal area, volume and tree density is gained by the conditional extension of the sub-plots outside forests, this improvement was found to be marginal. It is unlikely that the additional effort is justified. Also the additional information in terms of number of species is not great.
Therefore, we do not see the expected advantages of plot-enlargement and do not recommended to pursue this idea of plot extension.
ESTIMATION OF CARBON STORAGE
An estimation of carbon stored in the different classes was carried out. The results are presented separately, as the authors do not have reliable and “approved” models at hand that are generally accepted for these calculations. The estimations have therefore to be seen as approximations with relatively little accuracy. All calculations are made for the total of all trees with a dbh > 30cm, as the
GFS Report – Pilot Inventory in Costa Rica p. 30
GFS – experiences from a pilot study in Costa Rica
(unpublished, developed by ITC, Holland, in the EU funded TROF Project) model used for it is only for those diameters.
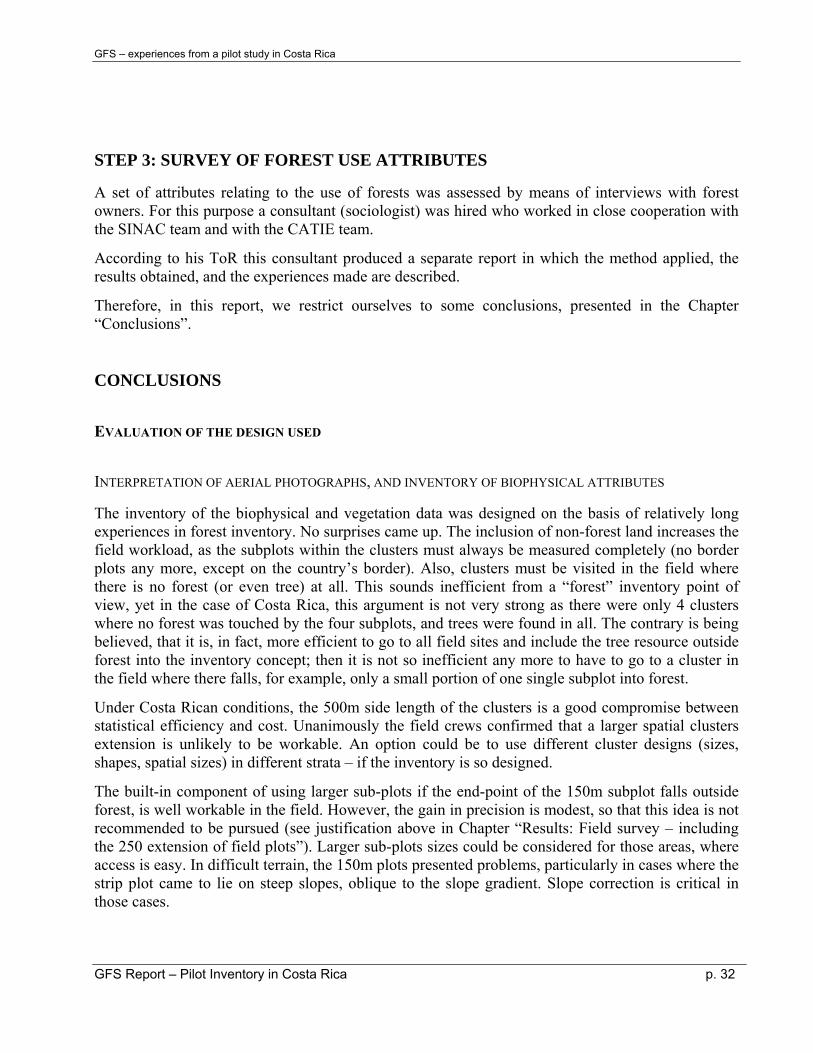
Also, for this analysis pastures were separated from the other non-forest categories, as there is a particular interest in Costa Rica to see to what extent pastures can contribute to the climate change discussions. Table 26 to Table 28 present the results. It is to be observed that the SE% are mere sampling errors and no do not include model errors, which are expected to be fairly high for the model applied.
Table 26: Carbon storage approximation per forest class (pastur=pastures, galler=gallery forest, nonfor=nonforest, prifor=primary forest, secfor=secondary forest)
“Forest” type Forest Mean
[tons/ha] SE%
pastur 0 8.485 22.8482galler 1 56.872 34.3148planta 1 7.705 prifor 1 66.313 9.4523secfor 1 17.511 26.4063nonfor 2 1.738 39.3277
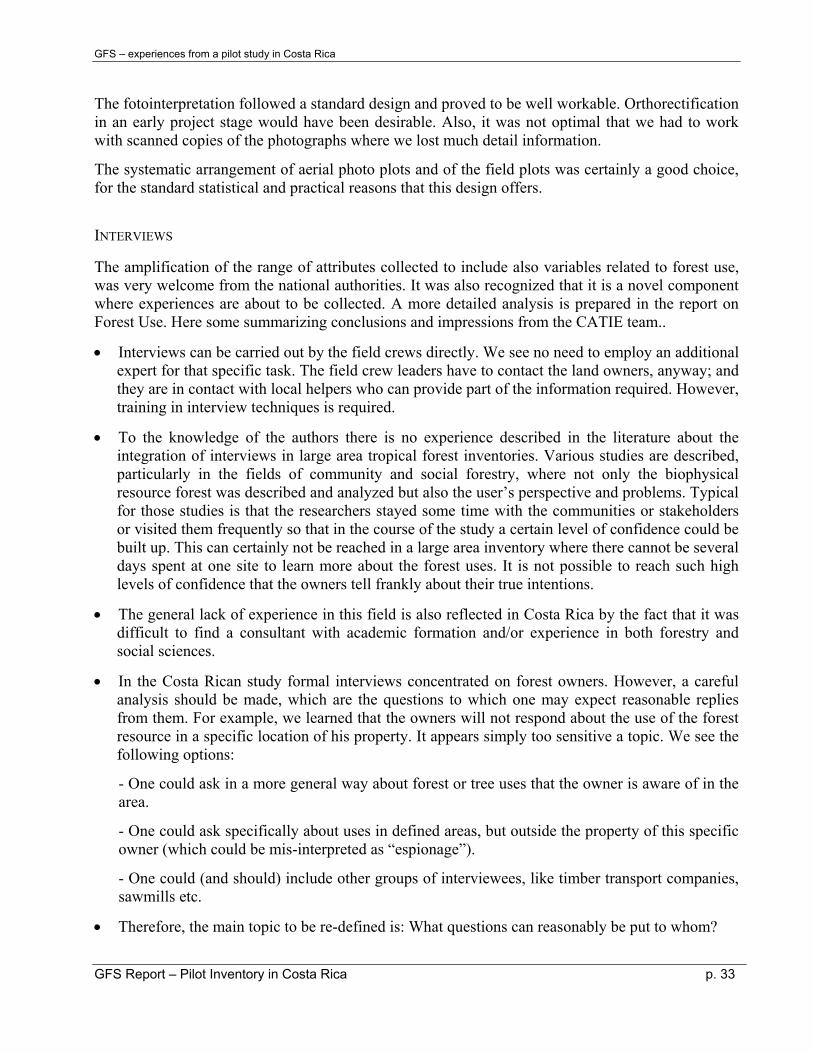
From Table 26 we see that pastures store an estimated about 13% per ha of what is stored in primary forests, and (Table 27) an estimated about 19% per ha of what is stored in all forest types combined. However, this number alone is, of course, misleading, as in primary forest the share of carbon stored in trees with dbh<30cm is much higher than on pastures. The 13% and 19%, respectively, are therefore upper bounds. Table 27 allows to estimate (with all restrictions of interpretation mentioned) the share of carbon stored in trees with dbh>30cm in forest and outside forest for the entire country: if we take 44.831*0.48384+0.43365*6.501=24.5 as a measure for the total carbon, then about 88% are in forest and about 12% outside forest.
Table 27: Carbon storage approximation according to forest / non-forest
Class Mean [tons/ha] SE% Area
1 (forest) 44.831 12.6624 0.48384 0 (trof-land) 6.501 23.3702 0.43365
2 (others) 0 - 0.08252
Table 28: Carbon storage: mean value calculated for all land use classes and the whole country.
Mean [tons/ha] SE%
22.8171 17.8476
GFS Report – Pilot Inventory in Costa Rica p. 31
GFS – experiences from a pilot study in Costa Rica
STEP 3: SURVEY OF FOREST USE ATTRIBUTES
A set of attributes relating to the use of forests was assessed by means of interviews with forest owners. For this purpose a consultant (sociologist) was hired who worked in close cooperation with the SINAC team and with the CATIE team.
According to his ToR this consultant produced a separate report in which the method applied, the results obtained, and the experiences made are described.
Therefore, in this report, we restrict ourselves to some conclusions, presented in the Chapter “Conclusions”.
CONCLUSIONS
EVALUATION OF THE DESIGN USED
INTERPRETATION OF AERIAL PHOTOGRAPHS, AND INVENTORY OF BIOPHYSICAL ATTRIBUTES
The inventory of the biophysical and vegetation data was designed on the basis of relatively long experiences in forest inventory. No surprises came up. The inclusion of non-forest land increases the field workload, as the subplots within the clusters must always be measured completely (no border plots any more, except on the country’s border). Also, clusters must be visited in the field where there is no forest (or even tree) at all. This sounds inefficient from a “forest” inventory point of view, yet in the case of Costa Rica, this argument is not very strong as there were only 4 clusters where no forest was touched by the four subplots, and trees were found in all. The contrary is being believed, that it is, in fact, more efficient to go to all field sites and include the tree resource outside forest into the inventory concept; then it is not so inefficient any more to have to go to a cluster in the field where there falls, for example, only a small portion of one single subplot into forest.
Under Costa Rican conditions, the 500m side length of the clusters is a good compromise between statistical efficiency and cost. Unanimously the field crews confirmed that a larger spatial clusters extension is unlikely to be workable. An option could be to use different cluster designs (sizes, shapes, spatial sizes) in different strata – if the inventory is so designed.
The built-in component of using larger sub-plots if the end-point of the 150m subplot falls outside forest, is well workable in the field. However, the gain in precision is modest, so that this idea is not recommended to be pursued (see justification above in Chapter “Results: Field survey – including the 250 extension of field plots”). Larger sub-plots sizes could be considered for those areas, where access is easy. In difficult terrain, the 150m plots presented problems, particularly in cases where the strip plot came to lie on steep slopes, oblique to the slope gradient. Slope correction is critical in those cases.
GFS Report – Pilot Inventory in Costa Rica p. 32
GFS – experiences from a pilot study in Costa Rica
The fotointerpretation followed a standard design and proved to be well workable. Orthorectification in an early project stage would have been desirable. Also, it was not optimal that we had to work with scanned copies of the photographs where we lost much detail information.
The systematic arrangement of aerial photo plots and of the field plots was certainly a good choice, for the standard statistical and practical reasons that this design offers.
INTERVIEWS
The amplification of the range of attributes collected to include also variables related to forest use, was very welcome from the national authorities. It was also recognized that it is a novel component where experiences are about to be collected. A more detailed analysis is prepared in the report on Forest Use. Here some summarizing conclusions and impressions from the CATIE team..
• Interviews can be carried out by the field crews directly. We see no need to employ an additional expert for that specific task. The field crew leaders have to contact the land owners, anyway; and they are in contact with local helpers who can provide part of the information required. However, training in interview techniques is required.
• To the knowledge of the authors there is no experience described in the literature about the integration of interviews in large area tropical forest inventories. Various studies are described, particularly in the fields of community and social forestry, where not only the biophysical resource forest was described and analyzed but also the user’s perspective and problems. Typical for those studies is that the researchers stayed some time with the communities or stakeholders or visited them frequently so that in the course of the study a certain level of confidence could be built up. This can certainly not be reached in a large area inventory where there cannot be several days spent at one site to learn more about the forest uses. It is not possible to reach such high levels of confidence that the owners tell frankly about their true intentions.
• The general lack of experience in this field is also reflected in Costa Rica by the fact that it was difficult to find a consultant with academic formation and/or experience in both forestry and social sciences.
• In the Costa Rican study formal interviews concentrated on forest owners. However, a careful analysis should be made, which are the questions to which one may expect reasonable replies from them. For example, we learned that the owners will not respond about the use of the forest resource in a specific location of his property. It appears simply too sensitive a topic. We see the following options:
- One could ask in a more general way about forest or tree uses that the owner is aware of in the area.
- One could ask specifically about uses in defined areas, but outside the property of this specific owner (which could be mis-interpreted as “espionage”).
- One could (and should) include other groups of interviewees, like timber transport companies, sawmills etc.
• Therefore, the main topic to be re-defined is: What questions can reasonably be put to whom?
GFS Report – Pilot Inventory in Costa Rica p. 33
GFS – experiences from a pilot study in Costa Rica
• While everybody (including the authors) feel that the additional set of variables assessed through interviews is useful, and that modern and future oriented forest inventories should consider also aspects of “forest use”, it is from this study not clear yet what the immediate use and usefulness of the information will be.
While presenting the results, major interest of forest experts was still in the more traditional variables like forest area, volume, species distribution. More convincing analysis and interpretation of the results of these additional (forest use) variables must be done; and an immediate usefulness for politicians and decision makers proven. Many data on socio-economic aspects and questions of forest use can probably be answered by the standard set of traditional variables, and by the inclusion of some more variables (on non-wood products, etc.).
It is expected that much information can also be obtained from local helpers. Then, the hiring of local helpers is a must. If local helpers are hired, it is difficult to judge their level and coverage of knowledge. The information “retrieval” from them would have to be structured carefully.
• Ideas of how to optimize the interviews are detailed in the report of Franklin Solano, the consultant in charge of this project component.
CONSIDERATION FOR RE-MEASUREMENTS IN COSTA RICA
There is the declared will of SINAC to continue providing high quality data as a requirement for formulation and monitoring of good national policies. A complete documentation is there, so that, technically, the re-location and re-measurement is not a problem. Major concerns are cost and organization:
• Documentation is as complete as possible, including maps, aerial photographs, description of field access, terrestrial photographs, so that the documentation bas is there required for re-visiting the reasonably accessible sample locations. Control measurements carried out in the pilot study do confirm this clearly.
However, there are some sample locations in very remote areas with difficult and long access ways where it is not possible to re-locate the plots established. There, dense crown cover and rough topography did impede reception of sufficient GPS signal.
• Major issue is cost, and organization. Despite recognizing the general relevance of improved forest information, it is doubtful that the Costa Rican government can afford to invest much money in a re-measurement campaign, nor so by using own staff to do the work.
• An idea developed by the CATIE group is to make the data gathered available for research institutions and NGOs working in the field of natural resources management and conservation, this raising interest in the activity and encourage them to complete the data base considering re-measurements, establishing new plots, etc.
Optimal would certainly be if a group of interested institutions would take care of plots in sub-regions, re-measuring, say, 5 plots every second year, and possibly densifying the grid of sample locations. A natural partner are universities, where re-measurements of these permanent sample plots could be integrated in the regular forestry curriculum.
GFS Report – Pilot Inventory in Costa Rica p. 34

GFS – experiences from a pilot study in Costa Rica
MAJOR LESSONS LEARNED FOR A TRANSFER TO OTHER REGIONS / COUNTRIES From this pilot study, some lessons were learned that might be relevant when attempting to implement similar studies in other regions. We first address general observations and do then list particularities of Costa Rica that are not necessarily encountered in other regions.
GENERAL OBSERVATIONS
Strategic:
• The successful and smooth development of the pilot study in Costa Rica has much to do with the unconditional support given by the national forest authorities (SINAC). It was no doubt from the outset that there is a clear political will to improve the forest information situation in the country. As mentioned before, this will was explicitly expressed (before the beginning of the pilot study) in the National Forest Development Plan.
If there is not an alike political support, an inventory undertaking is likely to remain a one-time exercise. If technical inventory work (including capacity building) is to be started in the absence of a clear positive political statement, much effort should be directed to develop the awareness of decision makers of the relevance of forest and natural resources information.
Helpful in this context may be to bring the inventory in a proper context with the data provision required by various international conventions and processes.
• A key to success is the identification of key persons or key groups in the national government (or other responsible national institutions) who actively support the idea and the activities.
• Partnership building among national institutions should be started early, taking into account that there is frequently a competitive atmosphere between them, particularly when an inventory activity receives outside finding.
• It should be made clear that the project is in national ownership, and carried out for the good of the forestry and natural resources sector of the country – and that it is not meant to be an externally imposed activity. Simultaneously with the implementation of planning and field activities, one should keep in mind how to give permanence to the activity (data management, continued analysis of the data gathered, offering the data utilization to national research institutions).
Technical:
• Though an operational design has been developed in the Costa Rican study, it is deemed necessary to start a design discussion in other places, not from the very beginning, of course, but in sufficient detail to convince the national counterparts. Adjustments are likely to be required, and certainly acceptable.
• Also, the classification discussion will inevitably come up and must be gone through. Usually the situation in a specific country suggests adaptations of the classification used in other, even neighboring countries.
GFS Report – Pilot Inventory in Costa Rica p. 35

GFS – experiences from a pilot study in Costa Rica
• While the systematic sampling approach is considered the optimal, some stratification should be considered - where the systematic grid provides a perfect base for stratification with (spatially) proportional allocation of sample locations.
In Costa Rica, for example, while trying to visit all field sites, this turned out to be impossible. A logical stratification would therefore be, to form two strata (sub-populations):
(a) Areas where field work can be done and where data are of immediate interest for forest policy, and
(b) Areas where no human land use takes place and where it is unlikely that it will take place in the future; this refers, for example, to the center parts of national parks, which are difficult to access, and where we actually do not expect changes to take place.
Then, also the analysis and interpretation of the data must adjust to this stratification, making clear that the conclusions based on field work do refer to the sampled strata only, and not to the entire country.
• Availability of aerial photographs and satellite imagery is a major point. When this data sources are readily available from other sources, the situation is optimal. If not, their provision may mean a major budget burden. In the absence of remote sensing data, field work obviously receives more relative relevance – and is much more difficult to plan and implement.
• Safety situation for field work.
• In countries where there is more than one official language, interviews must be prepared in several languages, possibly local interpreters have to be hired.
• Species identification is always a major problem. If all trees should be identified, a dendrologist must be hired, or samples taken and sent to a herbarium. Both options are expensive.
Organizational:
• In the Costa Rican study we made very good experiences with the contracting of several forestry experts who were taking care of the field measurements. This necessarily increased the investment in training and supervision, and resulted in an efficient spreading of the GFS idea.
• Contracting local helpers helped building confidence of land owners, facilitated movement and orientation on site, and offered the option to learn from them more about the area, its history and uses. Many of them have also a good knowledge of the locally present species.
• Field crews need a permanent supervision and feedback. It is advisable that one of the organizing group is accompanying the field crews repeatedly. This keeps the motivation alive and shows at the same time that there is a real interest in good data.
• Depending on the site conditions, one should decide what an appropriate number of field samples per field crew in a given time is. We observed that, probably due to the some times extreme situations in the field, the motivation and also data quality suffered after some 5 sample locations.
GFS Report – Pilot Inventory in Costa Rica p. 36
GFS – experiences from a pilot study in Costa Rica
Capacity Building:
• The strategy was to include as many people as possible in planning an implementation of the project. While it inevitably increased the necessary organization efforts.
PARTICULARITIES OF COSTA RICA
Costa Rica exhibits some characteristics that facilitated the successful implementation of the GFS pilot study. • Unconditional and highly efficient cooperation with government authorities, and active support
from them.
• Sufficiently up-to-date aerial photographs were available and had not to be commissioned. The cost for air photos would have been definitively prohibitive.
• The country is relatively small and from an administrative point of view “homogeneous” (definitively not so from a biophysical, topographic or vegetation point of view!).
• Relatively good road network, in terms of density and quality, facilitating relatively easy access to most sample locations.
• Good communication infrastructure.
• Practically all the country is known, only some smaller regions are less explored (some area in the Cordillera de Talamanca like Kamuk).
• The country is safe, no relevant security problems have to be taken into account.
• Many well trained foresters available.
In our case we utilized this situation to contract them for field work implementation. Also, foresters with specific knowledge in GIS and data analysis can be found.
• Several institutions in Costa Rica have good GIS and Remote Sensing Laboratories.
• Relatively high level of general education. Therefore, interviews were in many cases easy to be done.
• General level of information on natural resources is good. Several satellite image based forest mapping studies have been undertaken in the last years.
• Relatively clear land tenure situation. Most of the owners granted access without any problems. There are relatively few smallholders (minifundios) which would complicate the establishment of larger field clusters and plots (simply because one would have to contact many land owners). In Costa Rica, it was relatively easy to identify the corresponding land owners – where the active support by local officials of SINAC was decisive and is highly appreciated.
GFS Report – Pilot Inventory in Costa Rica p. 37
GFS – experiences from a pilot study in Costa Rica
APPENDIX
Annex 1 complements the text of this report while Annex 2 contains a list of additional documents that are part of this report but are delivered separately.
GFS Report – Pilot Inventory in Costa Rica p. 38
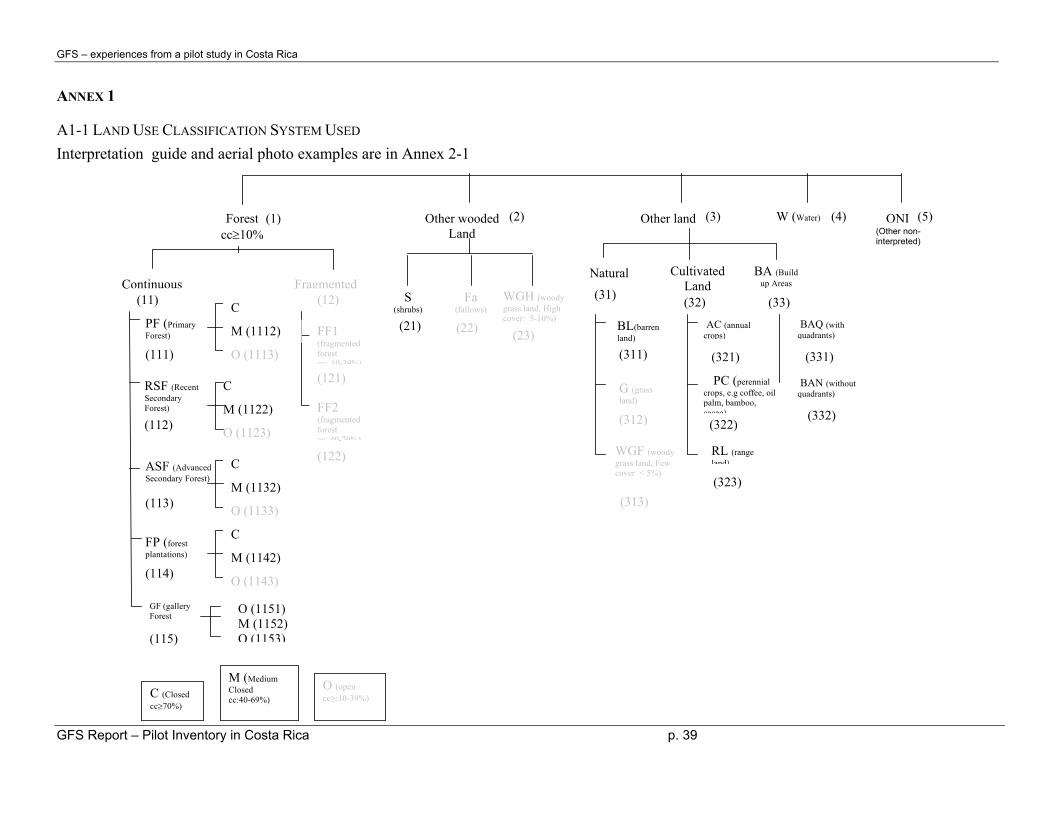
GFS – experiences from a pilot study in Costa Rica
ANNEX 1
A1-1 LAND USE CLASSIFICATION SYSTEM USED Interpretation guide and aerial photo examples are in Annex 2-1
GFS Report – Pilot Inventory in Costa Rica p. 39
C (Closed cc≥70%)
M (Medium Closed cc:40-69%)
O (open cc≥:10-39%)
Fragmented(12)
FF1 (fragmented forest cc: 10-39%)
(121)
FF2 (fragmented forest cc: 40-70%)
(122)
Forest cc≥10%
(1) Other wooded Land
(2) Other land (3) W (Water) (4) ONI (Other non-interpreted)
(5)
S (shrubs)
(21)
Fa (fallows)
(22)
WGH (woody grass land, High cover: 5-10%)
(23)
Natural
(31)
WGF (woody grass land, Few cover < 5%)
(313)
G (grass land)
(312)
BL(barren land)
(311)
Cultivated Land (32)
AC (annual crops)
(321)
PC (perennial crops, e.g coffee, oil palm, bamboo, cacao)(322)
RL (range land)
(323)
BA (Build up Areas
(33) BAQ (with quadrants)
(331)
BAN (without quadrants)
(332)
Continuous (11)
PF (Primary Forest)
(111)
RSF (Recent Secondary Forest)
(112)
ASF (Advanced Secondary Forest)
(113)
FP (forest plantations) (114)
C
M (1142)
O (1143)
C
M (1132)
O (1133)
C
M (1112)
O (1113)
C
M (1122)
O (1123)
GF (gallery Forest (115)
O (1151) M (1152) O (1153)

GFS – experiences from a pilot study in Costa Rica
A1-2 VARIABLES ASSESSED AND CODES (AS OF DATA BASE)
Form sheet 1 (Tract)
Tract. Land Tenure Land tenure 1 Private 2 Governmental 3 Governmental protected area 4 Private protected area 5 Plot under usufruct
Tract. Access Explanation: This variable explores the distance from the sample site to a road and other infrastructure. It will provide information on how distant the sample site is. Fill out all: DISTANCE IN KILOMETERS: Distance from all weather road Km Distance from seasonal road Km Distance to nearest health-clinic Km Distance to nearest school Km Form sheet 3_(Stand)
Stand._Erosion Erosion
1 No erosion 2 Hydric 3 Eolian
Stand._Hydric Erosion Hydric erosion
1 Furrows 2 Gully 3 Exposed rock
Stand._Landslide Landslide
1 Yes 2 No
GFS Report – Pilot Inventory in Costa Rica p. 40

GFS – experiences from a pilot study in Costa Rica
Stand._Origin Origin of the stand in the sub-plot. Origin 1 Natural 2 Plantations 3 Coppice 4 1 and 2 5 2 and 3 6 1, 2 and 3
Stand. Crown Cover Projected crown cover in the stand as a percentage of total area
Options: 01 - <10% 02- 10-40% 03 - 40-70% 04 - >70%
Stand. Canopy Pattern Canopy pattern of forest cover in the stand*
Options: 01 – Continuous canopy 02- Discontinuous canopy with small gaps 03 – Discontinuous canopy with large gaps and meadows
Stand. Structure Canopy structure of the stand.
Options: 01 – Single layer 02- Two-layer vegetation
Stand. Disturbance Disturbance observed in the forest stand. Options: 01- Undisturbed (protected areas, all resources preserved) 02- least disturbed (exploitation of products according to management plans) 03- Moderately disturbed (Many products collected without fitting management plans, notion of sustainability non-respected) 04- Heavily disturbed (Removal of products at rates higher than MAI, biodiversity degradation due to high pressure on selected species, encroachment of agriculture leading to high rates of deforestation)
GFS Report – Pilot Inventory in Costa Rica p. 41

GFS – experiences from a pilot study in Costa Rica
Stand._Timber Exploitation Establishes type of (last) felling undertaken in the stand. These felling systems depend on management prescriptions set in accordance with forest functions: production or conservation.
Options 1 No felling 2 Clearing 3 Selective felling 4 Group felling 5 Strip felling 6 Other
Stand._Silviculture Silvicultural practices 1 No practice 2 Improvement 3 Release of desirable superior tree 4 Release of lianas and tropical plants 5 Enrichment
Stand. Health Phytosanitary status 1 Healthy 2 Insects 3 Fungi
Stand. Fires Evidence: Fires 1 No evidence 2 Recent 3 Old
Form3__PM
PM. Exposure Exposure 1 Flat land 2 N 3 NE 4 NW 5 E 6 SE 7 S 8 SW 9 W
GFS Report – Pilot Inventory in Costa Rica p. 42
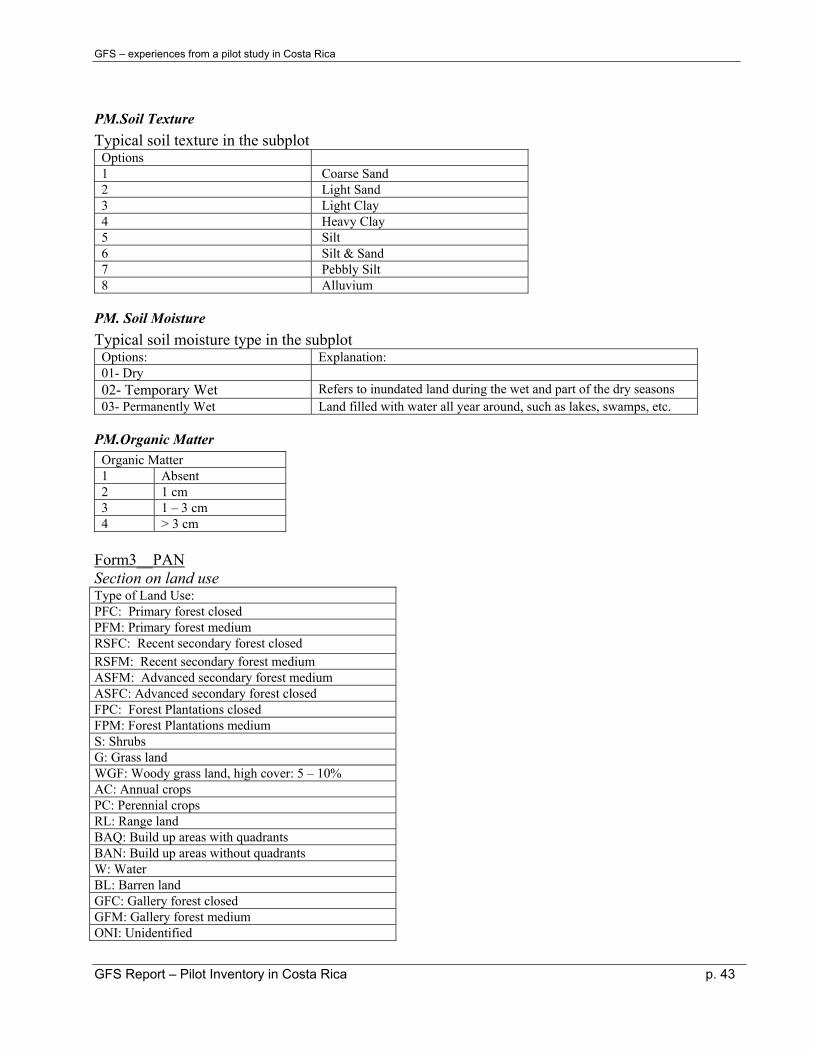
GFS – experiences from a pilot study in Costa Rica
PM.Soil Texture Typical soil texture in the subplot
Options 1 Coarse Sand 2 Light Sand 3 Light Clay 4 Heavy Clay 5 Silt 6 Silt & Sand 7 Pebbly Silt 8 Alluvium
PM. Soil Moisture Typical soil moisture type in the subplot
Options: Explanation: 01- Dry 02- Temporary Wet Refers to inundated land during the wet and part of the dry seasons 03- Permanently Wet Land filled with water all year around, such as lakes, swamps, etc.
PM.Organic Matter Organic Matter 1 Absent 2 1 cm 3 1 – 3 cm 4 > 3 cm
Form3__PAN Section on land use Type of Land Use: PFC: Primary forest closed PFM: Primary forest medium RSFC: Recent secondary forest closed RSFM: Recent secondary forest medium ASFM: Advanced secondary forest medium ASFC: Advanced secondary forest closed FPC: Forest Plantations closed FPM: Forest Plantations medium S: Shrubs G: Grass land WGF: Woody grass land, high cover: 5 – 10% AC: Annual crops PC: Perennial crops RL: Range land BAQ: Build up areas with quadrants BAN: Build up areas without quadrants W: Water BL: Barren land GFC: Gallery forest closed GFM: Gallery forest medium ONI: Unidentified
GFS Report – Pilot Inventory in Costa Rica p. 43
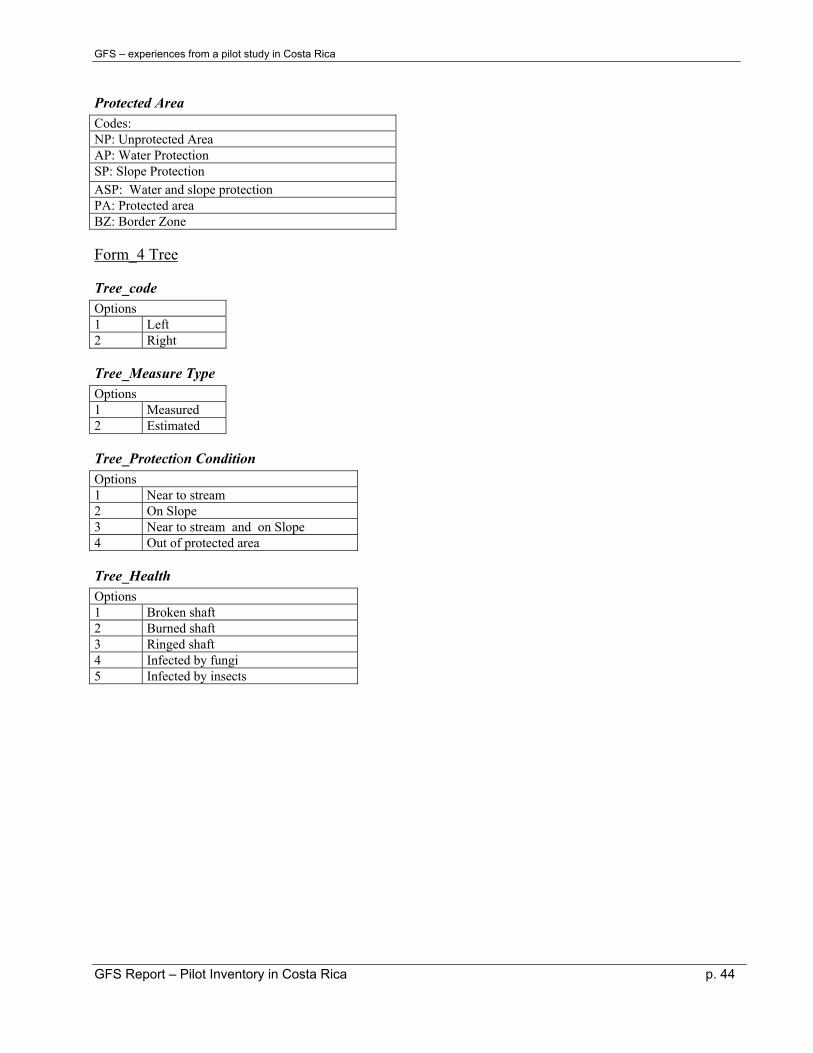
GFS – experiences from a pilot study in Costa Rica
Protected Area Codes: NP: Unprotected Area AP: Water Protection SP: Slope Protection ASP: Water and slope protection PA: Protected area BZ: Border Zone Form_4 Tree
Tree_code Options 1 Left 2 Right
Tree_Measure Type Options 1 Measured 2 Estimated
Tree_Protection Condition Options 1 Near to stream 2 On Slope 3 Near to stream and on Slope 4 Out of protected area
Tree_Health Options 1 Broken shaft 2 Burned shaft 3 Ringed shaft 4 Infected by fungi 5 Infected by insects
GFS Report – Pilot Inventory in Costa Rica p. 44

GFS – experiences from a pilot study in Costa Rica
A1-3 STRUCTURE OF DOCUMENTATION
Thorough documentation of the data the project generated is a major issue. Only a detailed description will allow the responsible national institution to give permanence to the project, and to continue building partnership with other national institutions. The complete documentation as delivered to SINAC has the following structure: Digital documents • 159 aerial photographs, interpreted and in the format of the programs Carta Linx and Arc View.
• Geographic data base of the field data, with the plots and georeferences tree positions, linked to the EXCEL data base of tree information.
• EXCEL files with the field data.
• EXCEL files with the interview data.
• Catalog of terrestrial reference photographs taken in the field (per cluster) Hardcopies • 159 sets of printed aerial photographs (from the scanned images), printed on glossy paper.
• 159 printed aerial photographs with the results of the photointerpretation.
• 40 photographs and maps, one for each field sample location.
• Original form sheets of field data collection.
• Original form sheets of interviews.
• Catalog of photographs
• Final report, including analysis results.
GFS Report – Pilot Inventory in Costa Rica p. 45
GFS – experiences from a pilot study in Costa Rica
GFS Report – Pilot Inventory in Costa Rica p. 46
ANNEX 2 (DOCUMENTS COME SEPARATELY)
A2-1 AERIAL PHOTOGRAPHS: INTERPRETATION AND OBSERVATIONS
A2-2 FIELD MANUAL
A2-3 SET OF FORM SHEETS
A2-4 GPS INSTRUCTIONS
A2-5 INFORMATION PAPER PRESENTED TO INBIO AND SINAC AT SEPT. 12, 2001 TO START DISCUSSION WITH NATIONAL INSTITUTIONS.