Embed Size (px)
Citation preview
Jason Yao
Group Executive Vice President & Chief Financial Officer & Chief Actuary
2018.10.12 Shenzhen, China
Ping An’s Value Inside Out (III)

Cautionary Statements Regarding Forward-Looking Statement
To the extent any statements made in this presentation containing information that is not historical are essentially forward-looking. These
forward-looking statements include but are not limited to projections, targets, estimates and business plans that the Company expects or
anticipates will or may occur in the future. These forward-looking statements are subject to known and unknown risks and uncertainties that
may be general or specific. Certain statements, such as those including the words or phrases "potential", "estimates", "expects", "anticipates",
"objective", "intends", "plans", "believes", "will", "may", "should", and similar expressions or variations on such expressions may be considered
forward-looking statements.
Readers should be cautioned that a variety of factors, many of which may be beyond the Company's control, affect the performance,
operations, and results of the Company, and could cause actual results to differ materially from the expectations expressed in any of the
Company's forward-looking statements. These factors include but are not limited to exchange rate fluctuations, market shares, competition,
environmental risks, changes in legal, financial and regulatory frameworks, international economic and financial market conditions, and other
risks and factors beyond our control. These and other factors should be considered carefully, and readers should not place undue reliance on
the Company's forward-looking statements. In addition, the Company undertakes no obligation to publicly update or revise any forward-looking
statement that is contained in this presentation as a result of new information, future events, or otherwise. None of the Company, or any of its
employees or affiliates is responsible for, or is making, any representation concerning the future performance of the Company.
Specification of Disclosure
Value of new business stated in this presentation is of life and health insurance business unless otherwise specified, which is comprised of
insurance business from Ping An Life, Ping An Annuity and Ping An Health.
Growth rates disclosed in the charts and tables of this presentation are annual compound growth rates unless otherwise specified.
2
Important Notes

3
Ping An’s Booming Business
3,360,312
6,493,075
2013 2017
28,154
89,088
2013 2017
Embedded Value
Total Assets Net Profit Attributable to Shareholders
of Parent Company
NBEV
33%
329,653
825,173
2013 2017
26%
18%
18,163
67,357
2013 2017
39%
+CAGR +CAGR
+CAGR
+CAGR
Note: (1) EV and NBEV of 2013 are under Solvency I definition. Ping An has started to disclose EV and related data under C-ROSS definition as required by regulation.
(2) Source of data: Ping An’s annual reports.

4
1
2
3
4
The 4
Main
Concerns
1
2
3
4
Aging population and inflating medical costs Increasing income and insurance awareness Low insurance penetration and coverage
Environmental Changes Encourage Upgrade
Resilient solvency position Massive balance of residual margin Excellent business quality and protection
focused Integrated financial and technology-empowered
model
Sustainable Future Profit
Balance and release of residual margin are vital parts of capital and profit
RM and VIF are both PV of future profit with differences in discount rate, tax and cost of capital
Vital Source of Profit and Capital
Prudent risk discount rate Account for long-term deterioration in morbidity
rates Prudent assumptions adding value proven by
sequential positive operating variance
Prudent Assumptions
Is insurance consumption upgrade sustainable?
Is Ping An Life’s steady growth
sustainable during economic
downturn?
How to interpret residual margin?
Are EV assumptions prudent and reasonable?
Recap on Previously Addressed Life Insurance Topics

5
IFRS9
Document 76
Document 134
Document 19
Reform on commercial auto insurance pricing
• Implemented in
Jan. 2018
Life
Group
P&C
• Announced in
Sep. 2016
• Announced in
Jun. 2017
• Announced in
Apr. 2018
• Ongoing since 2015
ROEV • Reflects underlying EV
growth
• Remove short-term
fluctuations to capture
underling results and
trend
• Analysis of the sources
of Life profit
• Disclose the drivers of
residual margin
changes
Operating profit
Movement of residual margin
Source of profit
Return to insurance nature
and tightened regulation Ping An proactively
enhances disclosure
• Disclose the drivers of
available funds
changes
Movement of available funds
Regulation Reforms Promote Disclosure Enhancement

CONTENTS
1. How to Interpret Operating Profit
2. How to Interpret ROEV
3. Valuation Framework of Ping An

CONTENTS
1. How to Interpret Operating Profit
• Background of operating profit
• Source of earning of Life
• Movement of residual margin
• Profit drivers of non-life businesses

2006 2017
Total Investment Yield
Long-term Investment Assumption (5%)
Substantial Impact of Discount Rate
Change
RMB 28.3 billion
5%
More Fluctuation under IFRS 9
IAS39 IFRS9 0
Note: (1) Short-term investment variance is the variance between actual investment return of L&H and the ultimate investment return assumption (5%), net of associated relevant
impact on insurance and investment contract liability.
2008 2017
Hugh Investment Return Volatility
8
Operating Profit =
Net Profit - Short-term Investment Variance(1) - Impact of Discount Rate Change - One-off Material Non-operating Items
Average investment
rate is 5.6%
0
0
Impact on reserve of discount rate change
c. 4.9Times
Operating Profit Provides a Clearer View of Underlying
Results and Trends
Financial assets accounted in FVPL

Note: (1) The one-off material non-operating item in 2017 is referred to impact of the restructuring of Ping An Good Doctor.
(2) Figures may not match the calculation due to rounding.
For the 12 months ended 31/12/2017
(in RMB Million)
Impact of discount rate change (C)
Short-term investment variance (B)
Impact of one-off material non-
operating items (D)
Net profit (A)
Minority interests
Net profit attributable to shareholders
of the parent company
Excluding:
Operating profit (E = A – B – C – D)
Operating profit attributable to minority
shareholders
Operating profit attributable to
shareholders of the parent company
4,532
(21,213)
36,143
485
35,658
52,824
696
52,128
13,372
65
13,307
13,372
65
13,307
23,189
9,740
13,449
23,189
9,740
13,449
(3,818)
53
(3,871)
(3,818)
53
(3,871)
14,689
68
14,621
3,839
68
3,771
10,850 (1)
4,532
(21,213)
99,978
10,890
89,088
105,809
11,101
94,708
10,850
16,403
481
15,924
16,403
481
15,924
Life &
Health P&C Banking Asset
Management Fintech &
Healthtech Other and
elimination Group
Investment Variance and Discount Rate Change Mostly
Impact L&H
9

10 Note: Figures may not match the calculation due to rounding.
Release of residual margin
Spread income
Return on net worth
Operating variance and others
Operating profit before tax
Income tax
Operating profit after tax
2017 Portion(%) (in RMB Million)
68.3%
10.1%
13.9%
100.0%
49,811
7,357
10,108
72,912
(20,088)
52,824
7.7% 5,637
2016
38,202
5,648
6,317
53,882
(13,365)
40,518
3,715
Portion(%)
70.9%
10.5%
11.7%
100%
6.9%
Operating Profit of L&H is Mainly Driven by Release of
Residual Margin and Operating Variance

2016 Residual
margin of L&H
Expected
interest
growth
2017 Residual
margin of
L&H
Contribution
from 2017 NB
Release of
residual
margin
Operating
variance and
others
2017 NBEV Tax and
capital cost
Discount rate
and other
economic
assumption
differences
others
2017 Residual
margin from
NB
Movement of Residual Margin Reconciliation from NBEV to RM of NB
11
(in RMB Million)
Note: Figures may not match the calculation due to rounding.
616,319
454,705
168,426 22,642
(49,811)
20,357
+35.5%
67,357
39,761
68,361
(7,053)
168,426
Residual Margin Growth is Driven by Quality New Business

M0
Y5
Y1
0
Y1
5
Y2
0
Y2
5
Y3
0
Y3
5
Y4
0
Y4
5
Y5
0
Y5
5
Y6
0
Y6
5
Y7
0
Y7
5
Y8
0
Y1
Y6
Y1
1
Y1
6
Y2
1
Y2
6
Y3
1
Y3
6
Y4
1
Y4
6
Y5
1
Y5
6
Y6
1
Y6
6
Y7
1
Y7
6
Y8
1
M0
Y5
Y1
0
Y1
5
Y2
0
Y2
5
Y3
0
Y3
5
Y4
0
Y4
5
Y5
0
Y5
5
Y6
0
Y6
5
Y7
0
Y7
5
Y8
0
12
RM release pattern of SA type carrier is
in line with pattern of # of policies
change, which serves as carrier of most
PA’s products
Expected
release of
RM
Balance
of RM
Balance
of RM
For the same set of policies, the
higher the rate of release, the lower
the remaining balance.
High-value business is still able to
maintain high RM balance even at
high rate of release
SA type carrier
CV type carrier
policies inforce
RM Release Pattern Varies by Carriers. High-value Business is Still
Able to Maintain High RM Balance Even at High Rate of Release
SA type carrier
CV type carrier
High-value product under SA type carrier
Low-value product under
CV type carrier
Note: SA = Sum-Assured; CV = Cash Value.

13
Release from in-force
business of prior year
Release from NB
written in prior year
Release from NB
written in current year
• Decreases as # of in-force business
decreases
• Affected by business scale and mix
• The earlier the effective month, the
higher the RMR to the effective year
Residual Margin Release (RMR)
= RMR from in-force business of prior year + RMR from NB issued in prior year + RMR from NB issued in current year
• The RMR exposure is one whole year in
the 2nd year and much higher than
exposure in the 1st year, which is less
than one year
2016 2017 2018 2019 2020 2021 2022 2023 2024 2025
RM Release is Mostly Driven by In-force Business. New
Business is Key to Future Growth

14
(in RMB Million)
Note: Figures may not match the calculation due to rounding.
-
11,667
Total invest-
ment income
+
×
Net earned
premium
188,219
Premium
income
216,090
Earned ratio
87.1%
×
Combined ratio
96.2%
7,112
Underwriting
profit
120
Other net revenue
and expense
13,372
Net Profit
5,527
Income tax
+
Average invest
-ment assets
219,006
Total invest
-ment yield
5.3%
×
Operating Profit Drivers of P&C Business
(1- )

15
(in RMB Million)
×
40,803
3,210
23,189
Net Profit
6,968
Income tax
3,120,038
Average asset balance
2.37%
Net interest margin
-
31,616
105,786
Revenue
29.89%
Cost-to-income ratio
1,602,503 Average loan balance
2.55%
Credit cost
+
-
-
- ×
×
105,786
Revenue 74,009
31,777
General and admin. expense
Loan impair- ment loss
Other expense
Net interest revenue
Net non-interest revenue
Note: Figures may not match the calculation due to rounding.
Operating Profit Drivers of Banking Business

16
(in RMB Million)
×
+
4,292
3,957
Net Profit
651,302
0.66%
-
276
1,319
-
-
+
4,016
2,236
42
1,018
Note: Figures may not match the calculation due to rounding.
Revenue
Administrative expense
Total investment income
Other revenue and expense
Income tax
Fees and Commission revenue
Fees and Commission expense
Monthly average assets held in trust
Fee rate of assets held in trust
Operating Profit Drivers of Trust Business

17
(in RMB Million)
- +
8,961 3,632
Admin. expense
8,961
Revenue
2,170
Other expense
2,123
Net Profit
456
Income tax
811
580
Finance cost
3,321
2,196
-
-
-
-
+
×
40.5%
4,255
Note: Figures may not match the calculation due to rounding.
Fee and commission revenue
Fee and commission expense
Total investment income
Other revenue
Revenue
Cost-to-income ratio
Operating Profit Drivers of Securities Business
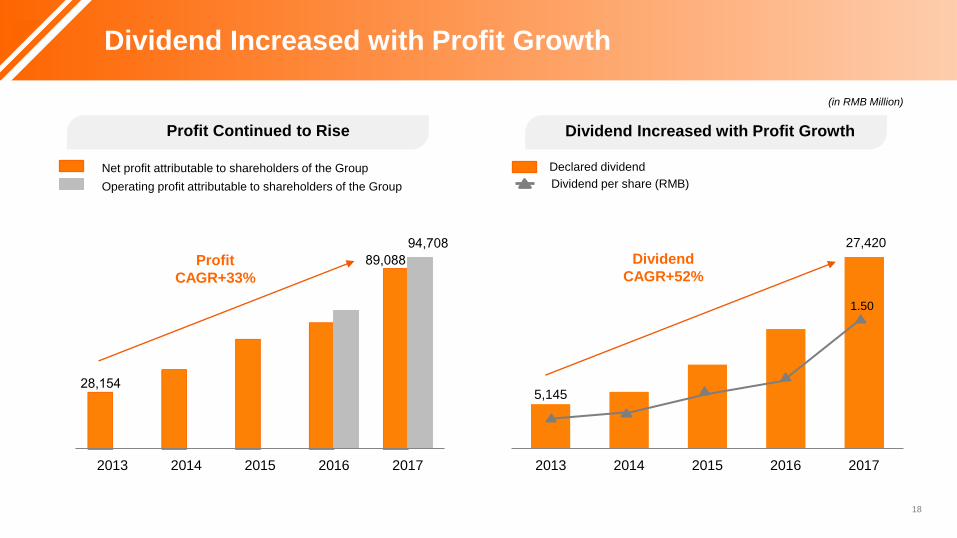
Profit Continued to Rise Dividend Increased with Profit Growth
Operating profit attributable to shareholders of the Group
Net profit attributable to shareholders of the Group Declared dividend
Dividend per share (RMB)
18
(in RMB Million)
5,145
27,420
2013 2014 2015 2016 2017
28,154
89,088
94,708
2013 2014 2015 2016 2017
Dividend
CAGR+52% Profit
CAGR+33%
1.50
Dividend Increased with Profit Growth

Dividends
received from
subsidiaries
Dividends
paid out by
the Group
Capital
injected into
subsidiaries
Other
impacts
End-2017
available
funds
End-2016
available
funds
Abundant Available Funds Diversified Profit Source
Note: (1) The available funds of the parent company includes bonds, equity securities, bank deposits and cash equivalents held by the parent company. The capital is invested
in subsidiaries, used for daily operations, or paid out as dividends.
(2) Dividends received from subsidiaries include RMB 17,356 million from Ping An Life, RMB 3,030 million from Ping An Property & Casualty, RMB 1,345 million from Ping
An Bank, and RMB 2,500 million from Ping An Trust.
19
(in RMB Million)
35,570
25,711
(19,194)
(7,702)
3,947 38,332
2017 2016
L&H 55.0% 58.9%
P&C 14.1% 18.5%
Banking 14.2% 19.2%
Asset management 16.8% 13.8%
FinTech&HealthTech 4.0% -4.8%
Other and elimination -4.1% -5.6%
Group 100.0% 100.0%
Diversified Profit Source Supports Sustainable Dividend
Growth

23
Benchmark Decline of 50bps in interest rates Decline of 30% in fair value of equity assets
Regulatory requirement
≥100%
Ping An Group Ping An Life Ping An P&C
20
-7.9pps -7.0pps
214.9% -10.3pps -11.9pps
234.1%
-4.1pps +0.4pps
217.5%
Resilient Solvency Reduces Capital Constraints on Dividend

• L&H profit growth is mainly driven
by solid growth in RM release and
operating variances
• Non-life businesses have clear
drivers of growth
Predictability
Operating
Profit
• Remove short-term fluctuation
• Reflect business results and trends
Stability
• Dividend growth consistent with
operating profit growth
• Diversified profit source and low
solvency constraints
Steady Dividend
21
Recap
CONTENTS
1. How to Interpret Operating Profit
2. How to Interpret ROEV
3. Valuation Framework of Ping An

• L&H ROEV = L&H EV Operating Profit ÷ Opening EV
• L&H EV Operating Profit = Expected return on opening EV + Value generation of NB + Operating contribution of L&H
End-2016 L&H
EV
Expected
return on
opening EV
Value generation
of NB
L&H EV before
non-operating
contributions
23
(in RMB Million)
Operating contribution
of L&H
Investment
variance and
others
Dividend
paid
End-2017 L&H
EV
Note: Operating contribution of L&H includes Operating assumption and model changes, as well as Operating variances and others.
ROEV = 35.5%
360,312 31,745
88,117 8,127 488,301 24,798 (16,718)
496,381
ROEV Reflects Underlying EV Growth
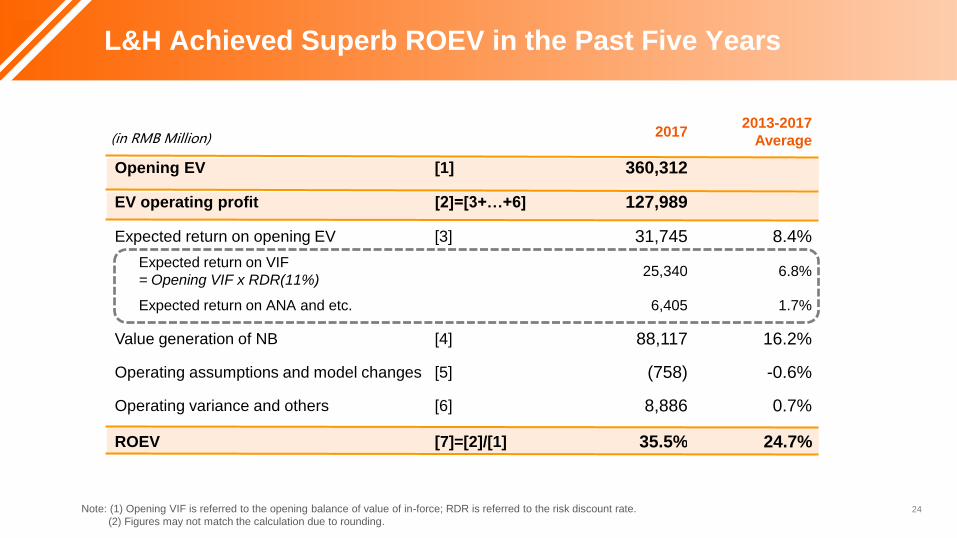
2017 2013-2017
Average
Opening EV [1] 360,312
EV operating profit [2]=[3+…+6] 127,989
Expected return on opening EV [3] 31,745 8.4%
Expected return on VIF
= Opening VIF x RDR(11%) 25,340 6.8%
Expected return on ANA and etc. 6,405 1.7%
Value generation of NB [4] 88,117 16.2%
Operating assumptions and model changes [5] (758) -0.6%
Operating variance and others [6] 8,886 0.7%
ROEV [7]=[2]/[1] 35.5% 24.7%
24
(in RMB Million)
L&H Achieved Superb ROEV in the Past Five Years
Note: (1) Opening VIF is referred to the opening balance of value of in-force; RDR is referred to the risk discount rate.
(2) Figures may not match the calculation due to rounding.

Note: (1) Yields of 10-year CGB above are as at the end of each year;
(2) Risk premium = RDR (Risk Discount Rate) - yield of the 10-year CGB.
(3) Profit volatility is calculated as the standard deviation of net profit growth over 2013-2017; Market peers include China Life, CPIC, Taiping and NCL; Sources:
corresponding annual reports.
Year Risk Discount
Rate (RDR)
10-year CGB Risk
Premium Yield
2008 11.5% 2.9% 8.6%
2009 11.0% 3.8% 7.2%
2010 11.0% 4.0% 7.0%
2011 11.0% 3.5% 7.5%
2012 11.0% 3.6% 7.4%
2013 11.0% 4.6% 6.4%
2014 11.0% 3.7% 7.3%
2015 11.0% 2.9% 8.2%
2016 11.0% 3.0% 8.0%
2017 11.0% 3.9% 7.1%
10-year Average - - 7.5%
• Risk discount rate (RDR) should reflect the level of uncertainty in future profits
• Expected return is positively correlated to the level of RDR and VIF as % of EV
Excellent risk management:
SARMRA ranks #2
High business quality:
Low investment sensitivity and
Interest Margin as % of NBEV
Low profit volatility vs peers:
Ping An Group 11.3% < Listed peers 48.9%
25
Prudent Risk Discount Rate Led to High Expected Return

Sustainable NBEV Growth
Diversification effect
NBEV
Note: (1) Above figures from 2013 to 2015 are based on Solvency I, while those from afterwards are based on C-ROSS
Value generation of NB as % of opening EV
26
(in RMB Million)
Capital calculation level
Example:
Policy1 Policy2 Policy Company
[A] RES+DPL 250 300 550 550
[B] RES+MC+
DTL 300 200 500 500
[C] CV+DTL 75 325 400 400
Liability + RC = MAX(A,B,C) 300 325 625 550
+
The method of EV valuation under C-ROSS states:
Capital requirement of NB must be calculated at policy level,
while that of in-force can be calculated at company level
Capital requirement calculated at policy level > at total NB level
> at company level, which generates diversification effect.
Liability+RC is lower calculated at company level
2013 2014 2015 2016 2017
48.4%
18,163
88,117
10.2%
24.5%
+CAGR
Underpenetrated Market and Leading Advantages Contributed
to Sustained NBEV Growth

0%
10%
20%
30%
40 50 60 70 80 90 100
Morbidity
Age
Industry Benchmark
Ping An Assumption(with deterioration)
Morbidity Factored in Long-term Deterioration
Expanding and Enriching Product Types
Contribute
operating
variance
Fast Growth of Operating Variance
27
• Ping An Fu upgrade,
• Includes 8 more minor
diseases in coverage
• Market segmentation, launch
Kids’ Ping An Fu
• Launch Ping An RUN, expand
Ping An Fu’s coverage to 80
types DD+20 types minor
disease
• With the help of rate
marketization, launch
Ping An Fu for mid to
high-end protection
market
• Ping An Fu upgrade, disease
coverage expand to 45 types
diseases
• Launch O2Odrivers accident
protection product
• Satisfy customers’ every
possible needs, launch
Long term care product
• Ping An Fu further
upgrade, sum assured
increases after minor
disease benefit payout
2017 2014 2016 2013 2015 2017
(in RMB Million)
Prudent Assumptions and Excellent Management Drove
High Operating Variance
2014 2015 2016 2017

28
3-year endowment
Pricing rate: 3.5%
Sum-assured: 1103
Example
Actual
experience
Reserve
assumption
EV
assumption
Operating
assumption
Investment rate 6% 4% 5% 5%
Expected interest
/Investment return 6000 4000 5000 5000
Reserve
assumption
Actual
experience
EV
assumption
Mortality 6% 2% 5%
# of deaths 6 2 5
Cost of death 432 144 360
Note: (1) Beginning underlying asset equals premium; (2) Cost of death = Sum-assured at risk*# of deaths
Pricing mortality: 5%
Single pay premiun:1000
Initial # of policies:100
Spread income
= Diff. between operating and reserve assumption
= 5000-4000
Operating variance
= Diff. between actual and reserve assumption
= 432-144
Investment variance
= Diff. between actual and EV assumption, and
factoring in tax effect
=(6000-5000) *(1 – tax rate)
Operating variance
= Diff. between actual and EV assumption, and factoring
in tax effect and impact on VIF due to # of policy changes
= (360-144)*(1 – tax rate)
+ (5-2)impact on VIF
Source of
operating
earning:
EV:
Investment and Operating Variances Resulted from Actual
Experience Deviating from Assumptions

29
Apply the 5-year average ROEV of Ping An L&H (24.7%), P/EV is calculated under different RDRs and
dividend growth rates:
P/EV example g:Dividend growth rate
3.0% 4.0% 5.0% 6.0% 7.0%
9.0% 3.6 4.1 4.9 6.2 8.9
10.0% 3.1 3.5 3.9 4.7 5.9
r:RDR 11.0% 2.7 3.0 3.3 3.7 4.4
12.0% 2.4 2.6 2.8 3.1 3.5
13.0% 2.2 2.3 2.5 2.7 3.0
𝑃/𝐸𝑉 =𝑅𝑂𝐸𝑉 − 𝑔
𝑟 − 𝑔 The higher ROEV, the higher P/EV
ROEV is a Key Measure to the Valuation of Life Company

30
Quality new business
Prudent assumptions
Excellent management
ROEV outperforms
peers’ High P/EV
Recap

CONTENTS
1. How to Interpret Operating Profit
2. How to Interpret ROEV
3. Valuation Framework of Ping An

2017
Equity attributable to
shareholders of the
parent company
Portion(%) ROE(%)
Life & Health 160,450 33.9% 25.7%
P & C 69,804 14.7% 20.0%
Banking 128,791 27.2% 11.6%
Asset Management 103,848 21.9% 15.7%
Fintech and Healthtech 37,772 8.0% 41.2%
Others and elimination (27,314) -5.8% N/A
Group 473,351 100.0% 20.7%
32
(in RMB Million)
Excellent Delivery of High ROE by Mostly All Sectors

33
Fintech and Healthtech Market Value
Autohome Inc. USD9,057mn
Good Doctor HKD55,804mn
Lufax USD18,500mn
OneConnect USD7,500mn
Healthcare tech USD8,800mn
ZhongAn Online P&C HKD46,967mn
Other RMB444mn
Value attributable to shareholders
of parent company is 153.8 billion
RMB and it is 4.1 times of equity
which is 37.77billion RMB.
Note: Market price as at 30/09/2018 were used as listed companies’ market value, valuation price in the most recent financing were used for others. And HKD exchange
rate of 0.85 and USD of 6.85 were used to convert to values of RMB.
Market Value of the Technology Sector Far Exceeded Equity

34
1
Sum of Parts Valuation
2
Customer Economic Model
Value of Group
Vale of Retail Business
Value of Other Business
+
# of customers
Profit per customer
Growth coefficient
Value coefficient
x × ×
Sectors Valuation
method
L&H PEV
P&C PB
Banking Market value
Asset
Management PB
Tech Market value
Adjustment
Valuation Framework of Ping An Group

Thank you!

𝑃 =𝐷1
𝑟 − 𝑔
P D1 D2 D3
Dn
M0 Y1 Y2 Y3 YN
Dividend growth rate is g; RDR is r
… … …
…
𝑃 = 𝐷1(1 + 𝑔)𝑡−1
(1 + 𝑟)𝑡
∞
𝑡=1
Gordon Growth Model
Discounting
Valuation via ROEV
𝑔 = 𝑅𝑂𝐸𝑉 ∗ (1 − 𝑓) = 𝑅𝑂𝐸𝑉 - 𝑅𝑂𝐸𝑉 * 𝑓 𝑅𝑂𝐸𝑉 * 𝑓= 𝑅𝑂𝐸𝑉 - 𝑔
EV operating profit and operating profit are Correlated
Dividend can be expressed in terms of ROEV,
consider dividend payout ratio f :
𝐷1 = EV*ROEV*f
Dividend growth rate 𝑔 is related to ROEV and f
𝑃/𝐸𝑉 =𝑅𝑂𝐸𝑉 − 𝑔
𝑟 − 𝑔
ROEV is a key valuation measure. ROEV, P/EV
Stock price in theory P :
Note: RDR is assumed to be higher than dividend growth rate
Appendix: ROEV is a Key Measure to the Valuation of Life
Company