Embed Size (px)
Citation preview

Pivot DesignOregon NRCS Engineering
MeetingJanuary 11-14, 2005
Natural Resources Conservation ServiceNRCS
United States Department of Agriculture

Everything you need to know about Center Pivots, but didn’t
really want to know
Topics
• Brief Overview• Parts and Pieces • Water requirements – System flow rate• Pressure requirements – Friction loss• Nozzle type – Selection• Application – Rate, Timing• Runoff management

Who is Frank Zybach?
• Inventor of the Center Pivot in the year 1951
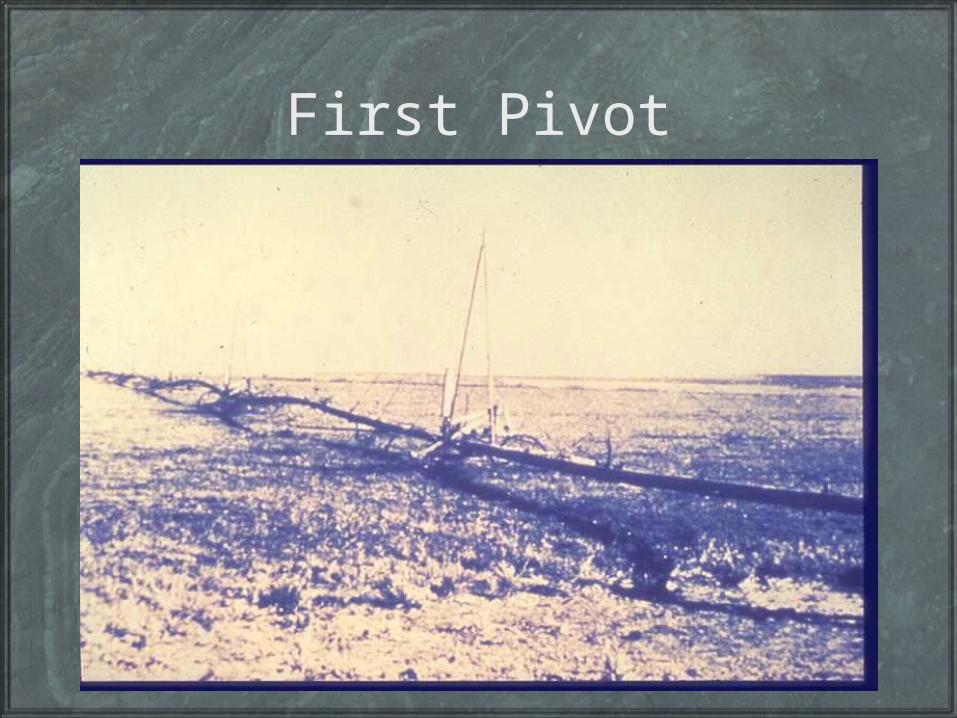
First Pivot
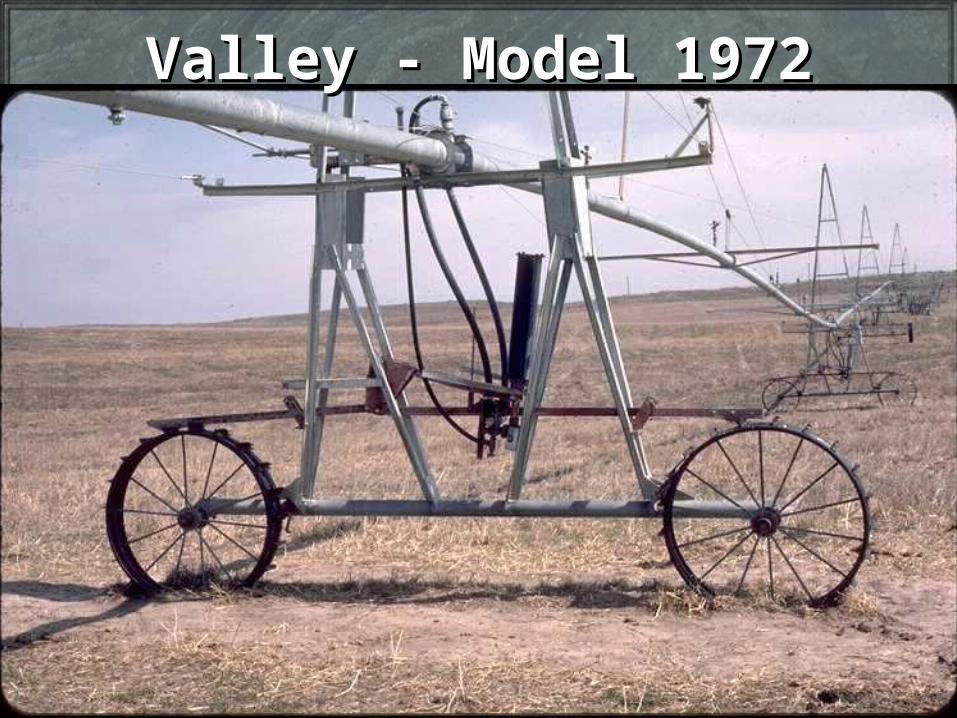
Valley - Model 1972Valley - Model 1972
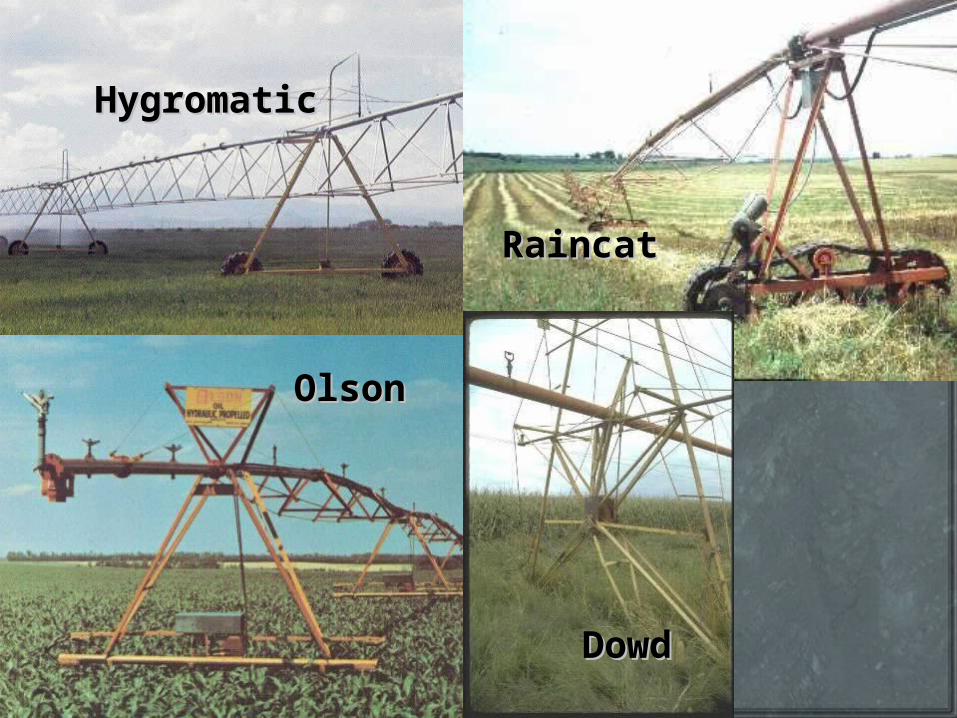
HygromaticHygromatic
OlsonOlson
RaincatRaincat
DowdDowd
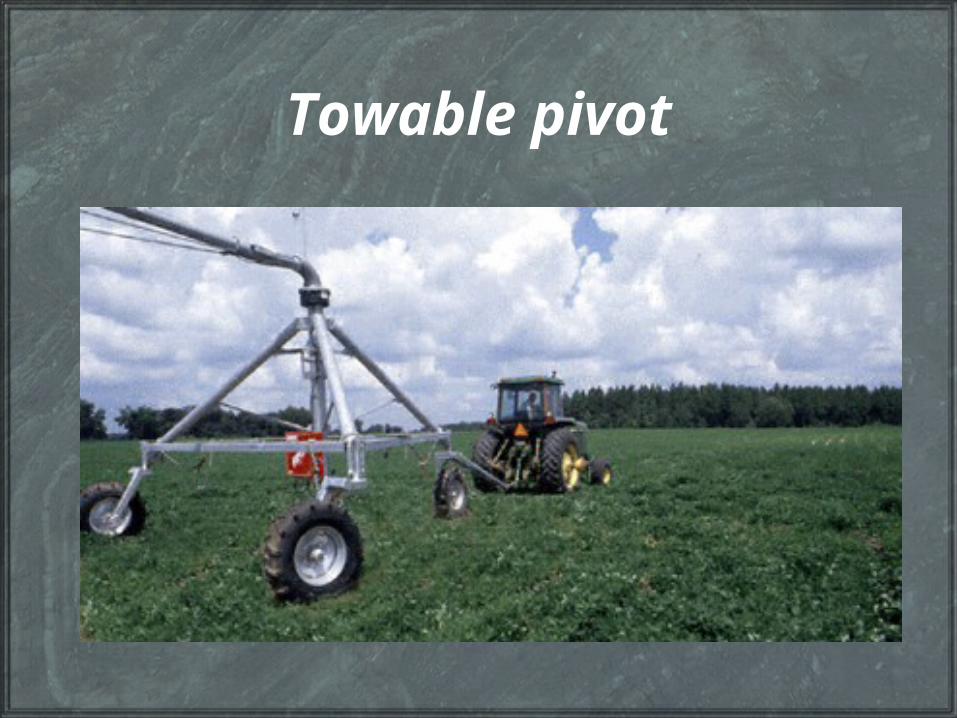
Towable pivot
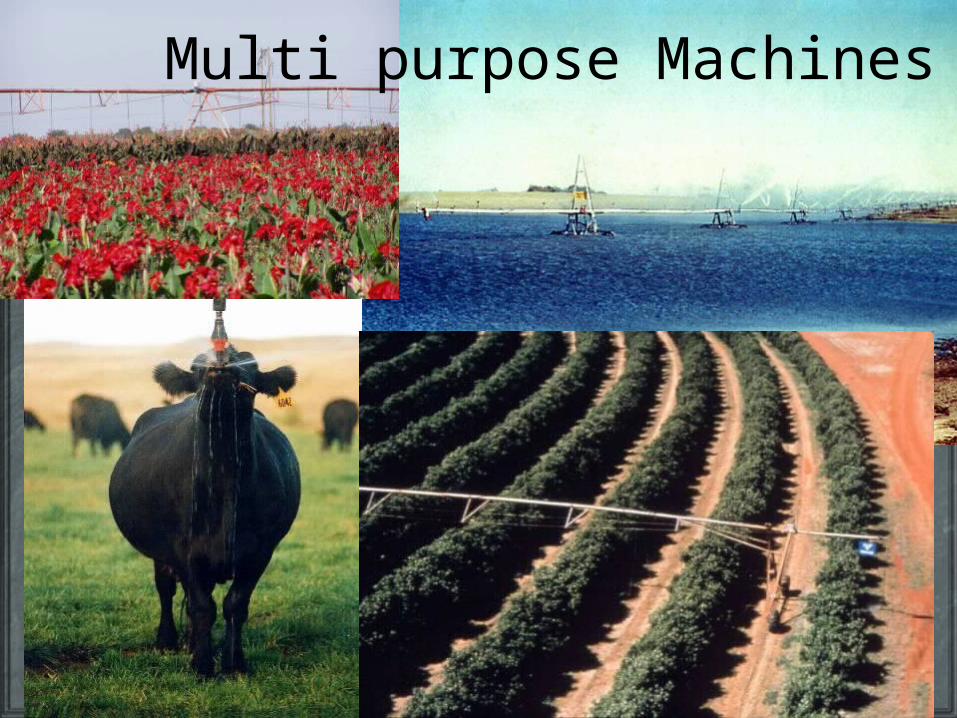
Multi purpose Machines
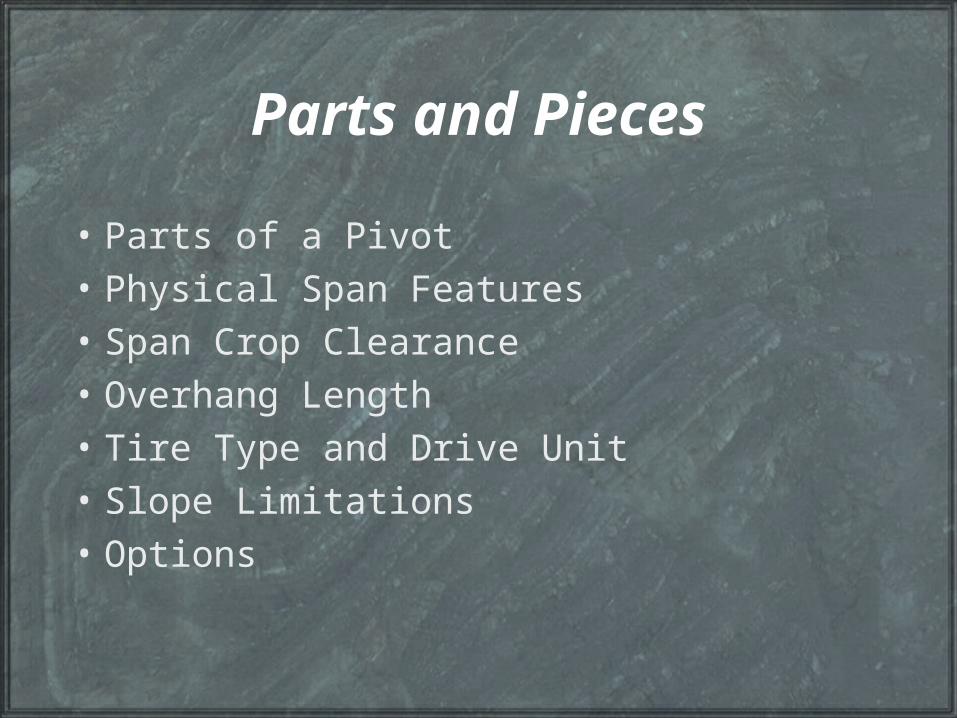
Parts and Pieces
• Parts of a Pivot• Physical Span Features• Span Crop Clearance• Overhang Length• Tire Type and Drive Unit• Slope Limitations• Options
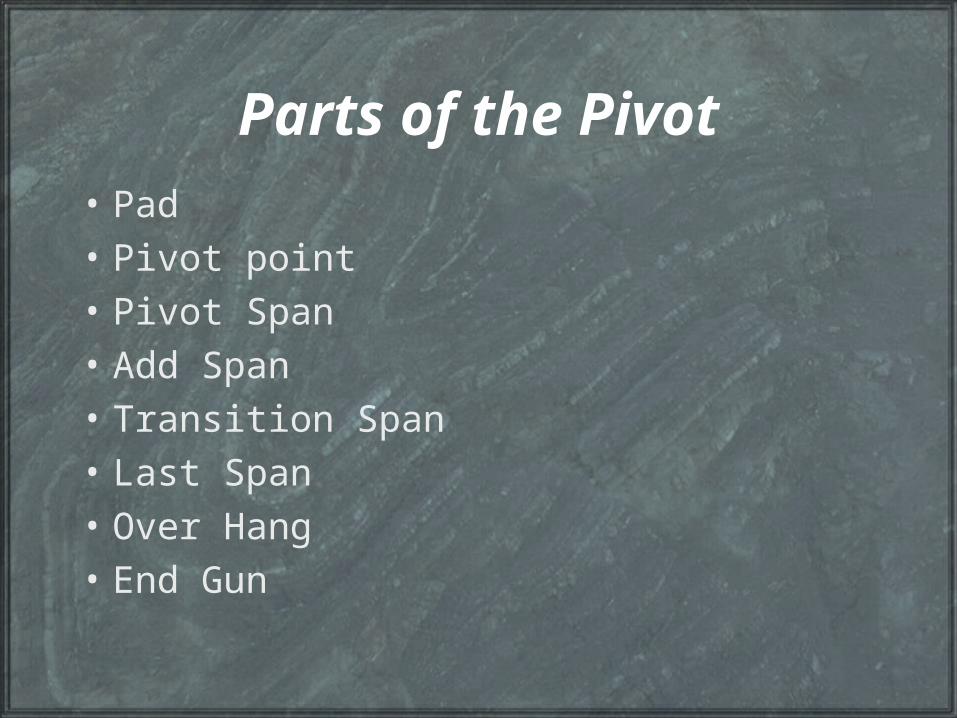
Parts of the Pivot• Pad
• Pivot point
• Pivot Span
• Add Span
• Transition Span
• Last Span
• Over Hang
• End Gun
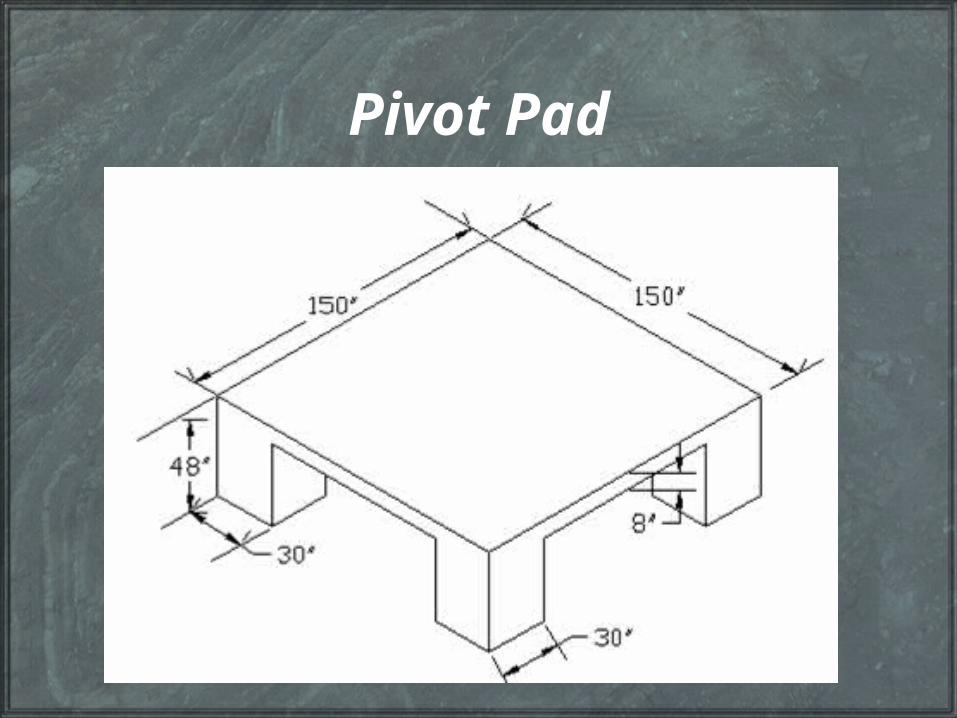
Pivot Pad
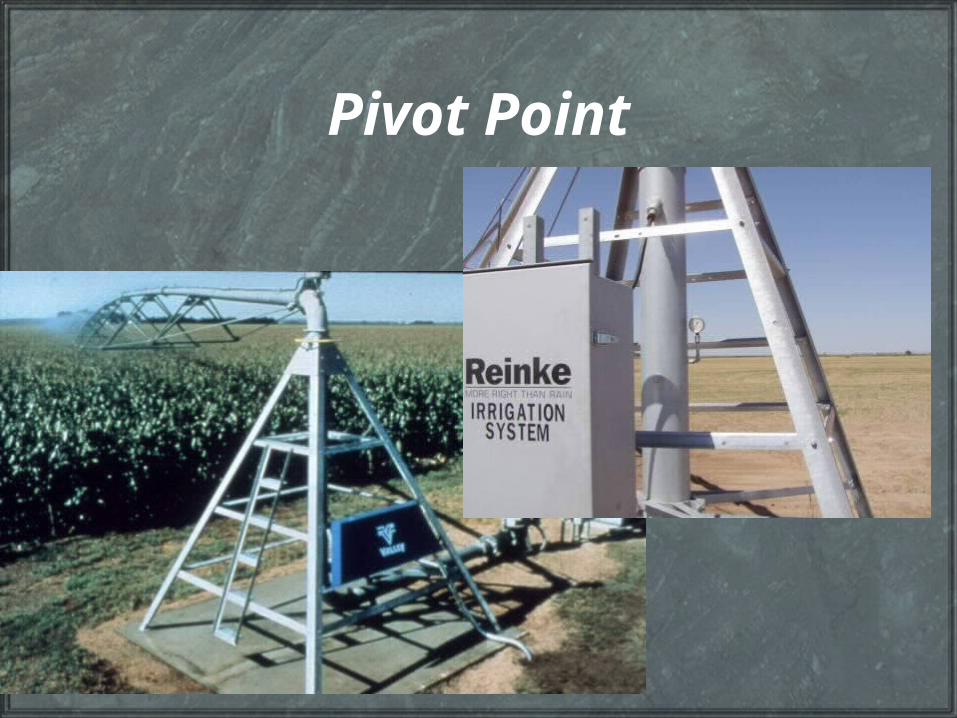
Pivot Point
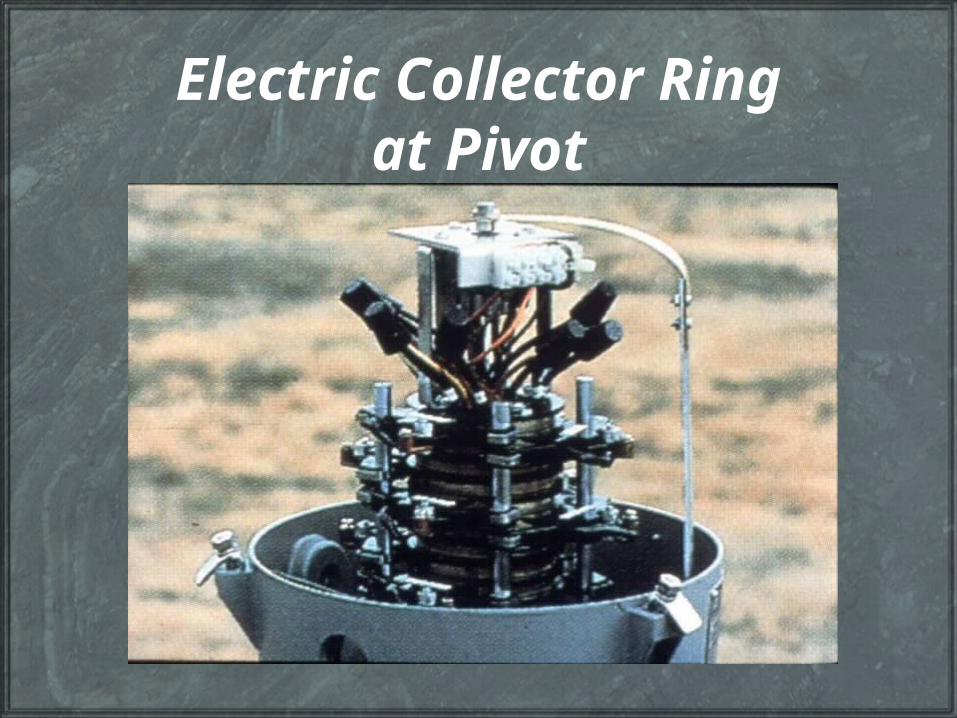
Electric Collector Ringat Pivot
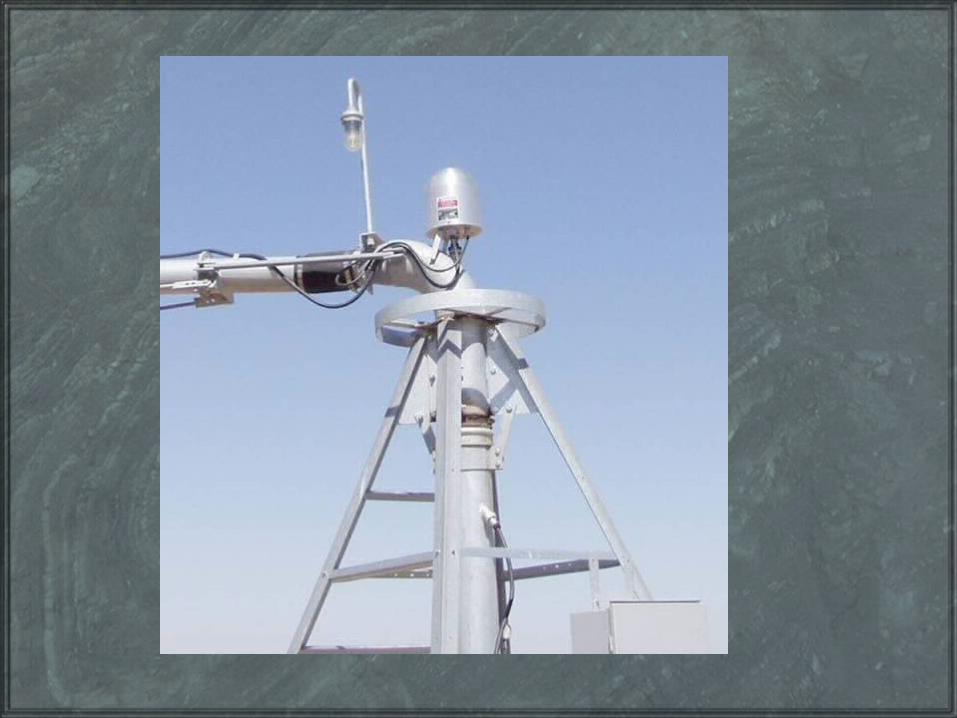
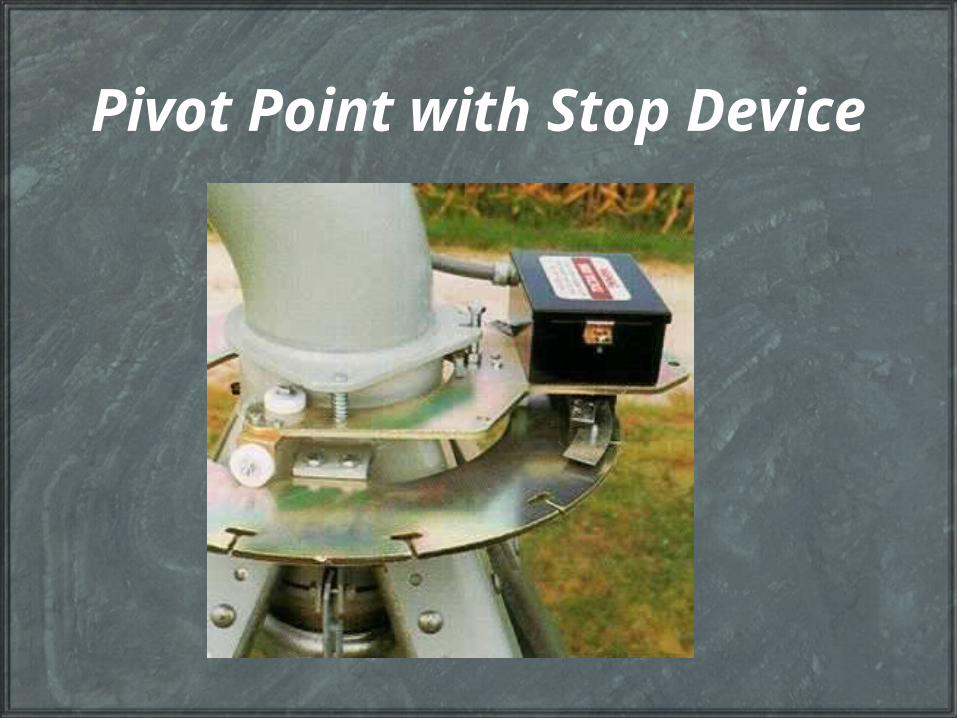
Pivot Point with Stop Device

Physical Span Features
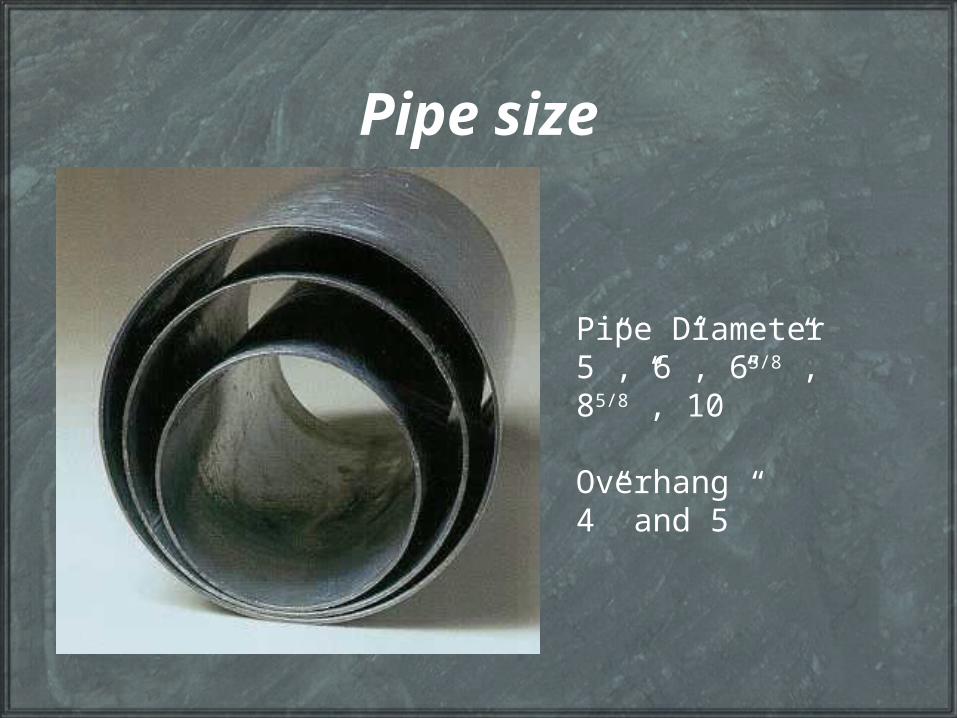
Pipe size
Pipe Diameter5”, 6”, 65/8”, 85/8”, 10”
Overhang4” and 5”
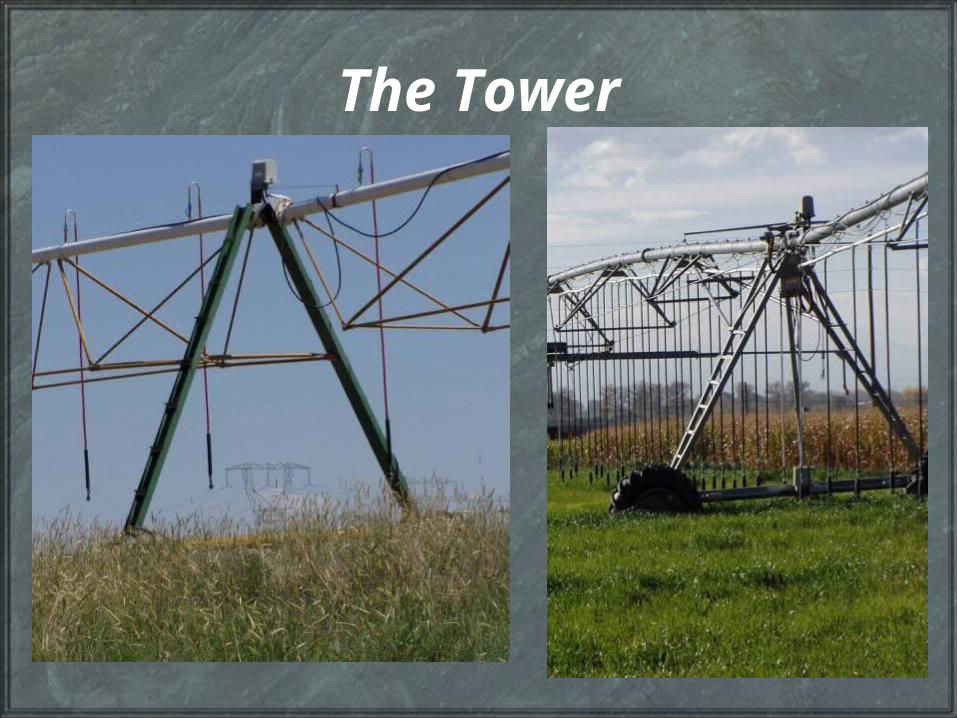
The Tower
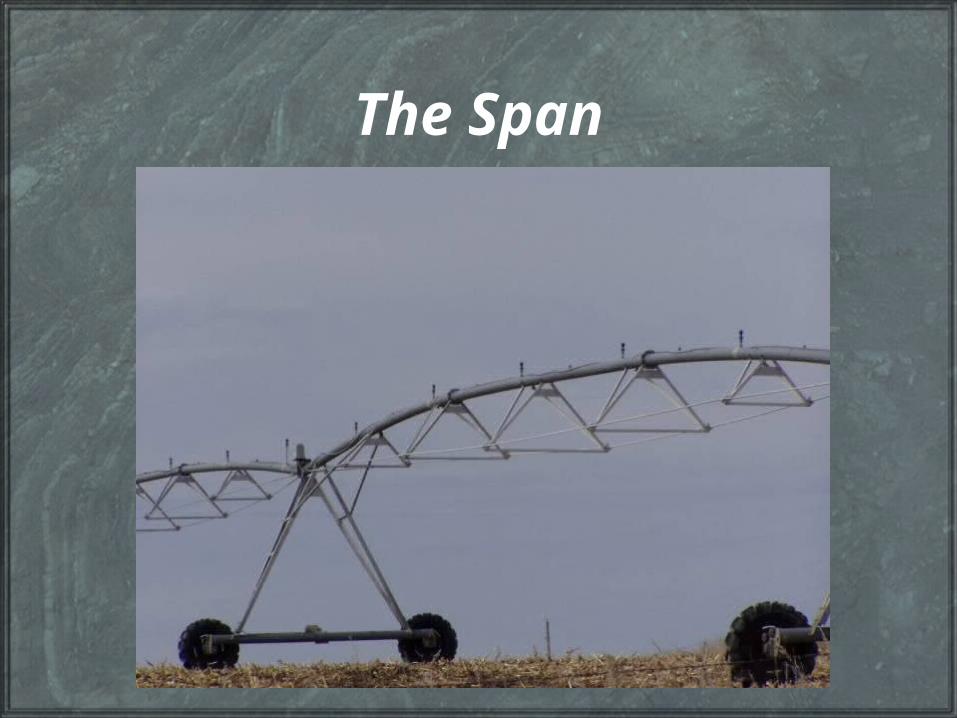
The Span
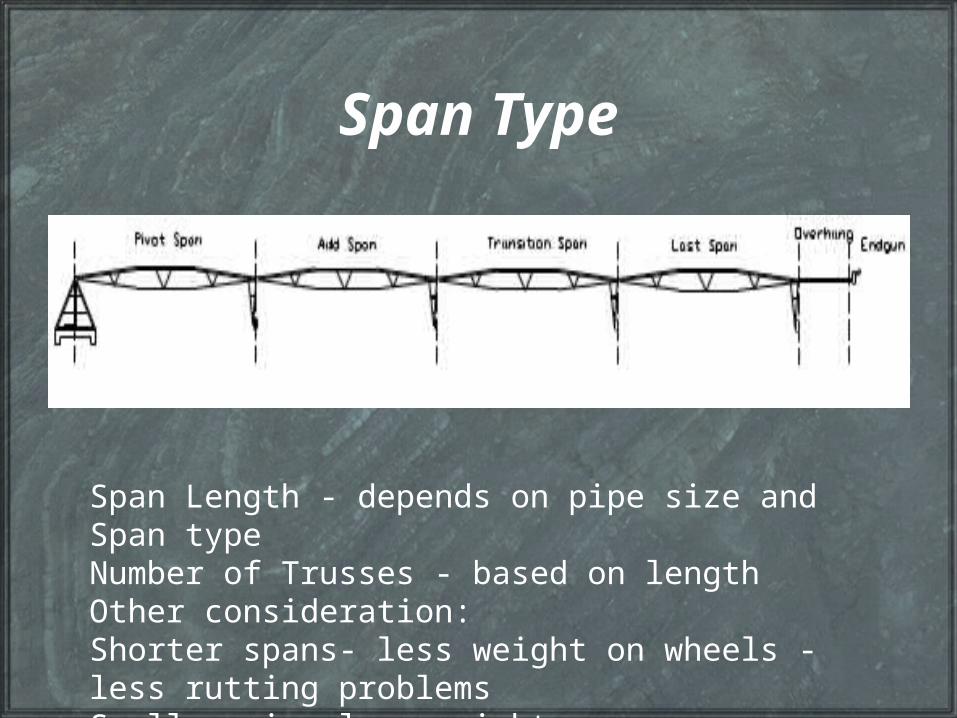
Span Type
Span Length - depends on pipe size and Span typeNumber of Trusses - based on lengthOther consideration: Shorter spans- less weight on wheels - less rutting problemsSmaller pipe less weight
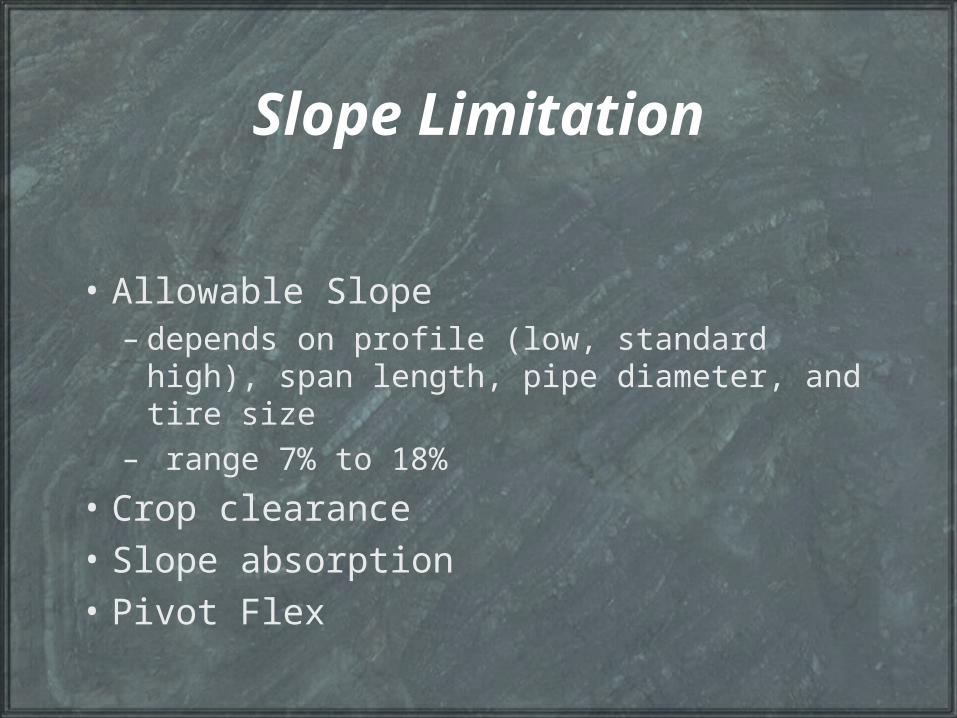
Slope Limitation
• Allowable Slope– depends on profile (low, standard high),
span length, pipe diameter, and tire size – range 7% to 18%
• Crop clearance
• Slope absorption
• Pivot Flex
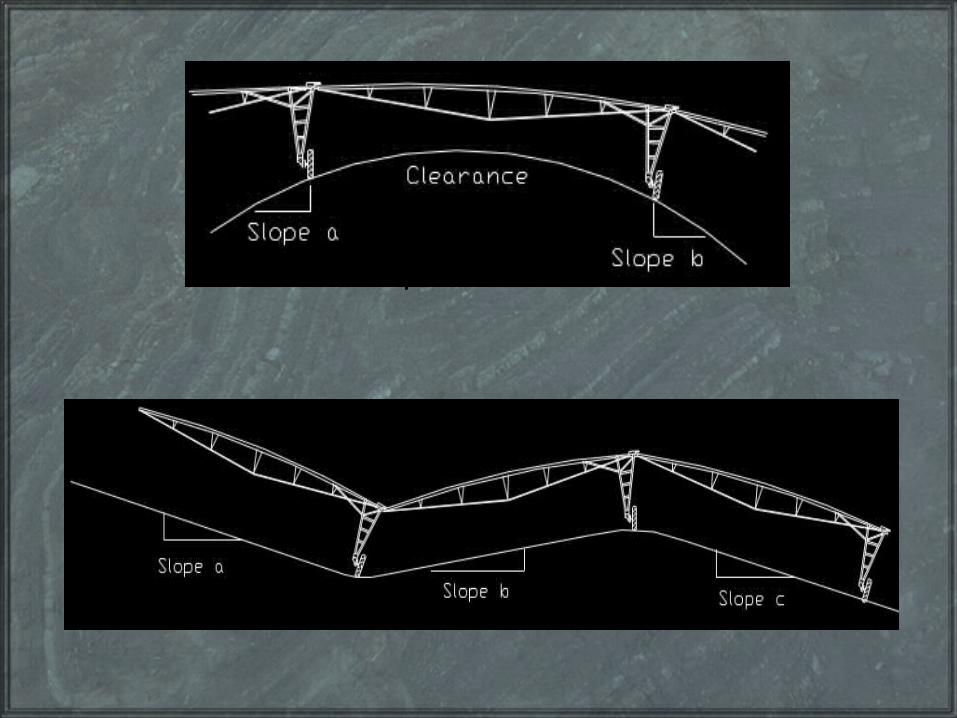
Slope Adsorption
Crop Clearance
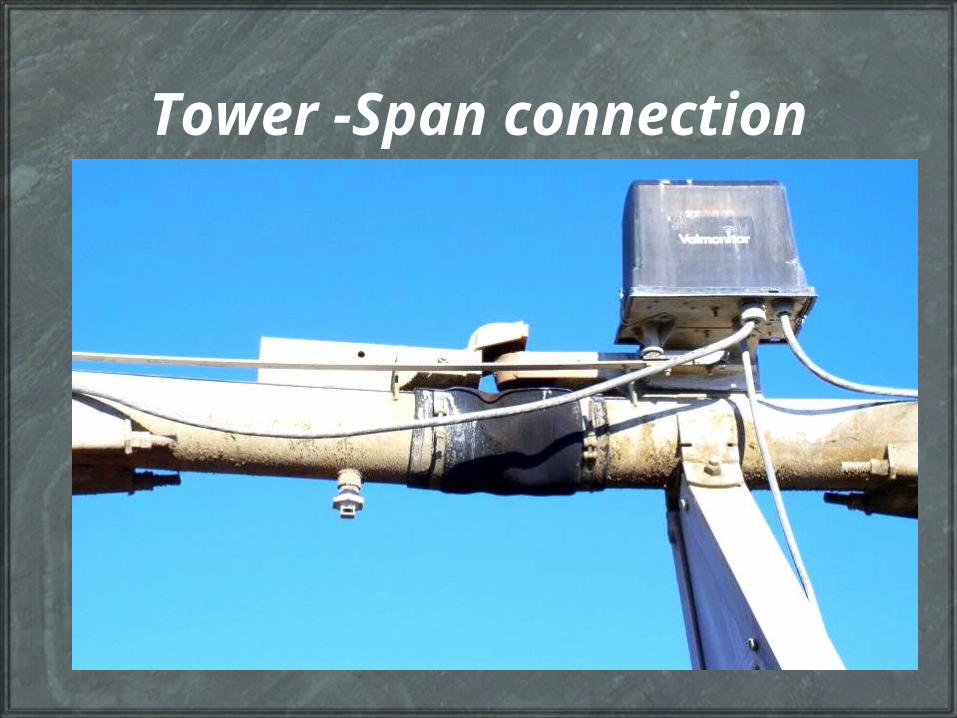
Tower -Span connection
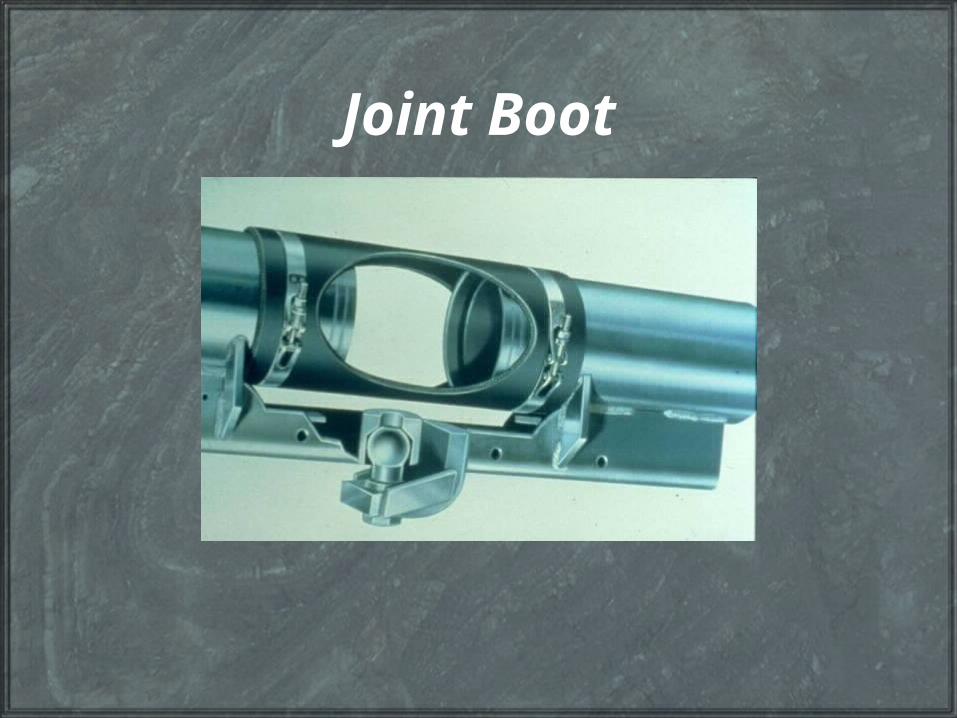
Joint Boot

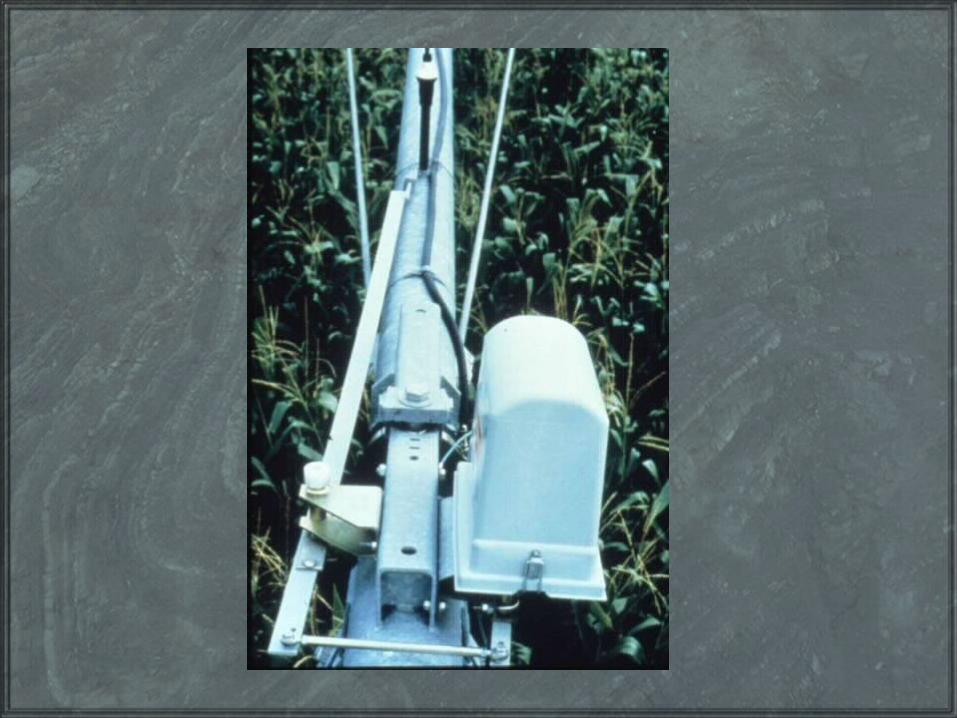
Span Alignment
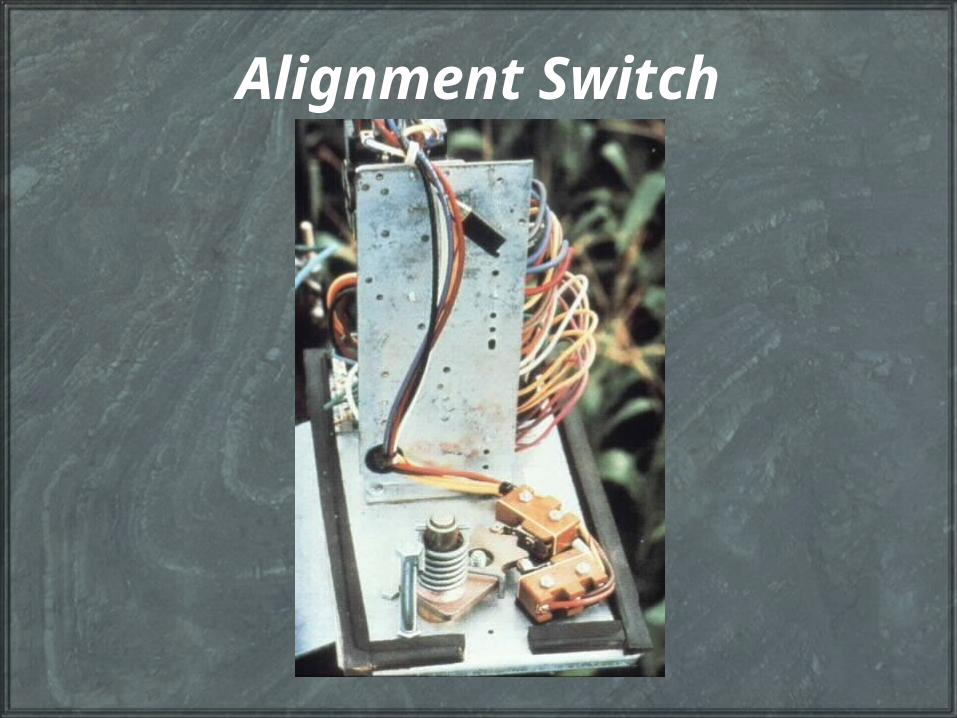
Alignment Switch
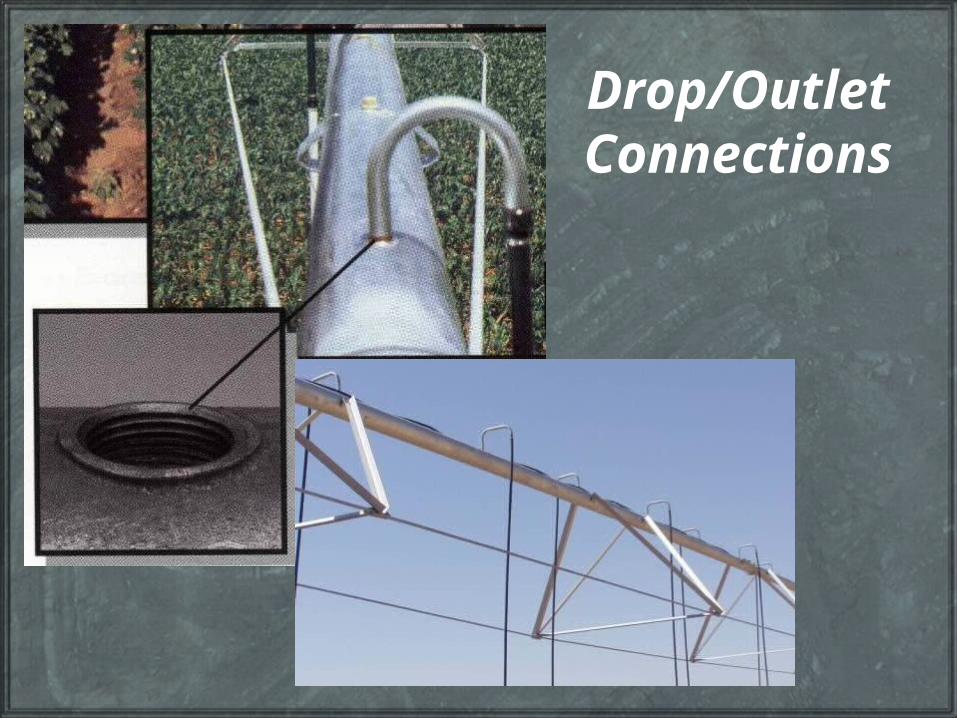
Drop/Outlet Connections
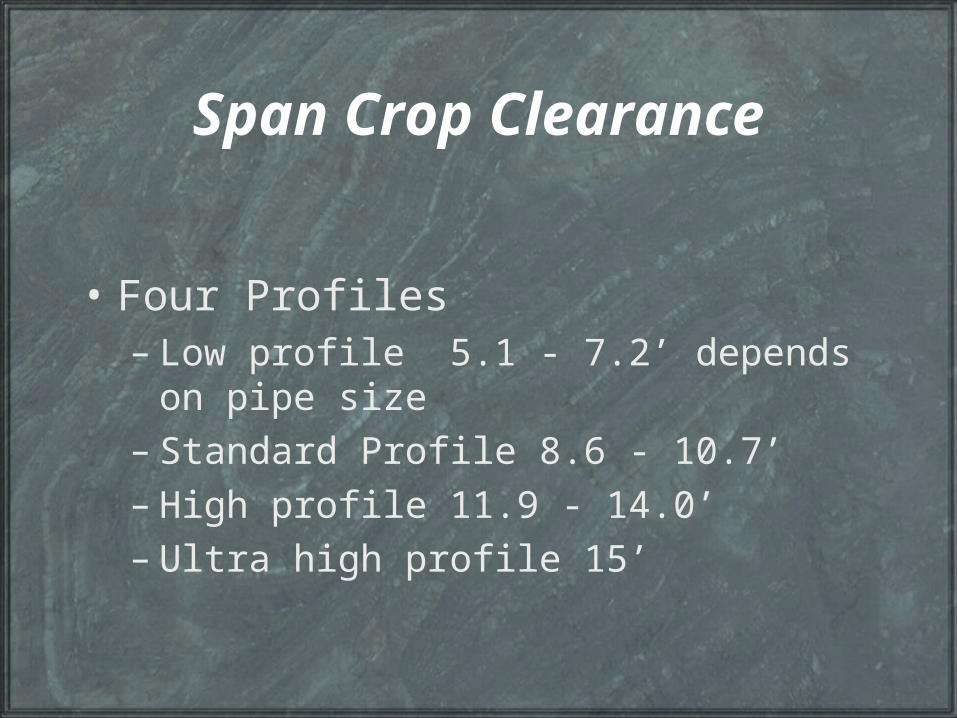
Span Crop Clearance
• Four Profiles– Low profile 5.1 - 7.2’ depends on pipe size– Standard Profile 8.6 - 10.7’– High profile 11.9 - 14.0’– Ultra high profile 15’

High profile with sugar cane
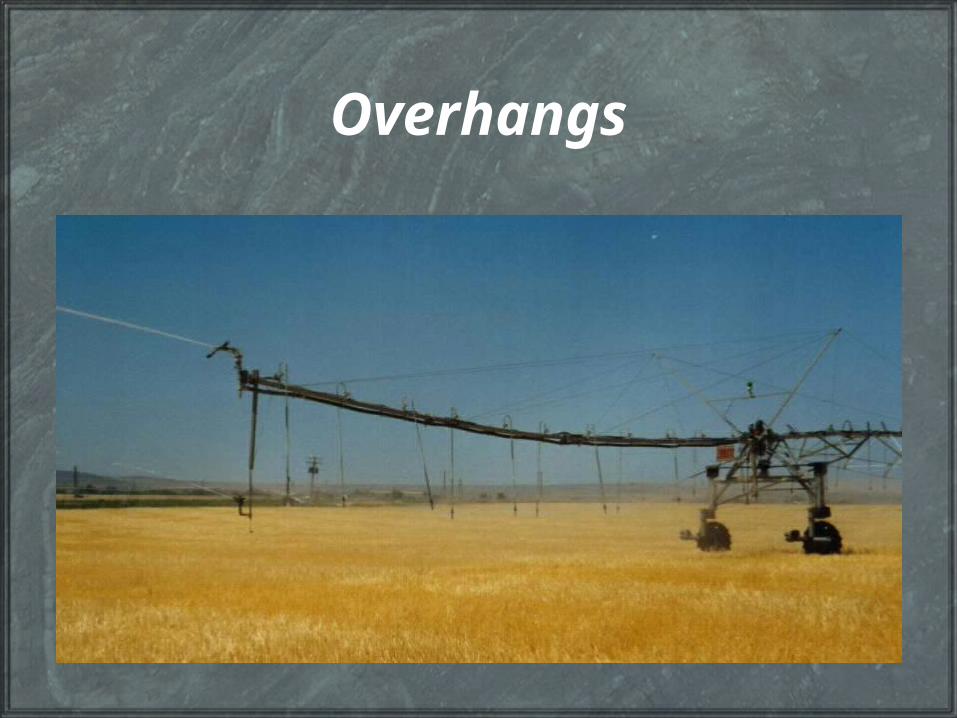
Overhangs

Overhang Length
• Depends some what on pipe size– 18.1 - 82.3 ft– And manufacture
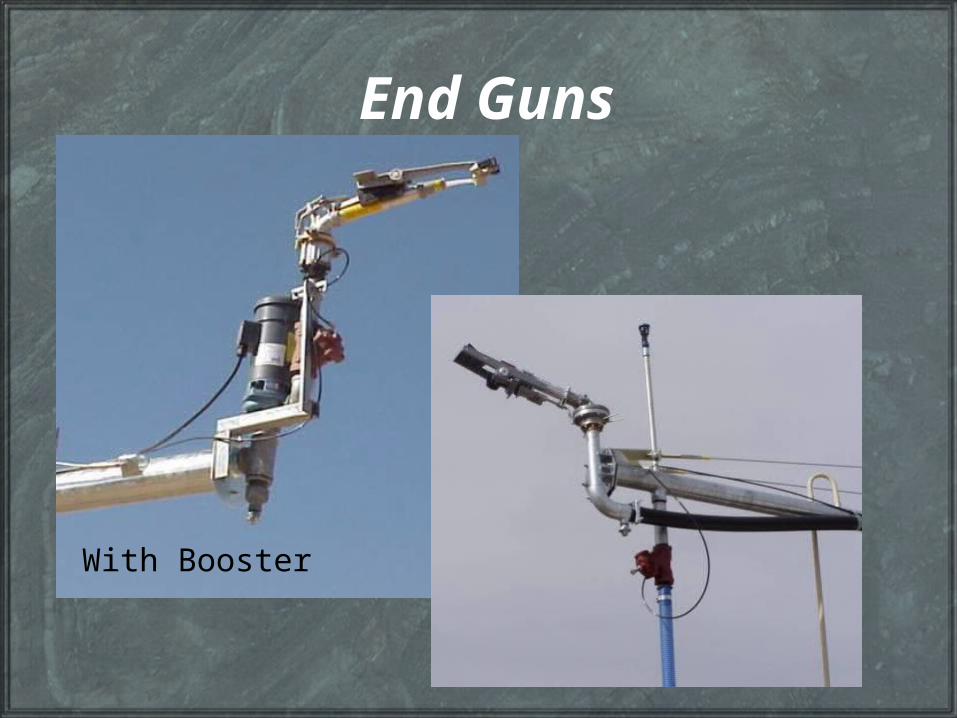
End Guns
With Booster
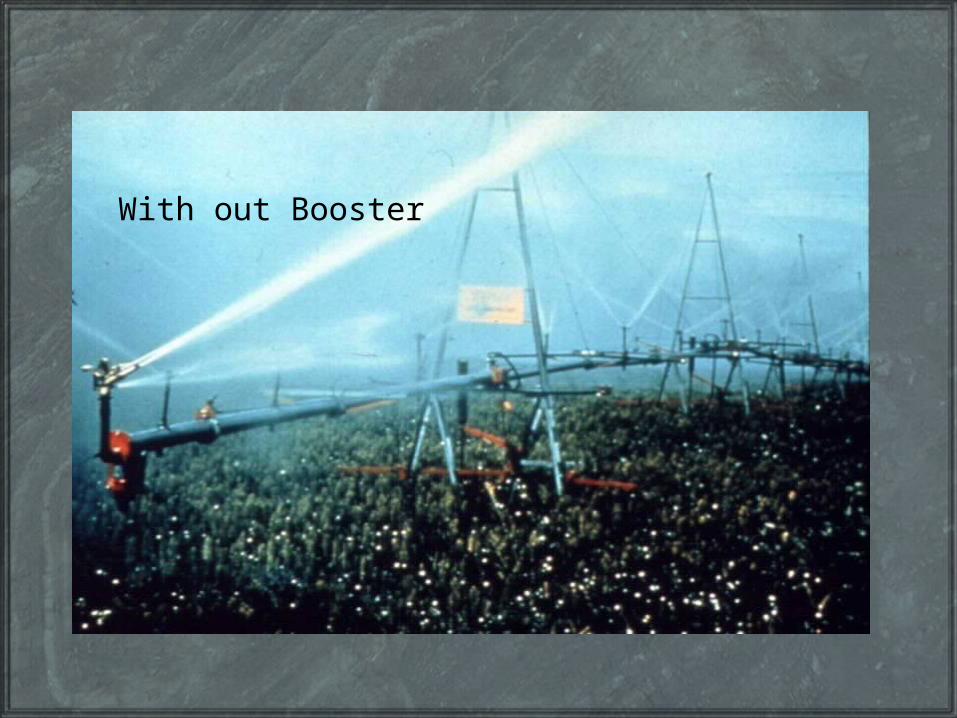
With out Booster

Corner System
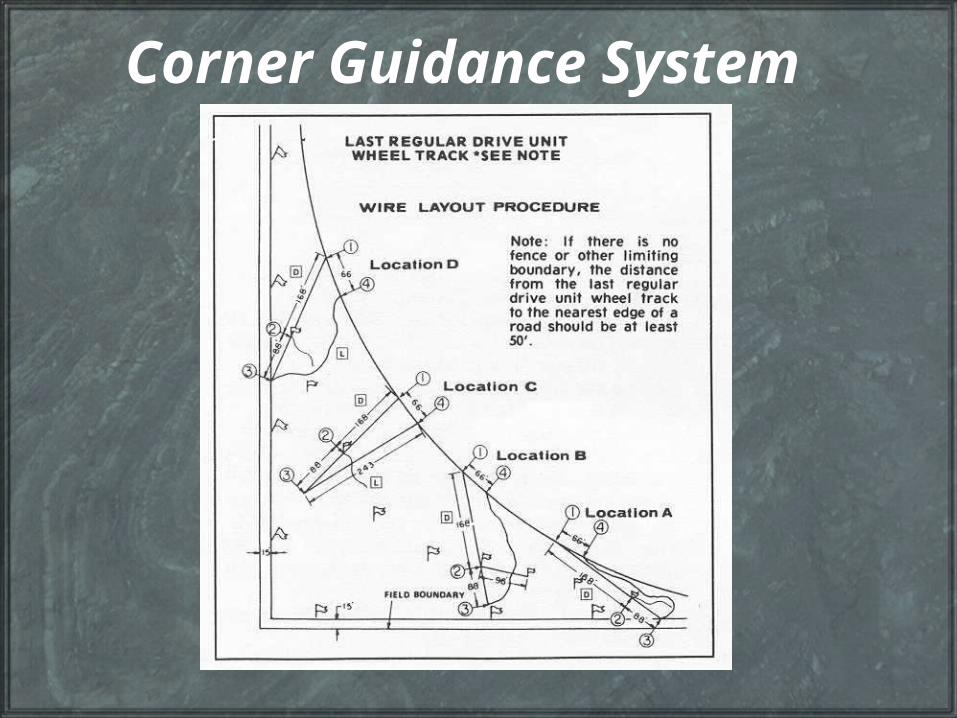
Corner Guidance System
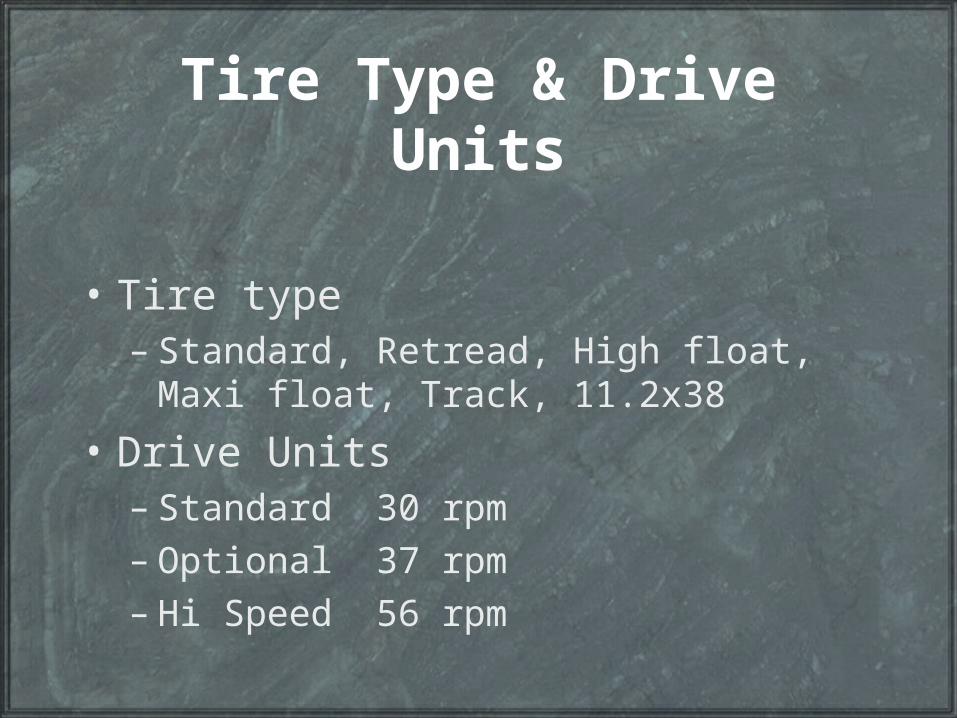
Tire Type & Drive Units
• Tire type – Standard, Retread, High float, Maxi float,
Track, 11.2x38
• Drive Units– Standard 30 rpm– Optional 37 rpm– Hi Speed 56 rpm
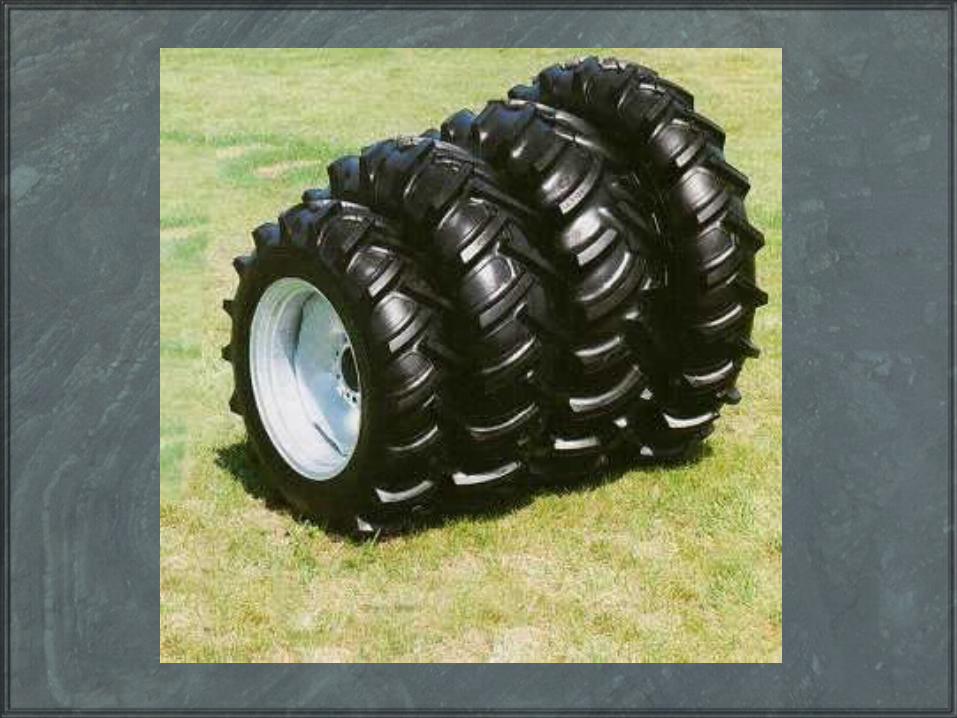
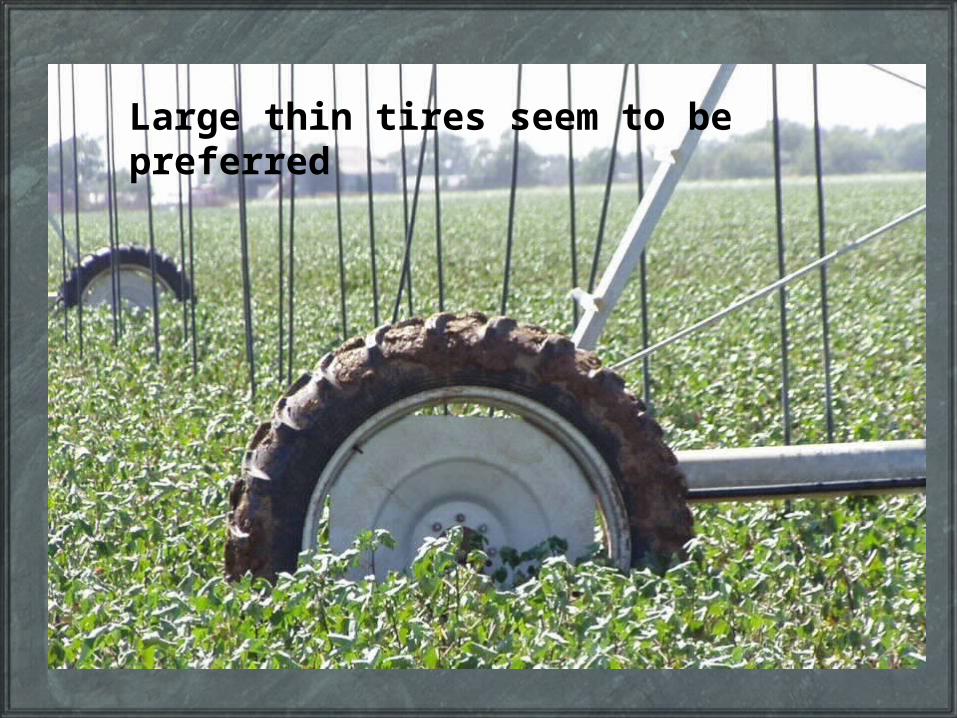
Large thin tires seem to be preferred
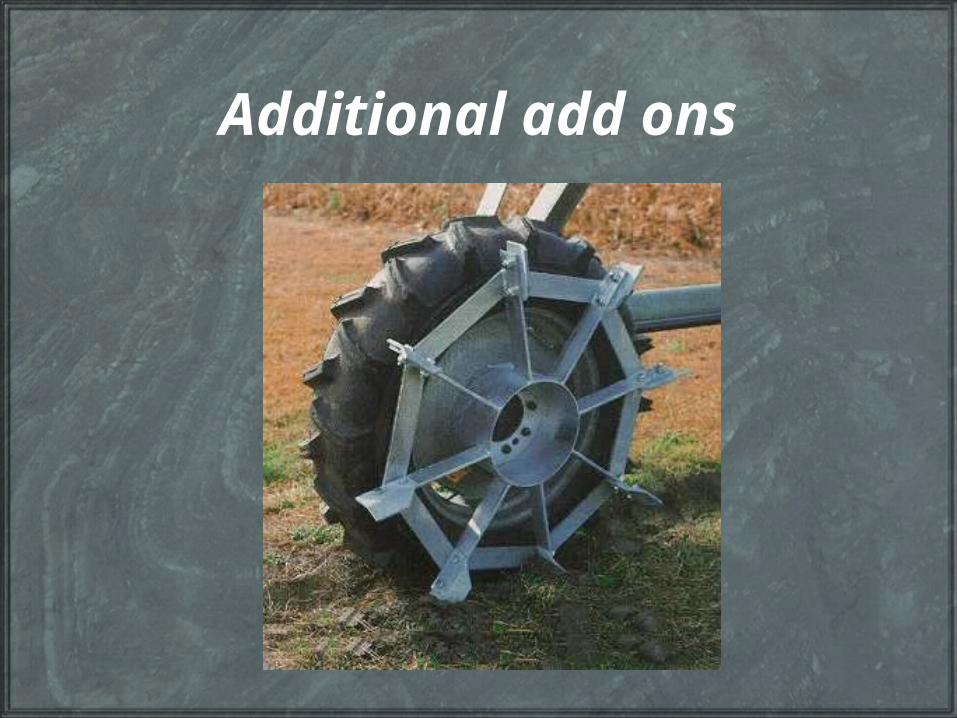
Additional add ons
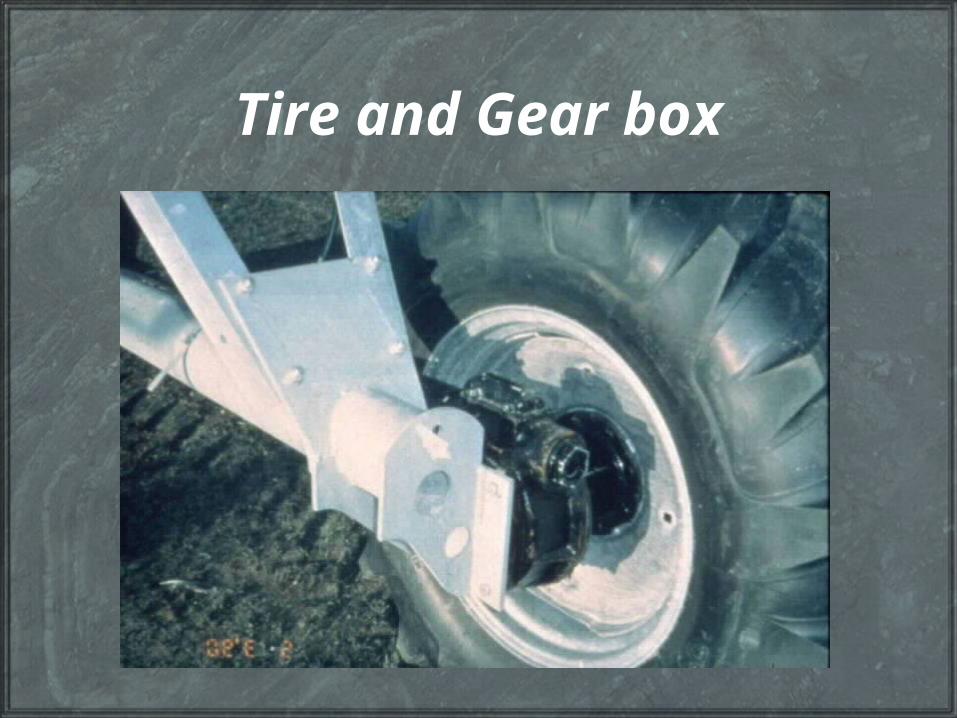
Tire and Gear box

Motor and Driveline
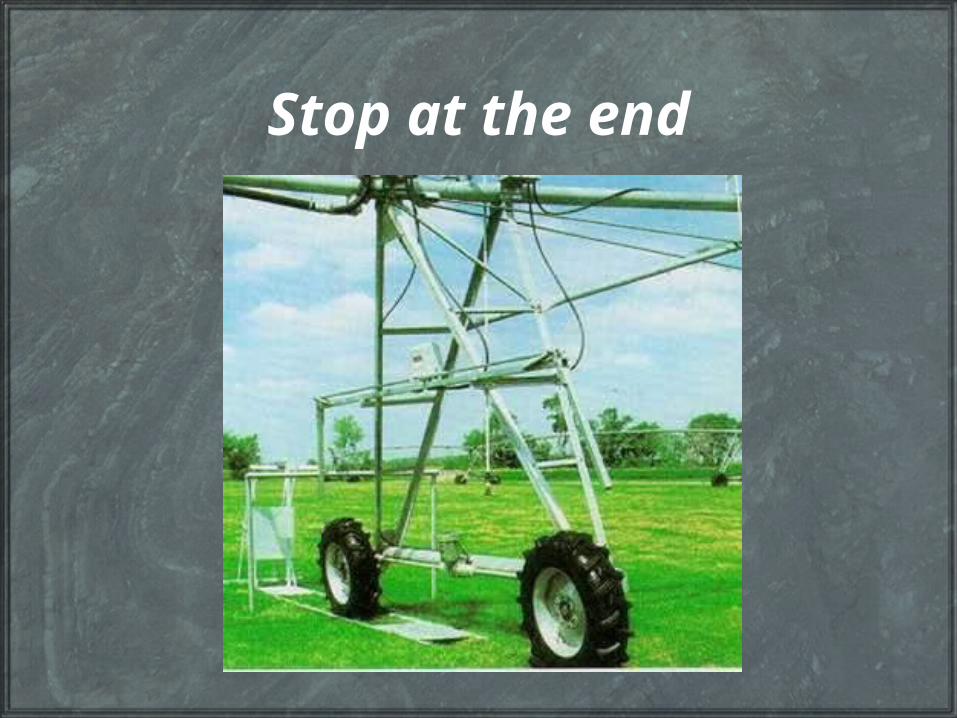
Stop at the end

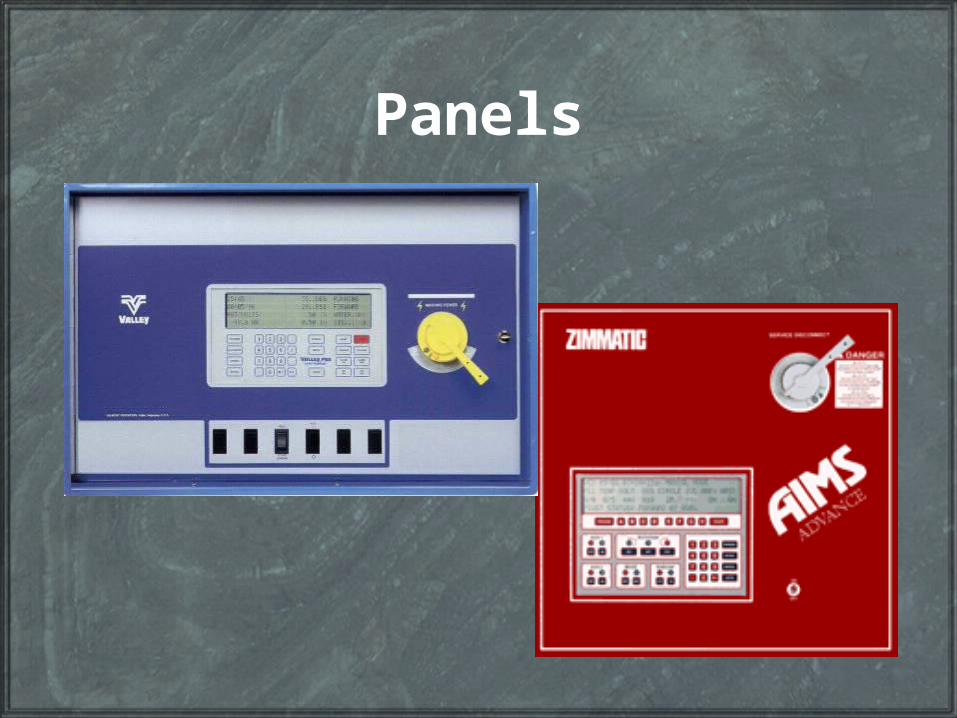
Panels

Remote control
Options & Accessories• Pivot Flex• Booster Transformer• 45 amp package• Drive unit fuse packages• Automatic Reverse• Pivot stop-in-slot• Auxiliary control ( for controlling other electrical devices)• Automatic end gun shutoff• End gun override• Remote panel mount• End-of-field stop• Low pressure shut-offs• High voltage surge protection• Phase loss protection• Slow down timer• Low voltage monitor• Modified alignment• Flow Meter• Check Valve

Options continued• Automatic rain shut-off
• Severe duty gearboxes
• Heavy duty pivot
• Hydraulic system control
• High or low profile
• High speed motors
• Motor covers
• Traction rim
• Drops - steel, PVC, flexible hose
• Dry wheel track packages
• End guns
• Booster pumps

Water requirements - System flow rate
What influences the System Flow rate?
• Area irrigated• Crop requirement• Climatic Conditions• Soil type• Terrain• Efficiency• Leaching, germination, pre-water, harvest• Treat Pivot, end gun, and corner systems as separate
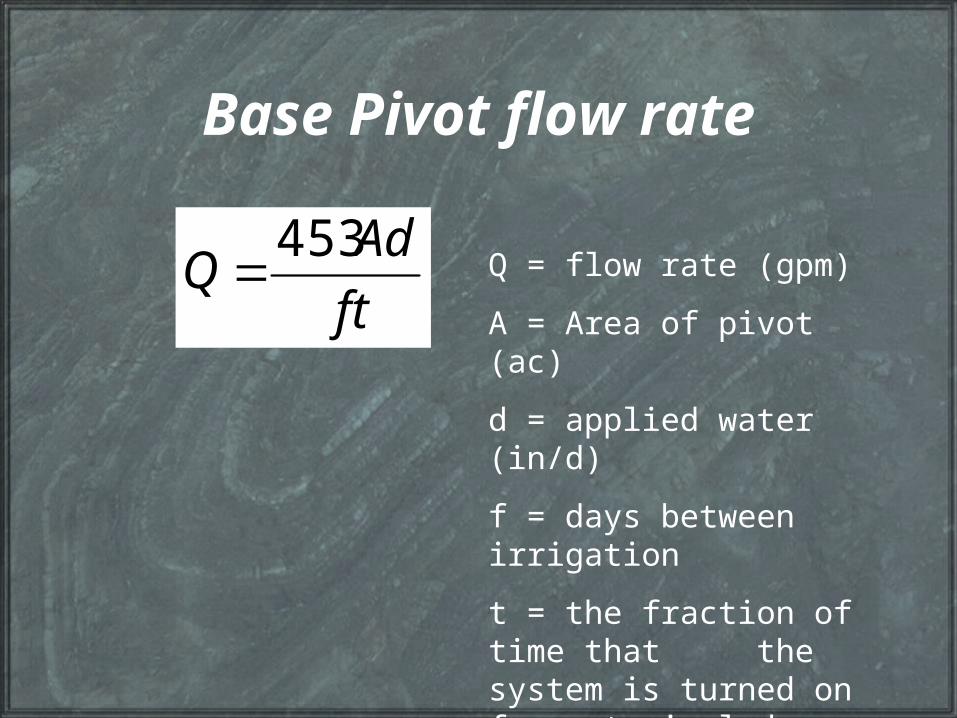
Base Pivot flow rate
ft
AdQ
453 Q = flow rate (gpm)
A = Area of pivot (ac)
d = applied water (in/d)
f = days between irrigation
t = the fraction of time that the system is turned on for a typical day
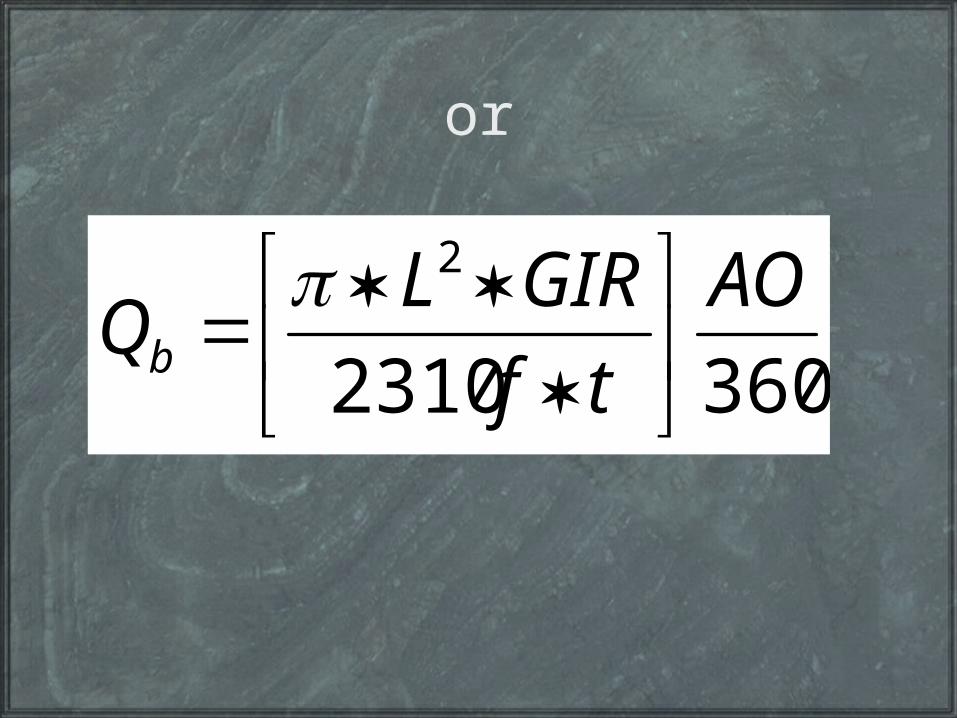
or
3602310
2 AO
tf
GIRLQb
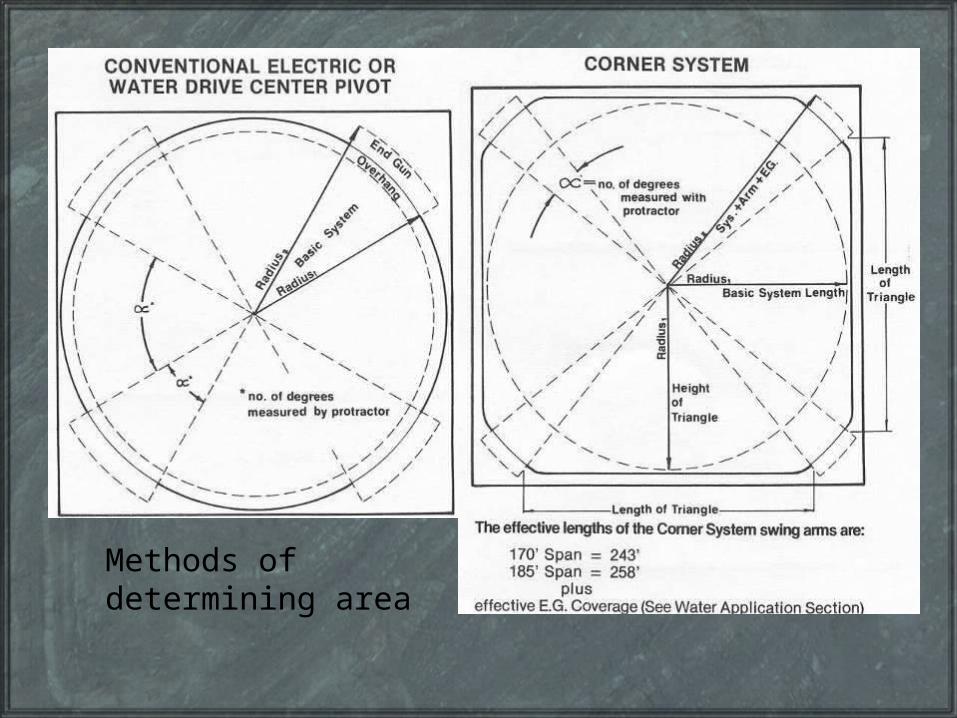
Methods of determining area
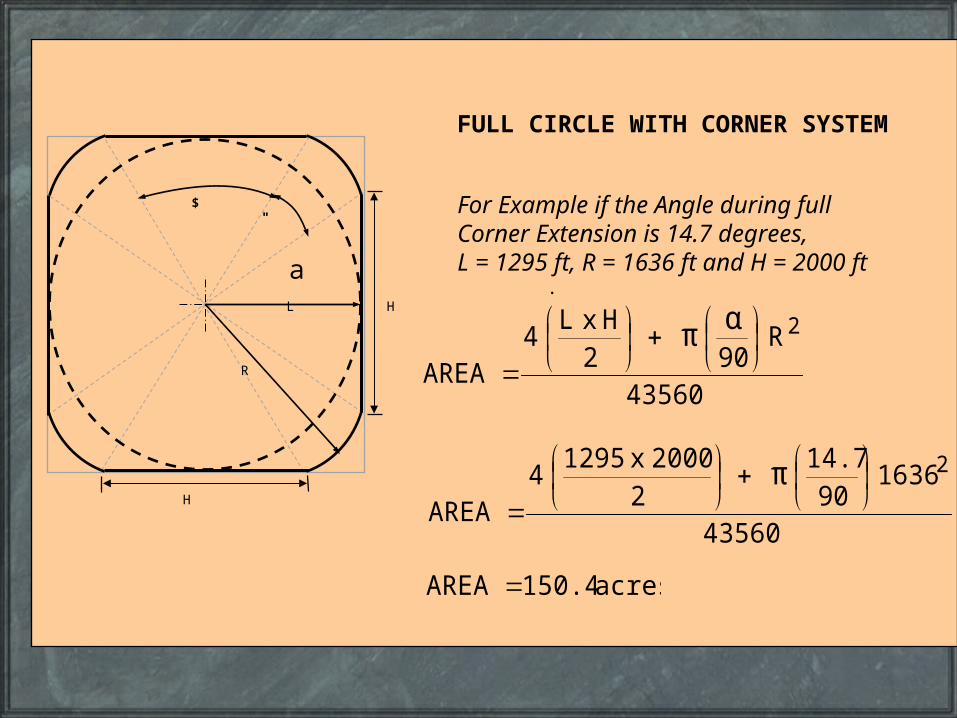
FULL CIRCLE WITH CORNER SYSTEM
"
L
R
$
H
H
For Example if the Angle during full Corner Extension is 14.7 degrees, L = 1295 ft, R = 1636 ft and H = 2000 ft .
43560
R902
HxL4
AREA
2
απ
acres150.4AREA
43560
163690
14.72
2000x12954
AREA
2
π
a
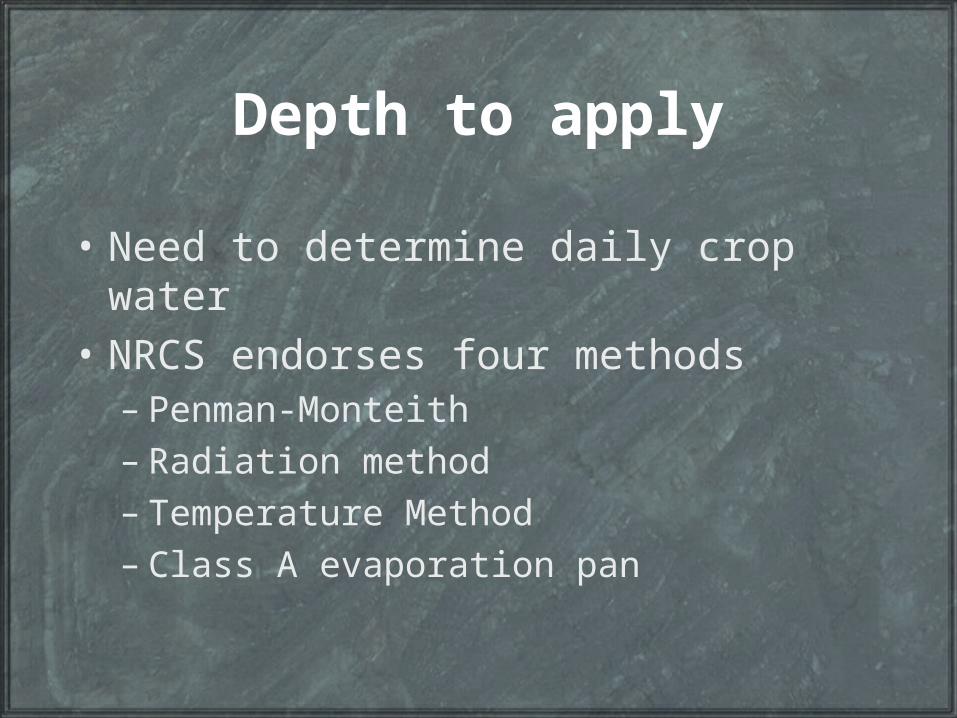
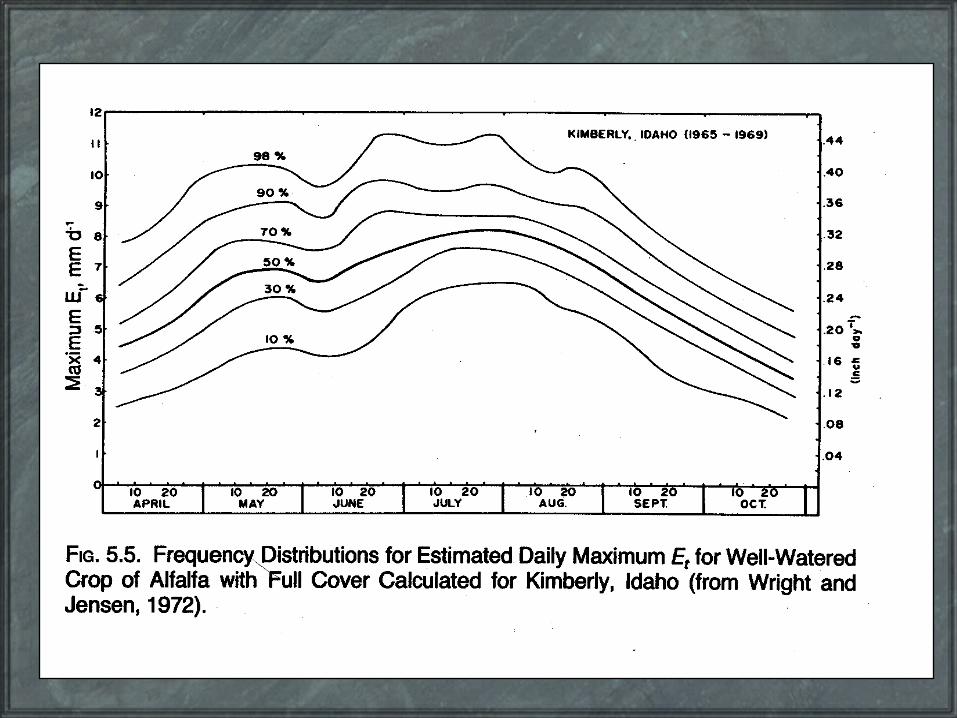
Depth to apply
• Need to determine daily crop water
• NRCS endorses four methods– Penman-Monteith– Radiation method– Temperature Method– Class A evaporation pan
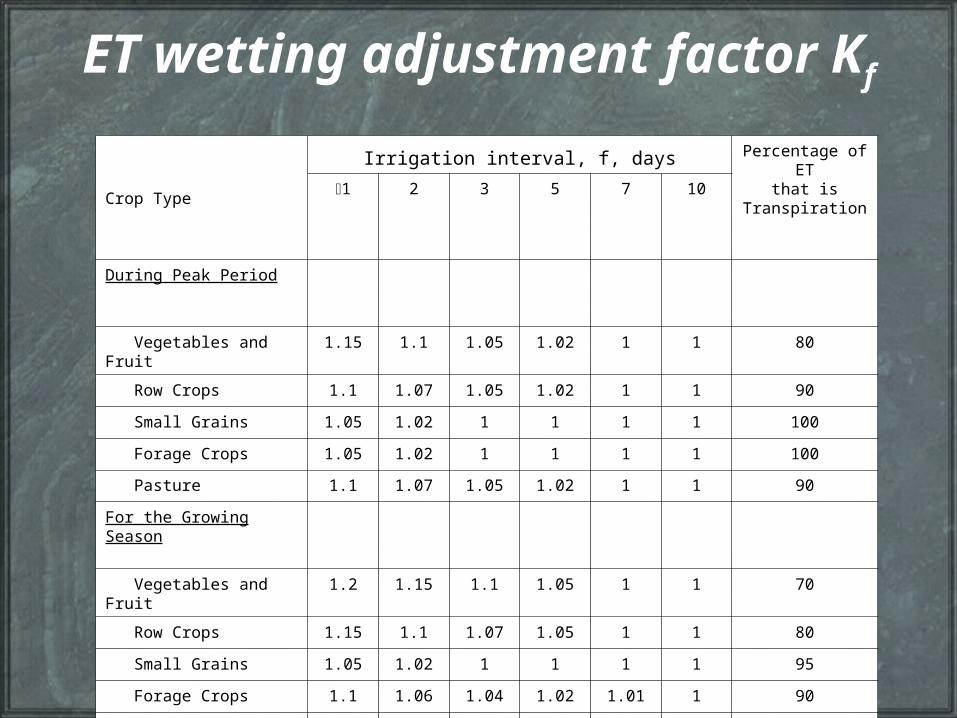
ET wetting adjustment factor Kf
Crop Type
Irrigation interval, f, days Percentage of ETthat is
Transpiration1 2 3 5 7 10
During Peak Period
Vegetables and Fruit 1.15 1.1 1.05 1.02 1 1 80
Row Crops 1.1 1.07 1.05 1.02 1 1 90
Small Grains 1.05 1.02 1 1 1 1 100
Forage Crops 1.05 1.02 1 1 1 1 100
Pasture 1.1 1.07 1.05 1.02 1 1 90
For the Growing Season
Vegetables and Fruit 1.2 1.15 1.1 1.05 1 1 70
Row Crops 1.15 1.1 1.07 1.05 1 1 80
Small Grains 1.05 1.02 1 1 1 1 95
Forage Crops 1.1 1.06 1.04 1.02 1.01 1 90
Pasture 1.2 1.15 1.1 1.05 1.03 1 80
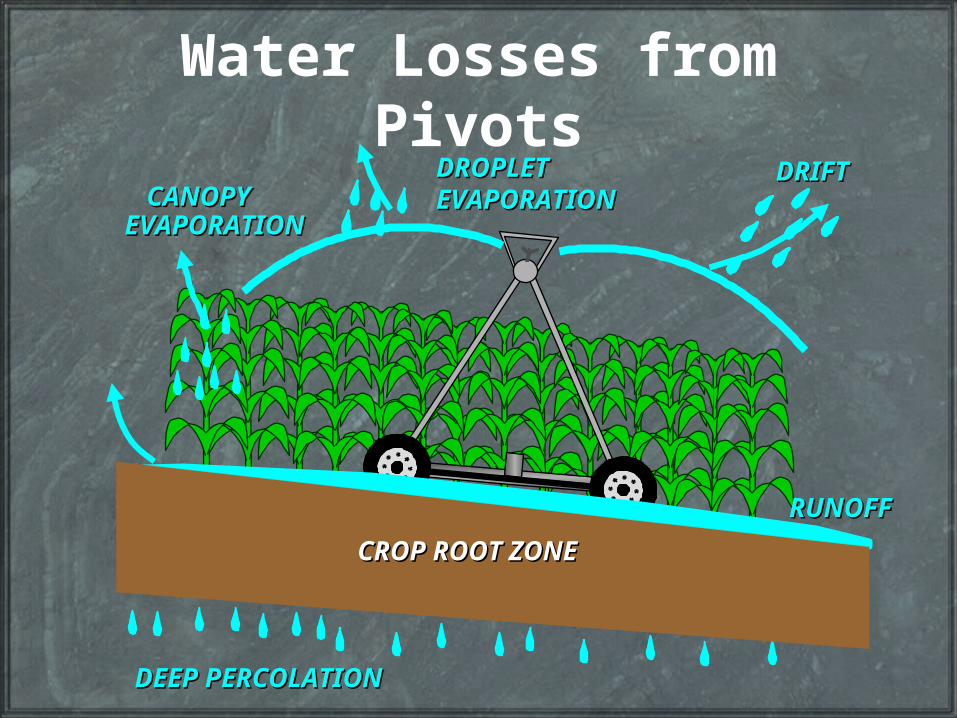
Water Losses from PivotsDRIFTDRIFTDROPLETDROPLET
EVAPORATIONEVAPORATIONCANOPYCANOPYEVAPORATIONEVAPORATION
RUNOFFRUNOFF
DEEP PERCOLATIONDEEP PERCOLATION
CROP ROOT ZONECROP ROOT ZONE

Losses/Application efficiencies
• Losses generally range between 5-20%
• Most accepted range is 5-10%

d or GIR value determined by
100%
1loss
PKET efcGross peak daily depth =
t value
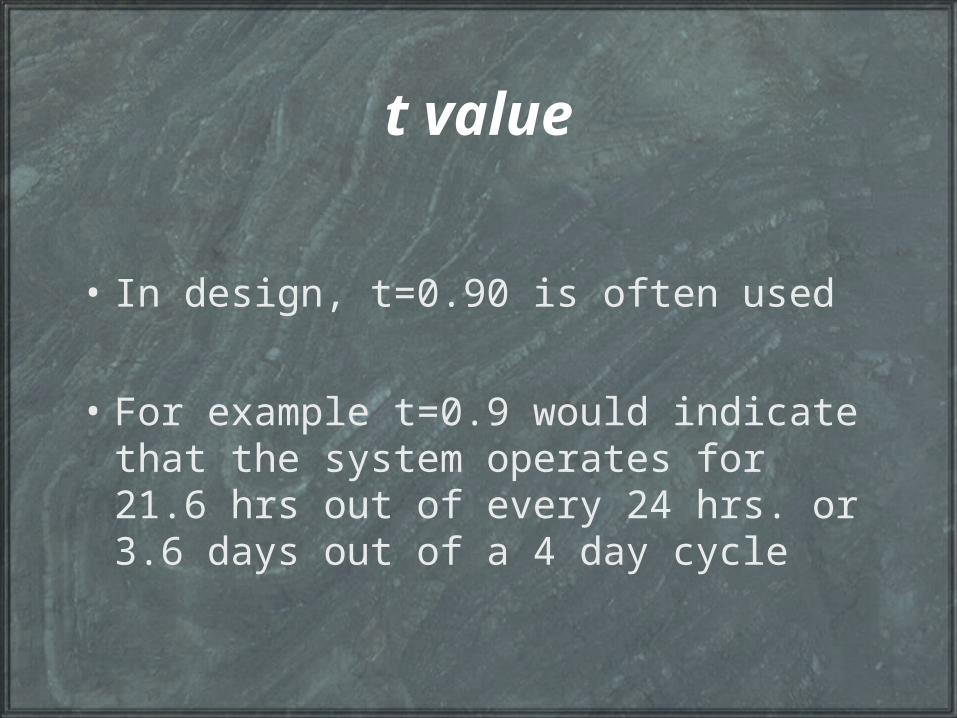
• In design, t=0.90 is often used
• For example t=0.9 would indicate that the system operates for 21.6 hrs out of every 24 hrs. or 3.6 days out of a 4 day cycle
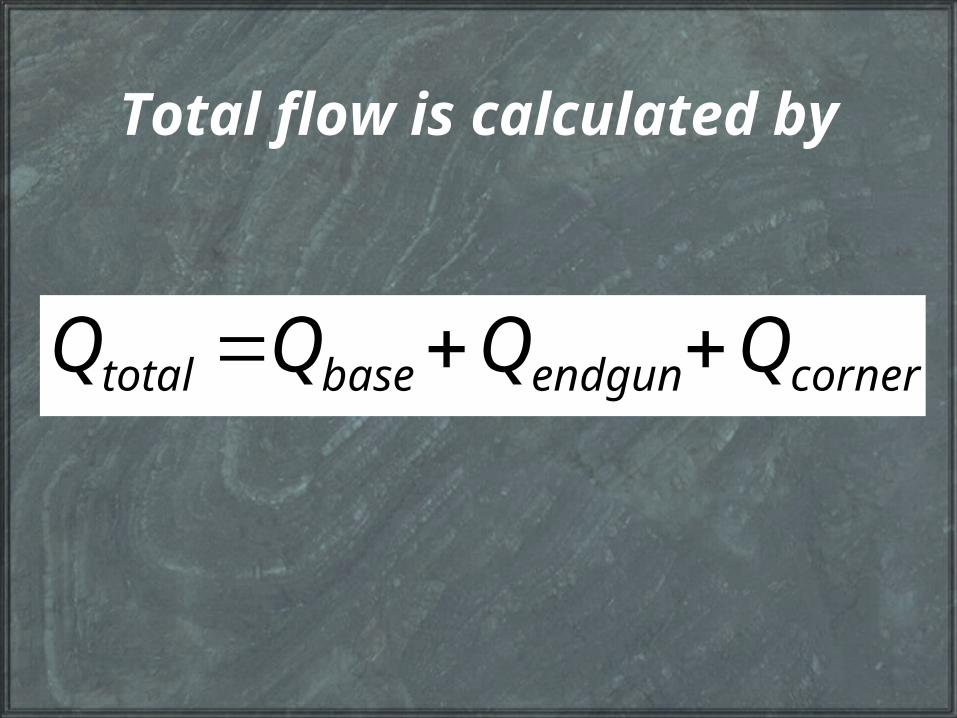
Total flow is calculated by
cornerendgunbasetotal QQQQ
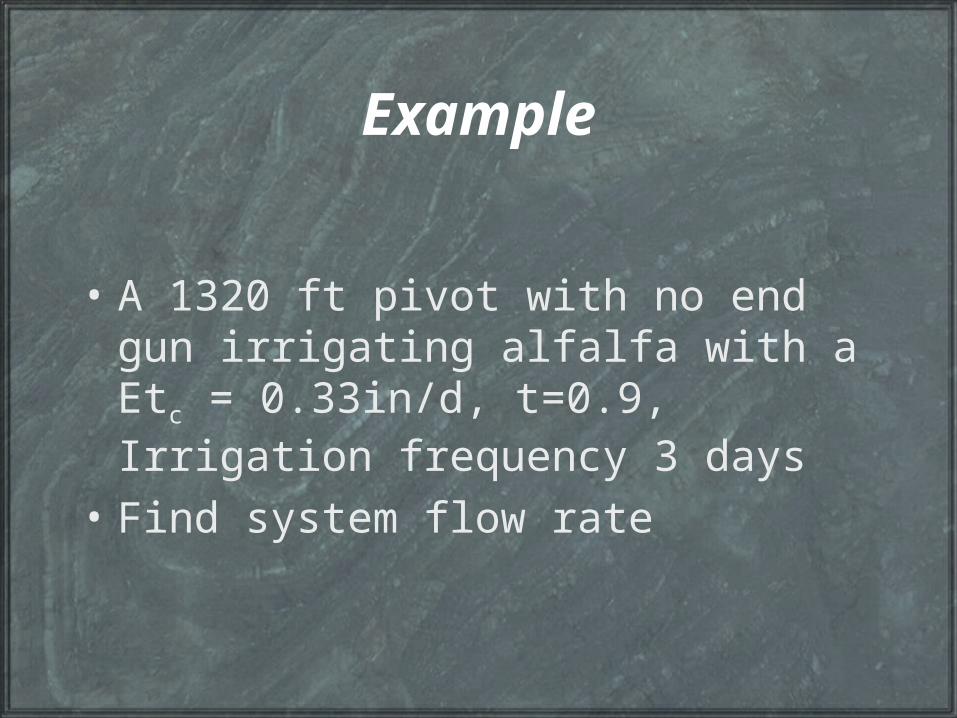
Example
• A 1320 ft pivot with no end gun irrigating alfalfa with a Etc = 0.33in/d, t=0.9, Irrigation frequency 3 days
• Find system flow rate
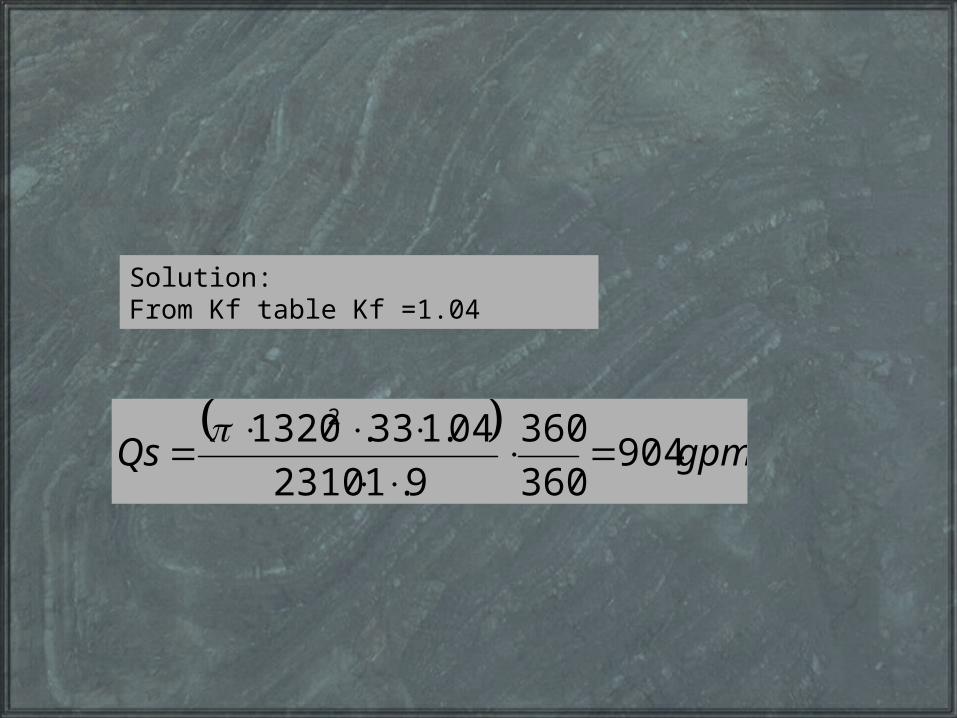
gpmQs 904
360
360
9.12310
04.133.13202
Solution:From Kf table Kf =1.04
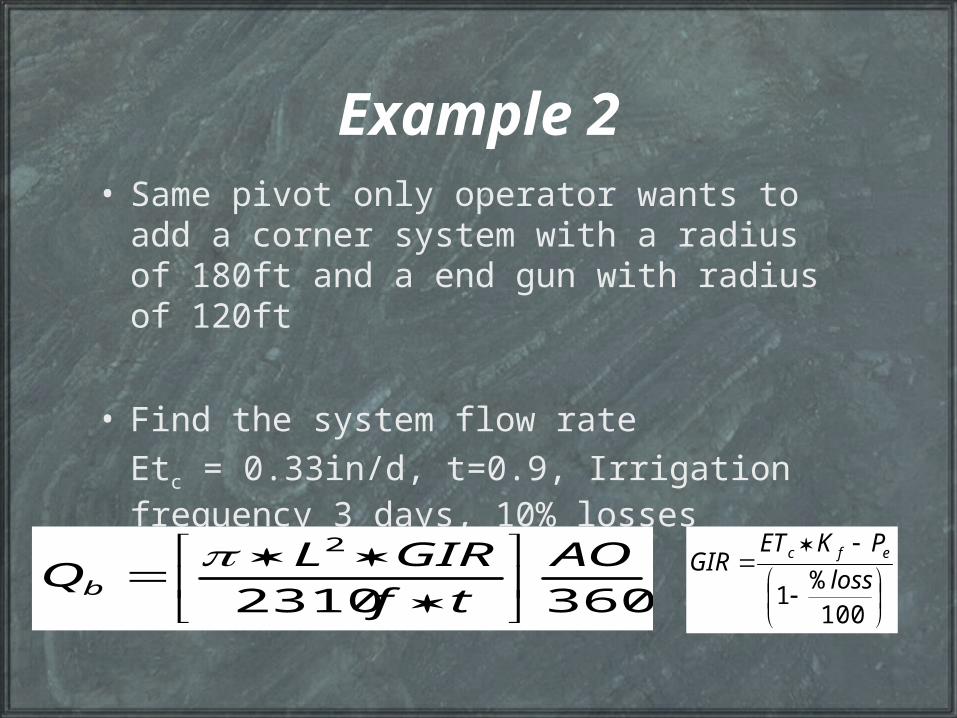
Example 2• Same pivot only operator wants to add a
corner system with a radius of 180ft and a end gun with radius of 120ft
• Find the system flow rate
Etc = 0.33in/d, t=0.9, Irrigation frequency 3 days, 10% losses
100%
1loss
PKETGIR efc
3602310
2 AO
tf
GIRLQb
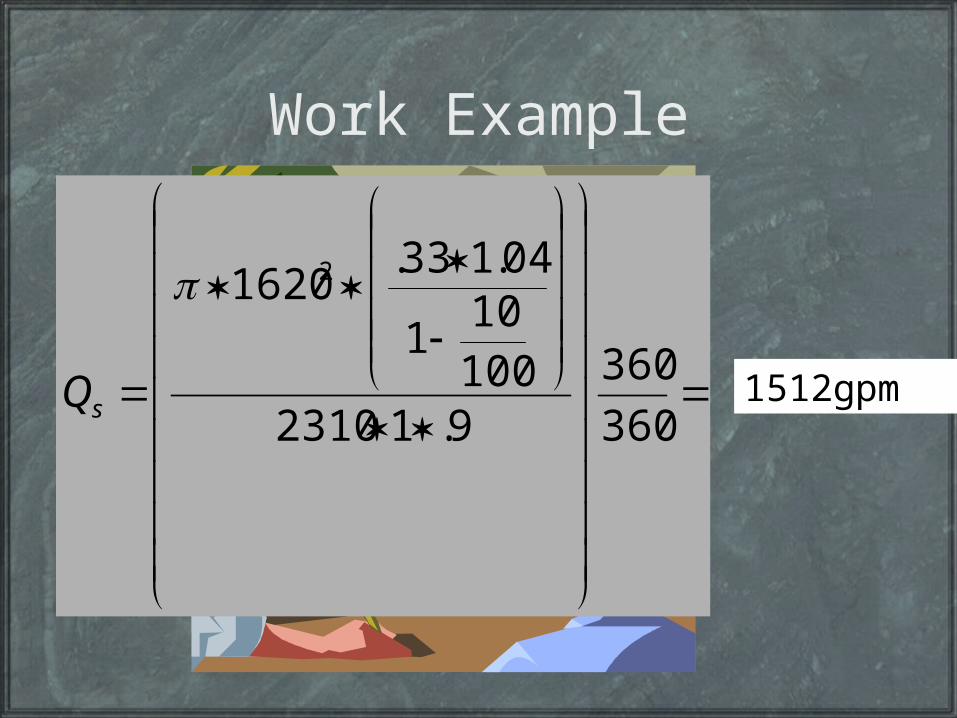
Work Example
360
360
9.1231010010
1
04.133.16202
sQ 1512gpm
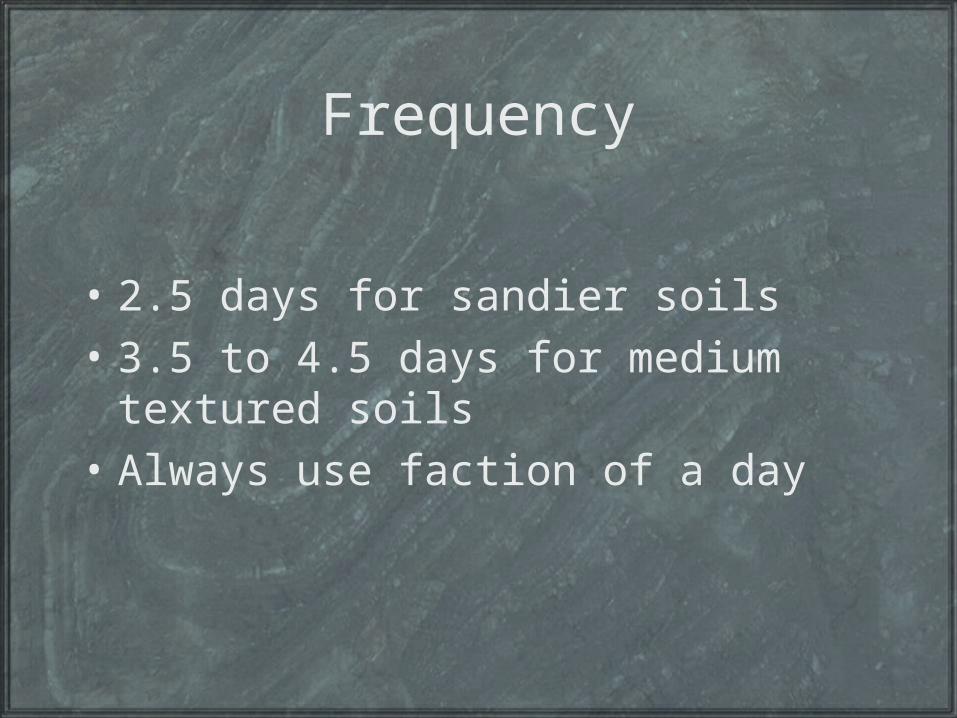
Frequency
• 2.5 days for sandier soils
• 3.5 to 4.5 days for medium textured soils
• Always use faction of a day
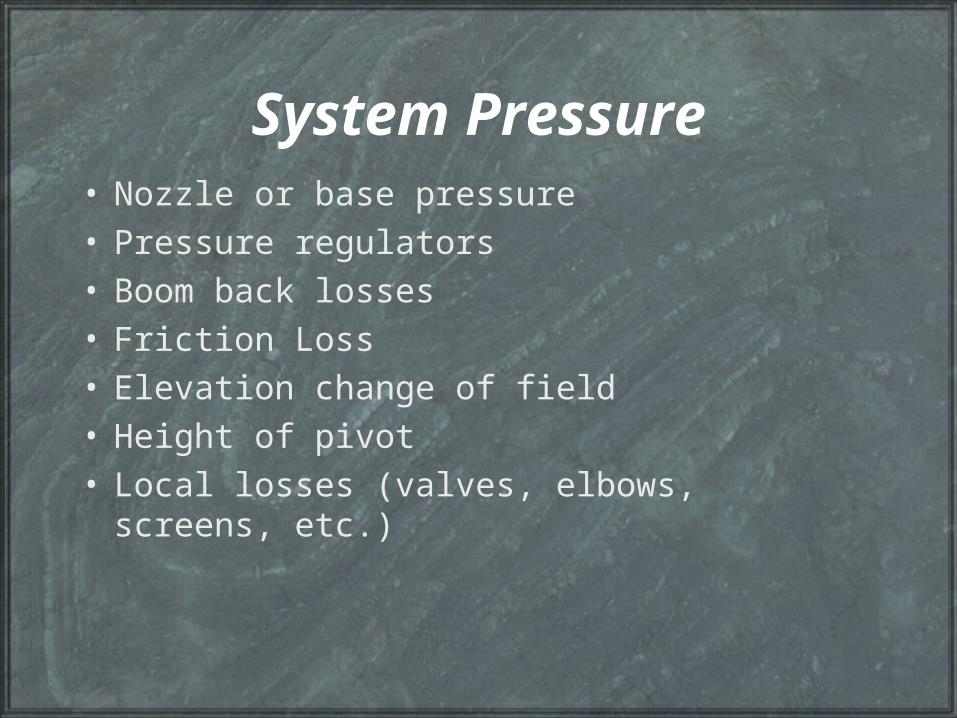
System Pressure• Nozzle or base pressure• Pressure regulators • Boom back losses • Friction Loss • Elevation change of field• Height of pivot• Local losses (valves, elbows, screens, etc.)
Base pressure
• Use operating pressure of nozzle obtained from manufacture literature
• If Pressure regulators are used, the base pressure of the regulator
Pressure Regulators
• Regulators have hysteresis• Regulators have friction losses
• For design use 5psi over the threshold pressure
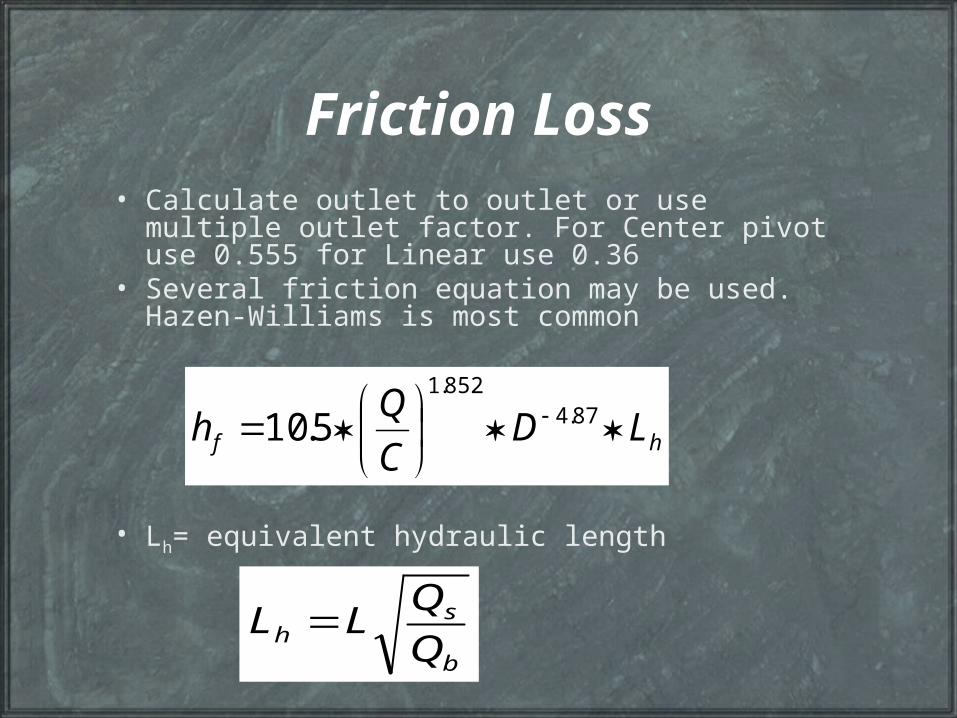
Friction Loss• Calculate outlet to outlet or use multiple outlet
factor. For Center pivot use 0.555 for Linear use 0.36
• Several friction equation may be used. Hazen-Williams is most common
• Lh= equivalent hydraulic length
hf LDC
Qh
87.4
852.1
5.10
b
sh Q
QLL
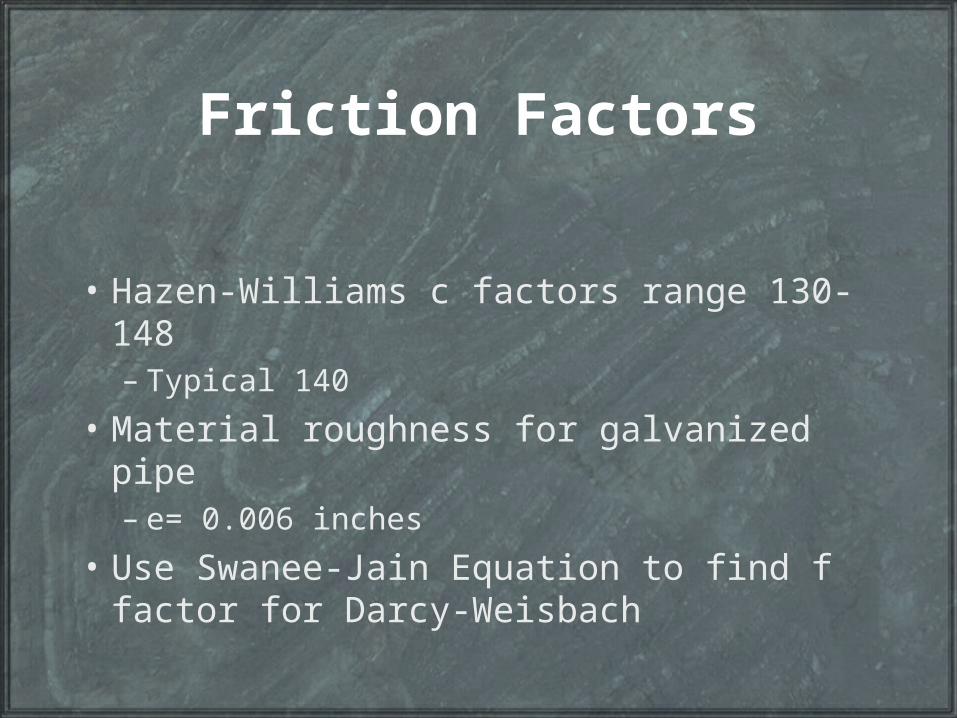
Friction Factors
• Hazen-Williams c factors range 130-148– Typical 140
• Material roughness for galvanized pipe– e= 0.006 inches
• Use Swanee-Jain Equation to find f factor for Darcy-Weisbach

Friction Loss with two pipe sizes
• where:Hf = total pipe-friction loss along the combined lateral, ft (or m)Hf smaller = total pipe-friction loss along the lateral when comprised only of the smaller pipe (from Equation 4-4 using Hf per 100 for the smaller pipe), ft (or m)Hf I-r smaller = pipe-friction loss between the pivot inlet and radial distance r for the smaller pipe (from Equation 4-9 or Figure 4-1 or Table 4-2 using Hf small), ft (or m)Hf I-r larger = pipe-friction loss between the pivot inlet and radial distance r for the larger pipe (from Equation 4-9 or Figure 4-1 or Table 4-2 using Hf large), ft (or m)r = distance from center pivot inlet to where the transition from large pipe to small pipe occurs, ft (or m)
largersmallersmaller rIfrIfff HHHH

Simplified Method
5387.4
arg 5
1
3
2
8
1511
hhherl
smallerdual L
r
L
r
L
r
D
DK
smallerfdualf HKH
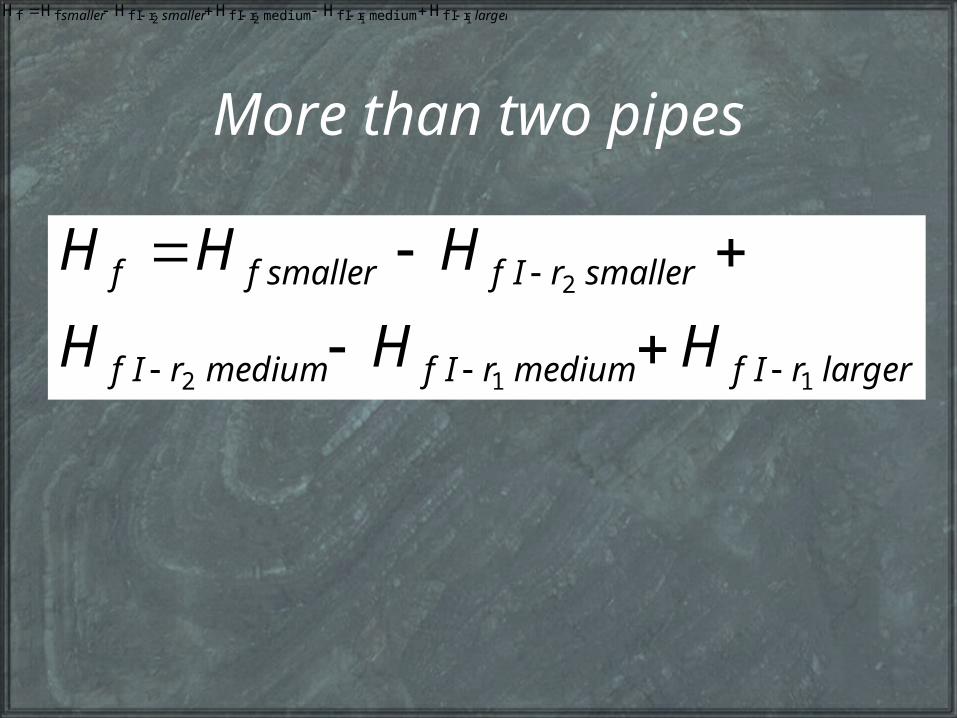
More than two pipes
largersmallersmaller 1122 rIfmediumrIfmediumrIfrIfff HHHHHH
larger
smallersmaller
112
2
rIfmediumrIfmediumrIf
rIfff
HHH
HHH

Topography
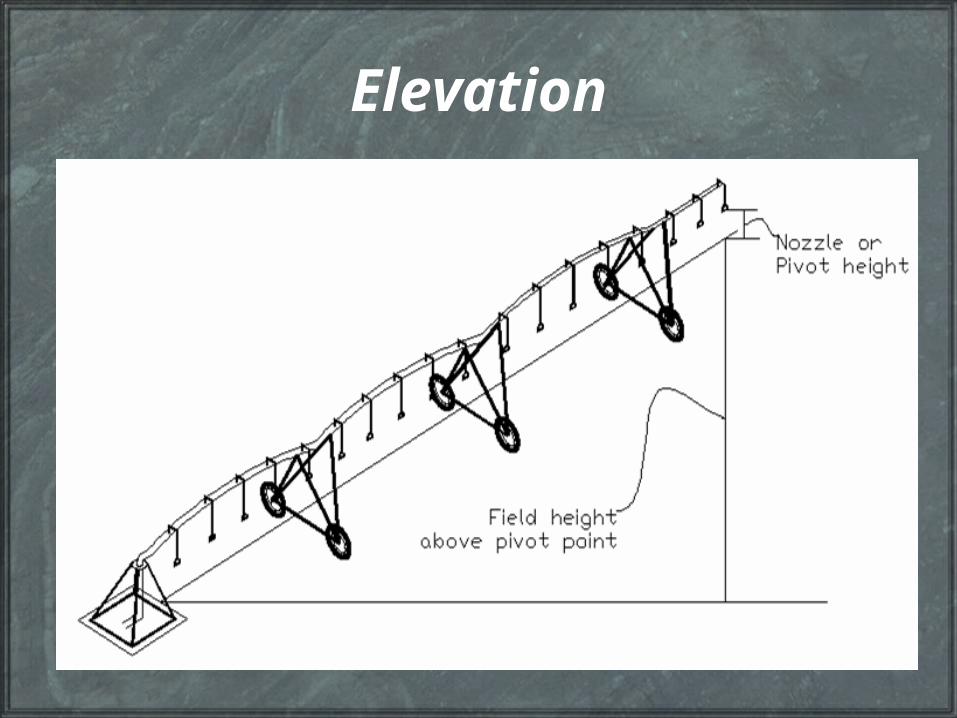
Elevation
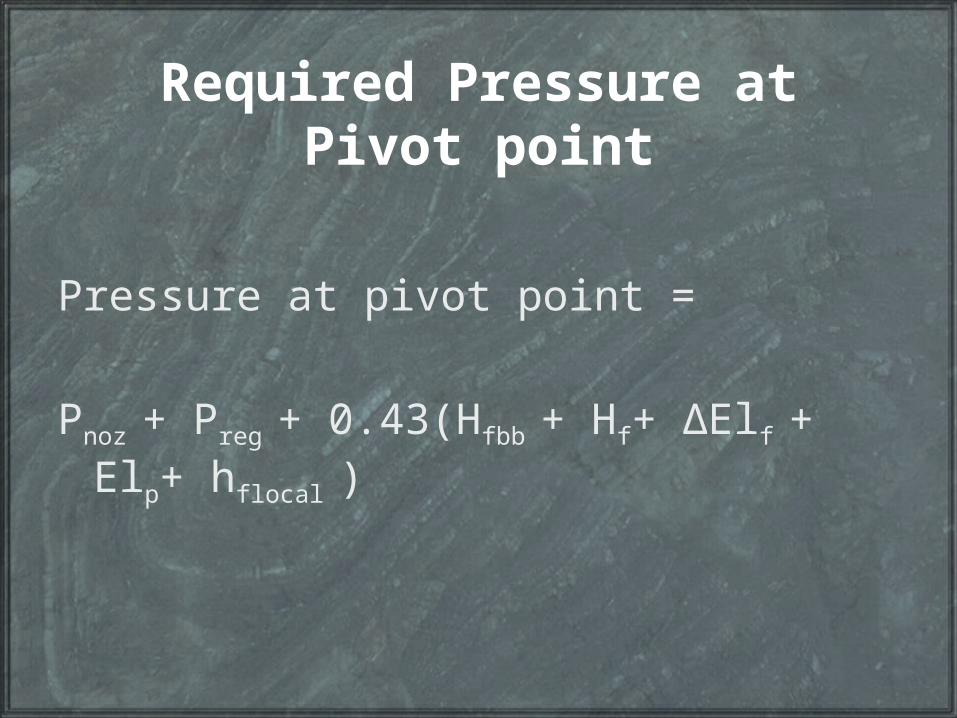
Required Pressure at Pivot point
Pressure at pivot point =
Pnoz + Preg + 0.43(Hfbb + Hf+ ΔElf + Elp+ hflocal )
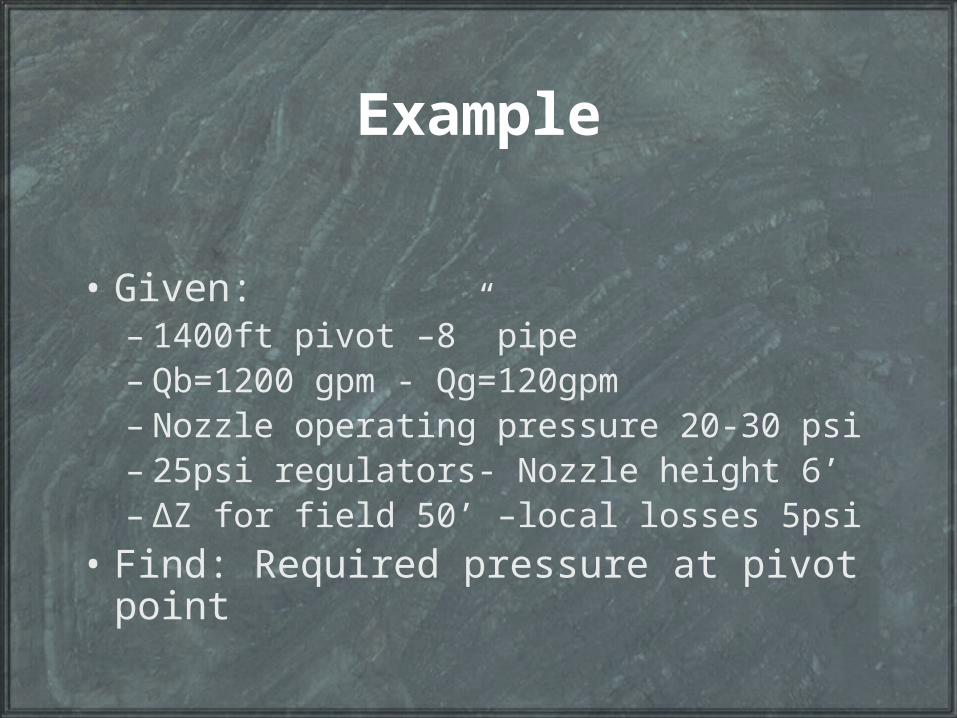
Example
• Given:– 1400ft pivot –8” pipe– Qb=1200 gpm - Qg=120gpm– Nozzle operating pressure 20-30 psi– 25psi regulators- Nozzle height 6’– ΔZ for field 50’ –local losses 5psi
• Find: Required pressure at pivot point
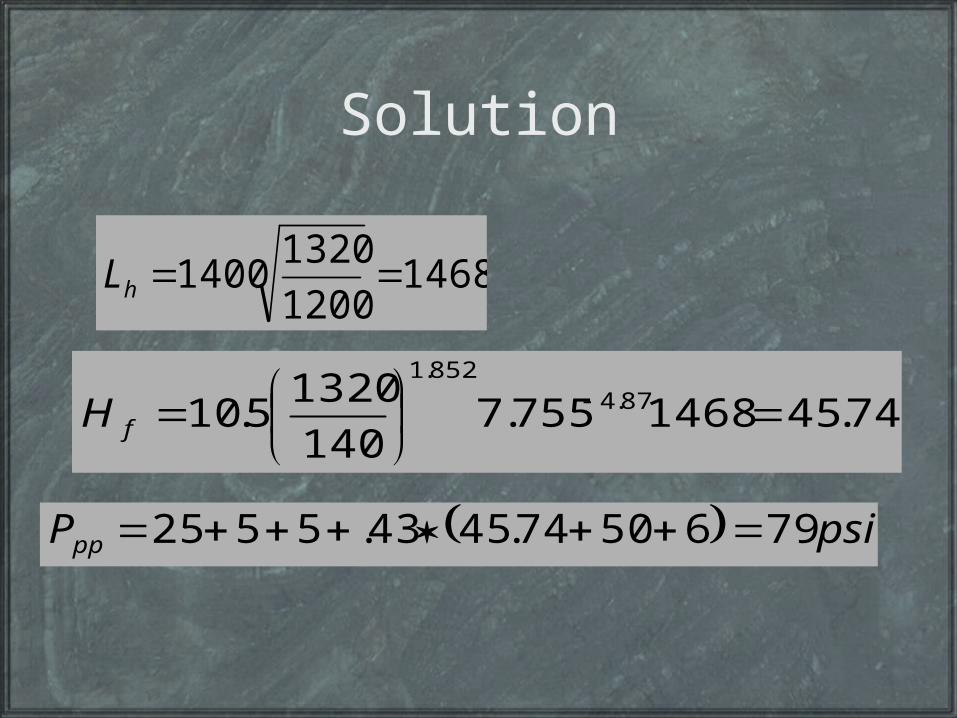
Solution
14681200
13201400 hL
74.451468755.7140
13205.10 87.4
852.1
fH
psiPpp 7965074.4543.5525
End Guns
• Effects on – Pressure– Flow– Pump selection

Flat curve
Sprinkler Nozzles
Distribution Patterns, Nozzle Spacing and Height.
• Pivot system (Heermann-Hein) or Linear (Christensen) CU shall not be less than 85% (76% DU), except as noted in criteria for a Low Energy Precision Application (LEPA) system.
Selecting Nozzle Packages
• Pressure requirements
• Wetted diameter
• Drop size
• Peak application rates
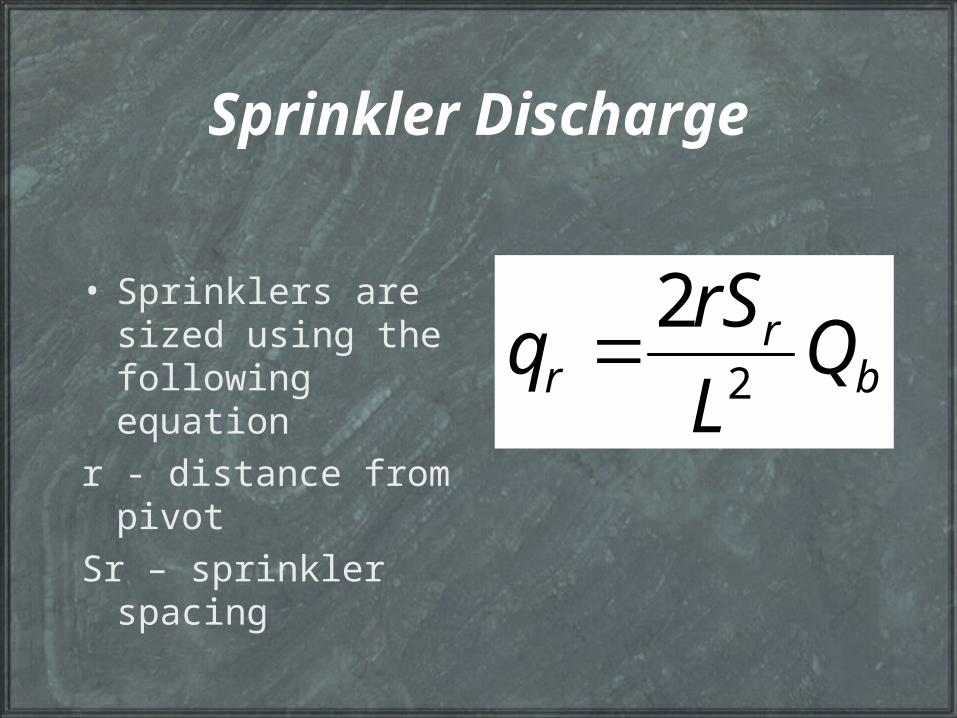
Sprinkler Discharge
• Sprinklers are sized using the following equation
r - distance from pivot
Sr – sprinkler spacing
br
r QL
rSq
2
2

Sprinkler spacing
• Rule of Thumb– W/2 Sr W/4
• W is the wetted diameter of the sprinkler
• From a point midway between the first and second tower to the distal end of a center pivot, spray nozzle spacing along lateral lines shall not exceed 25% of the effective wetted diameter and impact sprinkler spacing shall not exceed 50 percent of the effective wetted diameter
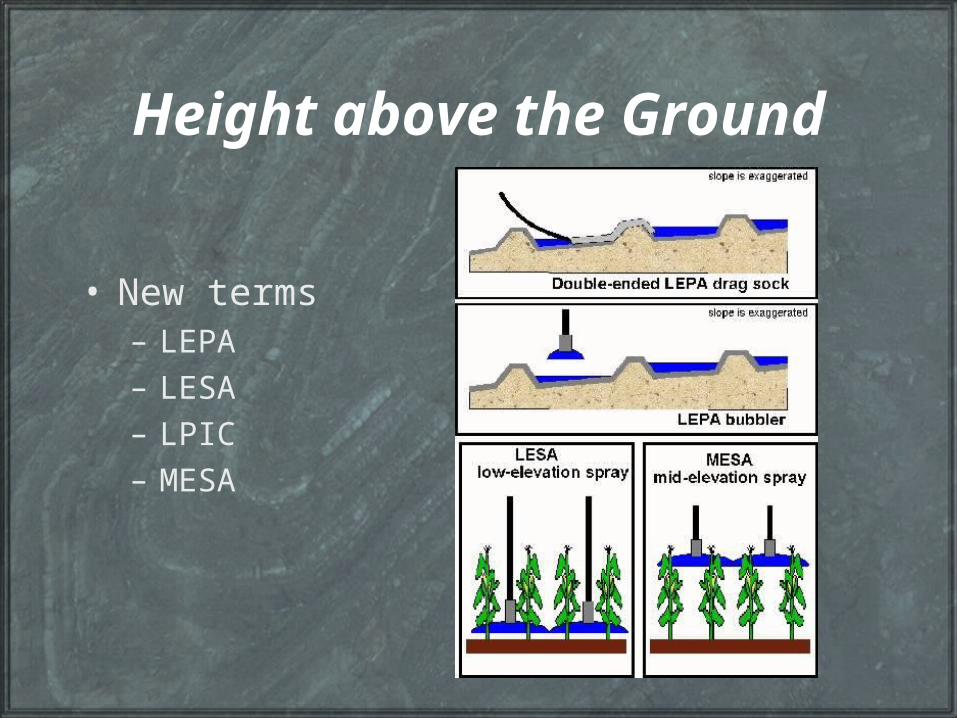
Height above the Ground
• New terms– LEPA– LESA– LPIC– MESA
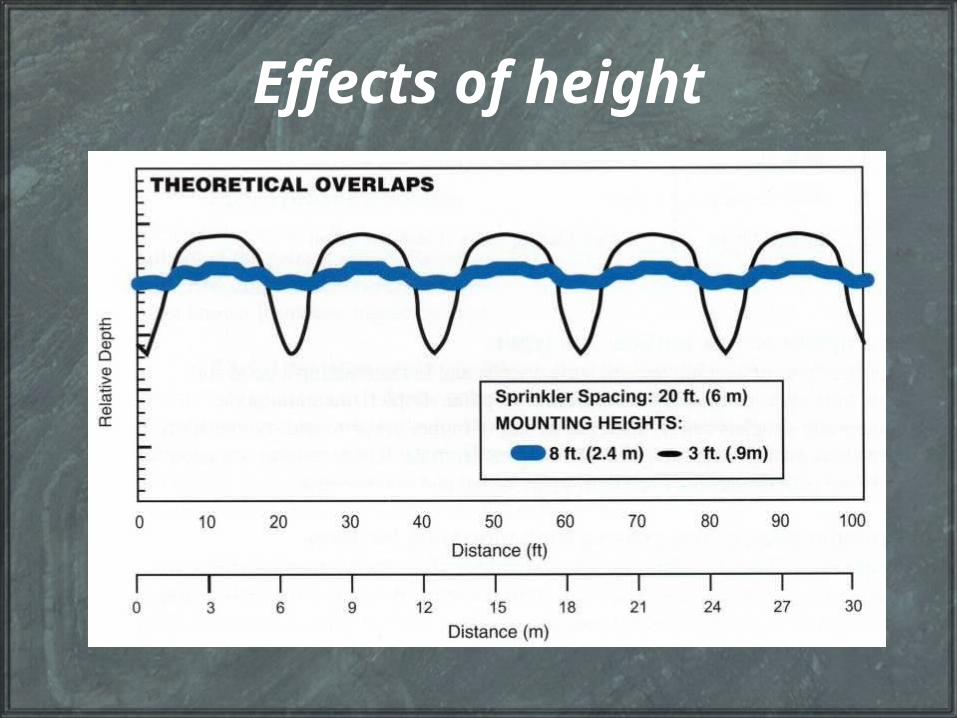
Effects of height
Low pressure Low drift
– 6, 10, 15 psi end pressure– Small atomized droplets are practically eliminated
thus reducing evaporation– Mainly spinner and spray types– Placement height 3, 6, 9, 12 foot– outlet spacing 30, 80, 90, 108 inches
• High application rates - Not good for heavy soils or steeper slopes
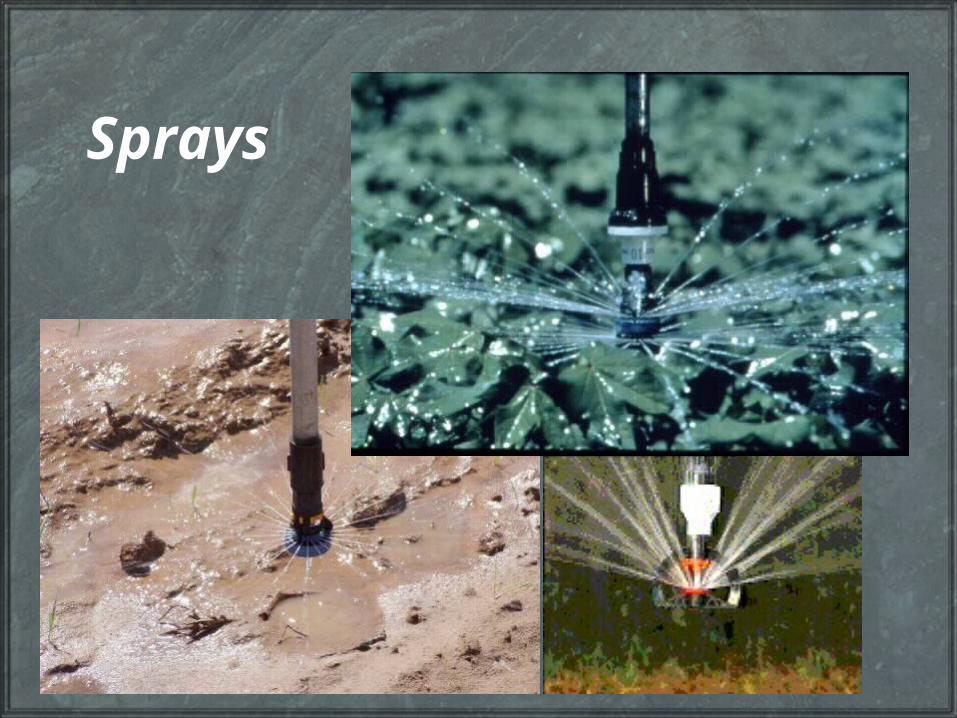
Sprays
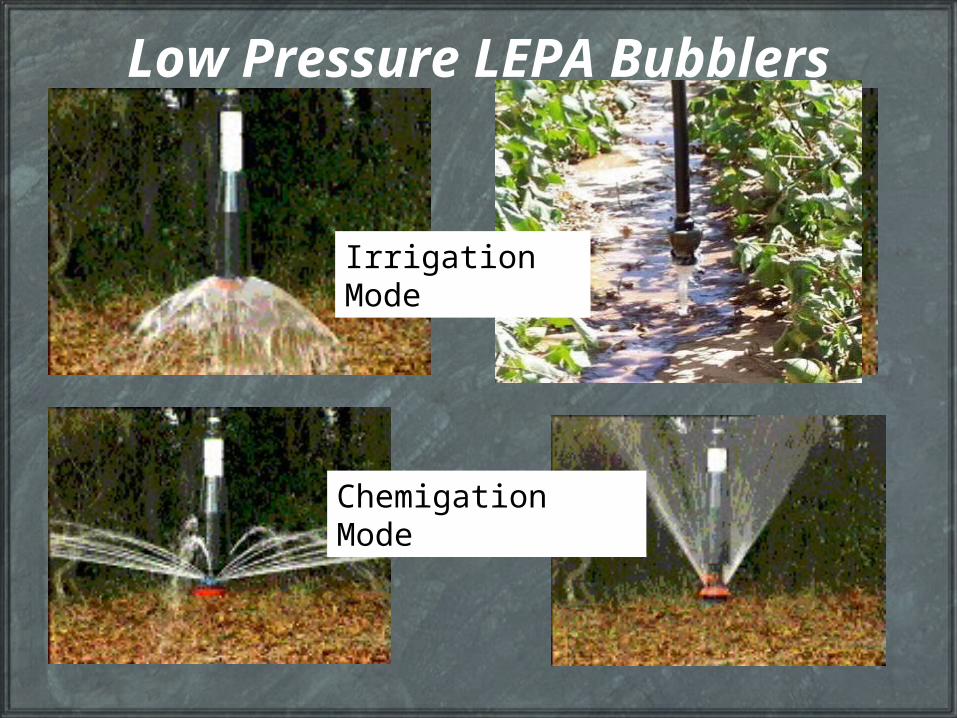
Low Pressure LEPA Bubblers
Chemigation Mode
Irrigation Mode
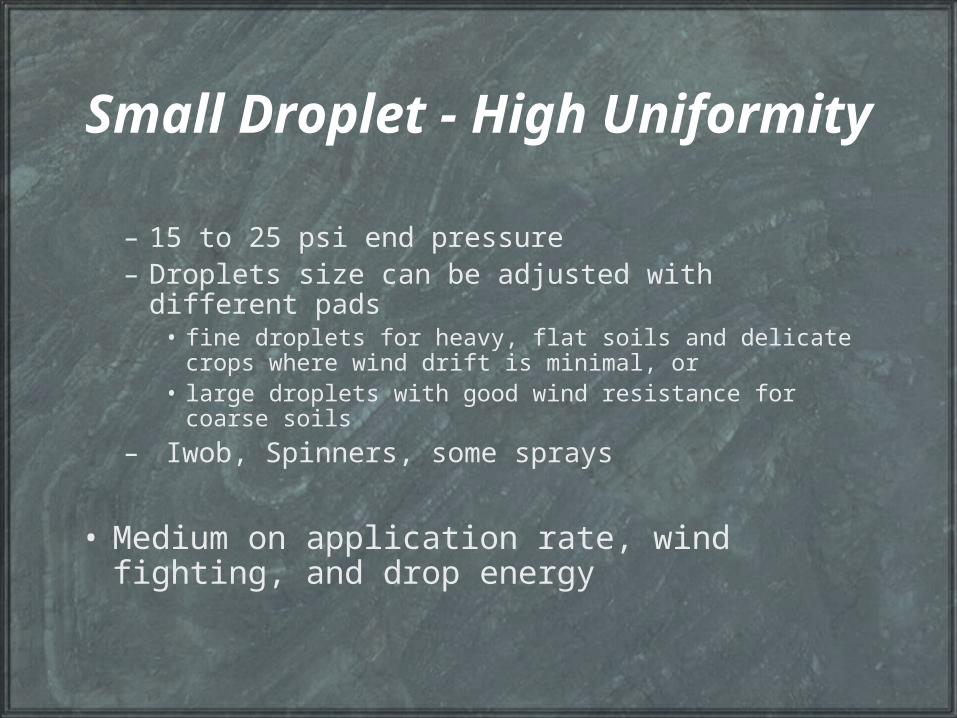
– 15 to 25 psi end pressure– Droplets size can be adjusted with different pads
• fine droplets for heavy, flat soils and delicate crops where wind drift is minimal, or
• large droplets with good wind resistance for coarse soils
– Iwob, Spinners, some sprays
• Medium on application rate, wind fighting, and drop energy
Small Droplet - High Uniformity
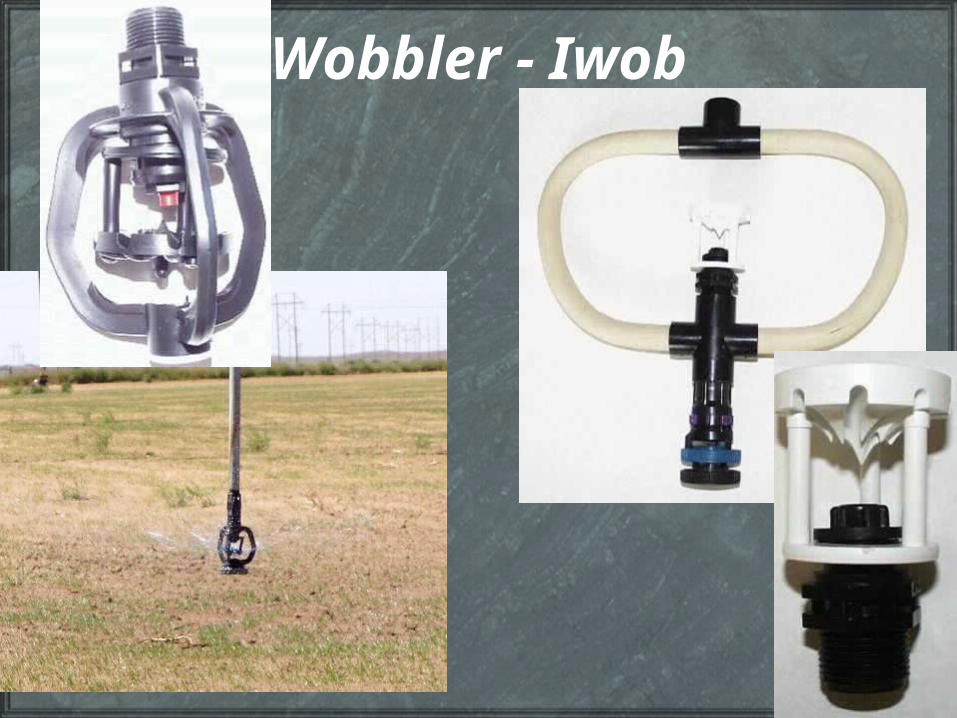
Wobbler - Iwob
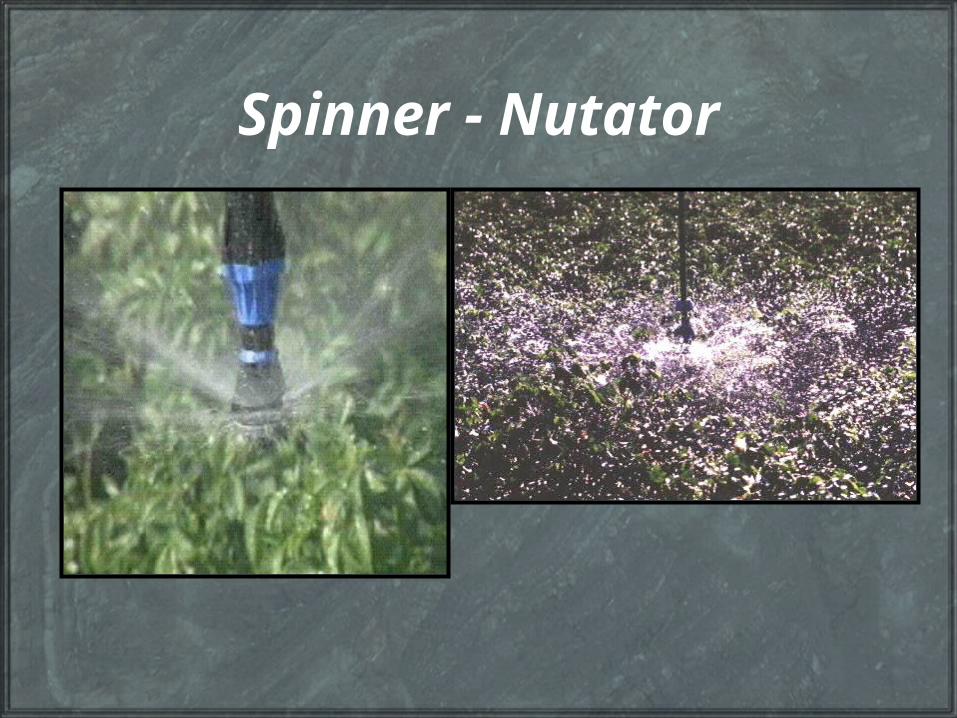
Spinner - Nutator
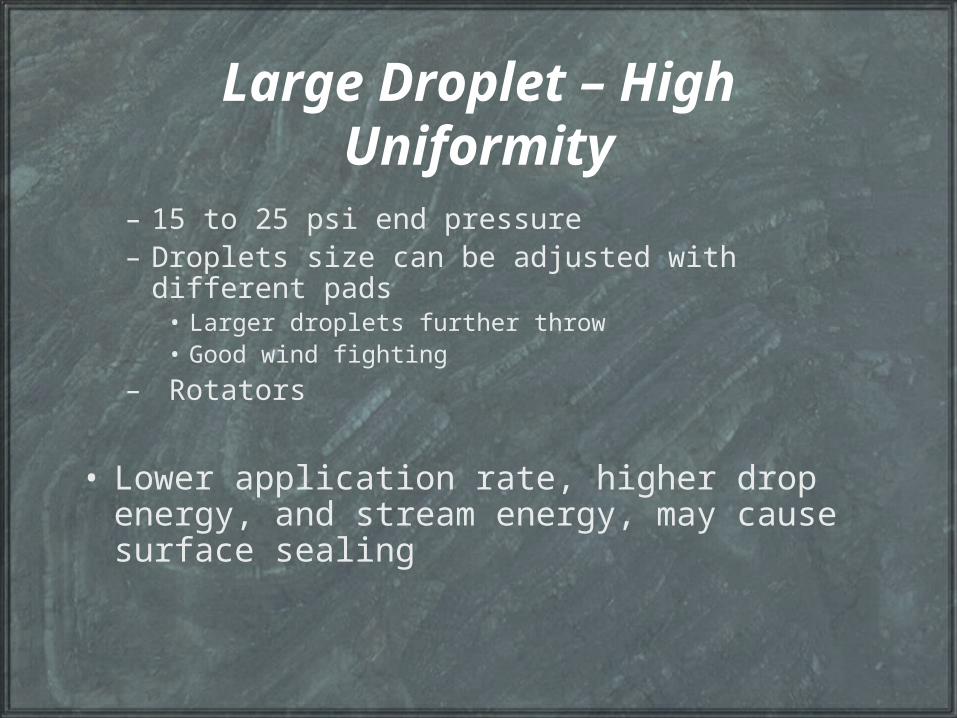
Large Droplet – High Uniformity
– 15 to 25 psi end pressure– Droplets size can be adjusted with different pads
• Larger droplets further throw• Good wind fighting
– Rotators
• Lower application rate, higher drop energy, and stream energy, may cause surface sealing
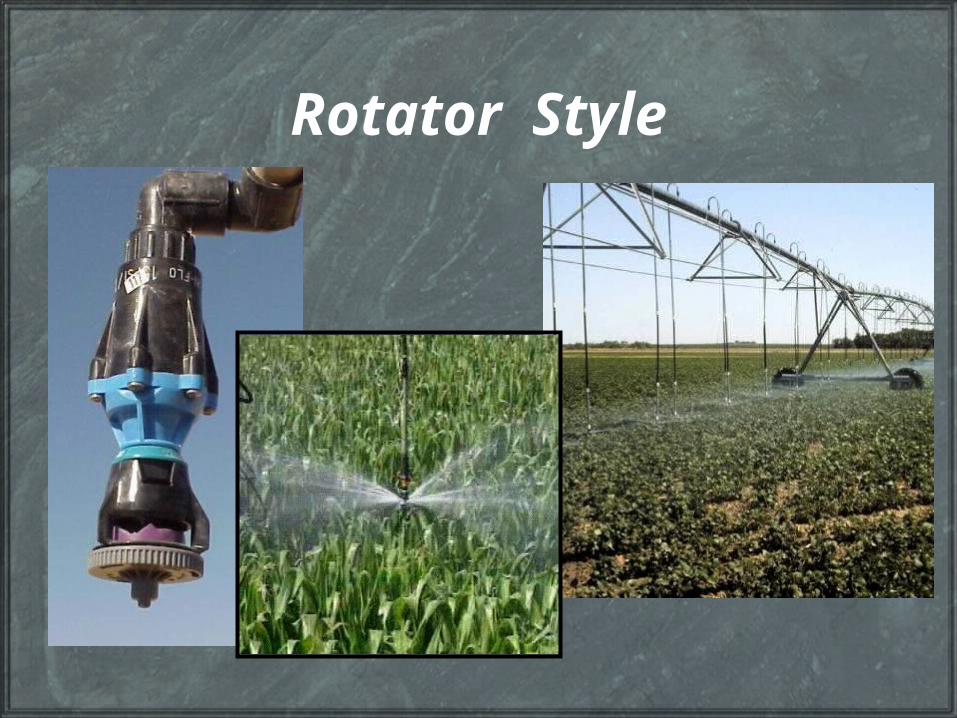
Rotator Style
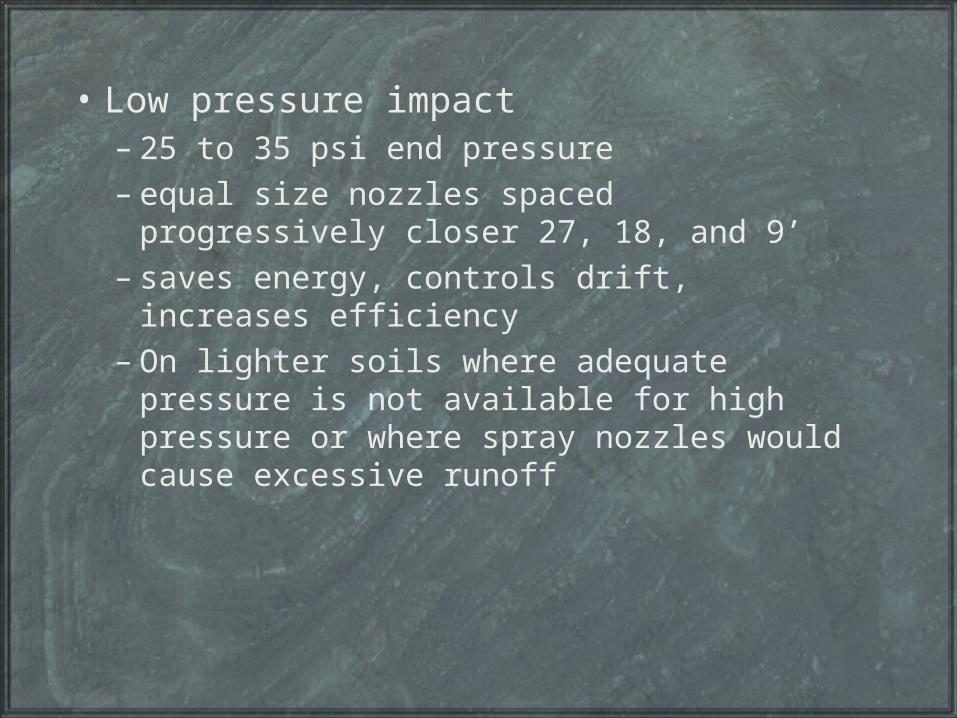
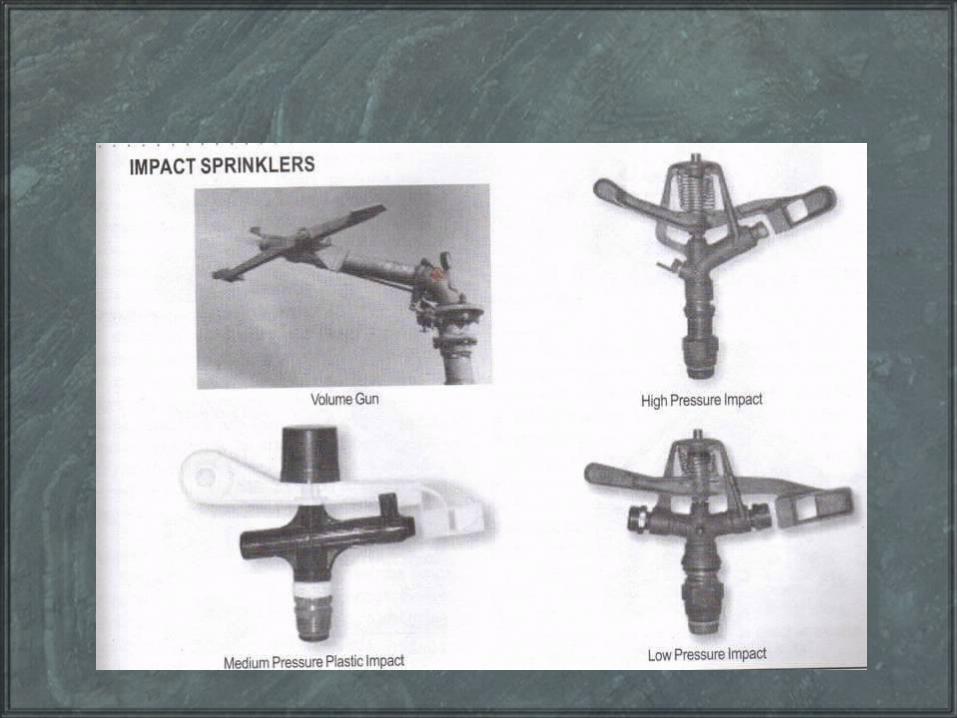
• Low pressure impact– 25 to 35 psi end pressure– equal size nozzles spaced progressively
closer 27, 18, and 9’– saves energy, controls drift, increases
efficiency– On lighter soils where adequate pressure is
not available for high pressure or where spray nozzles would cause excessive runoff
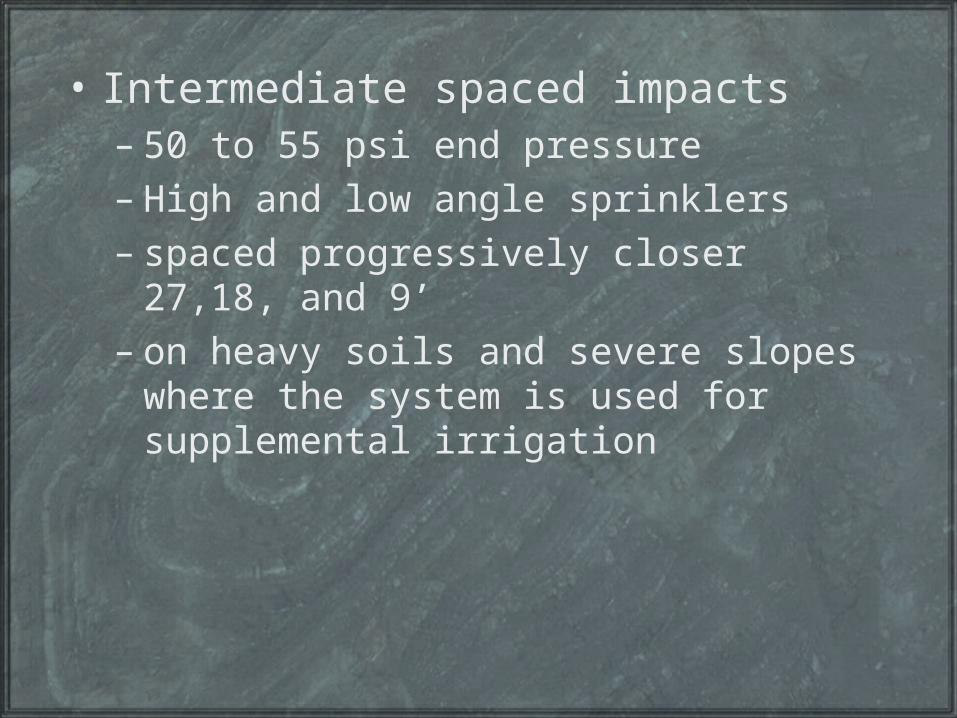
• Intermediate spaced impacts– 50 to 55 psi end pressure– High and low angle sprinklers– spaced progressively closer 27,18, and 9’– on heavy soils and severe slopes where
the system is used for supplemental irrigation
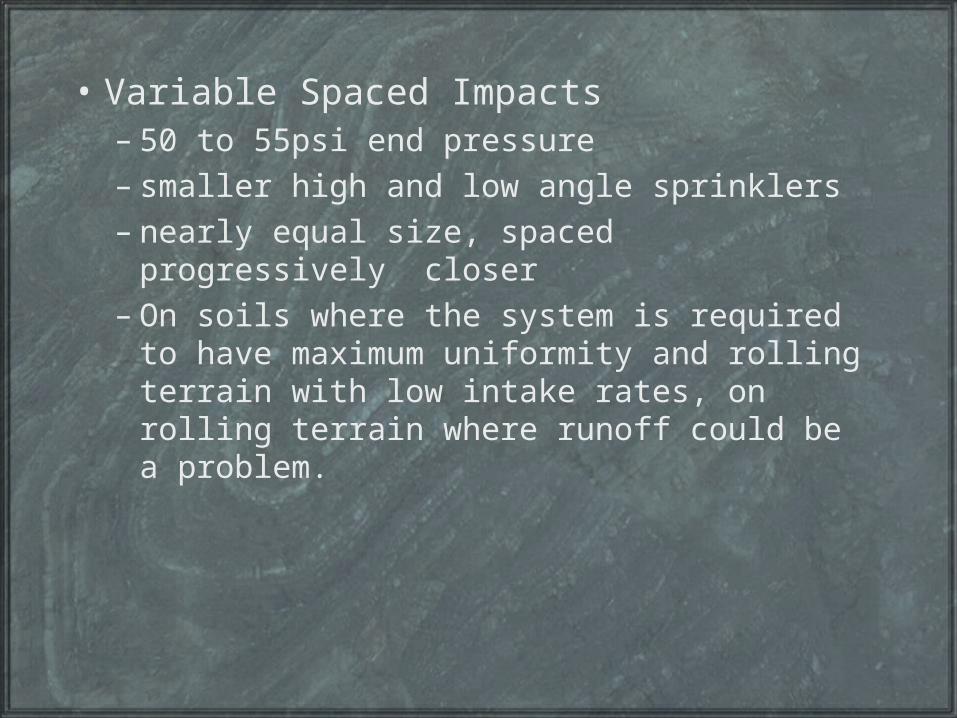
• Variable Spaced Impacts– 50 to 55psi end pressure– smaller high and low angle sprinklers– nearly equal size, spaced progressively
closer– On soils where the system is required to
have maximum uniformity and rolling terrain with low intake rates, on rolling terrain where runoff could be a problem.
Distribution Pads
• Smooth Spray Pads– smallest droplet– minimum soil disturbance or soil
compaction– infiltrates best on heavy soil– susceptible to wind and evaporation– 6 - 25 psi
• Medium Groove Spray Pads– larger drops, slightly wider spray pattern– minimizes wind drift– still infiltrates moderately heavy soils– General propose average conditions and
pressure– less than 40 psi
• Deep Grooved Spray Pads– large droplets in small direct streams– greatest wind resistance reduces
evaporation– unsuitable for sensitive crops and light
soils where water does not move laterally– uniformity reduced under calm conditions– pressures above 15 psi
Pad configurations
• Available in– flat– concave– convex
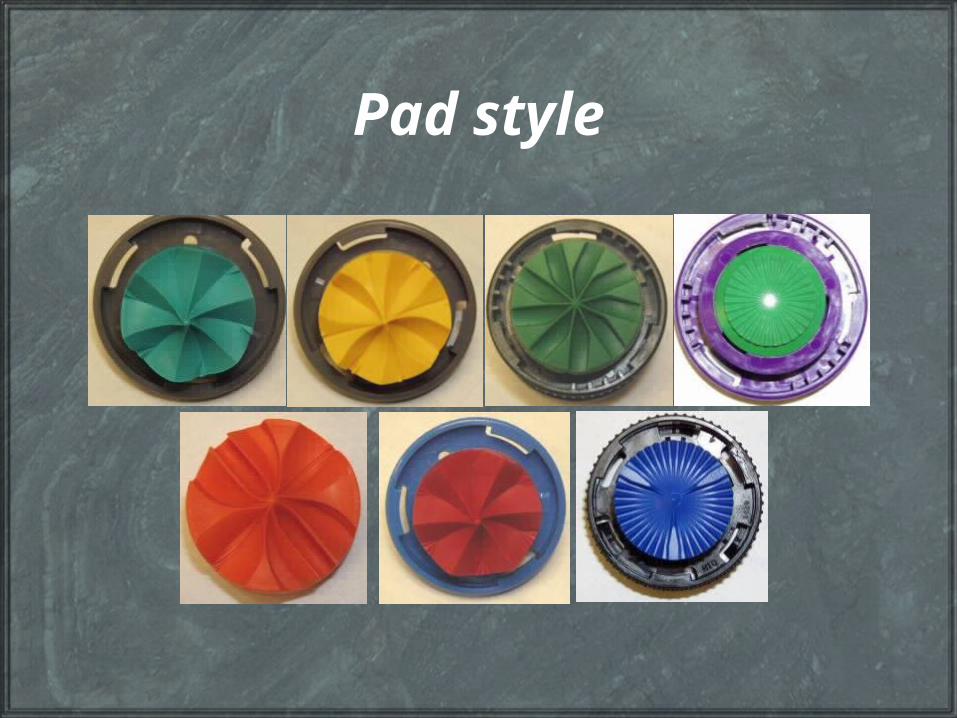
Pad style
Application
• Rates shall be selected such that runoff, translocation, and unplanned deep percolation are minimized
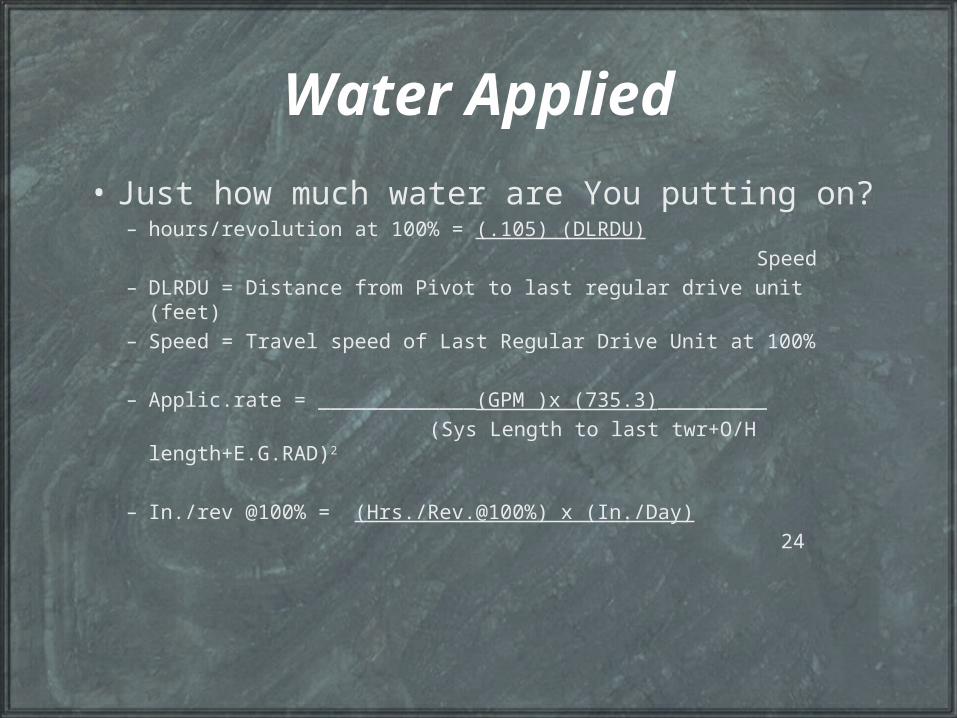
Water Applied
• Just how much water are You putting on?– hours/revolution at 100% = (.105) (DLRDU)
Speed– DLRDU = Distance from Pivot to last regular drive unit (feet)
– Speed = Travel speed of Last Regular Drive Unit at 100%
– Applic.rate = _____________(GPM )x (735.3)_________
(Sys Length to last twr+O/H length+E.G.RAD)2
– In./rev @100% = (Hrs./Rev.@100%) x (In./Day)
24
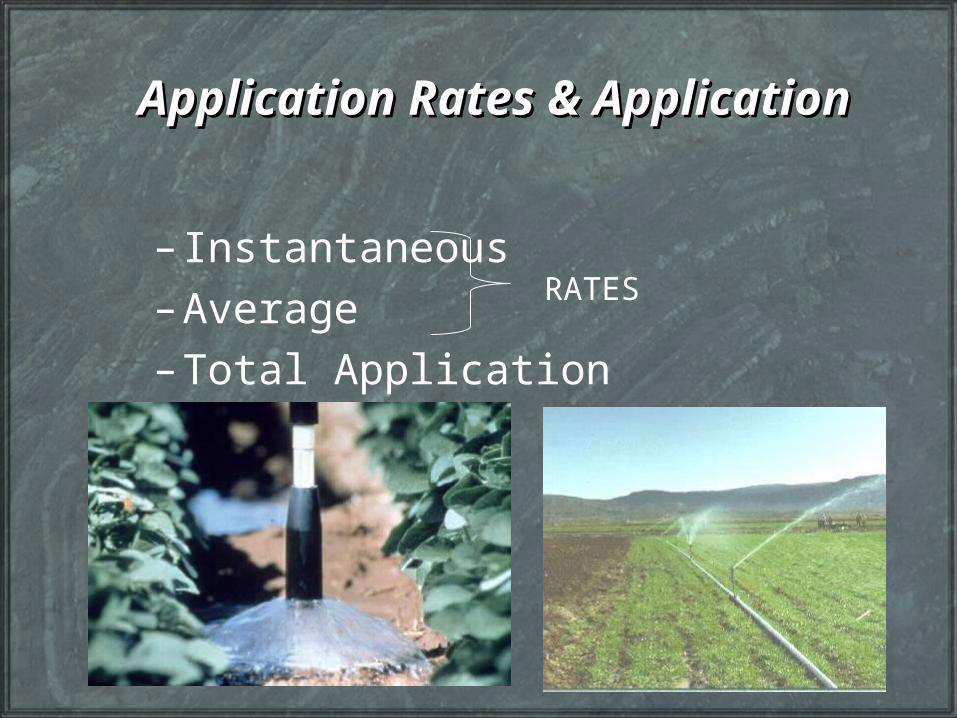
Application Rates & ApplicationApplication Rates & Application
– Instantaneous
– Average
– Total Application
RATES
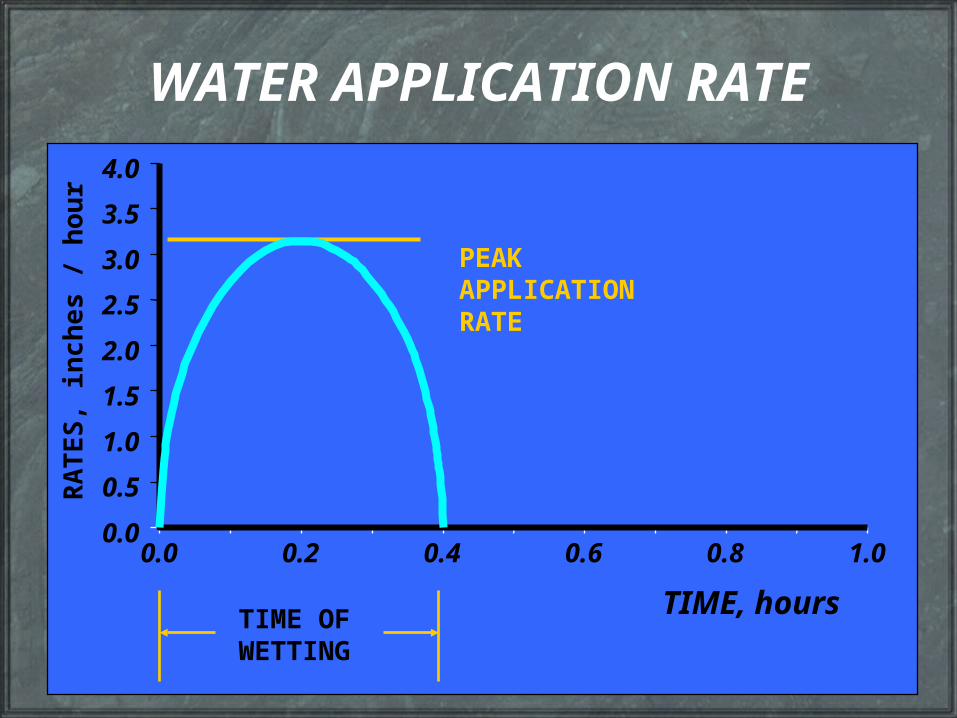
WATER APPLICATION RATE
0.0 0.2 0.4 0.6 0.8 1.0
4.0
3.5
3.0
2.5
2.0
1.5
1.0
0.5
0.0
PEAK APPLICATION RATE
TIME, hours
RA
TE
S, i
nc
hes
/ h
ou
r
TIME OFWETTING
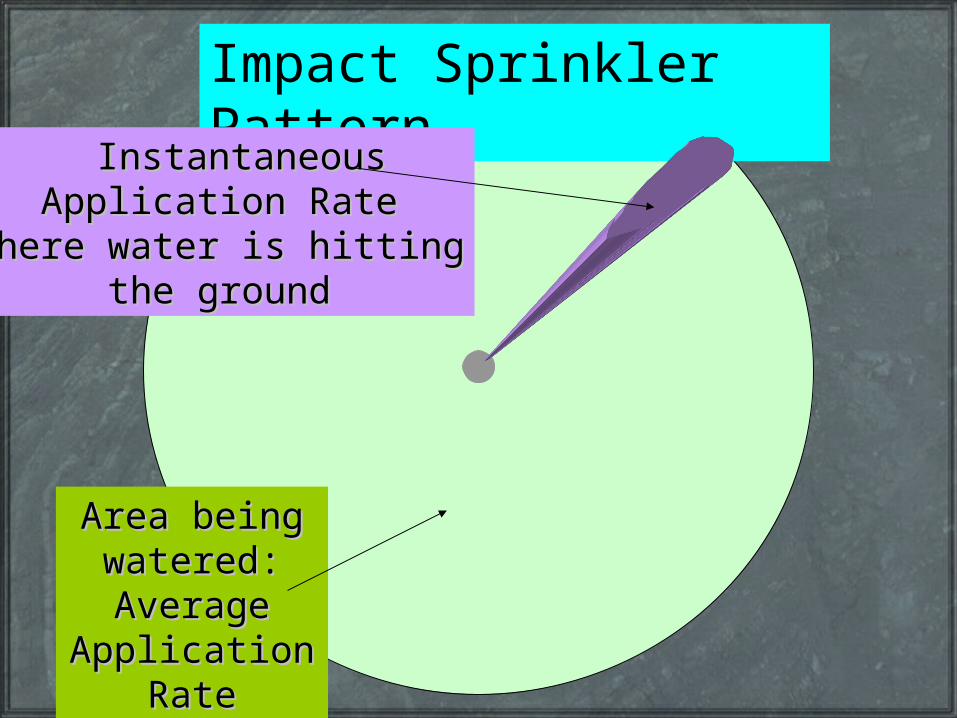
Impact Sprinkler Pattern
InstantaneousInstantaneousApplication RateApplication Rate
where water is hittingwhere water is hittingthe groundthe ground
Area being Area being watered:watered:AverageAverage
Application Application RateRate
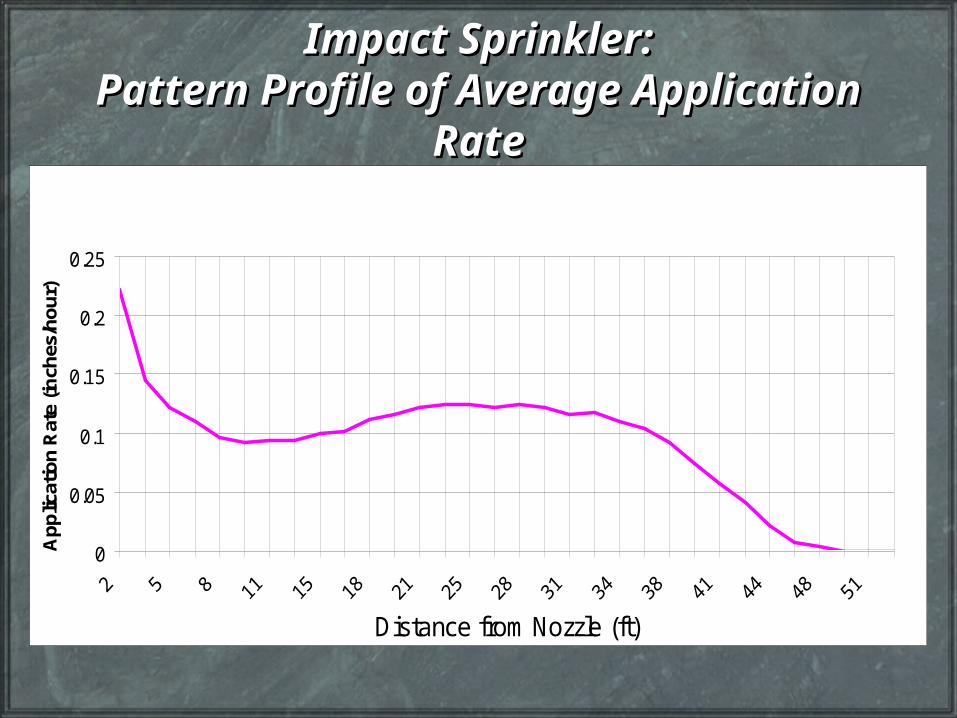
Impact Sprinkler:Impact Sprinkler:Pattern Profile of Average Application Pattern Profile of Average Application
RateRate
0
0.05
0.1
0.15
0.2
0.25
Distance from Nozzle (ft)
Ap
plic
atio
n R
ate
(inch
es/h
ou
r)
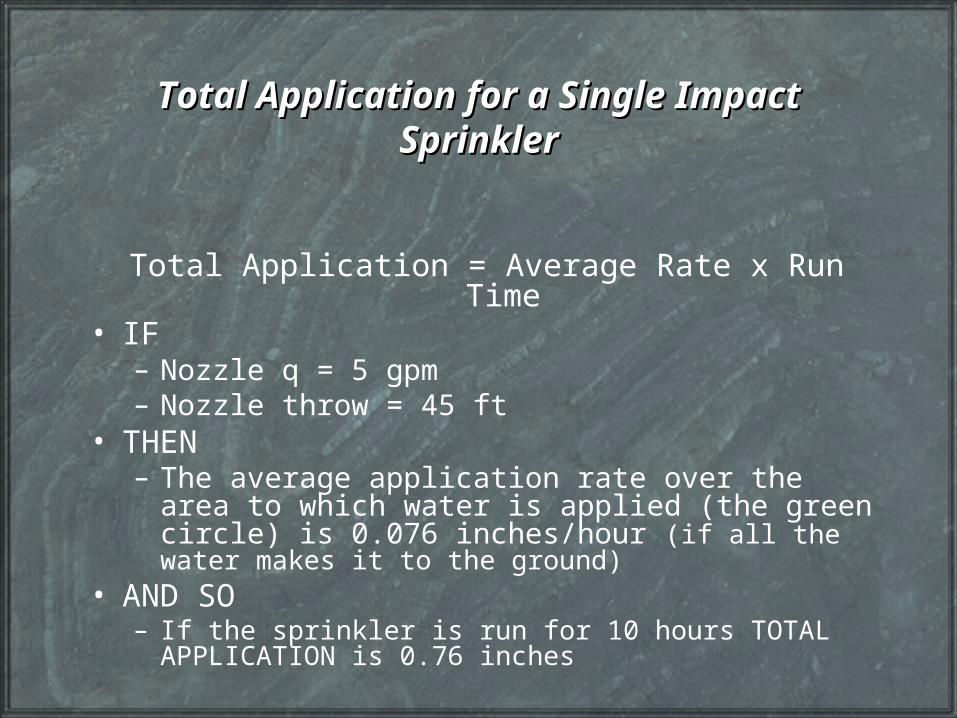
Total Application for a Single Impact Total Application for a Single Impact SprinklerSprinkler
Total Application = Average Rate x Run Time• IF
– Nozzle q = 5 gpm– Nozzle throw = 45 ft
• THEN – The average application rate over the area to
which water is applied (the green circle) is 0.076 inches/hour (if all the water makes it to the ground)
• AND SO– If the sprinkler is run for 10 hours TOTAL
APPLICATION is 0.76 inches
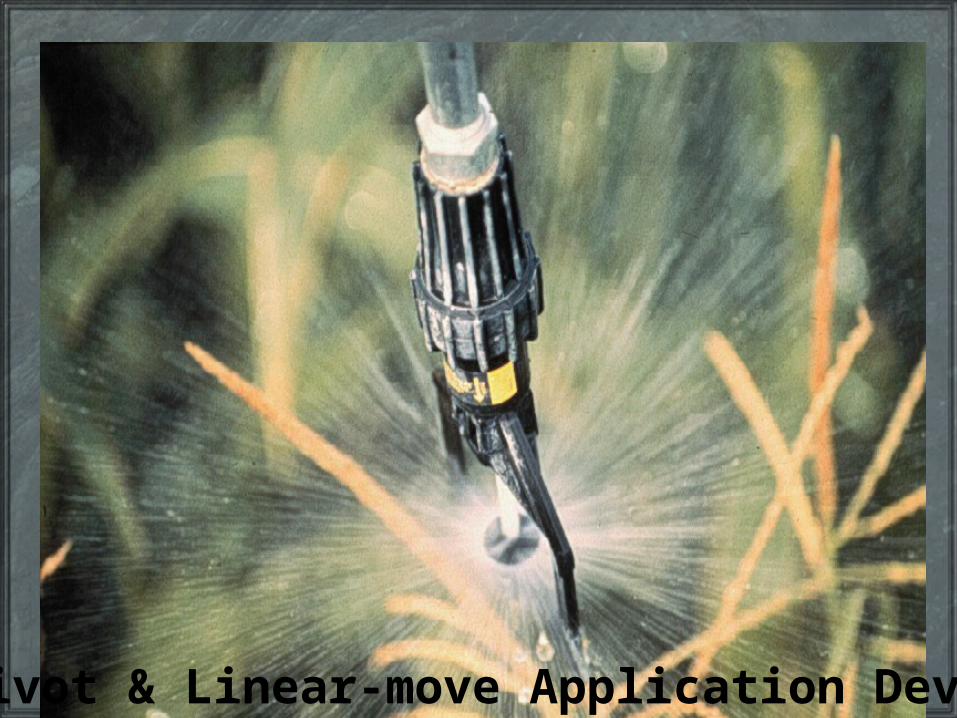
Pivot & Linear-move Application Devices
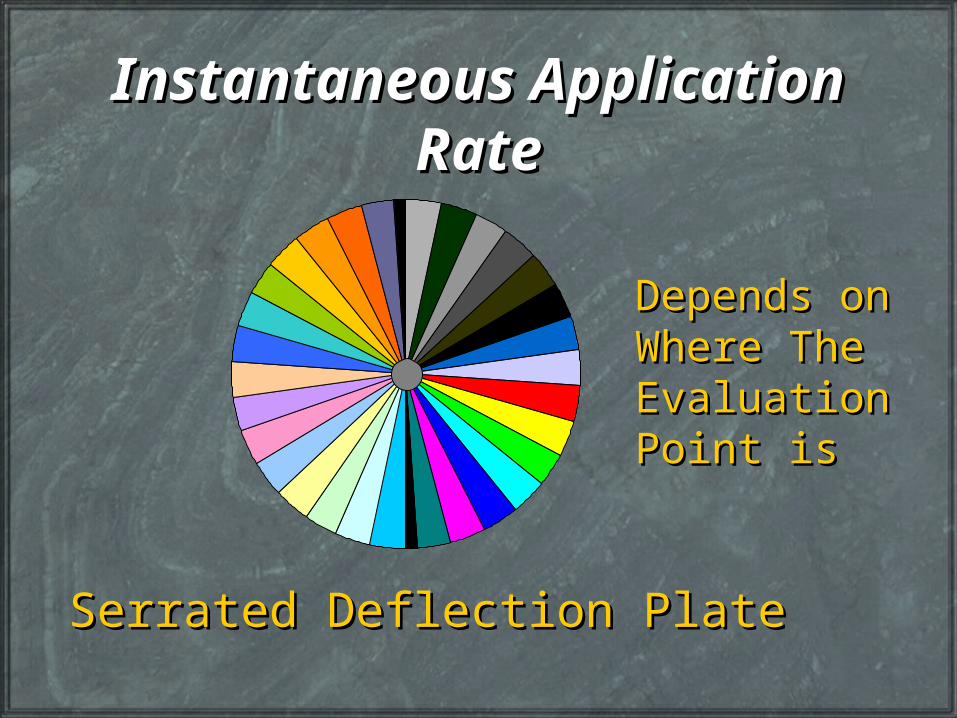
Instantaneous Application Instantaneous Application RateRate
Serrated Deflection PlateSerrated Deflection Plate
Depends onDepends onWhere TheWhere TheEvaluationEvaluationPoint isPoint is
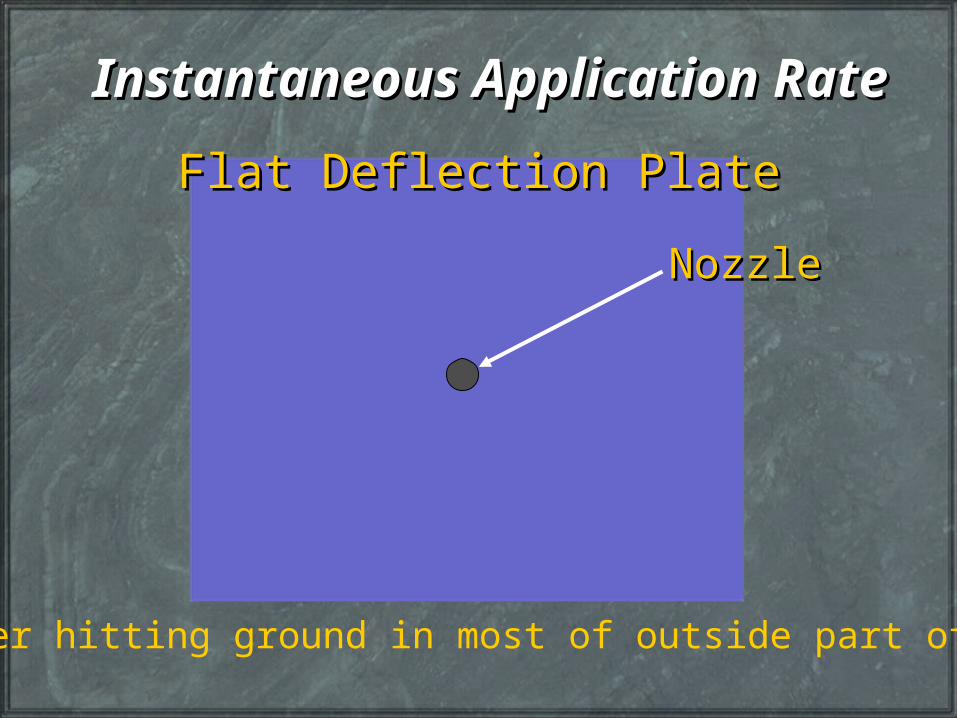
Instantaneous Application RateInstantaneous Application Rate
Flat Deflection PlateFlat Deflection Plate
NozzleNozzle
Water hitting ground in most of outside part of area
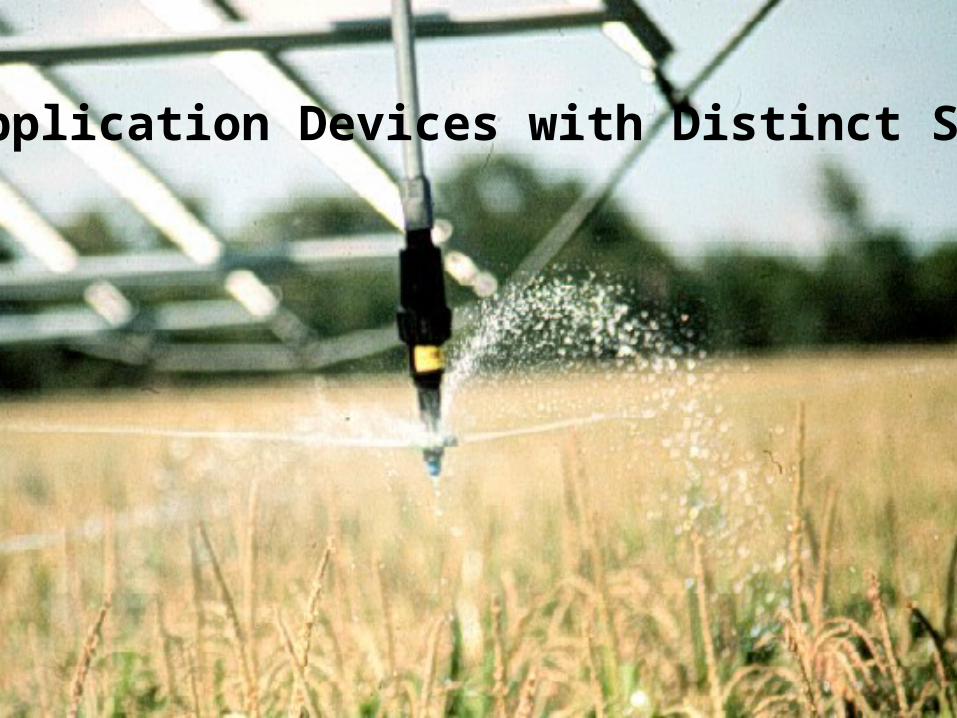
Application Devices with Distinct Streams

Exaggerated Rotator-style Pattern w/ 4 individual streams
InstantaneousInstantaneousApplication RateApplication RateWhere water isWhere water is
Hitting the groundHitting the ground
Area of AverageArea of AverageApplication RateApplication Rate

Pattern Profile IllustrationsPattern Profile Illustrations
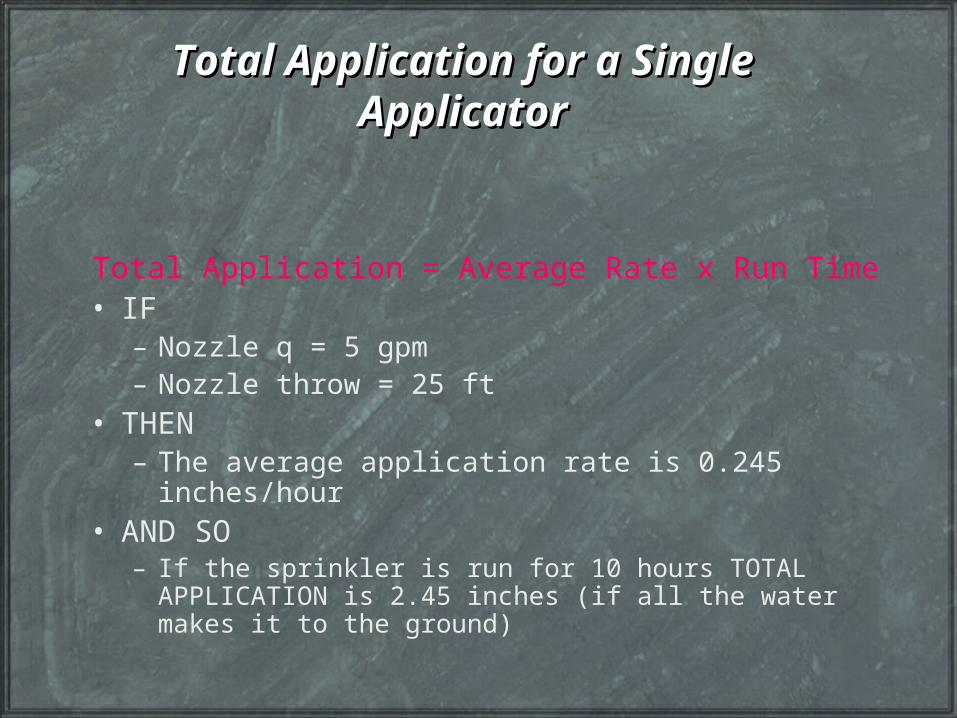
Total Application for a Single Total Application for a Single ApplicatorApplicator
Total Application = Average Rate x Run Time• IF
– Nozzle q = 5 gpm– Nozzle throw = 25 ft
• THEN – The average application rate is 0.245 inches/hour
• AND SO– If the sprinkler is run for 10 hours TOTAL
APPLICATION is 2.45 inches (if all the water makes it to the ground)
Consider Overlap & Sprinkler Consider Overlap & Sprinkler MovementMovement
• Individual Patterns are Overlapped for Uniformity– Typical hand/wheel line spacing of 40’ (& 50’ or 60’ in solid
sets)– Adjacent applicators on a pivot/linear-move
• Consider the movement of the pattern as the pivot/linear-move advances– the instantaneous application rate the soil “sees” will
change because the overlapped pattern is not perfectly uniform
– Initially the soil “sees” a small rate, gradually getting more intense until it peaks, then gradually decreases again as the machine moves away

WettedDiameter
Soil
One point in the field
Instantaneous Application Rate Varies Instantaneous Application Rate Varies as Machine Moves over the fieldas Machine Moves over the field
App
licat
ion
Rat
e
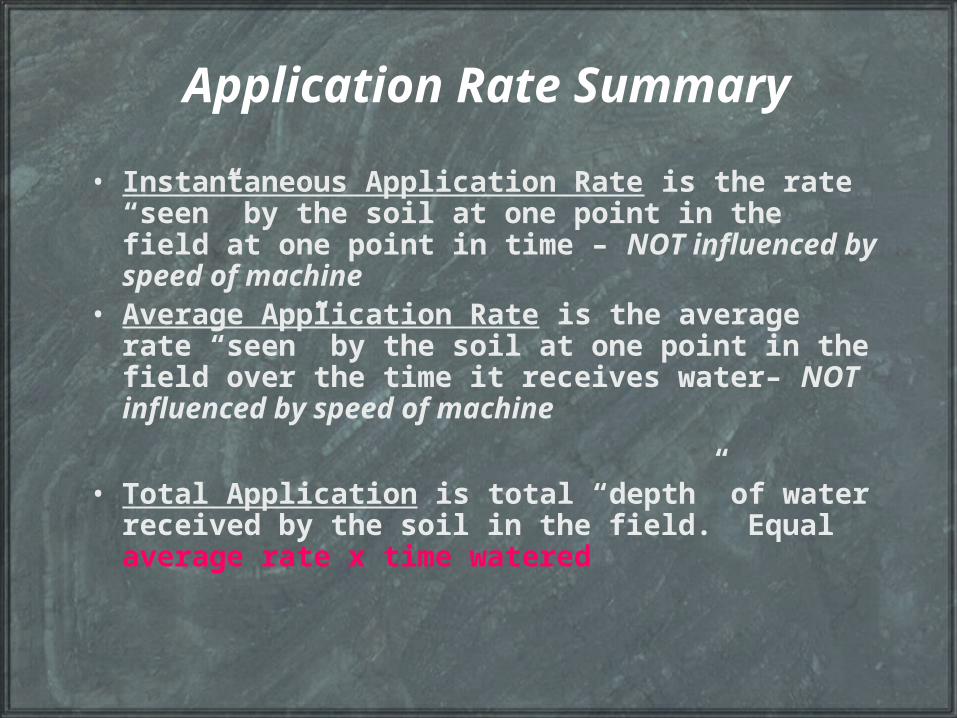
Application Rate Summary
• Instantaneous Application Rate is the rate “seen” by the soil at one point in the field at one point in time – NOT influenced by speed of machine
• Average Application Rate is the average rate “seen” by the soil at one point in the field over the time it receives water– NOT influenced by speed of machine
• Total Application is total “depth” of water received by the soil in the field. Equal average rate x time watered
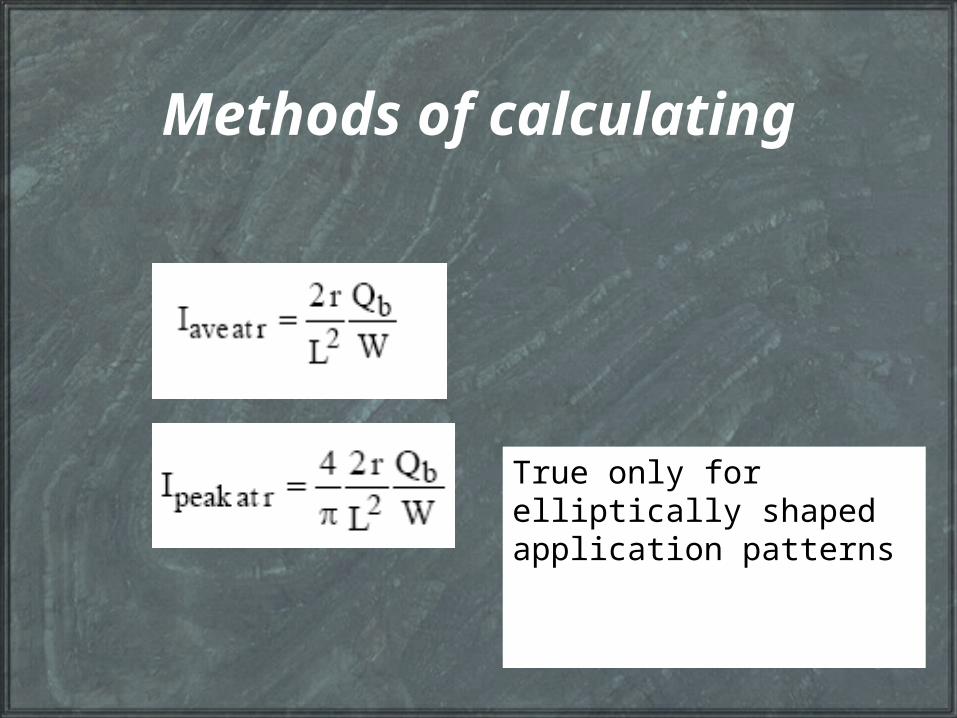
Methods of calculating
True only for elliptically shaped application patterns
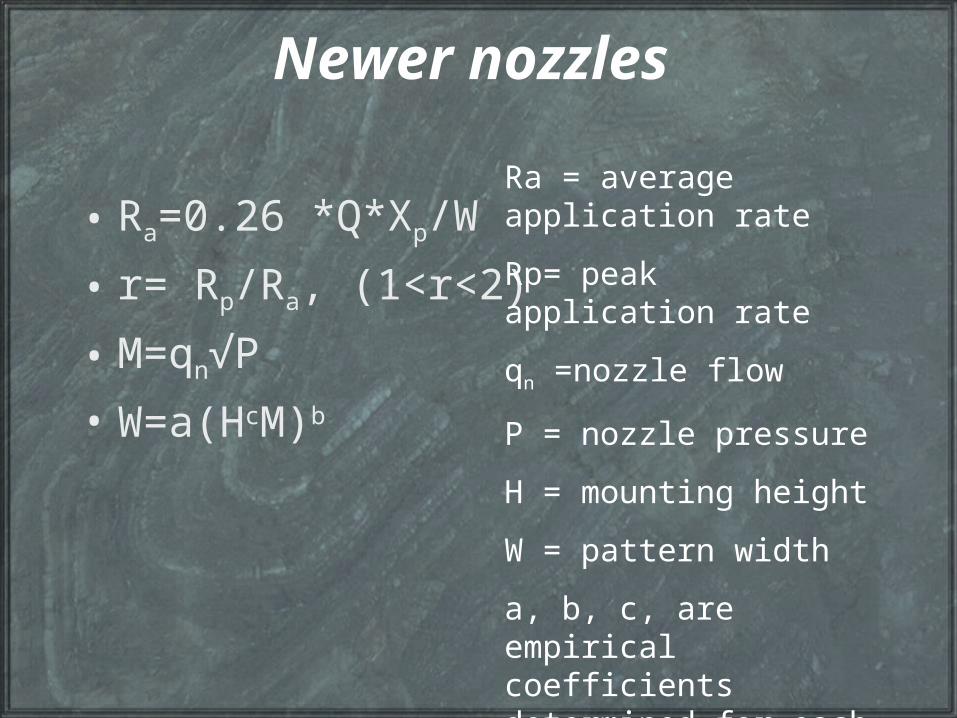
Newer nozzles
• Ra=0.26 *Q*Xp/W
• r= Rp/Ra, (1<r<2)
• M=qn√P
• W=a(HcM)b
Ra = average application rate
Rp= peak application rate
qn =nozzle flow
P = nozzle pressure
H = mounting height
W = pattern width
a, b, c, are empirical coefficients determined for each spray device type
Reference
• “Application Rates from Center Pivot Irrigation with Current Sprinkler Types”. by Dennis Kincaid
• http://asae.frymulti.com/request.asp?JID=8&AID=17585&CID=smppnr&T=1
Soil Sprinkler Interaction
• Why is the application rate a concern?
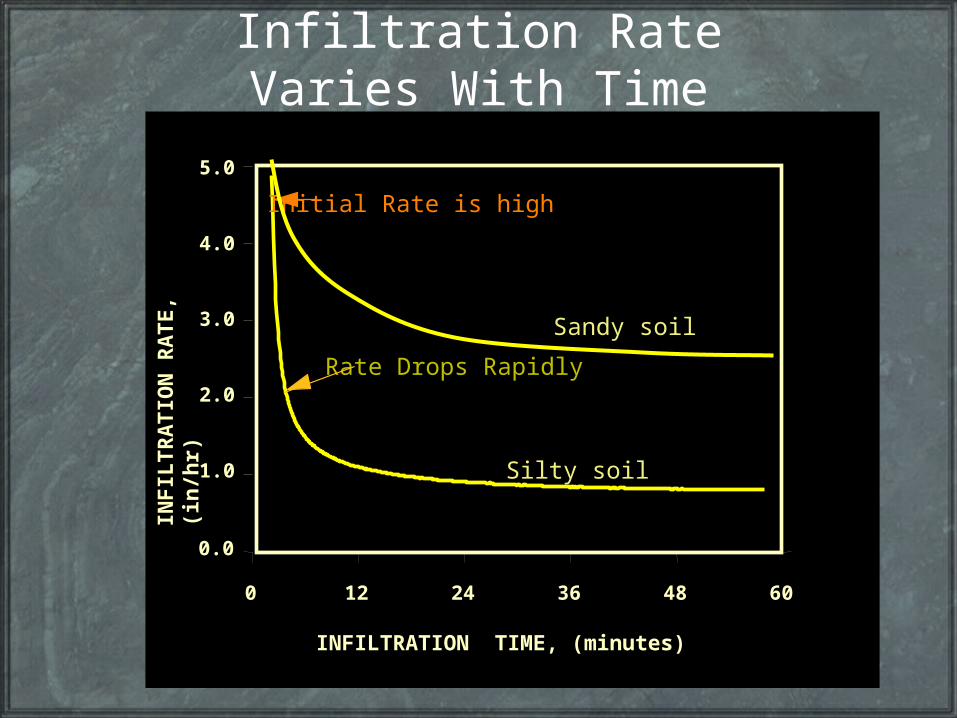
Infiltration Rate Varies With Time
0 12 24 36 48 60
5.0
4.0
3.0
2.0
1.0
0.0
INFILTRATION TIME, (minutes)
INF
ILT
RA
TIO
N R
AT
E, (
in/h
r)
Initial Rate is high
Rate Drops Rapidly
Silty soil
Sandy soil
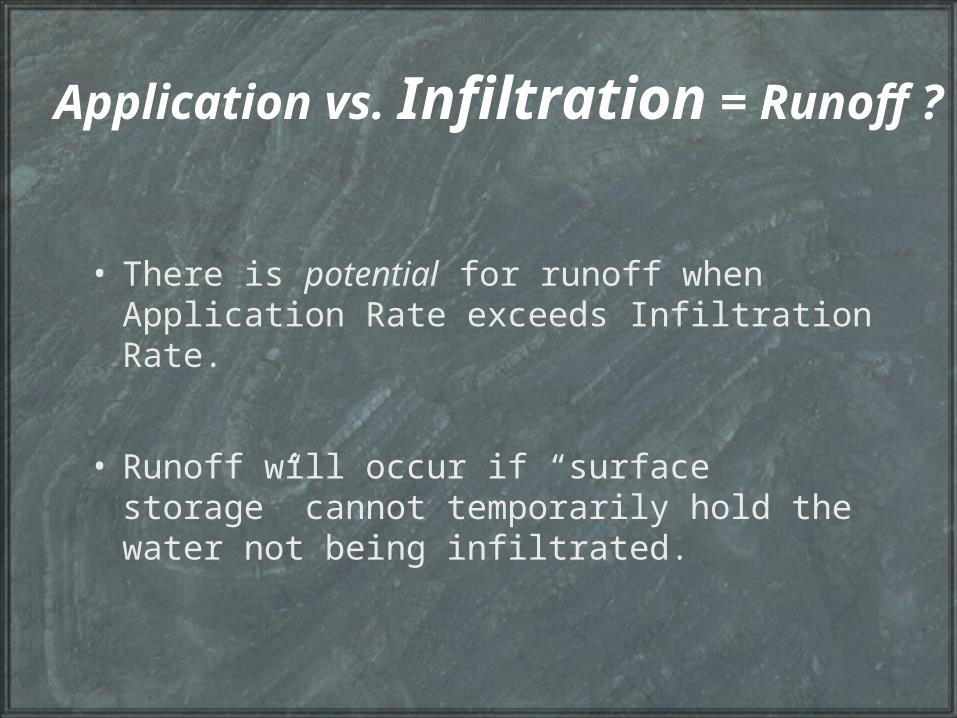
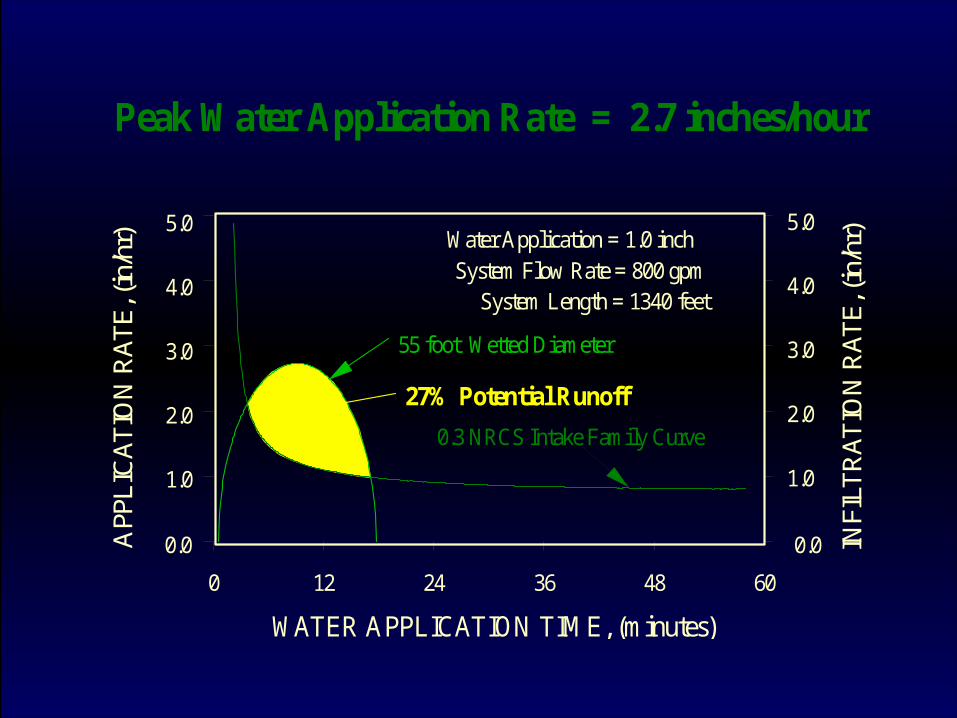
Application vs. Infiltration = Runoff ?
• There is potential for runoff when Application Rate exceeds Infiltration Rate.
• Runoff will occur if “surface storage” cannot temporarily hold the water not being infiltrated.
0 12 24 36 48 60
5.0
4.0
3.0
2.0
1.0
0.0
WATER APPLICATION TIME, (minutes)
APP
LIC
AT
ION
RA
TE
, (in
/hr)
55 foot Wetted Diameter
Water Application = 1.0 inchSystem Flow Rate = 800 gpm
5.0
4.0
3.0
2.0
1.0
0.0 INFI
LTR
AT
ION
RA
TE
, (in
/hr)
0.3 NRCS Intake Family Curve
System Length = 1340 feet
27% Potential Runoff
Peak Water Application Rate = 2.7 inches/hour
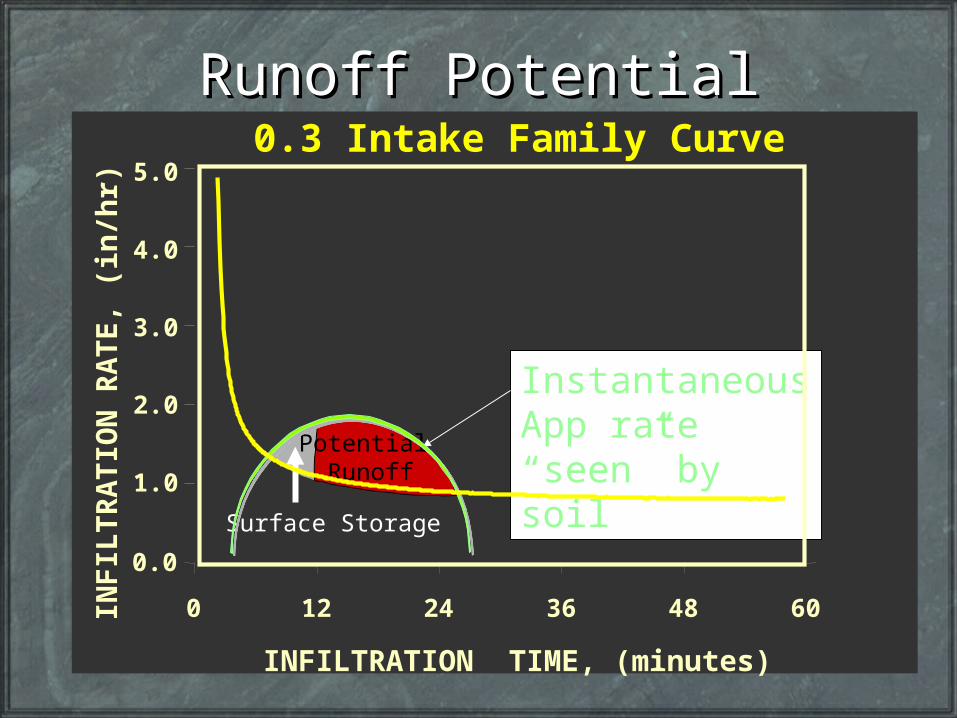
Instantaneous App rate “seen” by soil
Surface Storage
Potential Runoff
Runoff PotentialRunoff Potential
0 12 24 36 48 60
5.0
4.0
3.0
2.0
1.0
0.0
INFILTRATION TIME, (minutes)
INF
ILT
RA
TIO
N R
AT
E, (
in/h
r)0.3 Intake Family Curve
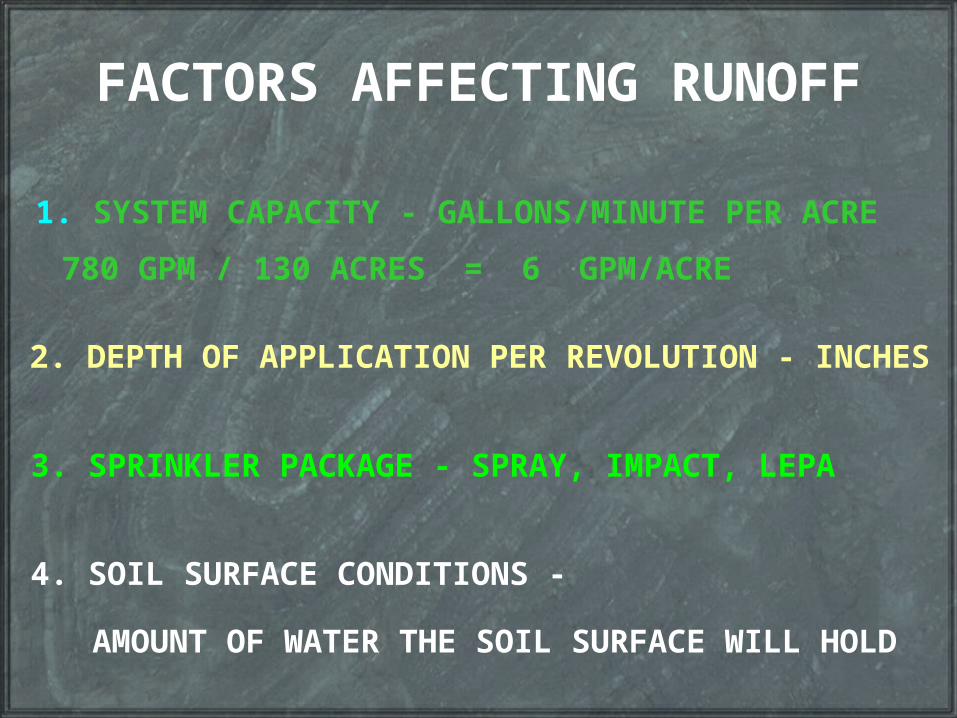
FACTORS AFFECTING RUNOFF
1. SYSTEM CAPACITY - GALLONS/MINUTE PER ACRE
780 GPM / 130 ACRES = 6 GPM/ACRE
2. DEPTH OF APPLICATION PER REVOLUTION - INCHES
3. SPRINKLER PACKAGE - SPRAY, IMPACT, LEPA
4. SOIL SURFACE CONDITIONS -
AMOUNT OF WATER THE SOIL SURFACE WILL HOLD
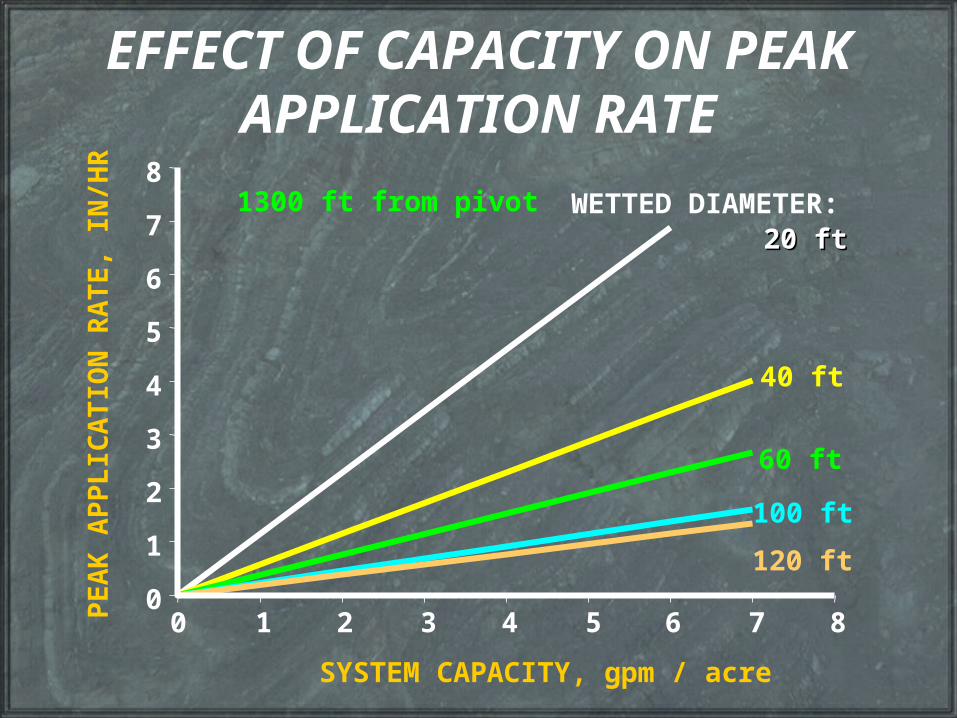
EFFECT OF CAPACITY ON PEAK APPLICATION RATE
0 2 4 6 8
8
7
6
5
4
3
2
1
01 3 5 7
20 ft20 ft
40 ft
60 ft
100 ft
120 ft
WETTED DIAMETER:
SYSTEM CAPACITY, gpm / acre
PE
AK
AP
PL
ICA
TIO
N R
AT
E,
IN/H
R
1300 ft from pivot
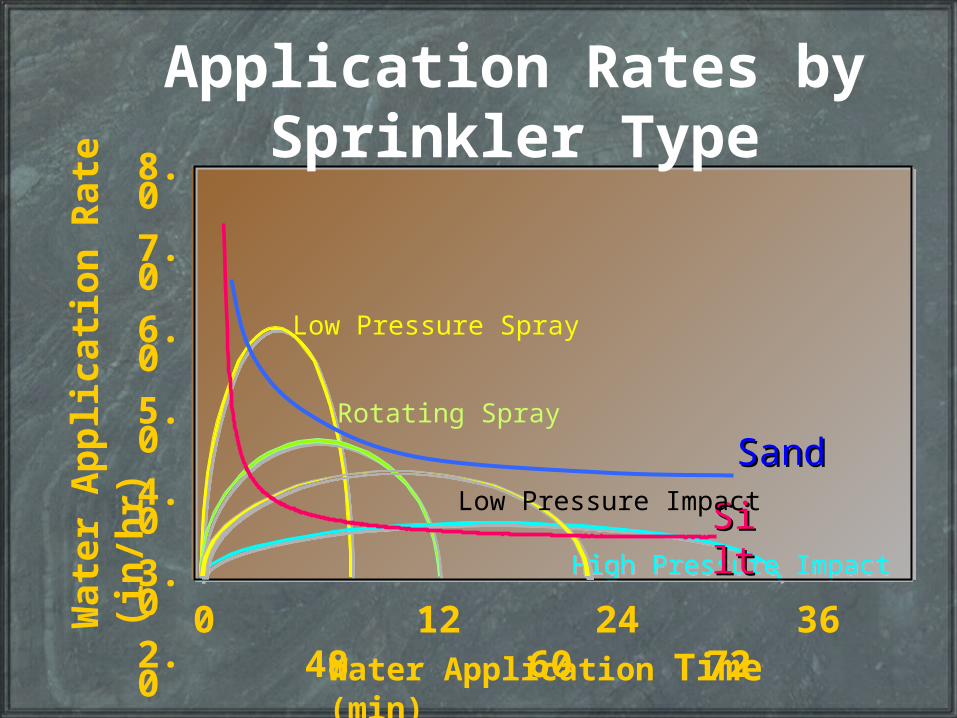
High Pressure ImpactHigh Pressure Impact
SandSand
SiltSilt
Water Application Time (min)
Wat
er A
pp
lica
tion
Rat
e (i
n/h
r) 8.0
7.0
6.0
5.0
4.0
3.0
2.0
1.0
0.00 12 24 36 48 60 72
Application Rates by Sprinkler Type
Low Pressure Spray
Rotating Spray
Low Pressure Impact
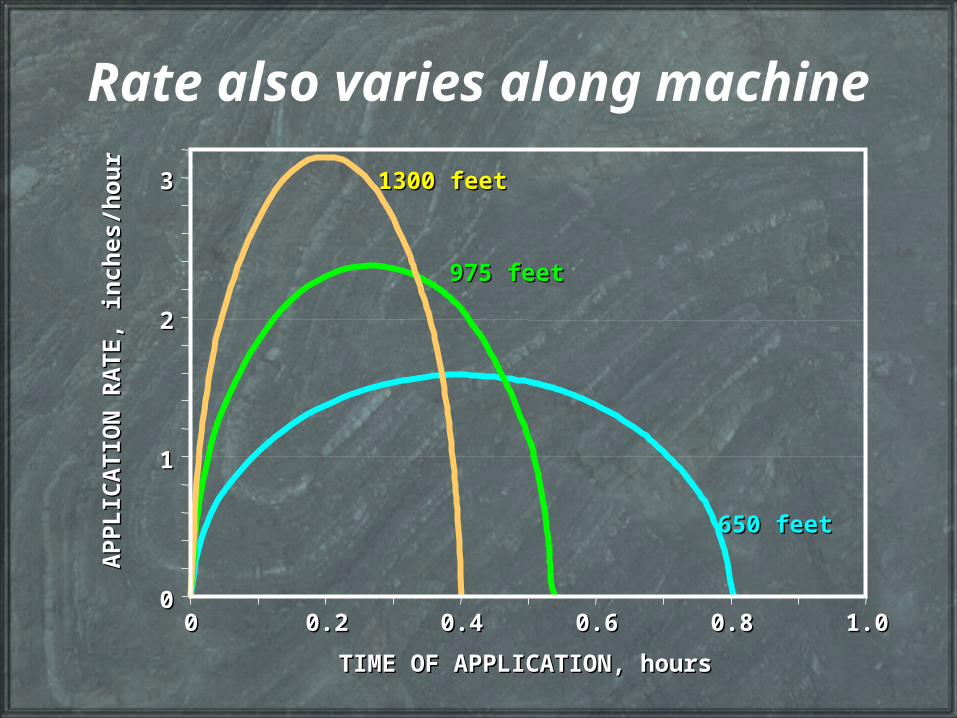
Rate also varies along machine
00 0.20.2 0.40.4 0.60.6 0.80.8 1.01.0
33
22
11
00
1300 feet1300 feet
650 feet650 feet
975 feet975 feet
TIME OF APPLICATION, hoursTIME OF APPLICATION, hours
AP
PL
ICA
TIO
N R
AT
E,
inch
es/h
ou
rA
PP
LIC
AT
ION
RA
TE
, in
ches
/ho
ur
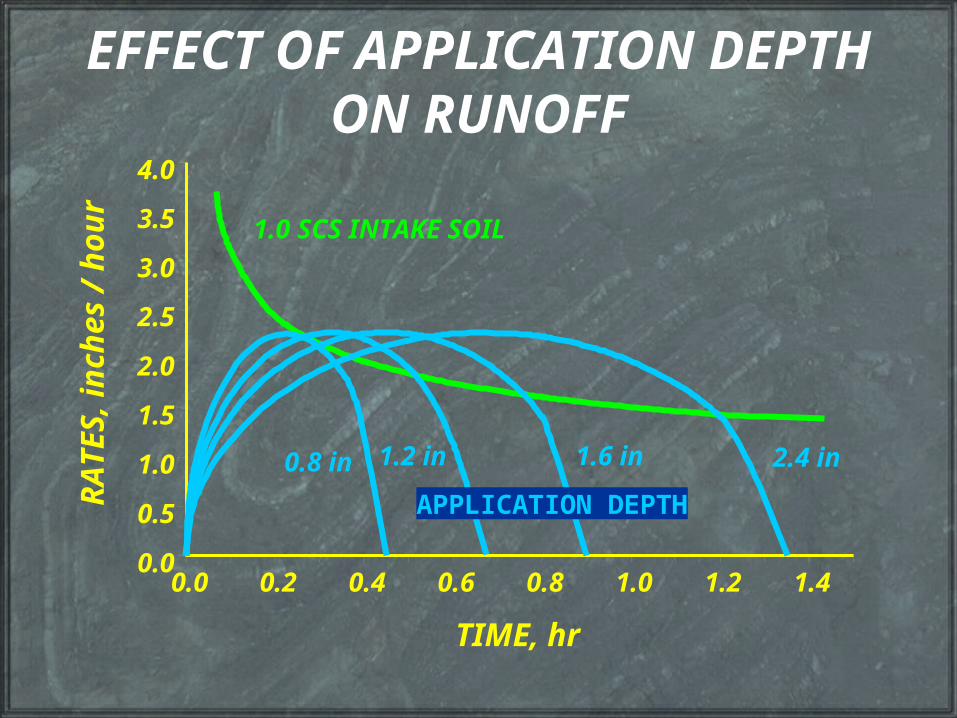
EFFECT OF APPLICATION DEPTH ON RUNOFF
0.0 0.2 0.4 0.6 0.8 1.0 1.2 1.4
4.0
3.5
3.0
2.5
2.0
1.5
1.0
0.5
0.0
1.0 SCS INTAKE SOIL
0.8 in 1.2 in 1.6 in 2.4 in
TIME, hr
RA
TE
S,
inch
es /
ho
ur
APPLICATION DEPTH
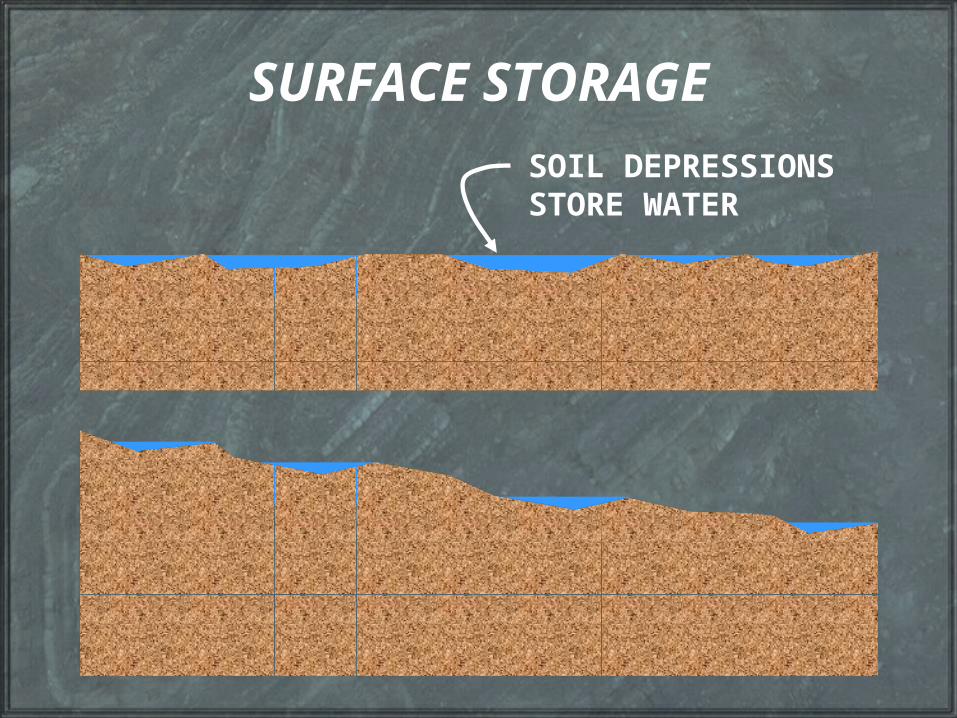
SURFACE STORAGE
SOIL DEPRESSIONSSTORE WATER
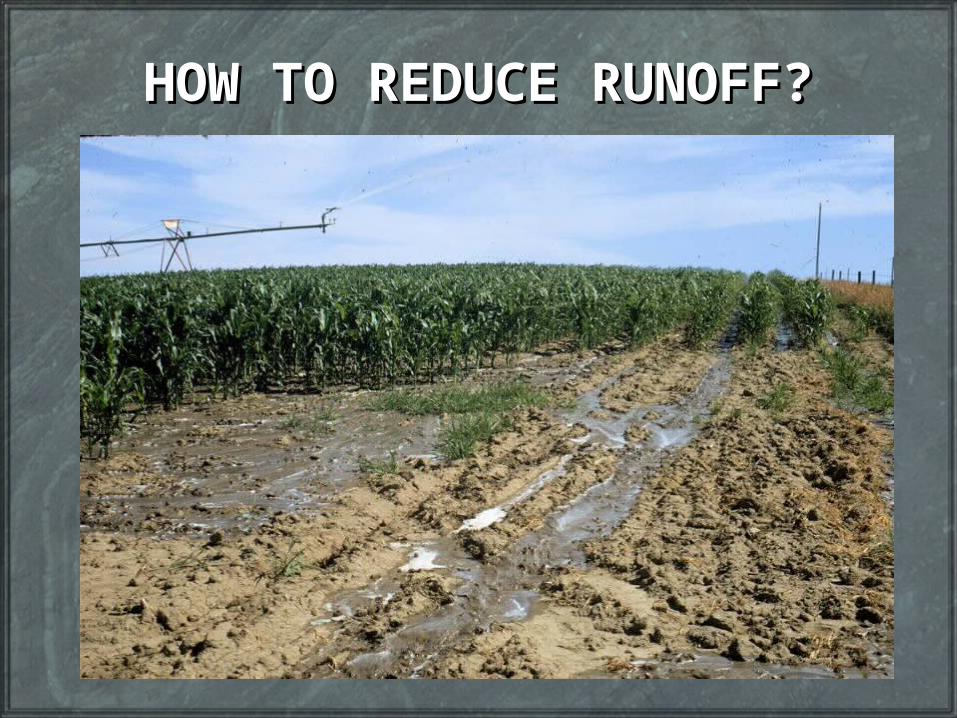
HOW TO REDUCE RUNOFF?HOW TO REDUCE RUNOFF?
1. REDUCE SYSTEM CAPACITY1. REDUCE SYSTEM CAPACITY- irrigate more hours per year- irrigate more hours per year- increase chances of getting behind- increase chances of getting behind
2. REDUCE APPLICATION DEPTH2. REDUCE APPLICATION DEPTH– make more revolutions per yearmake more revolutions per year
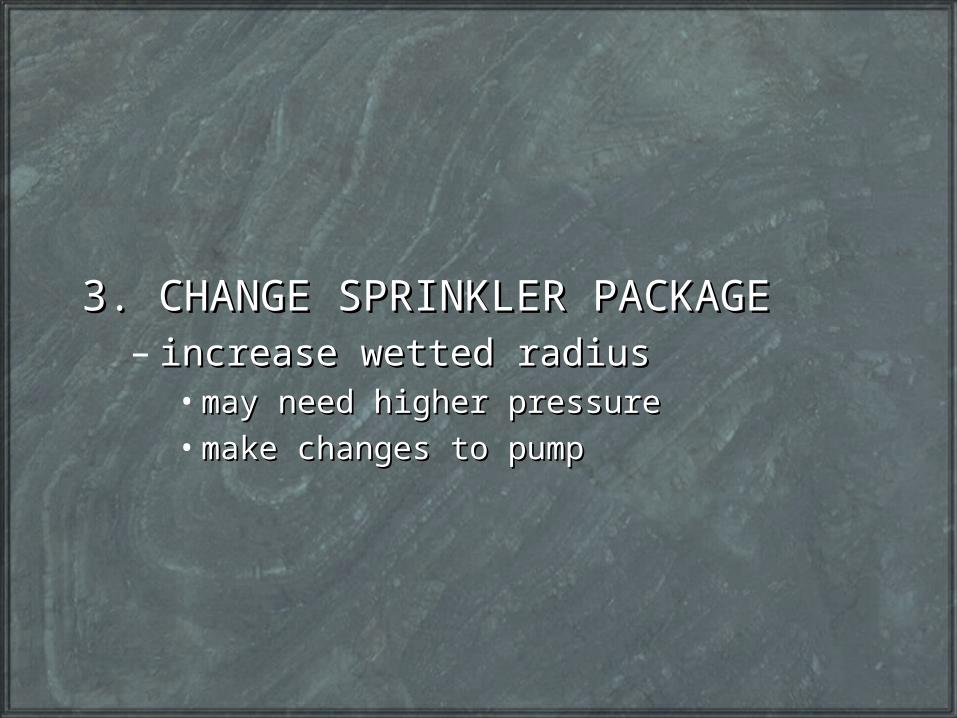
3. CHANGE SPRINKLER PACKAGE3. CHANGE SPRINKLER PACKAGE– increase wetted radiusincrease wetted radius
• may need higher pressuremay need higher pressure• make changes to pumpmake changes to pump
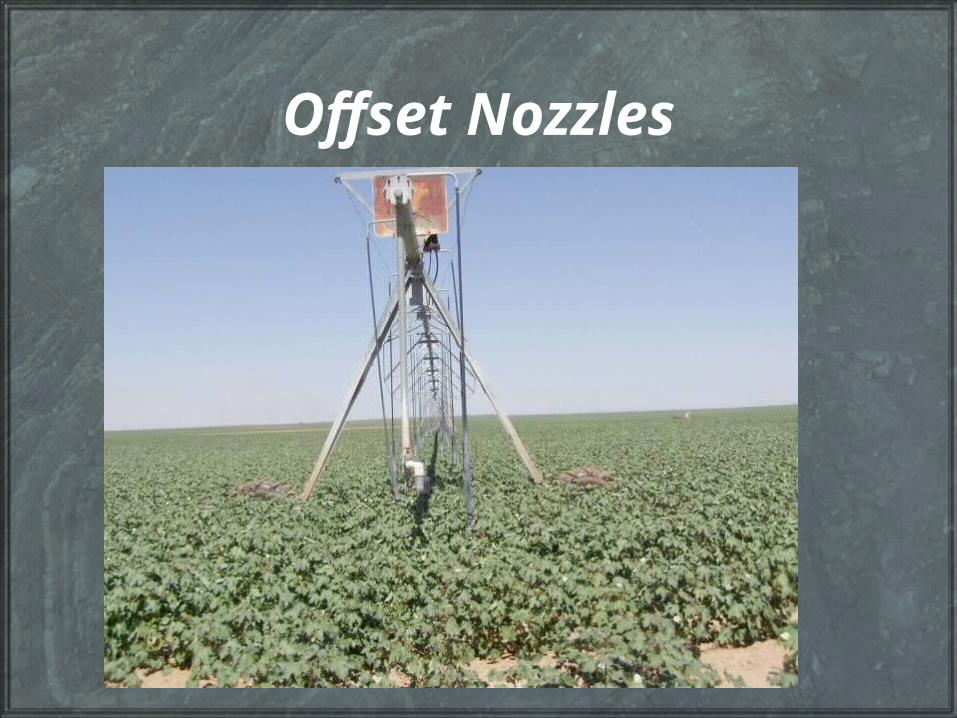
Offset Nozzles
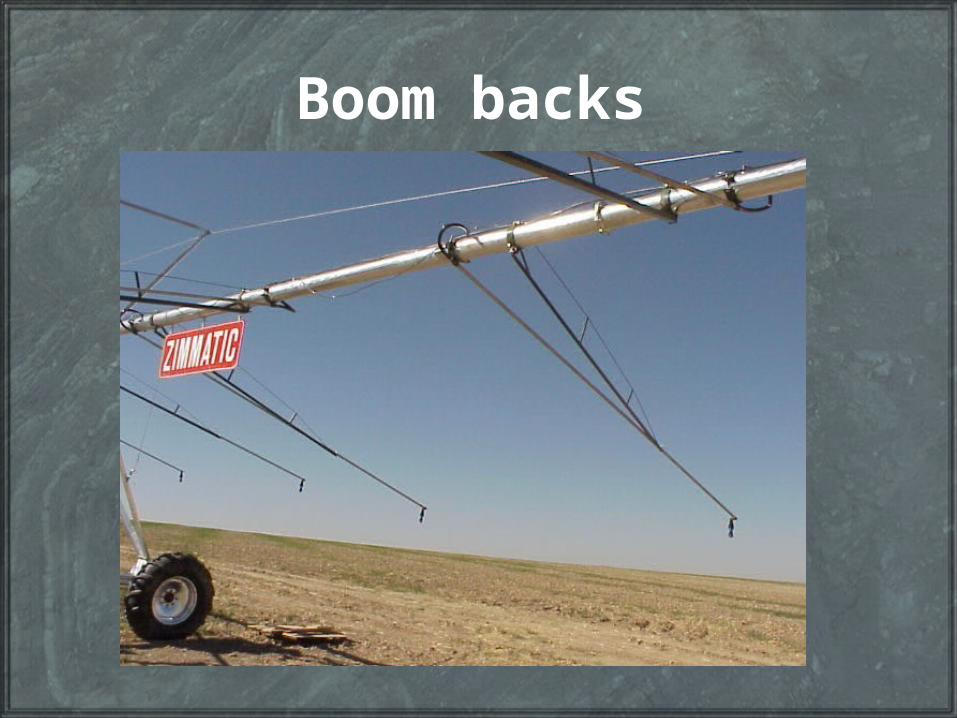
Boom backs
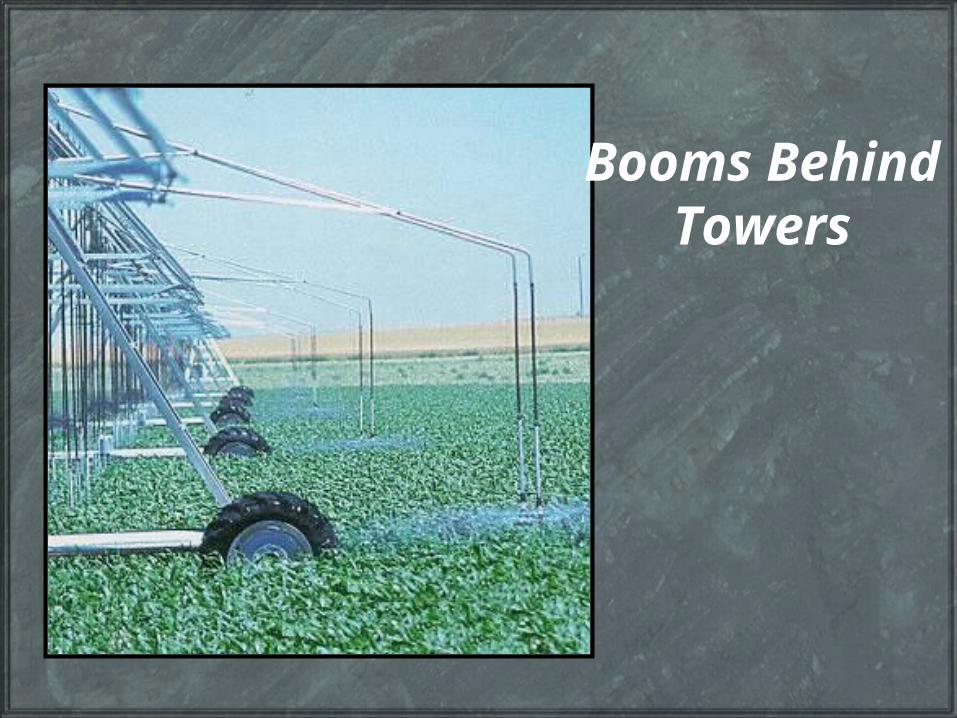
Booms Behind Towers
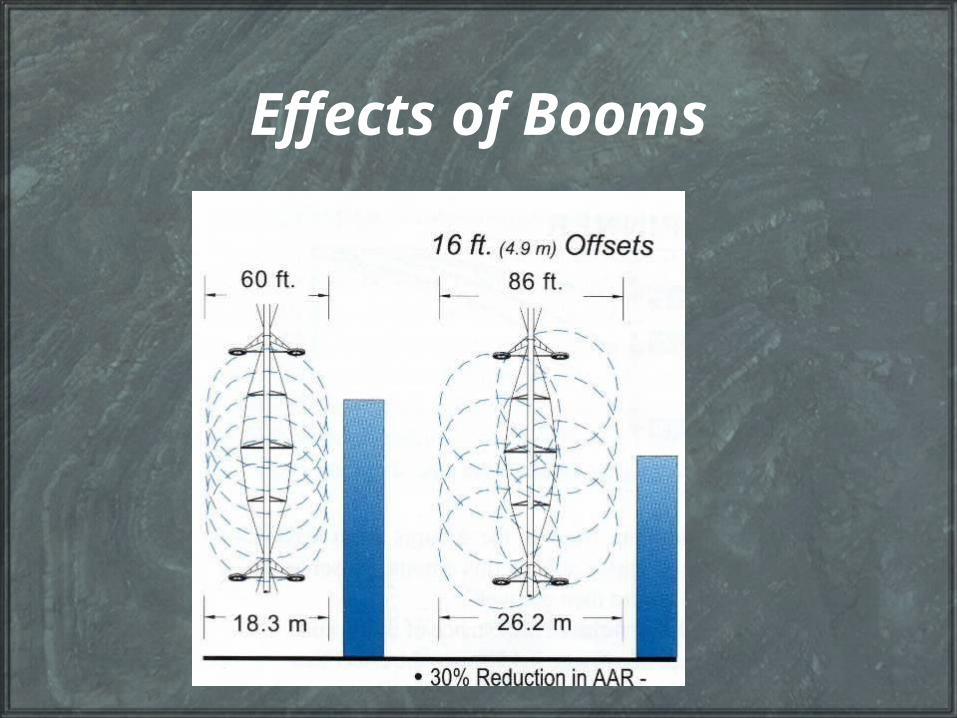
Effects of Booms
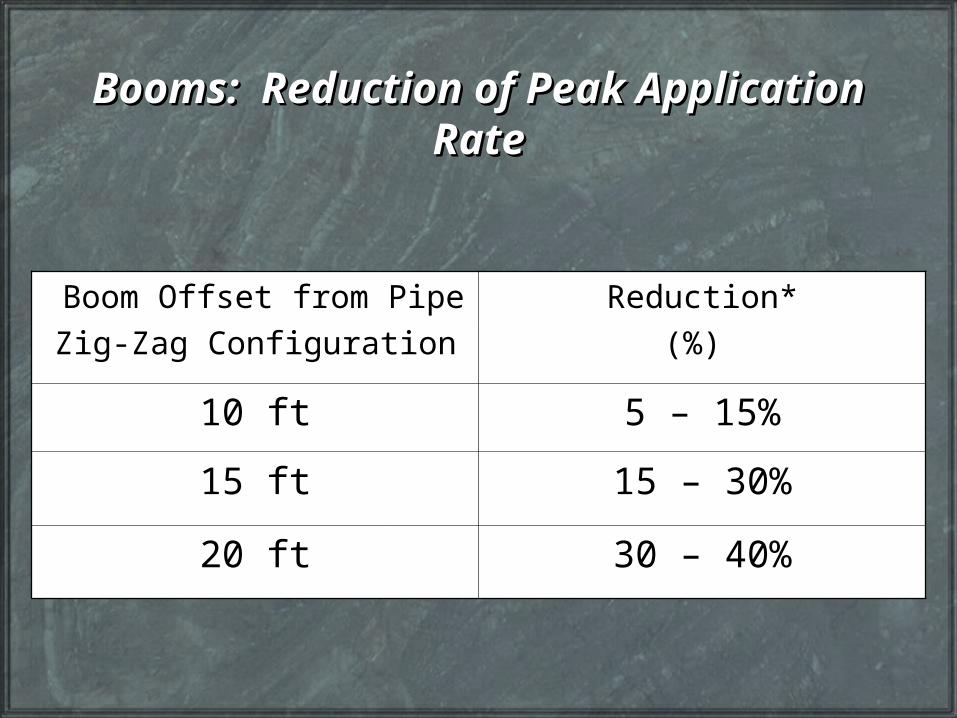
Booms: Reduction of Peak Booms: Reduction of Peak Application RateApplication Rate
Boom Offset from Pipe
Zig-Zag Configuration
Reduction*
(%)
10 ft 5 – 15%
15 ft 15 – 30%
20 ft 30 – 40%
4. INCREASE SURFACE STORAGE4. INCREASE SURFACE STORAGE– extra tillage, fuel, time, weed controlextra tillage, fuel, time, weed control
--
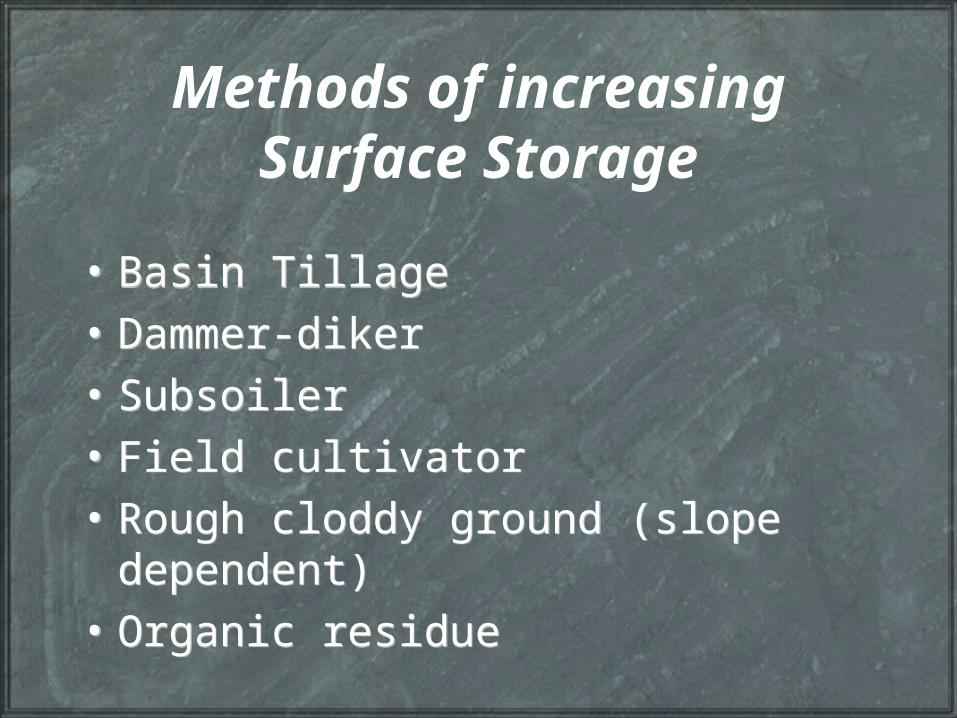
Methods of increasing Surface Storage
• Basin Tillage
• Dammer-diker
• Subsoiler
• Field cultivator
• Rough cloddy ground (slope dependent)
• Organic residue
• Basin Tillage
• Dammer-diker
• Subsoiler
• Field cultivator
• Rough cloddy ground (slope dependent)
• Organic residue
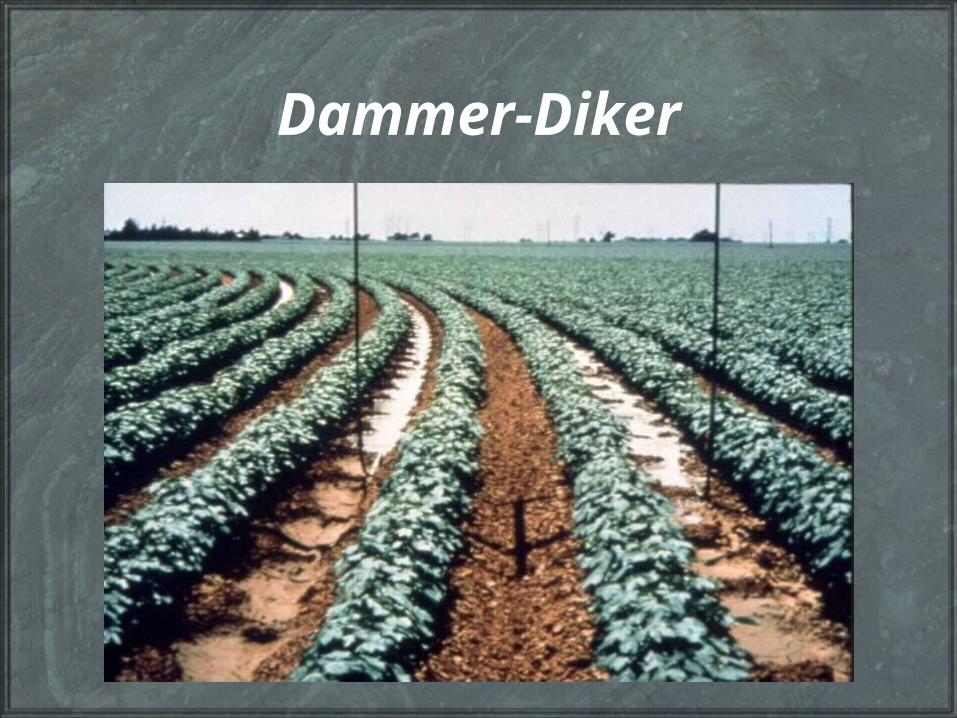
Dammer-Diker
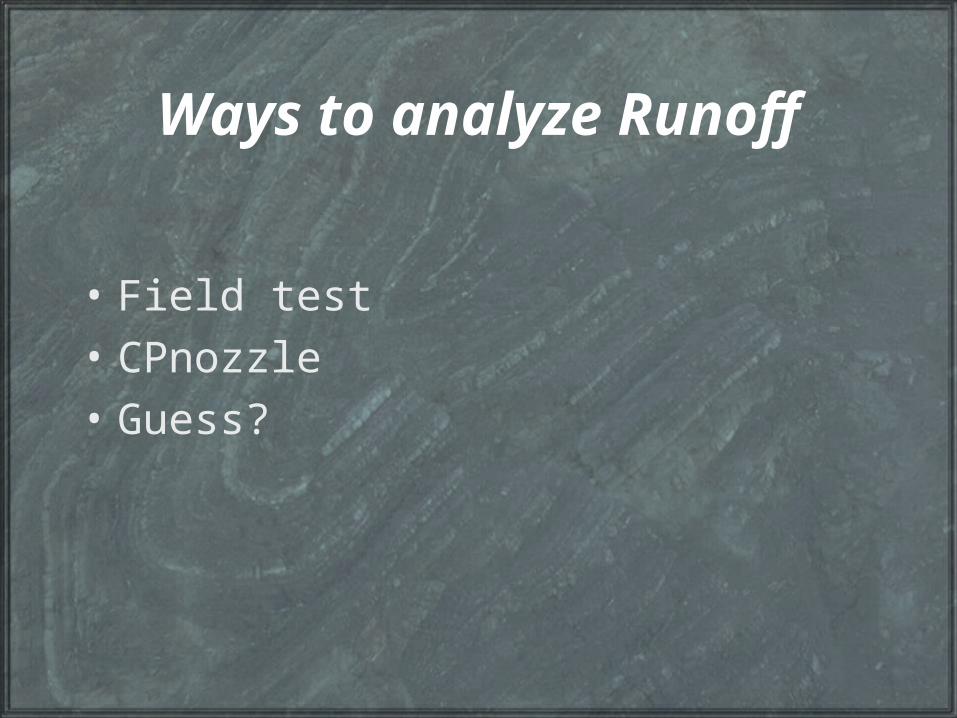
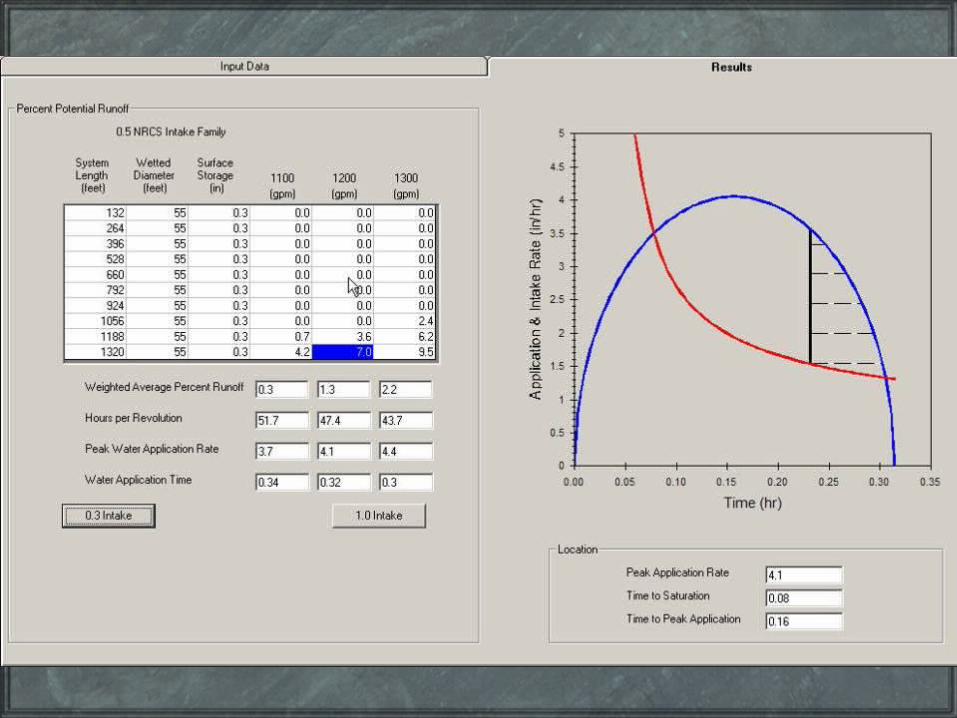
Ways to analyze Runoff
• Field test
• CPnozzle
• Guess?
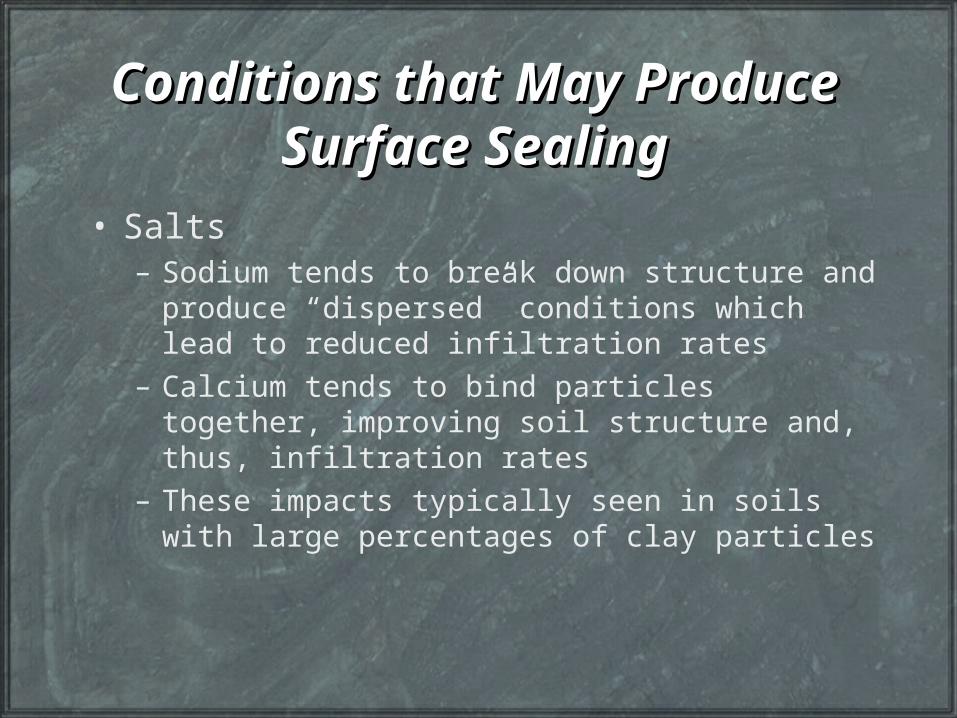
Conditions that May Produce Conditions that May Produce Surface SealingSurface Sealing
• Salts– Sodium tends to break down structure and
produce “dispersed” conditions which lead to reduced infiltration rates
– Calcium tends to bind particles together, improving soil structure and, thus, infiltration rates
– These impacts typically seen in soils with large percentages of clay particles
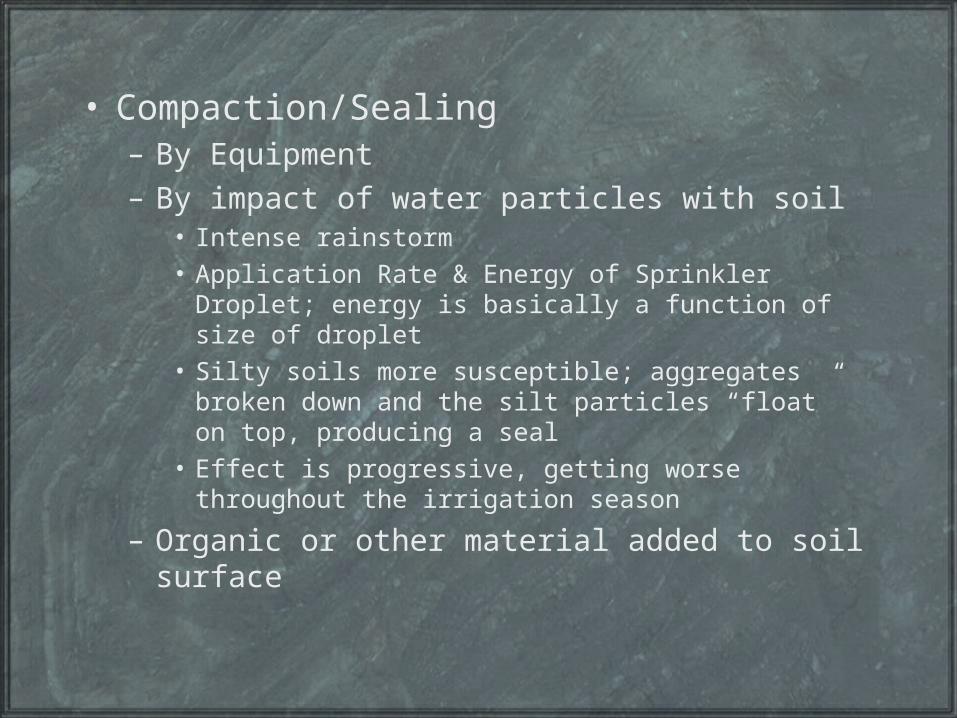
• Compaction/Sealing– By Equipment– By impact of water particles with soil
• Intense rainstorm• Application Rate & Energy of Sprinkler Droplet; energy is
basically a function of size of droplet• Silty soils more susceptible; aggregates broken down
and the silt particles “float” on top, producing a seal• Effect is progressive, getting worse throughout the
irrigation season
– Organic or other material added to soil surface
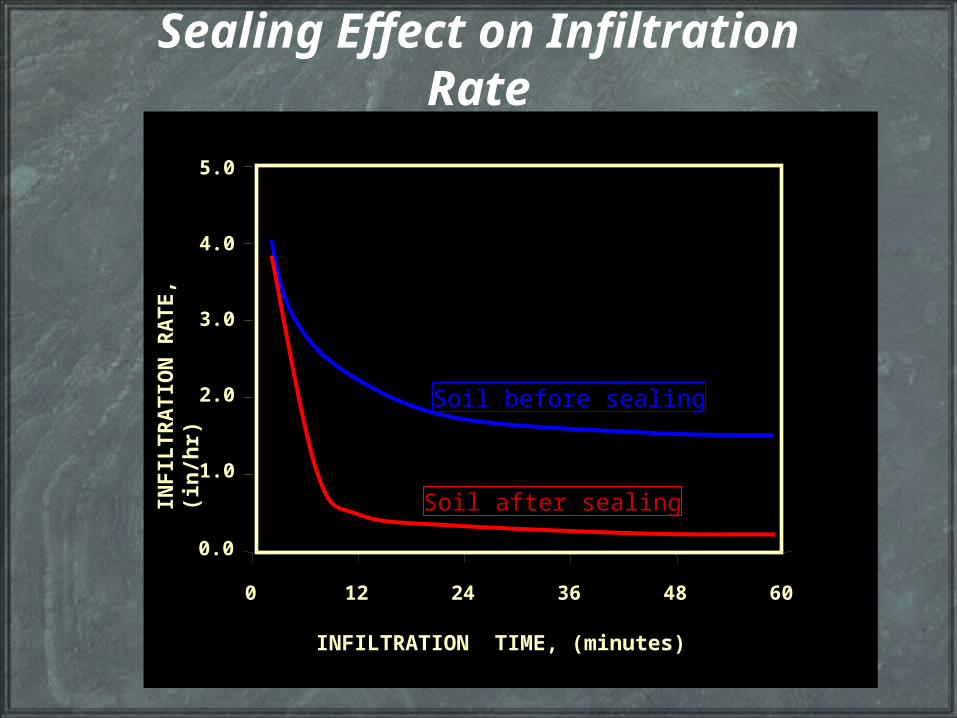
Sealing Effect on Infiltration Rate
0 12 24 36 48 60
5.0
4.0
3.0
2.0
1.0
0.0
INFILTRATION TIME, (minutes)
INF
ILT
RA
TIO
N R
AT
E, (
in/h
r)
Soil before sealing
Soil after sealing
Special Application
• Fertilizer application
• Pesticide application
• Waste Water Application
Linears or Laterals
• Require Guidance system
• Limited by water source
• Harder to match frequency with crop and field limitations
• More problems with runoff
• More expensive
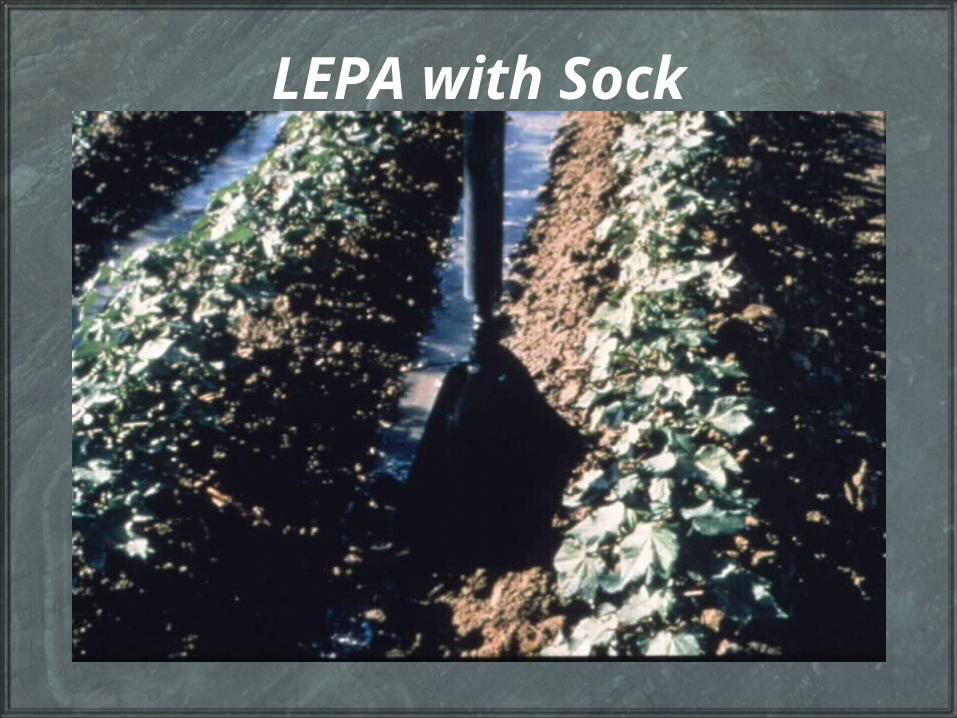
LEPA with Sock
Question?

Thanks

Electrical
• Electrical design of a system is dependent on a number of factors . These include length of system, number of drive units, options (hi-speed and or booster pump) and voltage available at the pivot.
• Electrically driven components (motors) require a certain quantity of electricity called Amps and the electricity must be a certain pressure (Volts) much the same as the hydraulic supply to a system.
• Several things are needed for the electrical design of a Pivot– amp load– voltage drop with given wire size– voltage supply at the pivot and end tower
voltage requirement
• System amperage is based on electrical load of the system, i.e., number of drive motors, hi speed, booster pumps, etc.
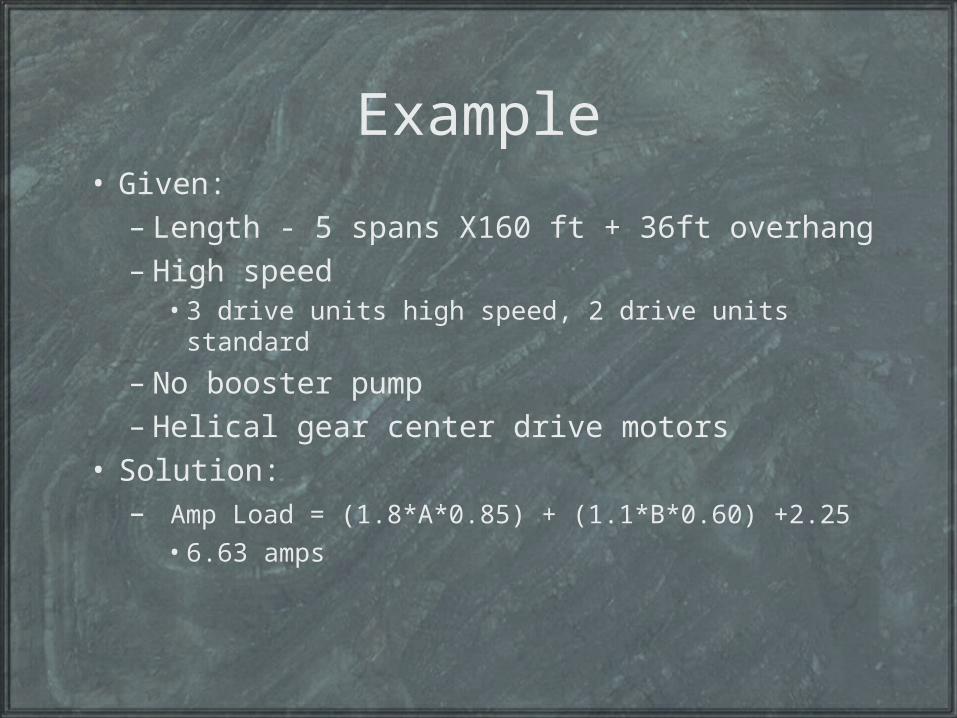
Example• Given:
– Length - 5 spans X160 ft + 36ft overhang– High speed
• 3 drive units high speed, 2 drive units standard
– No booster pump– Helical gear center drive motors
• Solution:– Amp Load = (1.8*A*0.85) + (1.1*B*0.60) +2.25
• 6.63 amps
Determining System Voltage Drop
• Voltage drop for the system is calculated to insure a minimum of 440 volts on pivots at the last drive unit
– 440 + system voltage drop = Minimum pivot supply voltage
Example• Given: High speed model with 2Hp booster pump,
180’ spans (1260’), 3 standard speed drive units, 4 high speed drive units, and a 13.7 amp load.
• Solution: from graph #2 for 12ga. wire
voltage drop = 30 volts
440+30 = 470 volts at pivot
Probably need some 10ga wire to be safe
• How about voltage drop from Transformer out to the pivot point