Embed Size (px)
Citation preview
Plan First Family Planning Program
1
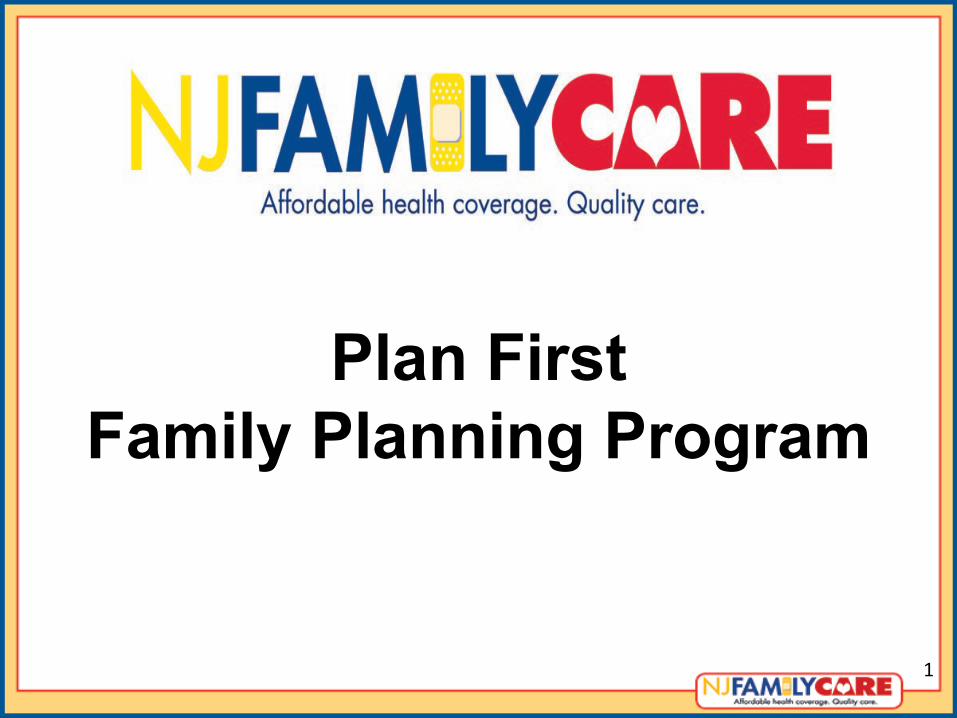
Background • Governor Murphy signed into law family
planning legislation to increase access to family planning services in Medicaid for individuals up to 200% FPL.
• Current estimates 31,000 to 55,000 enrolled over five years.
2
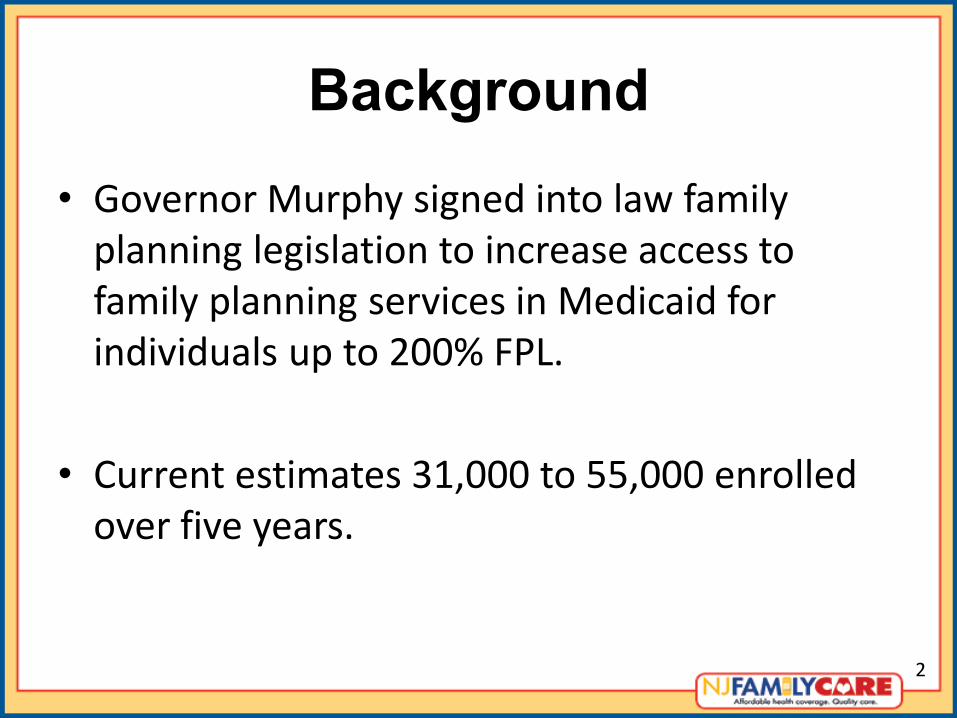
Expanding Access to Family Planning Services (proposed)
• Family Planning services are a mandatory Medicaid service, but states have significant discretion in which populations are eligible and what services are provided.
• In March of 2018, legislation passed to expand Medicaid coverage for family planning services up to 200% FPL.
• Eligibility: – Women and Men Individuals with incomes between 138%
and 205% of the Federal Poverty Level. – Must be a New Jersey state resident, citizen or qualified
alien.
• NEXT STEPS: – Provider trainings will take place in September 2019. – Go live: October 1, 2019.
3
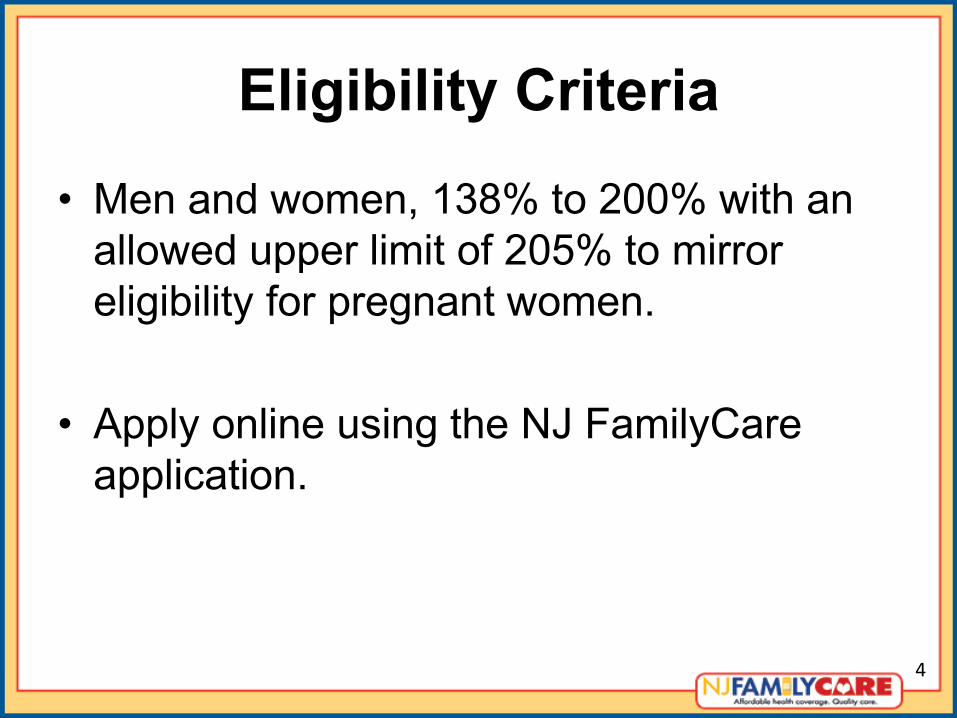
Eligibility Criteria
• Men and women, 138% to 200% with an allowed upper limit of 205% to mirror eligibility for pregnant women.
• Apply online using the NJ FamilyCare application.
4
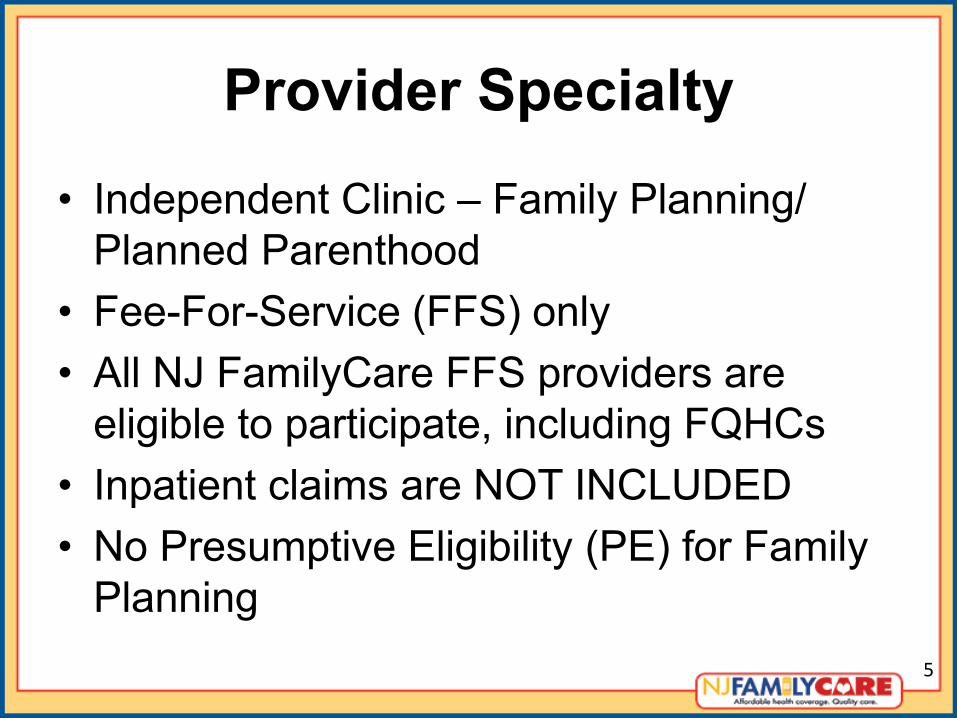
Provider Specialty
• Independent Clinic – Family Planning/ Planned Parenthood
• Fee-For-Service (FFS) only • All NJ FamilyCare FFS providers are
eligible to participate, including FQHCs • Inpatient claims are NOT INCLUDED • No Presumptive Eligibility (PE) for Family
Planning 5
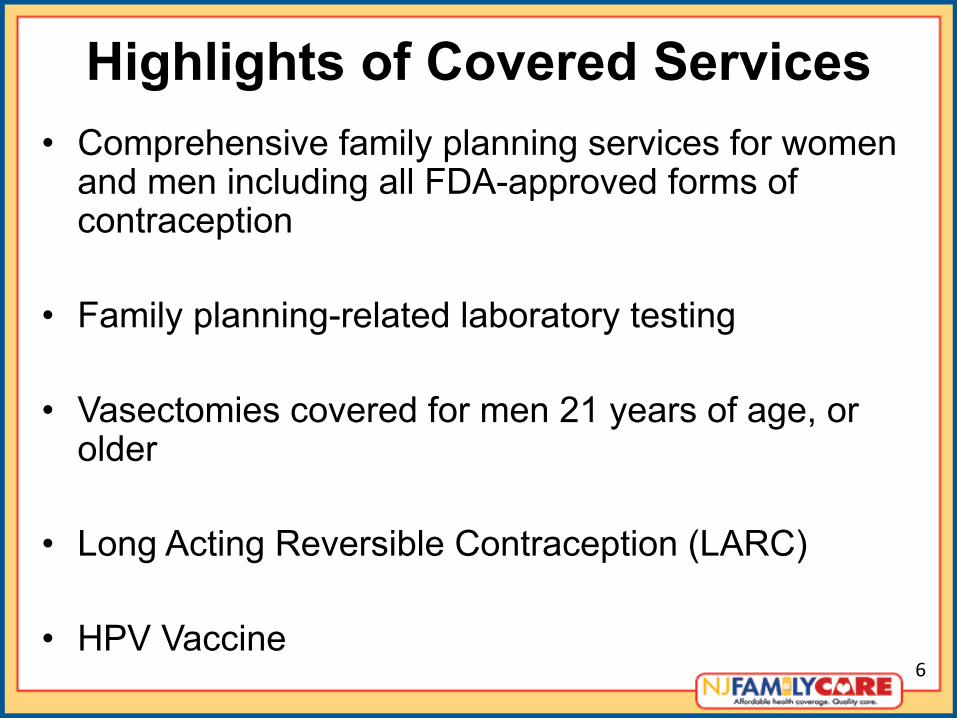
Highlights of Covered Services • Comprehensive family planning services for women
and men including all FDA-approved forms of contraception
• Family planning-related laboratory testing
• Vasectomies covered for men 21 years of age, or older
• Long Acting Reversible Contraception (LARC)
• HPV Vaccine 6
NJ FamilyCare Update
7
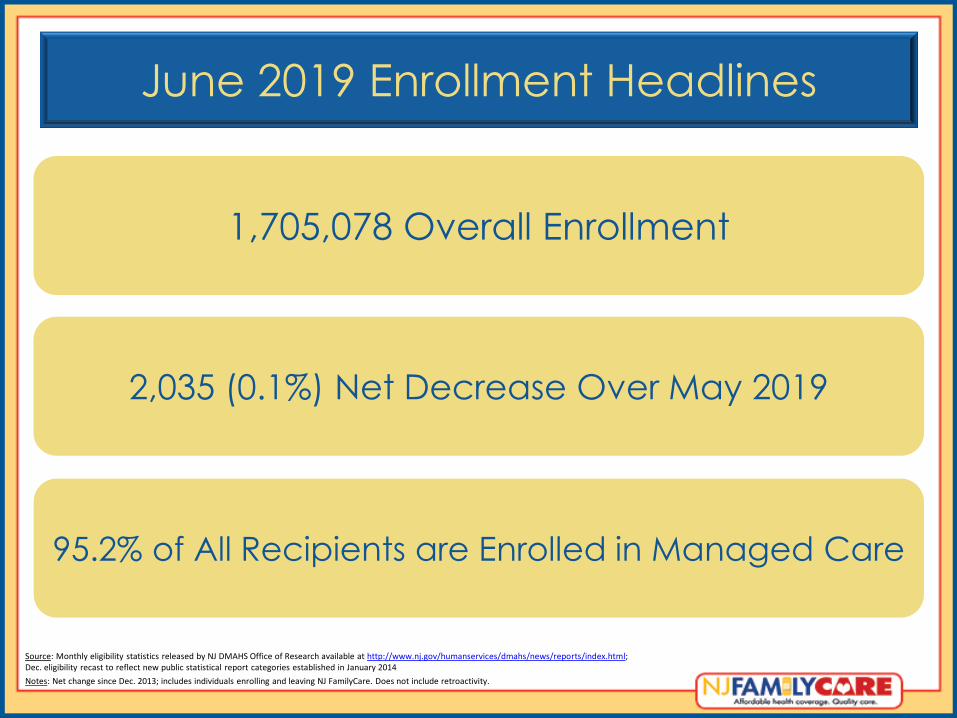
June 2019 Enrollment Headlines
1,705,078 Overall Enrollment
Source: Monthly eligibility statistics released by NJ DMAHS Office of Research available at http://www.nj.gov/humanservices/dmahs/news/reports/index.html; Dec. eligibility recast to reflect new public statistical report categories established in January 2014 Notes: Net change since Dec. 2013; includes individuals enrolling and leaving NJ FamilyCare. Does not include retroactivity.
95.2% of All Recipients are Enrolled in Managed Care
2,035 (0.1%) Net Decrease Over May 2019
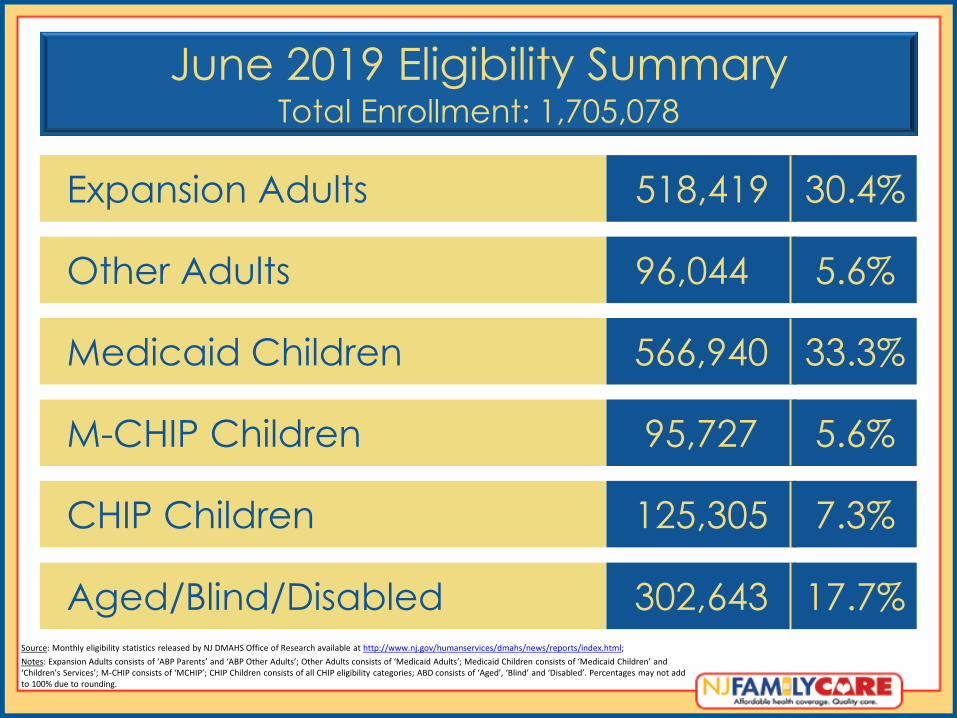
June 2019 Eligibility Summary Total Enrollment: 1,705,078
Source: Monthly eligibility statistics released by NJ DMAHS Office of Research available at http://www.nj.gov/humanservices/dmahs/news/reports/index.html; Notes: Expansion Adults consists of ‘ABP Parents’ and ‘ABP Other Adults’; Other Adults consists of ‘Medicaid Adults’; Medicaid Children consists of ‘Medicaid Children’ and ‘Children's Services’; M-CHIP consists of ‘MCHIP’; CHIP Children consists of all CHIP eligibility categories; ABD consists of ‘Aged’, ‘Blind’ and ‘Disabled’. Percentages may not add to 100% due to rounding.
Expansion Adults 518,419 30.4%
Other Adults 96,044 5.6%
Medicaid Children 566,940 33.3%
M-CHIP Children 95,727 5.6%
CHIP Children 125,305 7.3%
Aged/Blind/Disabled 302,643 17.7%
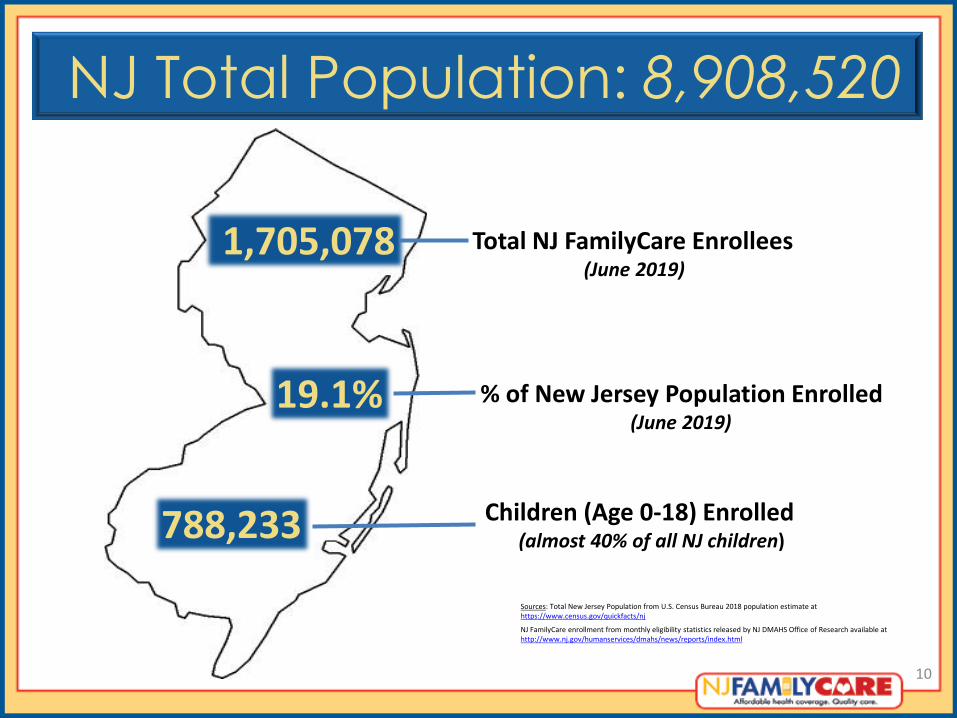
1,705,078
19.1%
788,233
NJ Total Population: 8,908,520
Sources: Total New Jersey Population from U.S. Census Bureau 2018 population estimate at https://www.census.gov/quickfacts/nj
NJ FamilyCare enrollment from monthly eligibility statistics released by NJ DMAHS Office of Research available at http://www.nj.gov/humanservices/dmahs/news/reports/index.html
Total NJ FamilyCare Enrollees (June 2019)
% of New Jersey Population Enrolled (June 2019)
Children (Age 0-18) Enrolled (almost 40% of all NJ children)
10
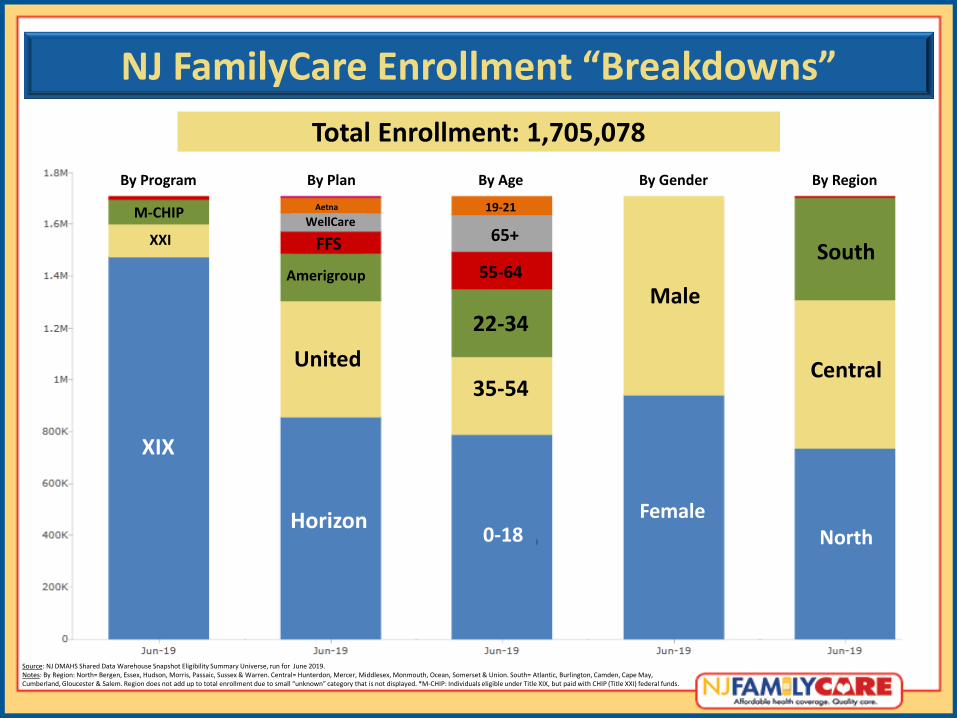
NJ FamilyCare Enrollment “Breakdowns”
Source: NJ DMAHS Shared Data Warehouse Snapshot Eligibility Summary Universe, run for June 2019. Notes: By Region: North= Bergen, Essex, Hudson, Morris, Passaic, Sussex & Warren. Central= Hunterdon, Mercer, Middlesex, Monmouth, Ocean, Somerset & Union. South= Atlantic, Burlington, Camden, Cape May, Cumberland, Gloucester & Salem. Region does not add up to total enrollment due to small “unknown” category that is not displayed. *M-CHIP: Individuals eligible under Title XIX, but paid with CHIP (Title XXI) federal funds.
Total Enrollment: 1,705,078 By Age By Gender By Plan By Program By Region
Aetna
XIX
Horizon North
Female 0-18
XXI
United
Male
35-54 Central
South
22-34
Amerigroup
FFS 55-64
M-CHIP 65+
WellCare 19-21
12
Census 2020
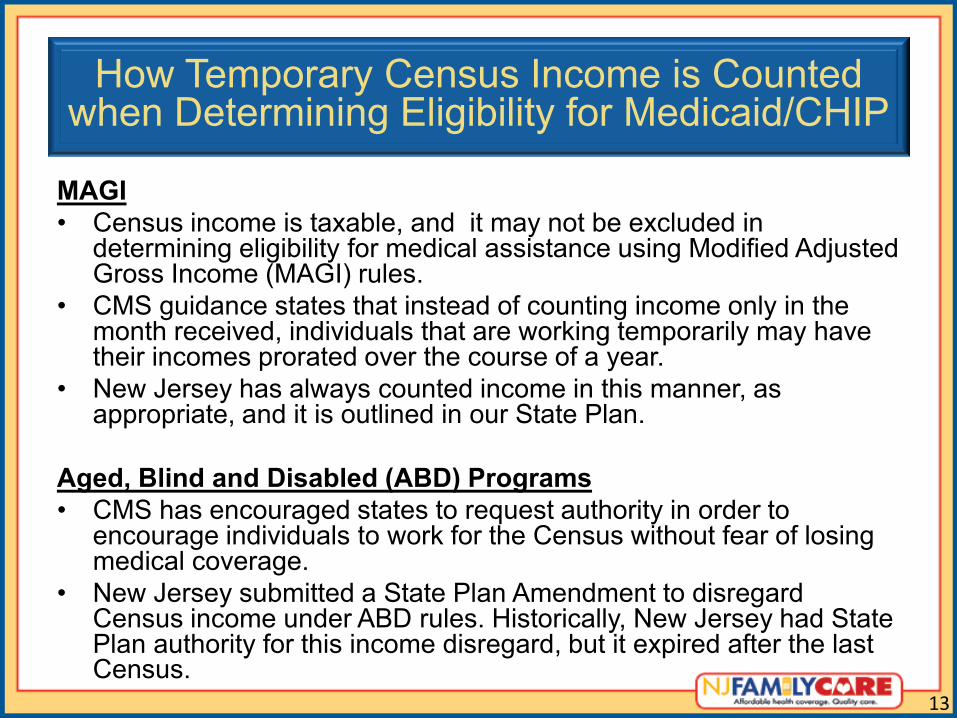
MAGI • Census income is taxable, and it may not be excluded in
determining eligibility for medical assistance using Modified Adjusted Gross Income (MAGI) rules.
• CMS guidance states that instead of counting income only in the month received, individuals that are working temporarily may have their incomes prorated over the course of a year.
• New Jersey has always counted income in this manner, as appropriate, and it is outlined in our State Plan.
Aged, Blind and Disabled (ABD) Programs • CMS has encouraged states to request authority in order to
encourage individuals to work for the Census without fear of losing medical coverage.
• New Jersey submitted a State Plan Amendment to disregard Census income under ABD rules. Historically, New Jersey had State Plan authority for this income disregard, but it expired after the last Census.
13
How Temporary Census Income is Counted when Determining Eligibility for Medicaid/CHIP
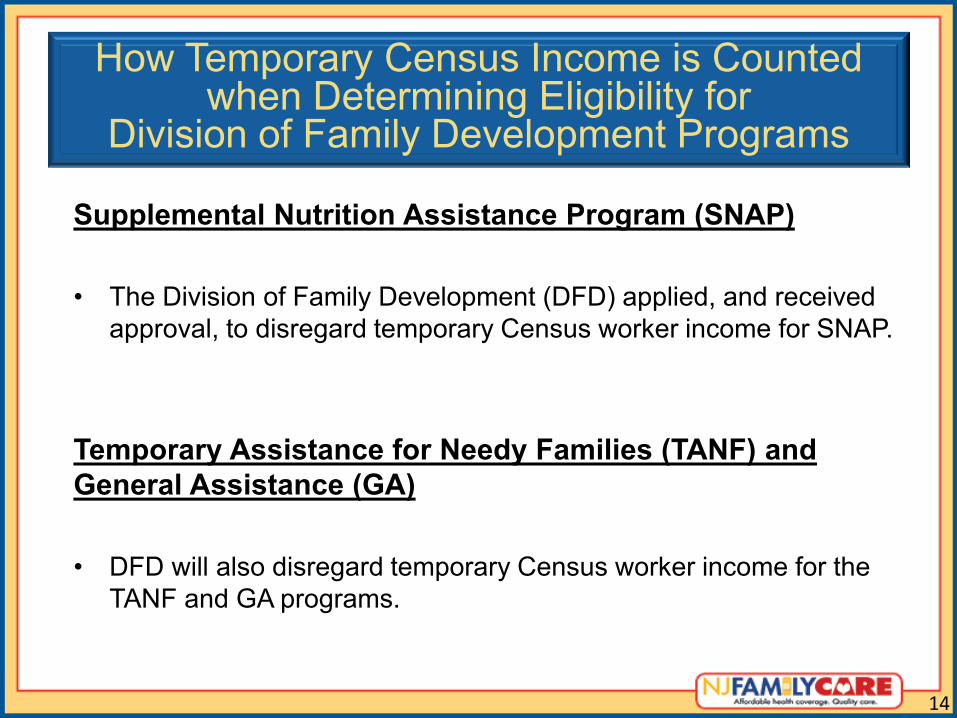
Supplemental Nutrition Assistance Program (SNAP) • The Division of Family Development (DFD) applied, and received
approval, to disregard temporary Census worker income for SNAP. Temporary Assistance for Needy Families (TANF) and General Assistance (GA) • DFD will also disregard temporary Census worker income for the
TANF and GA programs.
14
How Temporary Census Income is Counted when Determining Eligibility for
Division of Family Development Programs
15
Long Term Care and Managed Long Term Services & Supports
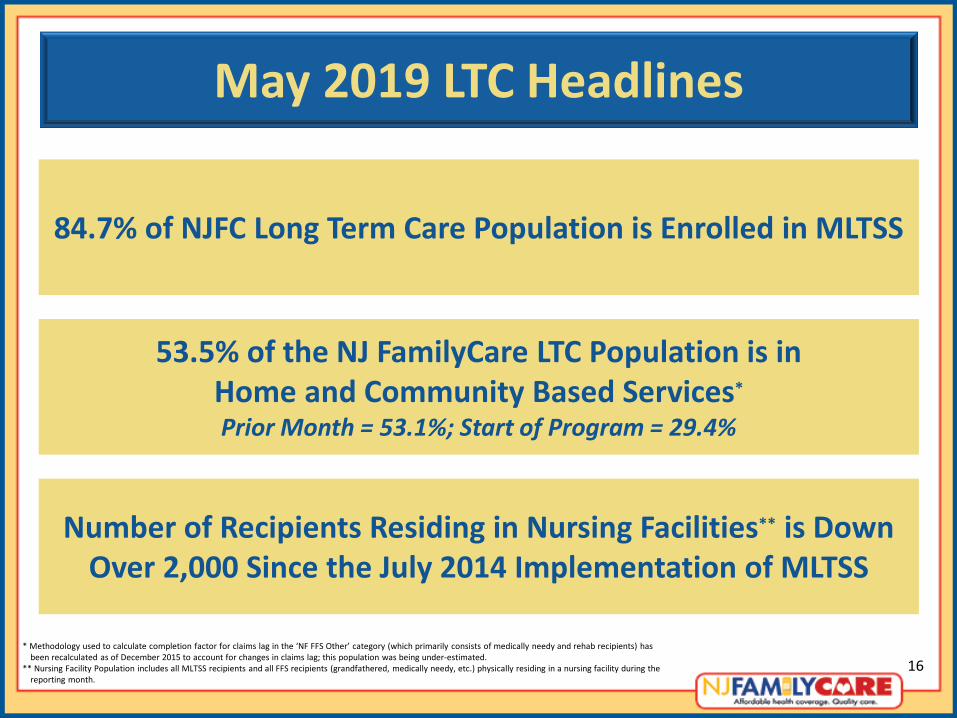
May 2019 LTC Headlines
53.5% of the NJ FamilyCare LTC Population is in Home and Community Based Services* Prior Month = 53.1%; Start of Program = 29.4%
84.7% of NJFC Long Term Care Population is Enrolled in MLTSS
* Methodology used to calculate completion factor for claims lag in the ‘NF FFS Other’ category (which primarily consists of medically needy and rehab recipients) has been recalculated as of December 2015 to account for changes in claims lag; this population was being under-estimated.
** Nursing Facility Population includes all MLTSS recipients and all FFS recipients (grandfathered, medically needy, etc.) physically residing in a nursing facility during the reporting month.
Number of Recipients Residing in Nursing Facilities** is Down Over 2,000 Since the July 2014 Implementation of MLTSS
16
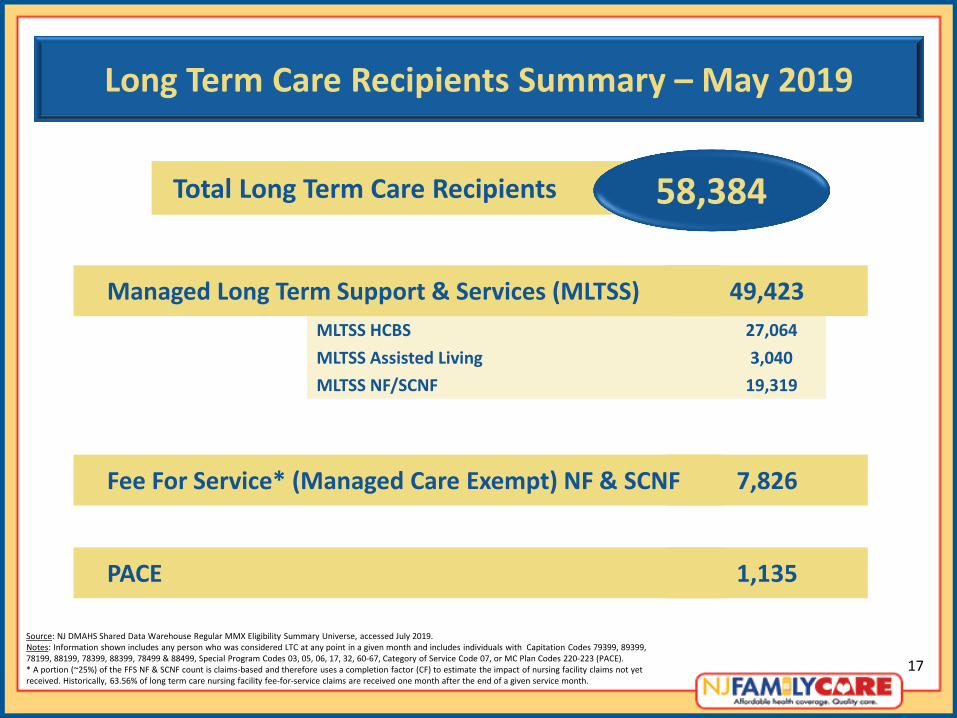
Total Long Term Care Recipients 58,384
MLTSS HCBS 27,064 MLTSS Assisted Living 3,040
7,826
49,423
Fee For Service* (Managed Care Exempt) NF & SCNF
Managed Long Term Support & Services (MLTSS)
Long Term Care Recipients Summary – May 2019
Source: NJ DMAHS Shared Data Warehouse Regular MMX Eligibility Summary Universe, accessed July 2019. Notes: Information shown includes any person who was considered LTC at any point in a given month and includes individuals with Capitation Codes 79399, 89399, 78199, 88199, 78399, 88399, 78499 & 88499, Special Program Codes 03, 05, 06, 17, 32, 60-67, Category of Service Code 07, or MC Plan Codes 220-223 (PACE). * A portion (~25%) of the FFS NF & SCNF count is claims-based and therefore uses a completion factor (CF) to estimate the impact of nursing facility claims not yet received. Historically, 63.56% of long term care nursing facility fee-for-service claims are received one month after the end of a given service month.
MLTSS NF/SCNF 19,319
1,135 PACE
17
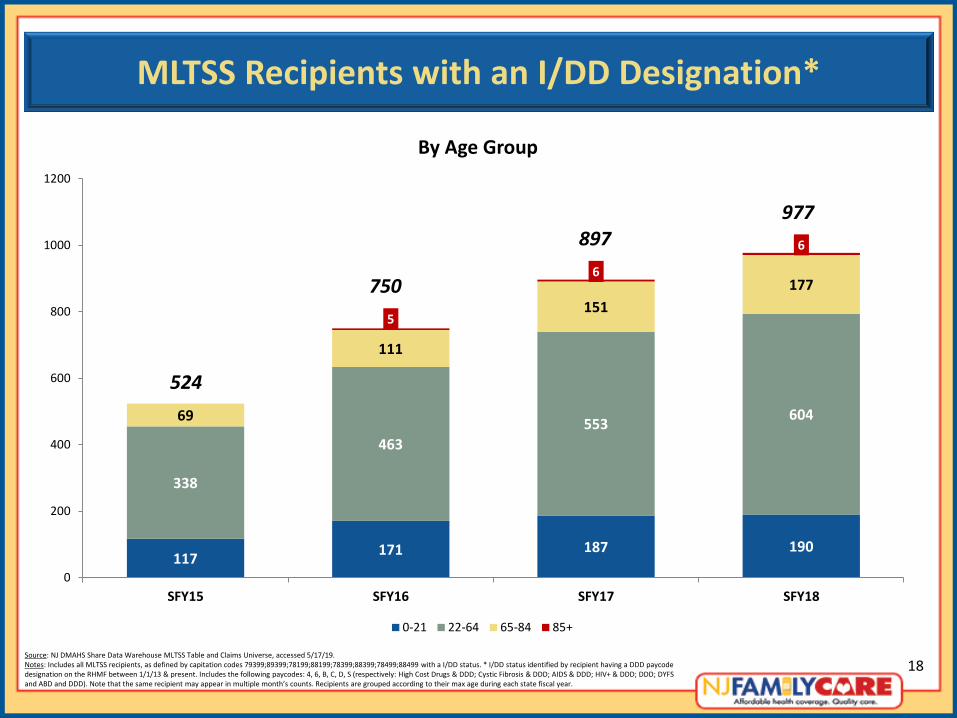
MLTSS Recipients with an I/DD Designation*
Source: NJ DMAHS Share Data Warehouse MLTSS Table and Claims Universe, accessed 5/17/19. Notes: Includes all MLTSS recipients, as defined by capitation codes 79399;89399;78199;88199;78399;88399;78499;88499 with a I/DD status. * I/DD status identified by recipient having a DDD paycode designation on the RHMF between 1/1/13 & present. Includes the following paycodes: 4, 6, B, C, D, S (respectively: High Cost Drugs & DDD; Cystic Fibrosis & DDD; AIDS & DDD; HIV+ & DDD; DDD; DYFS and ABD and DDD). Note that the same recipient may appear in multiple month’s counts. Recipients are grouped according to their max age during each state fiscal year.
117 171 187 190
338
463 553 604 69
111
151 177
5
6
6
0
200
400
600
800
1000
1200
SFY15 SFY16 SFY17 SFY18
By Age Group
0-21 22-64 65-84 85+
524
750
977 897
18
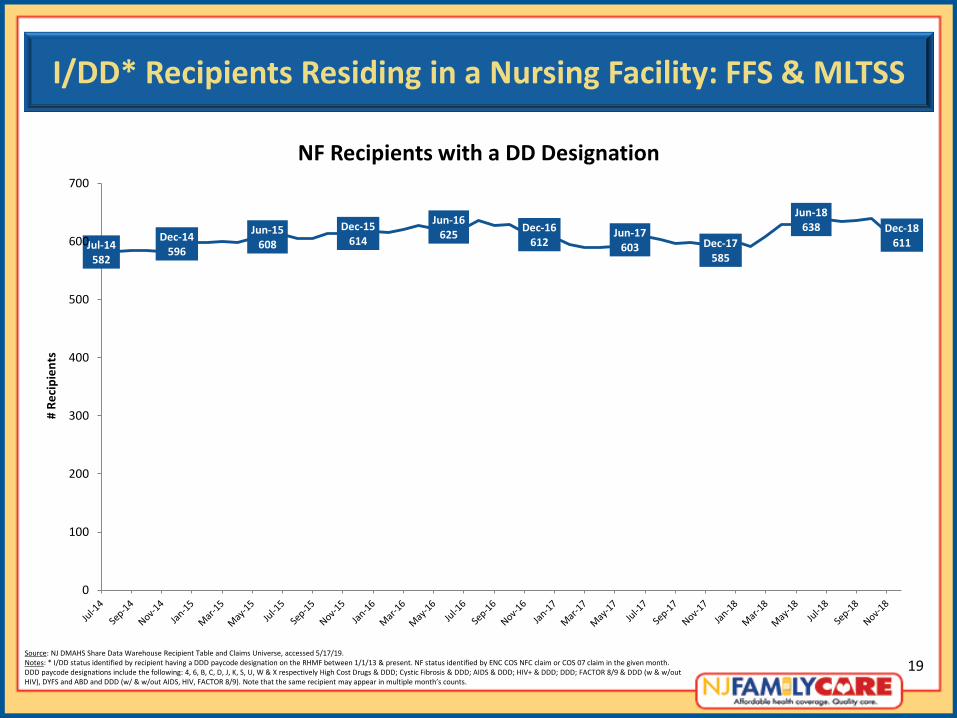
I/DD* Recipients Residing in a Nursing Facility: FFS & MLTSS
Source: NJ DMAHS Share Data Warehouse Recipient Table and Claims Universe, accessed 5/17/19. Notes: * I/DD status identified by recipient having a DDD paycode designation on the RHMF between 1/1/13 & present. NF status identified by ENC COS NFC claim or COS 07 claim in the given month. DDD paycode designations include the following: 4, 6, B, C, D, J, K, S, U, W & X respectively High Cost Drugs & DDD; Cystic Fibrosis & DDD; AIDS & DDD; HIV+ & DDD; DDD; FACTOR 8/9 & DDD (w & w/out HIV), DYFS and ABD and DDD (w/ & w/out AIDS, HIV, FACTOR 8/9). Note that the same recipient may appear in multiple month’s counts.
Jul-14 582
Dec-14 596
Jun-15 608
Dec-15 614
Jun-16 625 Dec-16
612 Jun-17
603 Dec-17 585
Jun-18 638 Dec-18
611
0
100
200
300
400
500
600
700
# Re
cipi
ents
NF Recipients with a DD Designation
19
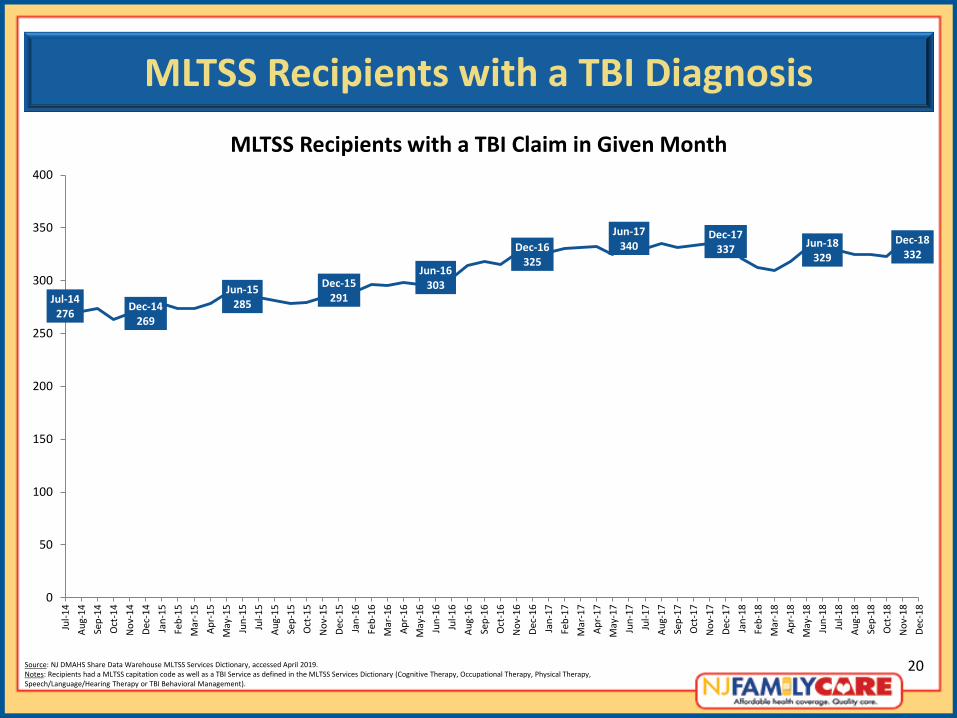
MLTSS Recipients with a TBI Diagnosis
Source: NJ DMAHS Share Data Warehouse MLTSS Services Dictionary, accessed April 2019. Notes: Recipients had a MLTSS capitation code as well as a TBI Service as defined in the MLTSS Services Dictionary (Cognitive Therapy, Occupational Therapy, Physical Therapy, Speech/Language/Hearing Therapy or TBI Behavioral Management).
Jul-14 276 Dec-14
269
Jun-15 285
Dec-15 291
Jun-16 303
Dec-16 325
Jun-17 340
Dec-17 337 Jun-18
329 Dec-18
332
0
50
100
150
200
250
300
350
400
Jul-1
4Au
g-14
Sep-
14O
ct-1
4N
ov-1
4De
c-14
Jan-
15Fe
b-15
Mar
-15
Apr-
15M
ay-1
5Ju
n-15
Jul-1
5Au
g-15
Sep-
15O
ct-1
5N
ov-1
5De
c-15
Jan-
16Fe
b-16
Mar
-16
Apr-
16M
ay-1
6Ju
n-16
Jul-1
6Au
g-16
Sep-
16O
ct-1
6N
ov-1
6De
c-16
Jan-
17Fe
b-17
Mar
-17
Apr-
17M
ay-1
7Ju
n-17
Jul-1
7Au
g-17
Sep-
17O
ct-1
7N
ov-1
7De
c-17
Jan-
18Fe
b-18
Mar
-18
Apr-
18M
ay-1
8Ju
n-18
Jul-1
8Au
g-18
Sep-
18O
ct-1
8N
ov-1
8De
c-18
MLTSS Recipients with a TBI Claim in Given Month
20
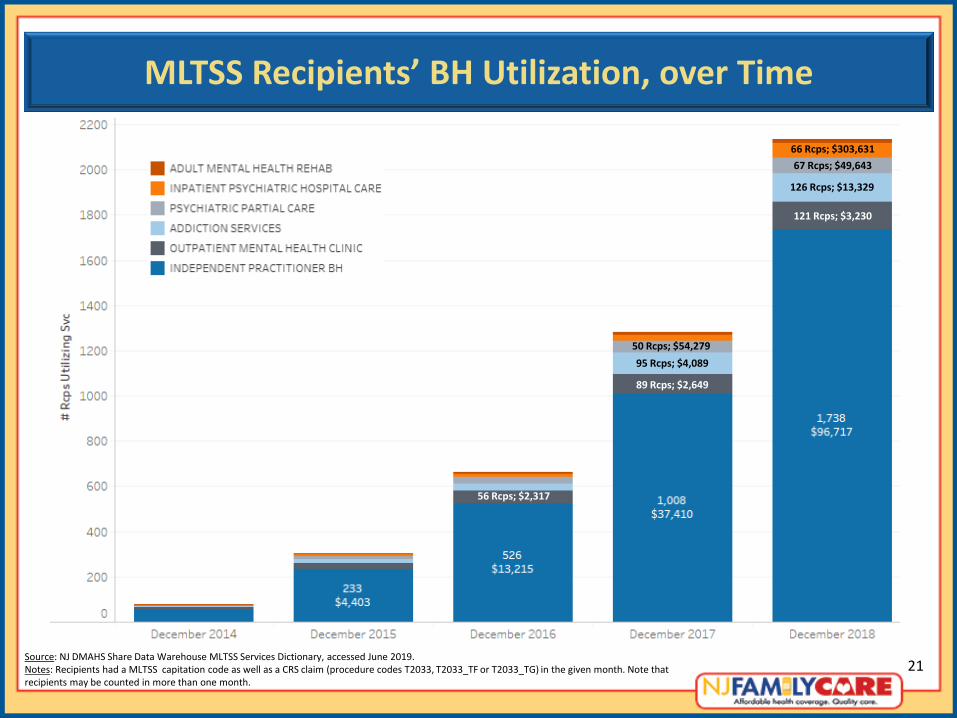
MLTSS Recipients’ BH Utilization, over Time
Source: NJ DMAHS Share Data Warehouse MLTSS Services Dictionary, accessed June 2019. Notes: Recipients had a MLTSS capitation code as well as a CRS claim (procedure codes T2033, T2033_TF or T2033_TG) in the given month. Note that recipients may be counted in more than one month.
89 Rcps; $2,649
95 Rcps; $4,089
121 Rcps; $3,230
126 Rcps; $13,329
67 Rcps; $49,643 66 Rcps; $303,631
50 Rcps; $54,279
56 Rcps; $2,317
21
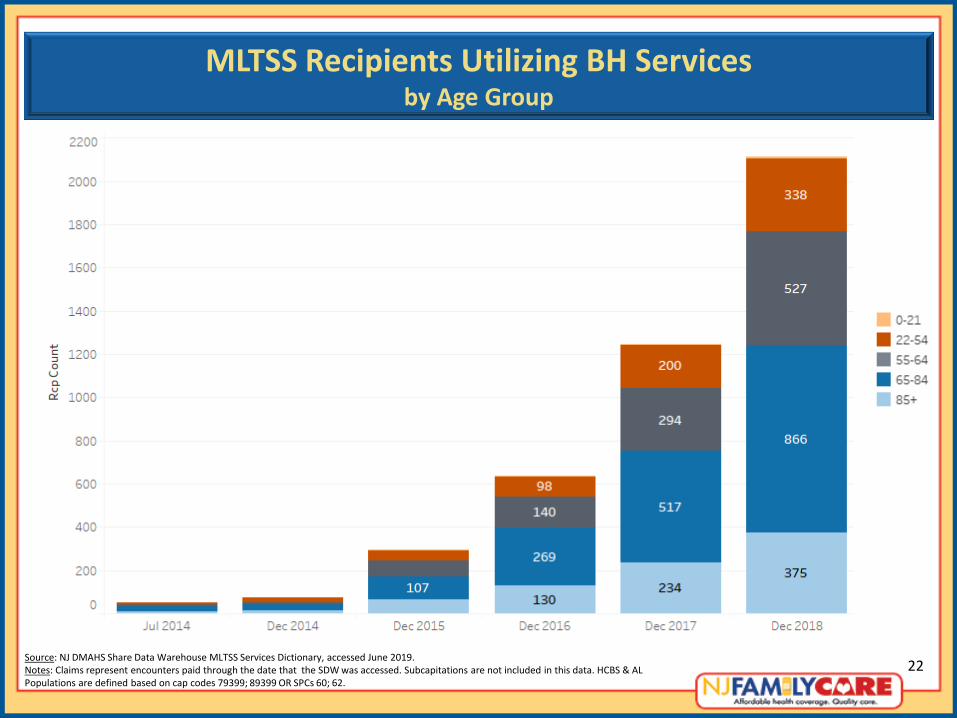
MLTSS Recipients Utilizing BH Services by Age Group
Source: NJ DMAHS Share Data Warehouse MLTSS Services Dictionary, accessed June 2019. Notes: Claims represent encounters paid through the date that the SDW was accessed. Subcapitations are not included in this data. HCBS & AL Populations are defined based on cap codes 79399; 89399 OR SPCs 60; 62.
22
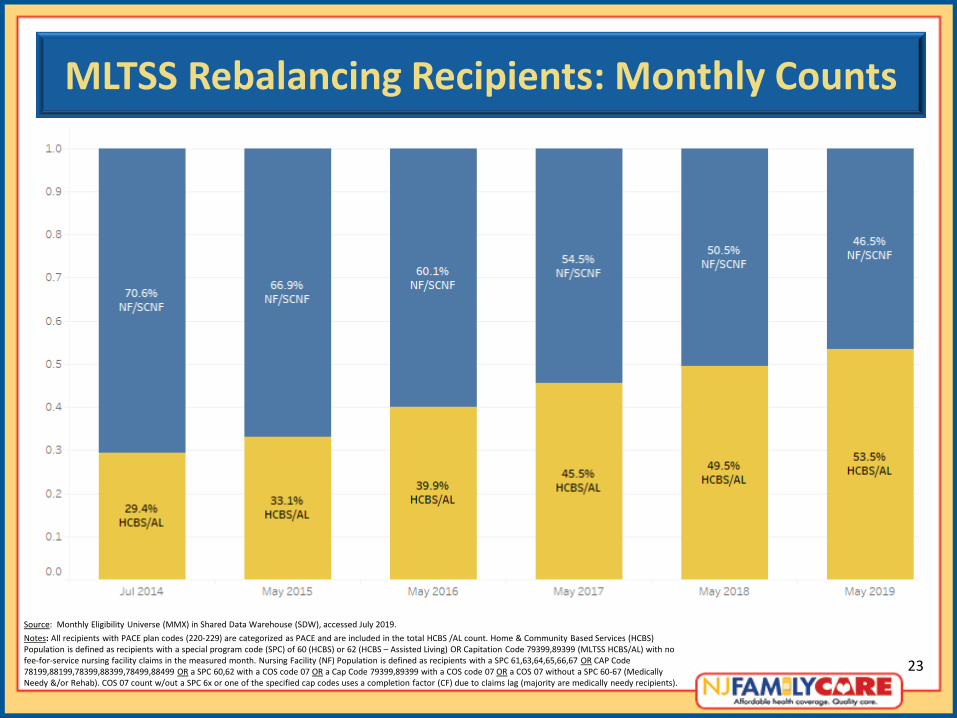
MLTSS Rebalancing Recipients: Monthly Counts
Source: Monthly Eligibility Universe (MMX) in Shared Data Warehouse (SDW), accessed July 2019. Notes: All recipients with PACE plan codes (220-229) are categorized as PACE and are included in the total HCBS /AL count. Home & Community Based Services (HCBS) Population is defined as recipients with a special program code (SPC) of 60 (HCBS) or 62 (HCBS – Assisted Living) OR Capitation Code 79399,89399 (MLTSS HCBS/AL) with no fee-for-service nursing facility claims in the measured month. Nursing Facility (NF) Population is defined as recipients with a SPC 61,63,64,65,66,67 OR CAP Code 78199,88199,78399,88399,78499,88499 OR a SPC 60,62 with a COS code 07 OR a Cap Code 79399,89399 with a COS code 07 OR a COS 07 without a SPC 60-67 (Medically Needy &/or Rehab). COS 07 count w/out a SPC 6x or one of the specified cap codes uses a completion factor (CF) due to claims lag (majority are medically needy recipients).
23
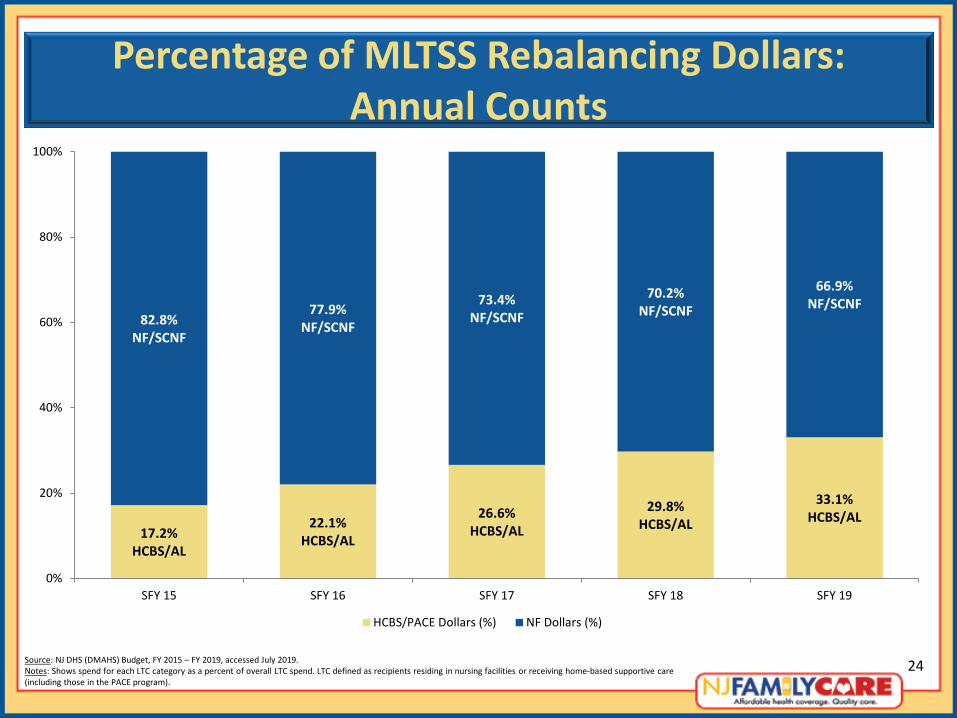
Percentage of MLTSS Rebalancing Dollars: Annual Counts
Source: NJ DHS (DMAHS) Budget, FY 2015 – FY 2019, accessed July 2019. Notes: Shows spend for each LTC category as a percent of overall LTC spend. LTC defined as recipients residing in nursing facilities or receiving home-based supportive care (including those in the PACE program).
17.2% HCBS/AL
22.1% HCBS/AL
26.6% HCBS/AL
29.8% HCBS/AL
33.1% HCBS/AL
82.8% NF/SCNF
77.9% NF/SCNF
73.4% NF/SCNF
70.2% NF/SCNF
66.9% NF/SCNF
0%
20%
40%
60%
80%
100%
SFY 15 SFY 16 SFY 17 SFY 18 SFY 19
HCBS/PACE Dollars (%) NF Dollars (%)
24