Embed Size (px)
Citation preview
Planning and Control Models for Elevators in
High-Rise Buildings
Marja-Liisa Siikonen
KONE Corporation
P.O. Box 8
SF-00331 Helsinki, Finland
Helsinki University of Technology
Systems Analysis Laboratory
Research Reports A68
October 1997
2
ABSTRACT
The passenger service level in an elevator system depends on the planning of the elevator group andon the control of the elevators. In this thesis the contribution of passenger and elevator traffic for anelevator group with multiple shafts is studied by simulations and theoretical analysis.
During this work an elevator control system, the Traffic Master System 9000 (TMS9000), wasdeveloped. The TMS9000 group control system optimizes passenger waiting times instead of hallcall times, and the control actions can be started in advance, which is not the case with conventionalcontrols. With the TMS9000 control system, average passenger waiting times became shorter andmore balanced floor by floor compared to conventional controls. The functional properties of theTMS9000 group control system were tested with the Advanced Lift Traffic Simulator (ALTS), whichis described in the thesis. ALTS has also been applied in elevator planning to predict hall call timesin new buildings, or to estimate improvement potential in hall call times for existing elevator groups.Simulation has revealed new correlation between the passenger and elevator traffic. In this thesis,new equations and planning criteria for the mean passenger journey time and ride time inside the carduring an up-peak are introduced, and the results are verified with simulations.
Keywords: elevator planning, group control, call allocation, simulation, optimization, fuzzy logic,forecast
3
PREFACE
This thesis is based on work that was carried out in the KONE Research an DevelopmentDepartment and, later, in the KONE Elevators Research Center. My starting point was to develop anelevator traffic simulator, and to get acquainted with the elevator planning problems. I am verygrateful to Mr. Nils-Robert Roschier, and also to the late Mr. Matti Kaakinen, for theirencouragement and enthusiasm shown towards my work. Later on the work continue with thedevelopment of group control principles. I owe my thanks to Mr. Risto Kontturi, who also gave methe opportunity to finish this thesis. I also want to express my gratitude to my supervisor, Prof.Raimo Hämäläinen, for his interest in my work.
The group control study included in this thesis started in 1985 as a research project funded by theTechnology Development Centre in Finland (TEKES). The objective was to apply an expert systemframework for embedded applications. One of the applications in this project was the elevator groupcontrol, where co-operation was made with Helsinki University of Technology (HUT). The originalidea of the work was subsequently rejected, but the study formed the basis of the new group controlfor high-rise buildings, the KONE Traffic Master System (TMS) 9000. The TMS9000 group controlwith artificial intelligence was specified and partly managed by the author. A number of people tookpart in the TMS9000 control development project. I want to thank all the people who participatedin the TMS9000 development for the innovative and creative atmosphere. I owe special thanks toMr. Jussi Leppälä, who finished his master of science thesis during the TMS9000 development. Hiswork dealt with the passenger traffic forecasts, which have greatly assisted in adding the passengerinsight to the elevator control.
During the work in the Elevators Research Center, mathematical studies were made together withthe Technical Research Centre of Finland (VTT). I want to thank Dr. Jorma Virtamo and Mr.Samuli Aalto, who clarified various elevator traffic problems during the co-operation. Among theresults was a new control with future event simulation, which also provided a basis for thedevelopment of the DACA control described in this thesis.
4
LIST OF PUBLICATIONS………………………………………..………………………………….5
1. INTRODUCTION ……………………..………………………………………………………….6
2. MAIN DEFINITIONS……………..………………………………………………………………8
3. OPTIMIZATION BY GROUP CONTROL ……………………………………………………….9
3.1 Architecture of an elevator control system …… ………………………………………………….9
3.2 Group control principles………………………………………………………………………… 10
3.3 Passenger waiting time optimization by the TMS9000 control system………………………….13
3.4 Cost function and multiple target optimization ………………………………………………….14
3.5 Elevator routing methods ………………………………………………………………………..15
3.5.1 Static allocation of existing calls ………………………………………………………………15
3.5.2 Dynamic call allocation with future event simulation ……………………………………..….17
4. SIMULATION OF ELEVATOR TRAFFIC ……………………………………………………..18
4.1 Elevator traffic simulators ………………………………………………………….……………18
4.2 ALTS input data ………………………………………………………….…….…..……………18
4.3 Passenger traffic generation …………………………………………………….…………….…19
4.4 Simulation sequence in ALTS ………………………………………………….…………….…20
4.5 Simulated passenger traffic phenomena ………………………………………….…….……….22
5. PLANNING OF ELEVATOR GROUPS ………………………………………….……….……23
5.1 General planning principles ……………………………………………………….…………….23
5.2 Conventional elevator planning parameters ……………………………………….………….…24
5.3 Mean passenger ride time and journey times ……………………………………….……..…….26
5.4 Performance and service level criteria ……………………………….………………..…….…..27
5.5 Simulation in elevator planning ……………………………………………………….…..…….29
6. SUMMARY OF THE PUBLICATIONS……………………………………………….….…… 30
7. CONCLUSIONS ……………………………………………………………………….….…… 32
REFERENCES…………………………………………………………………………………..…..34
5
LIST OF PUBLICATIONS
I Siikonen, M-L. Simulation - a tool for enhanced elevator bank design. Elevator World, 1991. No.4, pp. 30-37.
II Siikonen, M-L. Elevator traffic simulation. Simulation, 1993. Vol. 61, No. 4, pp. 257-267.
III Siikonen, M-L. Customer service in an elevator system during up-peak. TransportationResearch, 1997. Vol. 31B, No. 2, pp. 127-139.
IV Siikonen, M-L. Control methods for an elevator group, Proceedings of the Nordic OperationsResearch Conference, NOAS '93. Trondheim, Norway, 1993.
V Siikonen, M-L. Elevator group control with artificial intelligence, Helsinki University ofTechnology, Systems Analysis Laboratory, Research Reports A67, May 1997. 32 p. ISBN 951-22-3588-9.
VI Siikonen, M-L., Leppälä, J. Elevator traffic pattern recognition. Proceedings of the FourthWorld Congress of the International Fuzzy Systems Association, Brussels, Belgium, 1991. pp.195-198.
VII Siikonen, M-L., Kaakinen, M. TMS9000 group control - using artificial intelligence to improvepassenger service quality. Elevator Technology 5, Stockport, England: IAEE Publications, 1993. pp.238-246. ISBN 0-9513498-6-4.
Republished in Elevatori, 1994. Vol. 23, No. 3-4, pp. 25-36. and
in Lift Report, 1994. Vol. 20, No. 3-4, pp. 32-41.
This thesis is based on a collection of seven publications. Publications I and II deal with the elevatortraffic simulator, ALTS, which was developed by the author. ALTS belongs to the integrated elevatorplanning tools in KONE. In Publication III a new equation for the passenger journey time isintroduced. With ALTS different landing call allocation principles have been studied, and some ofthe author's results are shown in Publication IV. The three remaining articles deal with theTMS9000 group control system. Publication V is the most comprehensive description of theTMS9000 control and it was published last. The last two articles partly overlap with Publication Vand are not as detailed since they are conference presentations. Publication VI is a short descriptionof the utilization of the fuzzy logic in the TMS9000. It is based on Mr. Jussi Leppälä's master ofscience thesis that was led by the author. Publication VII is a general description of theimplementation of the TMS9000 control system. It was written by the author and by Mr. MattiKaakinen, and it was presented at the IAEE's (International Association of Elevator Engineers) FifthConference on Elevator Technologies. The article won the best paper award in the conference, andwas later reprinted in two elevator magazines.
6
The introduction part of this thesis describes how the passenger insight is brought into elevatorcontrol and planning. The exact methods and equations are presented in the publications, and theyare only briefly reviewed in the introduction.
1. INTRODUCTION
Elevators have been built throughout history but the first modern passenger elevators were developedno more than about 150 years ago. Steam and hydraulic elevators had already been introduced by1852, when Elisha Otis made one of the most important elevator inventions, the clutch, whichprevented the elevator from falling. Following this, in 1857, the first passenger elevator was installedin the store of E. Haughwout&Company, New York. The development of elevator technology wasfast. With the advent of modern high-rise buildings, more elevator history than in any other singlelocation was made in 1889, when the 321-meter-high Eiffel Tower was built for the UniversalExposition in Paris. In the Eiffel Tower, hydraulic double-deck elevators operated between groundlevel and the second platform. Between the second and third platforms two cars counterbalancingeach other handled the traffic. The early hydraulic and steam-driven elevators functioned withpressurized water, which was either taken from the city water pipes or provided by steam engines.The elevator car was connected to a long piston that moved up when water was pumped into acylinder, and came down when water was released by a hydraulic valve. In 1880 Werner vonSiemens introduced the utilization of electric power. Soon after, the geared or gearless tractionelectric elevators started to replace the hydraulic elevators. The development of electric elevatorsadded impetus to high-rise construction. The fastest elevators today move at about 10 meters persecond.
In Finland, elevators were first distributed by Strömberg. The KONE corporation was registered in1910. In 1918 it started to design its own elevators, and the first four KONE elevators were deliveredlater that year. The first geared traction elevators from KONE were delivered to the Stockmanndepartment store in 1928. KONE started to design its own AC and DC motors, and in the 1930'salmost all the elevator components were being produced in-house. In electric elevators, themachinery for driving the elevator is usually located directly above the elevator hoistway in amachine room. After the middle of this century, hydraulic and ram elevators made a come-back,since it was cheaper to place the machine room at the bottom of the building (Virkkala 1983).Modern hydraulic elevators function with oil, which is pumped by electric power. Since the speed ofhydraulic elevators is low, they became popular especially in residential buildings, and ininstallations where heavy loads are transported. A recent innovation that requires no oil is a newhoisting unit where a synchronous axial motor is installed in the elevator shaft (Hakala 1995). Withthis concept the control boards are situated at the highest landing floor and no separate machineroom is required.
In a single elevator system the elevator control handles all the equipment. In the case of severalelevators where each elevator is in its own shaft, the transportation capacity can be increased by acommon group control that delivers the hall calls to the elevators. The first electrical controls wererealized by relay techniques, the same kind of relays that were used in telephone exchanges. In the1970's the principles of relay equipment were applied to electronic controls. In KONE, the firstcompletely microprocessor-based control system was developed in the beginning of the 1980's,and itwas first tested with a hybrid traffic simulator. With microprocessors, mathematical methods andsophisticated call allocation algorithms are used to optimize hall calls to the elevators. The rapiddevelopment of processor technology has made it possible to distribute the "intelligence" from themachine room to the elevator components, even to the hall call buttons. In a modern group control, a
7
huge amount of information is handled during the hall call allocation compared to the old relaycontrols. The first aim of this work is to describe new microprocessor-based hall call optimizationmethods that optimize passenger service level.
The other aim of the present work is to bring the passenger point of view to elevator planning. Abasis for the passenger service level is already set when configuring the elevator groups. Sufficienttransportation capacity and good elevator service for the varying traffic situations during the dayhave to be guaranteed when selecting elevators for a new building. A single elevator with passengersarriving randomly at the main entrance floor has been modeled with bulk service queuing theory(Bailey, N. T. J., 1954; Aalto, S., 1995). The average waiting times and queue lengths for a multi-carelevator system have been modelled with multi-bulk service queuing theory for the up-peak traffic(Alexandris, N. A., 1979). The up-peak situation, where passengers arrive at one entrance floor, i.e.at the lobby, and travel to the upper floors, is the most demanding for the elevator transportationcapacity. In an up-peak situation the average time it takes for an elevator to serve the car calls andreturn back to the lobby, i.e. round trip time, is calculated using probability theory. In conventionalelevator planning the up-peak handling capacity and interval are calculated from the round trip timevalue. The elevator group is chosen using standardized handling capacity and interval values fordifferent types of buildings. In a real building, passengers arrive at several floors at the same time.Then the group control has a great effect on the passenger service times. The impact of the groupcontrol decisions on the passenger service times in different traffic situations cannot be calculatedanalytically. Passenger service times and elevator performance can be determined by simulating thecontribution between passenger traffic flow and the elevator performance.
In the following, elevator group control principles, traffic simulation and elevator planning arereviewed. Several fields of mathematics are applied, such as statistical methods, optimization,simulation and queuing theory. The basic terms are defined in Section 2. A review of group controlprinciples is given in Section 3. Passenger waiting time optimization by the TMS9000 control systemis described in Publication V. The measurement and forecasting of passenger traffic flow in abuilding, and the traffic pattern recognition using fuzzy logic is explained in Publications VI and VIINew aspects in hall call allocation are presented in this section and in Publication IV. The functionof group controls for different traffic patterns is tested with simulations. The ALTS simulator isdescribed in Publications I and II. Methods for generating theoretical passenger traffic patterns or forreconstructing the real passenger traffic flow from measured elevator traffic events are explained inSection 4. Simulation is used also as a tool when planning elevator installations. General elevatorplanning principles are described in Section 5. New equations for the mean passenger ride andjourney time are derived in Publication III and they are compared with the known approximations forelevator planning parameters. Finally, the results of the publications are summarized and a glance istaken at future developments.
8
2. MAIN DEFINITIONS
Passengers arrive at an elevator system randomly and they are served in batches. The actualpassenger arrival rates in a building can be assumed to follow the Poisson distribution (Alexandris1977). When a passenger arrives at a landing floor and gives a hall call, the group control allocatesthe call to the most suitable elevator. The time a hall call(landing call) stays on is called a hall calltime. When a selected elevator starts to decelerate to the call floor, the hall call is cancelled. Thesystem response time (Barney 1995) and call waiting time (Fujino et al.1992) resemble the definitionof the hall call time. Those times are measured from the moment of hall call registration until the cararrives to the floor and starts opening its doors. The passenger waiting time starts when a passengerarrives at a landing floor, and ends when he enters the elevator. The passenger ride time starts whena passenger enters a car and gives a car call (destination call), and ends when he exits the car at thedestination floor. The total time a passenger spends within an elevator system first by waiting andthen by riding inside a car is called the journey time, also called the service time (Powell 1992) andthe time to destination (NEII 1994). Journey time is approximated by average time to destination(Fortune 1995), transit time to destination (Schröder 1984), or by maximum passenger transit time tothe destination (Strakosch 1984). The travel time from the bottom to top floor at full speed is used todefine the elevator speed. In elevator planning, a theoretical up-peak situation where all the elevatorsleave the lobby with 80 per-cent load is normally used. The two most important planning parameters,the up-peak interval and handling capacity, are calculated from the round trip time. The round triptime starts when a car opens its doors at the lobby, and continues until an elevator has made a triparound the building and starts to open its doors after returning to the lobby. The interval is theaverage time between car departures from the lobby. The handling capacity gives the number ofpassengers the elevator system can transport in five minutes during up-peak. The main parameters indefining the passenger service level used in this work are shown in Figure 1.
9
PASSENGERGIVESA CALL
CALL I SCANCELED
PASSENGERENTERSTHE CAR
THIS ELEVATOR LEAVESTHE FLOOR
PASSENGEREXITSTHE CAR
PREVIOUSELEVATORLEAVESTHE FLOOR
JOURNEY TIME
WAITING TIME RIDE TIME
INTERVAL
PASSENGERGIVESA CALL
CALL I SCANCELED
PASSENGERENTERSTHE CAR
THIS ELEVATOR LEAVESTHE FLOOR
PASSENGEREXITSTHE CAR
PREVIOUSELEVATORLEAVESTHE FLOOR
JOURNEY TIME
WAITING TIME RIDE TIME
INTERVAL
Figure 1. The interval and the passenger service level parameters. In the graph, one passenger perhall call is assumed.
3. OPTIMIZATION BY GROUP CONTROL
3.1 Architecture of an elevator control system
A typical architecture of an elevator control system is shown in Figure 2. The control boards of anelevator group are usually situated in a machine room. The group control is the "brain" of theelevator system, deciding where the cars should go and stop. There can be one or several groupcontrols in an elevator group. One of the group controls is the master that delivers the hall calls tothe elevators, and the other group controls are backups. Other functions inside the car, e.g.registering and canceling of car calls, door control, and measurement of the car load, are handled bythe elevator control. Using the latest microprocessor technology, part of the elevator control has beendistributed among the elevator components. "Intelligent" elevator components communicate witheach other through serial transmission using Control Area Network (CAN). Modern elevator controlsprovide built-in elevator monitoring devices (Chapman 1994) or remote building monitoring systems(Kawano et al.1994) to follow the elevator traffic. Typical control software for an elevator componentincludes an operating system, task-scheduling programs, input, output and communication programs,and programs for controlling and optimizing the function of the component.
10
ELEVATOR MONITORING &
COMMAND SYSTEM
GROUP
CONTROLLER HALL CALLS
ELEVATOR
CONTROLLER
ELEVATOR
CONTROLLER
ELEVATOR
CONTROLLER
CAR
CALLS
CAR
CALLSCAR
CALLS
DIGITAL
LOAD
INFORMATION
DIGITAL
LOAD
INFORMATION
DIGITAL
LOAD
INFORMATION
SERIALCOMMUNICATION
SERIAL COMMUNICATION
CONTROL OF AN ELEVATOR GROUP
. . .
Figure 2. The architecture of an elevator control system.
The group control allocates hall calls to the most suitable elevators by optimizing the cost function.The most usual optimization target in an elevator control is to minimize hall call times. It was,however, found that by optimizing passenger journey times the number of elevator stops is reduced,which increases the handling capacity (Barney et al.1985;Closs 1970). The same traffic can behandled with fewer elevators compared to a conventional system. In the M10 control system(Schröder 1990) special keypads at the landing floors are used. Passengers can dial their destinationsalready at the landing floors and no car calls inside the elevators are needed. With normal up- and -down hall call buttons, passenger arrival floors, times, and destination floors cannot be determined,but they can be forecast. In the TMS9000 control system the passenger traffic flow is forecast and thepassenger waiting times are optimized. In this section, the background of the group controlprinciples is given first. The TMS9000 control system is only briefly described since it ischaracterized in more detail in Publications V, VI and VII. The cost function in multiple targetoptimization is discussed and new routing methods in the call allocation algorithm are described(Publication IV).
3.2 Group control principles
The first elevators were operated by simple mechanical devices, such as "hand-rope" control(Strakosch 1967). A passenger could call an elevator by operating a rope on both sides of the car.Since the shafts were not fully closed, the operation of elevators was quite unsafe. A primitive formof elevator control in a single car was based on an attendant-operated electrical car switch (Barney etal.1985). Using the switch, the attendant could manually drive the car up or down and decide at
11
which floors to stop. The elevator efficiency and safety were increased with signaling devices atlandings.
Push-buttons were introduced in the 1920's to give the attendant information on the traffic demand,and the elevator shafts became closed. If no memory for the hall calls is provided, the calls arehandled with a push-button control. With the non-collective controls the traffic demand is handledby serving each hall call at a time. A new hall call can be registered after the service of the previouscall is completed. This control principle is used in freight elevators. When the registered calls arememorised, the elevator can pick several hall calls during the up or down trip. If there is only onecall button at each floor, the calls can be arranged in a time queue according to the order they havebeen registered, or they can be served collectively. In the Interconnected Queue Selective (IQS)control system the hall calls are picked one at a time from the time queue so that the oldest call isserved first (Virkkala 1983). This type of control is used, for instance, in hospitals, where the bedcalls are served one at a time. In collective control the car stops in floor sequence at each hall call.The Interconnected Down Collective(IDC) control system is often used in buildings where the trafficis mostly two-way between the ground level and the upper floors. This kind of traffic occurs, forexample, in residential buildings. The elevator collects the hall calls during the down trip, i.e. servesthe calls in sequence, stopping always at the nearest call floor. The IQS and IDC controls can be usedby one car only or they can be applied for a group of elevators.
After automatic doors were developed in the 1950's, the traffic demand could be handled withoutattendants. In tall buildings, hall call buttons for both up and down directions were adapted. Themost common call allocation principle, especially in the old relay controls, is the Interconnected FullCollective (IFC) control system. With two buttons at each floor, an elevator can pick the nearest hallcall in front of the car in its direction of travel. The car calls given inside the elevator are alwaysserved in sequential order. After serving all the calls in the travel direction, the car moves to thefurthest hall call in the opposite direction, where it reverses its direction. The efficiency of anelevator group was improved with a common central logic, the group control. The hall calls could beshared between several elevators where a common hall call button exists at every floor. The groupcontrol chooses the best elevator from a group of elevator cars to serve a given hall call. Groupcontrol dispatches cars to floors also for other reasons than hall calls, such as for parking, or if morethan one elevator is needed at a busy floor. Elevators can be disconnected from the group for specialservice modes, such as emergency service, fireman's service or director/VIP service. A disconnectedelevator operates independently of the other elevators.
One drawback of the collective control principle is the bunching of elevators. During heavy trafficthere are a lot of hall calls to serve and the elevators have a tendency to move side by side, i.e. theystart to bunch. This happens because elevators always stop at the nearest call and by-pass hall callsonly when fully loaded. One of the early methods of preventing the bunching of elevators was todispatch cars from the lobby at proper time intervals. A bus-type schedule for the elevators wasapplied. Elevators were delayed at the lobby for a certain time before they were sent to the upperfloors. By delaying elevators at the lobby, part of the handling capacity was lost. In the 1970'scollective control was first adapted to electronic controls. With electronic controls, however,collective controls were improved by giving priorities for the long or timed-out hall calls. Hall callsthat had been on for a short time, were bypassed to get faster service for the timed-out calls. To someextent the elevators were kept apart from each other with this control. Peak traffic situations werehandled with separate operation modes. In up-peak operation modes, such as next car up(Barney etal.1985), dispatching intervals(Bittar 1981), zoning of floors, and later a channeling option (Powell1992) were used.
12
The allocation principles of relay and electronic controls were brought to the microprocessor controlsat the beginning of the 1980's. Hall calls were still prioritized according to the call service times. Aslight but fundamental change was made in the philosophy. It was no longer expected that hall calltimes would become long before the "timed out" hall calls were given better service. The hall calltimes were forecast with mathematical calculations. When it was found that a hall call would becomelong with the normal service order, a car would bypass some hall calls to provide faster service tothis call before it became long. When bypassing other hall calls, it was checked that the bypassedcalls could be served by other cars within an acceptable time frame. On some occasions bonuses andpenalties were used. For example, a bonus was given to an elevator with a car call coinciding withthe hall call when estimating the service time to the hall call. On the other hand, a penalty was givento some elevators, such as parked cars, when choosing the best car to serve a hall call.
One important feature in the modern group supervisory controls is the time when hall calls arefinally reserved to the cars. The reservation moment can be seen in the signalization at the landingcall floor. As soon as the hall call is finally designated to a car, an arrow above the car-door openingis illuminated. Simultaneously an audible gong signal is given to inform the passenger which car isgoing to serve the given hall call. The final reservation must be stable not to mislead the passenger.To get the best optimization result, the reservation is often made at the latest possible moment, i.e.when the elevator starts to decelerate to the hall call floor. The other extreme is to reserve hall callsfinally to an elevator immediately the hall call is given (Hirasawa et al.1978). This shortens thepsychological waiting time of the passengers. Passengers have more time to gather around thearriving elevator, which shortens the loading time. When the hall calls are allocated at an earlystage, the future traffic events change the situation so that the early reservations are not as optimal asif the allocation was made at a later instant.
In the course of the fast development of microprocessor technology, the call allocation algorithmshave become more sophisticated. Mathematical methods are applied in the elevator controls. Thetraffic in the building is measured and learned in statistical forecasts. Statistical forecasts are usedwhen allocating new hall calls to the cars (Sakai et al.1984). Statistical traffic forecasts are alsoadapted to the controls with a late hall call reservation (Kameli 1989), even though the allocationprinciple is not critical to the future traffic events. The methods that learn and adapt to the traffic ofa building, and use rules based on expertise are connected to artificial intelligence in the elevatortechnology (Aoki et al.1990). The uncertainties in the predictions and control actions are describedby fuzzy rules (Umeda et al.1989; Powell et al. 1993). Neural networks can make the elevatorcontrols completely autonomous so that the control parameters are tuned by the traffic of thebuilding. Then the significance of pre-defined expert rules diminishes (Nakai et al. 1995).
13
3.3 Passenger waiting time optimization by the TMS9000 control system
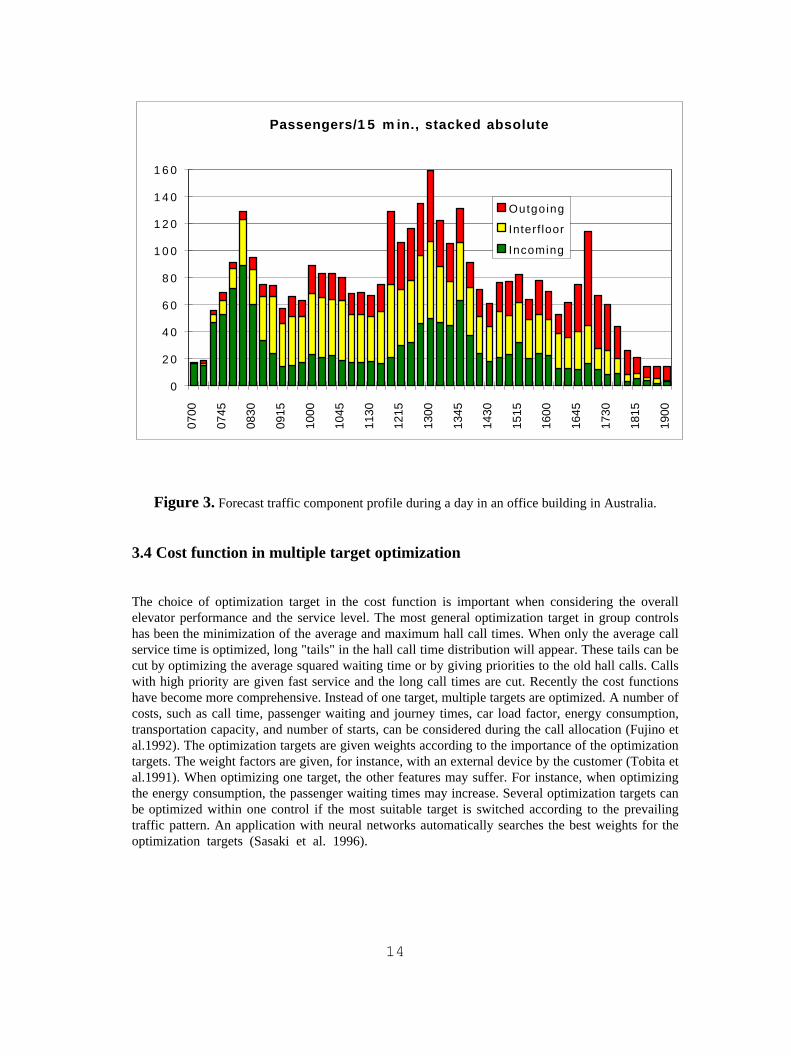
The main idea of the Traffic Master System 9000(TMS9000) was how to optimize passenger waitingtimes, not only hall call times(Publication V). Artificial intelligence is used to learn the passengertraffic flow in the building. The call allocation algorithm uses the measured passenger traffic flowinformation to optimize passenger waiting times. All the existing hall calls are allocatedcontinuously. According to the Enhanced Spacing Principle(ESP) the allocation starts from the callwhere there are most passengers waiting with a long predicted waiting time. Those calls are servedfirst and long waiting times are cut. Average waiting times are balanced floor by floor, especially inbuildings with uneven passenger arrival rates at different floors and directions. Fuzzy logic isutilized to recognize the prevailing traffic pattern. Altogether 26 different traffic patterns can berecognized using 36 fuzzy rules. The best matching traffic pattern for each time of day is searchedaccording to the forecast traffic data. The group control activates special control actions during thepeak traffic patterns, or during light traffic, in advance compared to conventional controls.
The statistical forecasts include information of entering and exiting passengers per floor anddirection at fifteen minute intervals. The three traffic components, i.e. incoming, outgoing andinter-floor components, in a building are forecast. During the incoming traffic, passengers arrive atthe entrance floors or the main entrance, the lobby, and travel to the upper floors. During theoutgoing traffic, down calls are given by the passengers who are destined to the lobby, where theyexit the building. During inter-floor traffic, passengers travel between the floors inside the building,and nobody enters or exits the building. Figure 3 shows a profile of incoming, outgoing, andinter-floor traffic components forecast by the TMS9000 control system. The statistics were compiledfrom an office building with common working hours. The morning up-peak is the most difficultsituation for the elevator capacity. Special up-peak boosters have been developed to increase capacityin this situation. During the lunch hour the passenger traffic intensity is highest and there are a lot ofhall calls. This is the most difficult situation for the group control since elevators easily start tobunch. During the intense traffic hours the TMS9000 keeps the elevators evenly spaced by using theEnhanced Spacing Principle. The control utilizes unequal passenger arrival rates and waiting timesat the landing floors, and hall calls with short passenger waiting times or a few passengers can beby-passed.
14
Passengers/1 5 m in., stacked absolute
0
2 0
4 0
6 0
8 0
1 0 0
1 2 0
1 4 0
1 6 0
0700
0745
0830
0915
1000
1045
1130
1215
1300
1345
1430
1515
1600
1645
1730
1815
1900
Outgoing
Interf loor
Incoming
Figure 3. Forecast traffic component profile during a day in an office building in Australia.
3.4 Cost function in multiple target optimization
The choice of optimization target in the cost function is important when considering the overallelevator performance and the service level. The most general optimization target in group controlshas been the minimization of the average and maximum hall call times. When only the average callservice time is optimized, long "tails" in the hall call time distribution will appear. These tails can becut by optimizing the average squared waiting time or by giving priorities to the old hall calls. Callswith high priority are given fast service and the long call times are cut. Recently the cost functionshave become more comprehensive. Instead of one target, multiple targets are optimized. A number ofcosts, such as call time, passenger waiting and journey times, car load factor, energy consumption,transportation capacity, and number of starts, can be considered during the call allocation (Fujino etal.1992). The optimization targets are given weights according to the importance of the optimizationtargets. The weight factors are given, for instance, with an external device by the customer (Tobita etal.1991). When optimizing one target, the other features may suffer. For instance, when optimizingthe energy consumption, the passenger waiting times may increase. Several optimization targets canbe optimized within one control if the most suitable target is switched according to the prevailingtraffic pattern. An application with neural networks automatically searches the best weights for theoptimization targets (Sasaki et al. 1996).
15
3.5 Elevator routing methods
3.5.1 Static allocation of existing calls
Methods of finding optimal routes when delivering existing hall halls to elevators have beeninvestigated since the 1960's. If all the combinations in allocating existing hall calls to elevators werecalculated, the combination with the minimum cost would give the global optimum. The problem isthat the number of route combinations grows exponentially with the number of hall calls.Consequently, a pure searching method can only be used for a moderate number of elevators andfloors. If the search is done for all the combinations of existing hall calls and elevators, the numberof unordered route combinations is
n LrK= (1)
where the number of elevators in a group is L and the number of hall calls is K. Hall calls and theirallocations to different cars form a decision tree (Publication IV). For each hall call the costs ofserving the call by each elevator have to be calculated. The cost of decisions depend on the earlierdecisions made for the other hall calls. The global optimum for the cost function is found bycalculating all the decision combinations, i.e. elevator routes, in the decision tree. The route with theminimum cost defines the optimal way of allocating the existing hall calls to the elevators.
When hall calls are allocated continuously, the allocation cycle is usually less than half a second. Atest was made with the Intel Pentium processor to search all the route combinations for groups ofelevators. Within half a second an optimal route was found for three elevators and ten hall calls, andfor six cars and six hall calls. These correspond to a buildings with six and three served floors,respectively. In a building with an eight-car group there can be nearly 60 hall calls when all the upand down calls are taken into account. The total number of possible route combinations to becalculated are more than 6.2*1057. As a conclusion, by searching all the route combinations theglobal optimum can be found within a reasonable time only for low buildings with 2-3 elevators inthe group using the present processing capability.
In order to enhance the calculation time, the number of calculated routes must be considerablydecreased. There are common practices in passenger service that restrict the number of possibleroutes:
1) Car calls are always served sequentially in the travel direction of the elevator, i.e. the elevator willnot bypass the destination floor of a passenger.
2) An elevator does not reverse its direction until all the passengers inside the car have been served.
16
3) Elevators do not accept car calls in the reverse direction of the car travel, i.e. passengers shouldnot enter a car travelling in the opposite direction.
4) Normally a car will stop at a floor only if a passenger wants to board or alight a car. Exceptionsare made, for instance, when a car parks at a specific floor during light traffic.
In addition to these practices several approaches have been proposed, such as the use of the ACAalgorithm (Adaptive Call Allocation) (Closs 1970). In the ACA algorithm only new calls areallocated to the best cars and the reservations of the existing hall calls remain unchanged. With thismethod the calculation time is substantially reduced to a practical level in all possible elevatorsystems. In this method the old allocations can lose their optimality when the final reservation of thehall calls is made at such an early stage.
Another approach to finding the global optimum for the cost function is to use the principle ofdynamic optimization with the OR (Optimal Routing) algorithm (Siikonen 1989). In collectivecontrol, the nearest hall call for a car is always searched in the travel direction. In the dynamicoptimization algorithm, the call allocation order is reversed. The best car for the hall call is searchedstarting from the furthest hall call in the elevator travel direction. The allocation starts from thelowest call and continues to the highest call. All the hall calls are allocated to the best cars. In thebeginning the intermediate stops of the elevators are not known, but after the allocation cycle theyare fixed. The allocation is restarted with the new intermediate stop information, and the cycle isiterated until the allocations to the cars remain unchanged. The new control was compared with theACA algorithm by simulations. When the average call time was used as an optimization target, thenew algorithm showed an improvement compared to the results of the ACA algorithm. Thisalgorithm, however, does not always find the global optimum for route combinations.
Recently, genetic algorithms (Alander et al. 1995) and dynamic optimization with reinforcementlearning (Crites 1996) have been studied to find optimal elevator routes for existing calls. With thesetechniques the optimization result depends on the computation time or on years of training thealgorithm.
17
3.5.2 Dynamic call allocation with future event simulation
Attempts have been made to describe the state of a whole elevator system by one expression thatincludes the states of the elevators, car calls, and hall calls. With this method, the optimization targetwas to minimize the busy time of the elevators(Levy et al. 1977). The number of states, however,became so large that it was not possible to find the optimum solution in real time. An analogousapproach, the OPTICON control, was investigated in co-operation with VTT (Virtamo et al. 1993).During every call allocation cycle a decision is made whether a moving elevator should stop orcontinue its journey, or a vacant elevator should start, or continue standing with doors open orclosed. In this approach the call allocation resembles the decision making in computer chess.Elevator states are simulated during the call allocation for a restricted time in the future. The optimaldecision is searched for by varying the future elevator states. The future costs are cumulated in eachdecision alternative. During the future simulation, passengers arrive randomly at the floors accordingto the measured or known distribution. Arriving passengers push hall call buttons. Hall calls areallocated by a well-known group control principle, such as by collective control. A call is canceledwhen a car decelerates to serve the call. Car positions, car calls and car movements are modeled. Several realizations of future passenger traffic are made, and an average cost of all the realizations iscalculated. The decision that leads to the minimum cost is chosen. If no hall calls exist, cars willautomatically park at the floors with most probable traffic. In this control most of the calculationwork is made during light traffic when the number of hall calls is small and the number of decisionalternatives is great. During light traffic, elevators move restlessly from one floor to another sincehall calls are not used as moments for decision. They are taken into account only indirectly in thecost function.
To remove the restlessness of the previous control the DACA (Dynamically Adaptive CallAllocation) algorithm was developed. The DACA algorithm can be considered as an extension of theACA. The registration of a new hall call was chosen as the moment of decision, such as in the ACAalgorithm. The registration of a new hall call starts the allocation process. The existing hall call isallocated for each car in turn and the same passenger traffic giving hall calls is simulated for someminutes behind the moment the hall call has been served. The ACA algorithm is used in allocatingfuture hall calls to reduce the number of decision alternatives, but any other call allocation algorithmcan be applied as well. The existing hall call is reserved for the car with the minimum cumulativecost. More reliable results are obtained than with the ACA algorithm since not only the currentsituation with existing hall calls is considered but also the effect of future events on the current callallocation. With the DACA algorithm, elevators only move when there are hall calls, which makes itfaster than the OPTICON algorithm during light traffic. With both the previous controls, futuresimulation improved average hall call times in comparison to the controls which consider onlyexisting calls.
18
4. SIMULATION OF ELEVATOR TRAFFIC
4.1 Elevator traffic simulators
The effect of the group control on the hall call times and on the passenger service level can bedetermined by simulation. The first elevator traffic simulators were built to test the traffic service intall buildings, such as the World Trade Center (Browne et al.1968). At that time the group controlsin elevator companies were tested with hybrid simulators, which consisted of analog and digitalmodels (Weinberger 1967). In these simulators the real elevator control boards were attached to thetraffic simulator. Later, group controls were brought into minicomputers, where various trafficphenomena were studied and clarified (Barney et al. 1985). More recently, the same digitalsimulators were installed in personal computers (Barney 1988). Usually in personal computers,generic call allocation algorithms are used in the simulators (Lustig 1986). The Advanced LiftTraffic Simulator, ALTS, runs on a personal computer. In ALTS, the original group control softwarewas brought from the microprocessor boards to a personal computer, and it was combined with thetraffic simulator code. Initially, the ALTS simulator was built for marketing and demonstrationpurposes. Soon ALTS was adapted as a research tool for developing new group control principles.Different traffic situations can be repeated, which is important for testing purposes. This was notpossible with the hybrid simulators, where the delays did not repeat similarly. In this section themain features of the ALTS simulator, and some traffic phenomena found by ALTS simulations, aredescribed. Process models for the passenger traffic generation, the elevator control, the door controland the drive control of the ALTS simulator are described in more detail in Publication II.
4.2 ALTS input data
In ALTS, buildings with a defined number of floors and elevators can be simulated. Before making asimulation the passenger traffic, the building data and the elevator data are defined. Constant valuesfor the door-opening and closing times as well as for the passenger transfer times are used. Measuredvalues for the passenger transfer times normally vary from 1.0 s to 1.7 s. Doors stay open for a basictime if no passengers are transferred. When passengers enter or exit the car, a time called thephotocell delay occurs after the last passenger transfer before the doors start to close. The speed ofthe elevator is updated according to the acceleration and jerk values during a run. In the simulator aswell as in a real elevator, automatic doors start to open in advance before the car has fully reachedthe destination floor (Advanced Door Opening - ADO). The elevator speed during the decelerationand the distance from the destination level are monitored. The doors start to open when the valuesare below the given limits. Passengers are able to enter or exit the car when the doors are consideredto be fully open (800 mm wide). The minimum data required for a simulation by ALTS is shown inTable 1.
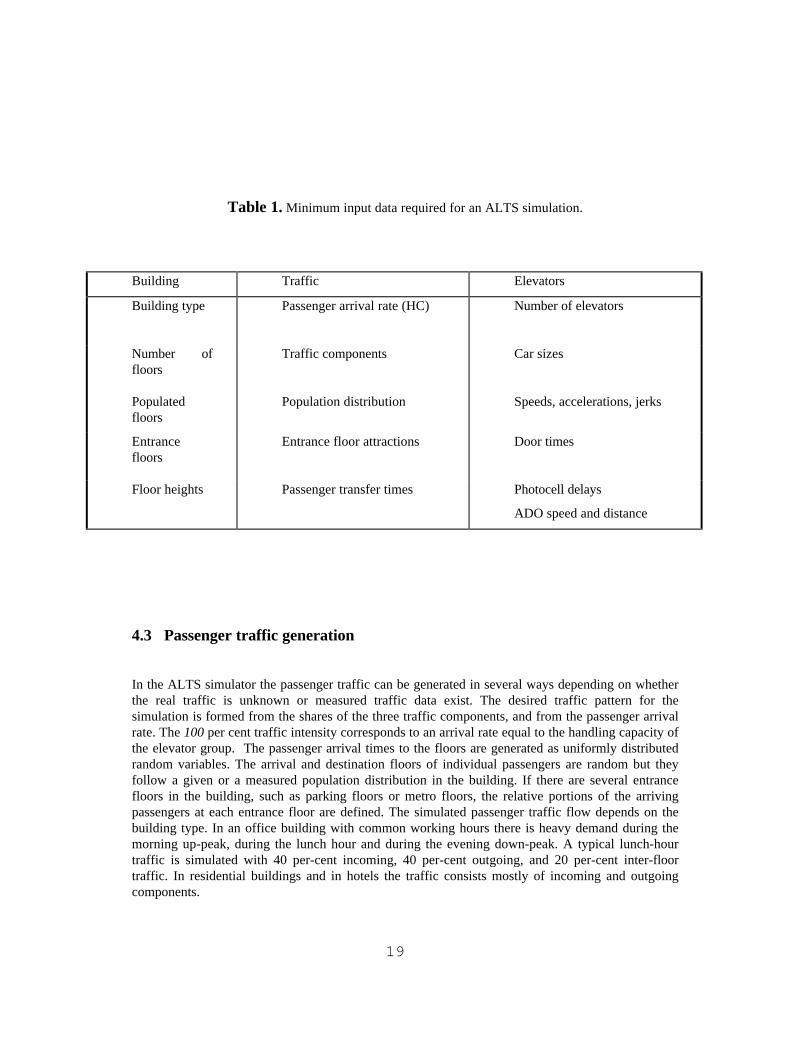
19
Table 1. Minimum input data required for an ALTS simulation.
Building Traffic Elevators
Building type Passenger arrival rate (HC) Number of elevators
Number offloors
Traffic components Car sizes
Populatedfloors
Population distribution Speeds, accelerations, jerks
Entrancefloors
Entrance floor attractions Door times
Floor heights Passenger transfer times Photocell delays
ADO speed and distance
4.3 Passenger traffic generation
In the ALTS simulator the passenger traffic can be generated in several ways depending on whetherthe real traffic is unknown or measured traffic data exist. The desired traffic pattern for thesimulation is formed from the shares of the three traffic components, and from the passenger arrivalrate. The 100 per cent traffic intensity corresponds to an arrival rate equal to the handling capacity ofthe elevator group. The passenger arrival times to the floors are generated as uniformly distributedrandom variables. The arrival and destination floors of individual passengers are random but theyfollow a given or a measured population distribution in the building. If there are several entrancefloors in the building, such as parking floors or metro floors, the relative portions of the arrivingpassengers at each entrance floor are defined. The simulated passenger traffic flow depends on thebuilding type. In an office building with common working hours there is heavy demand during themorning up-peak, during the lunch hour and during the evening down-peak. A typical lunch-hourtraffic is simulated with 40 per-cent incoming, 40 per-cent outgoing, and 20 per-cent inter-floortraffic. In residential buildings and in hotels the traffic consists mostly of incoming and outgoingcomponents.
20
More detailed parameters for passenger traffic generation can be defined when measured data of thetraffic in an actual building exists. The reconstruction of passenger traffic flow depends on howcomprehensive the measured data is. With temporarily connected traffic analyzers only the hall callsand elevator stops are usually measured. From the stop information the passenger arrival rate can bededuced with some accuracy. For example, with the inverse S-P method (Al-Sharif 1992) the numberof passengers inside the car at the lobby is estimated from the measured number of stops at upperfloors. A well-known equation for the expected number of elevator stops during up-peak is reversedwhen using this method. The number of stops caused by the incoming, outgoing and inter-floorcomponents can be deduced if information on hall and car calls is available. Without the car callinformation the estimation of the shares of the three traffic components is more inaccurate.
With more sophisticated temporarily connected analyzers the elevator position, the door states andthe photocell signals can also be measured. The individual passenger trips can be reconstructed fromthe measured traffic events by analysing separately each elevator round trip. In laboratory tests anaccuracy of 10 % in the passenger traffic intensity was obtained when reconstructing individualpassenger trips from the elevator traffic event files (Väljä 1990). For external analyzers, themeasurement of car calls requires too much wiring. With built-in elevator monitoring systems, orinside the group control, the car call information is available. With the traffic event data includingthe car call information a maximum error of 5% was found for the passenger arrival and destinationfloors (Leppälä 1991).
4.4 Simulation sequence in ALTS
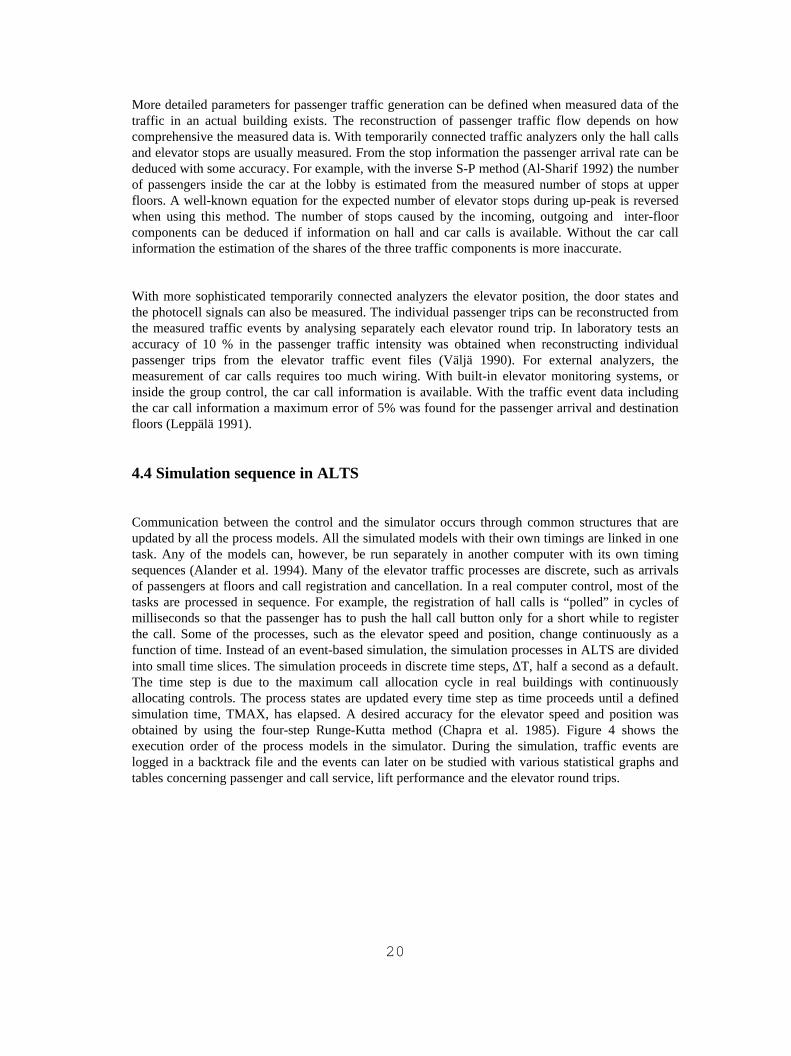
Communication between the control and the simulator occurs through common structures that areupdated by all the process models. All the simulated models with their own timings are linked in onetask. Any of the models can, however, be run separately in another computer with its own timingsequences (Alander et al. 1994). Many of the elevator traffic processes are discrete, such as arrivalsof passengers at floors and call registration and cancellation. In a real computer control, most of thetasks are processed in sequence. For example, the registration of hall calls is “polled” in cycles ofmilliseconds so that the passenger has to push the hall call button only for a short while to registerthe call. Some of the processes, such as the elevator speed and position, change continuously as afunction of time. Instead of an event-based simulation, the simulation processes in ALTS are dividedinto small time slices. The simulation proceeds in discrete time steps, ∆T, half a second as a default.The time step is due to the maximum call allocation cycle in real buildings with continuouslyallocating controls. The process states are updated every time step as time proceeds until a definedsimulation time, TMAX, has elapsed. A desired accuracy for the elevator speed and position wasobtained by using the four-step Runge-Kutta method (Chapra et al. 1985). Figure 4 shows theexecution order of the process models in the simulator. During the simulation, traffic events arelogged in a backtrack file and the events can later on be studied with various statistical graphs andtables concerning passenger and call service, lift performance and the elevator round trips.
21
START ALTS
INITIALIZE
GENERATE PASSENGER TRAFFIC
INCREASE TIME T= T + ∆ ∆ T
REGISTRATE LANDING CALLS
ALLOCATE LANDING CALLS TO ELEVATORS
UPDATE WAITING PASSENGERS AT LANDINGS
CONTROL DYNAMICS OF ELEVATORS
UPDATE DISPLAY
SAVE EVENTS TO A BACKTRACK FILE
T <=<=TMAX
END
YES
NO
Figure 4. Flow chart of the simulation sequence.
22
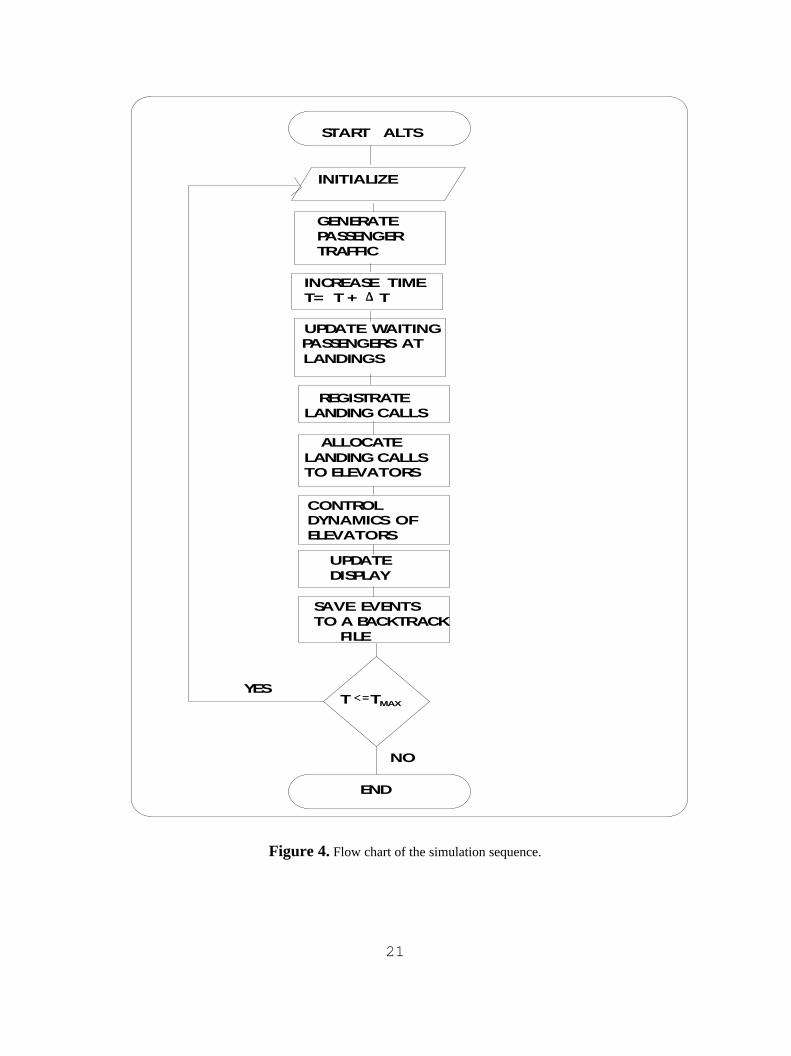
4.5 Simulated passenger traffic phenomena
Correlation between elevator performance and passenger service have been studied with the ALTSsimulator. A general approximation is that the average passenger waiting time is half, or three-quarters, of the up-peak interval(BS 5655 1990). This is true in up-peak if elevators and passengersarrive uniformly in time, and the building has only one main entrance floor (Publication III). In abuilding with multiple entrances the average waiting time during incoming traffic can exceed theinterval value. In traffic situations other than incoming traffic, the waiting times depend on thegroup supervisory control system. Figure 5 shows simulation results for a building with one mainentrance. According to Figure 5a, the average waiting time stays below the interval until thepassenger arrival rate reaches the handling capacity. In Figure 5b, the average interval, averagepassenger waiting time and average hall call time are shown for outgoing traffic. The interval foroutgoing traffic is shorter than for incoming traffic since the group control can limit the number ofstops during outgoing traffic. According to the figures, the average waiting time during the down-peak with 100 % traffic intensity is approximately the same as during the up-peak. During the lunchhour with 100 % traffic intensity the average waiting time is greater than during the down-peak(Publication II). Elevators can transport during the lunch hour traffic about 1.2 - 1.4 times, andduring the down peak 1.4 - 1.9 times more passengers in a time unit than during the up-peak period.
INCOMING TRAFFIC
95 %
80%
53%
0.0 10.0 20.0 30.0 40.0 50.0 60.0 70.0 80.0 90.0
0 50 100Traffic intensity % (100% = Up-Peak
Handling Capacity)
Tim
e (s
)
Av. WaitingTime Av. Hall CallTime Av. Interval
OUTGOING TRAFFIC
75%
60%
0.0
10.0
20.0
30.0
40.0
50.0
60.0
70.0
80.0
10 40 70 100 130 160Traffic Intensity % (100 % = Up-peak Handling Capacity)
Tim
e (s
)
Av. Waiting Time
Av. Hall Call TimeAv. Interval
(a) (b)
Figure 5. Simulated service level parameters in a building with one entrance floor during incoming(a) and outgoing traffic (b). Numbers beside the curves refer to the car load factor.
23
5. PLANNING OF ELEVATOR GROUPS
5.1 General planning principles
The selection of the number of elevators, their sizes and speeds is always a compromise between thebudget, the building space available and the passenger service level. The investment price of theelevator group consists on many factors, such as the number of cars, car sizes and speeds, the numberof landing floors, control options, signalization and car decoration.
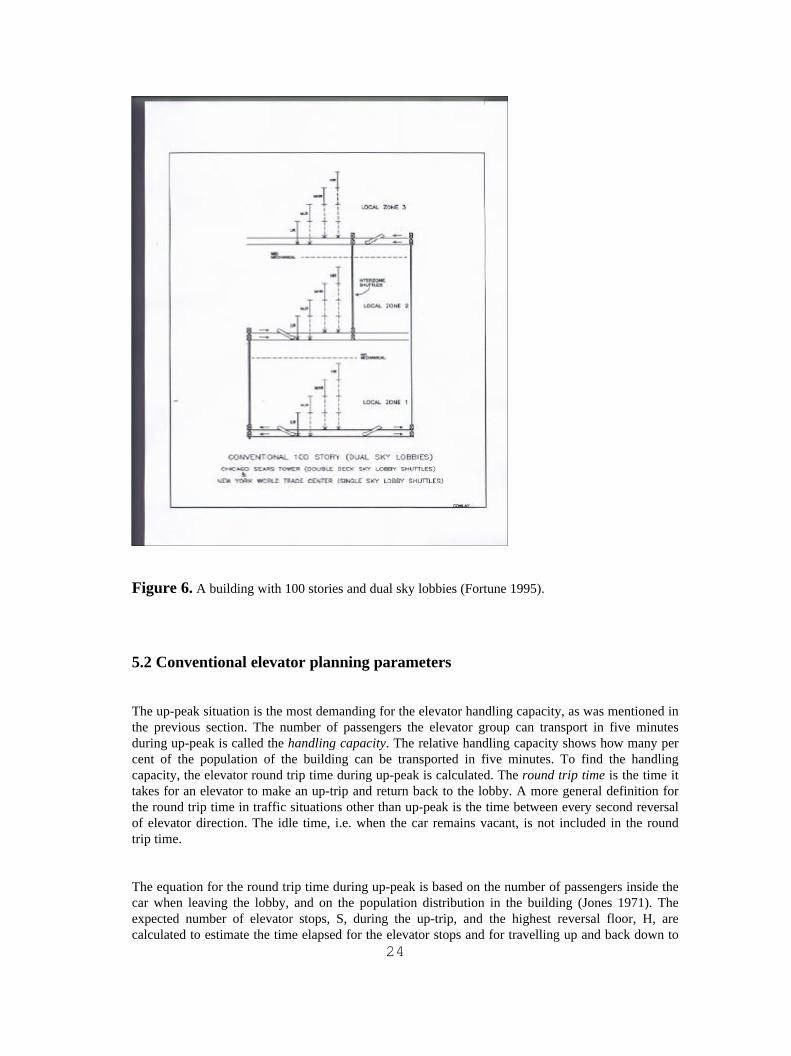
Saving the space used by the elevator shafts will pay back its price in the long term. Shaft space canbe decreased, for example, by packing more than one car in a shaft. As yet this has been possibleonly with double-deck elevators. The highest building in the world, completed in 1996, the 450 mhigh Petronas Tower in Kuala Lumpur, has 88 floors served by 29 double-deck elevators. Accordingto some estimations, a more favorable solution than double-deck elevators for mega high-risebuildings with more than 60-80 floors are single-deck elevator groups with sky lobbies (Jenkins1993). The building is then divided into zones where shuttle elevators serve the traffic between themain lobby and the sky lobby floors. Large single-and double-deck elevators are used as shuttle lifts.Local zones are served by single-deck elevator groups. The sky-lobby arrangement does not requireas much shaft space as in the case where all the elevators leave from the main entrance. The largestshuttle groups are at the moment installed in the New York World Trade Center and in the ChicagoSears Tower (Figure 6). Both the buildings have three local zones with one main entrance and twosky lobbies. Each local zone has four groups of elevators: low-rise (LR), medium low-rise (MLR),medium high-rise (MHR) and high-rise (HR) elevator groups. The number of sky lobbies and shuttlelifts could still be reduced if the local elevator groups served the traffic down from the sky lobby aswell. In buildings with more than 20 - 30 stories, the floors are usually divided into zones served bylocal elevator groups.
When planning elevator groups, sufficient transportation capacity and reasonably short passengerwaiting and journey times are guaranteed. Traditionally, three performance parameters are defined,e.g. the handling capacity, the interval, and the travel time. New parameters for elevator planning,the average passenger ride time and the average journey time, are introduced in this section(Publication III). Criteria for the planning parameters are discussed and a new criterion for theaverage journey time is defined. A criterion can also be set for the passenger service level at theconstruction stage of a new building. Estimations for the hall call times and for the passengerwaiting and journey times are obtained by simulations. The utilization of the ALTS simulator as atool in integrated elevator planning is described (Publication I). After the installation, elevator groupperformance and passenger service level can be checked by real-time monitoring systems.
24
Figure 6. A building with 100 stories and dual sky lobbies (Fortune 1995).
5.2 Conventional elevator planning parameters
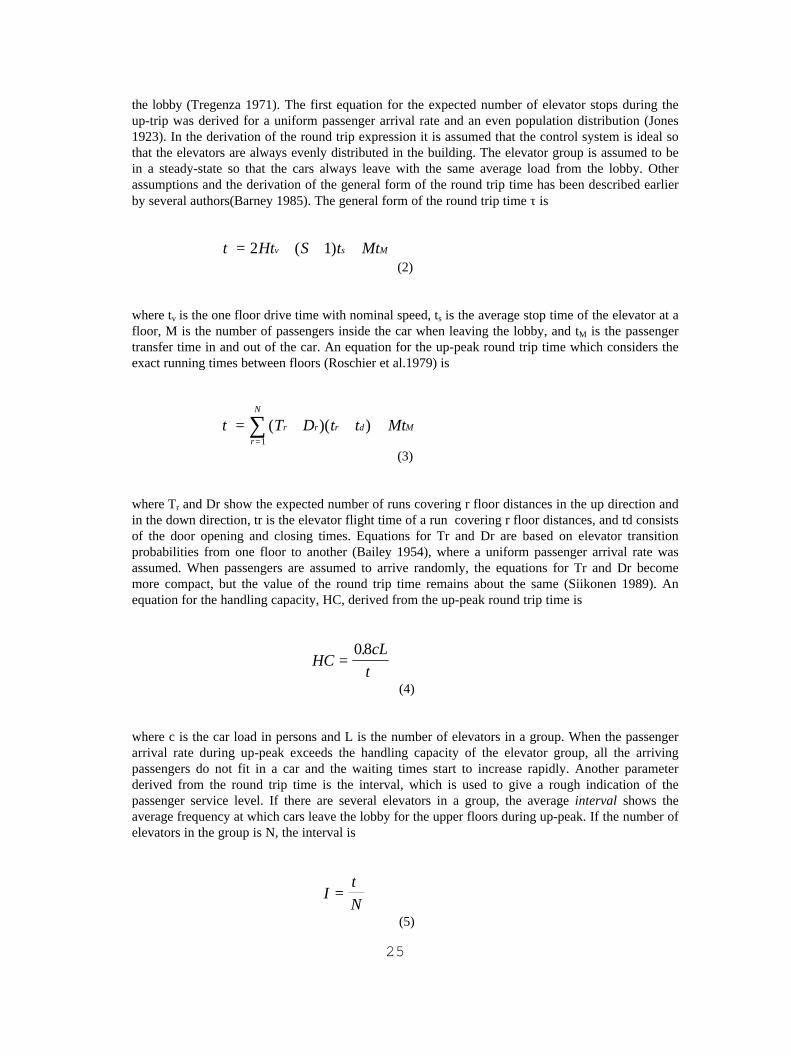
The up-peak situation is the most demanding for the elevator handling capacity, as was mentioned inthe previous section. The number of passengers the elevator group can transport in five minutesduring up-peak is called the handling capacity. The relative handling capacity shows how many percent of the population of the building can be transported in five minutes. To find the handlingcapacity, the elevator round trip time during up-peak is calculated. The round trip time is the time ittakes for an elevator to make an up-trip and return back to the lobby. A more general definition forthe round trip time in traffic situations other than up-peak is the time between every second reversalof elevator direction. The idle time, i.e. when the car remains vacant, is not included in the roundtrip time.
The equation for the round trip time during up-peak is based on the number of passengers inside thecar when leaving the lobby, and on the population distribution in the building (Jones 1971). Theexpected number of elevator stops, S, during the up-trip, and the highest reversal floor, H, arecalculated to estimate the time elapsed for the elevator stops and for travelling up and back down to
25
the lobby (Tregenza 1971). The first equation for the expected number of elevator stops during theup-trip was derived for a uniform passenger arrival rate and an even population distribution (Jones1923). In the derivation of the round trip expression it is assumed that the control system is ideal sothat the elevators are always evenly distributed in the building. The elevator group is assumed to bein a steady-state so that the cars always leave with the same average load from the lobby. Otherassumptions and the derivation of the general form of the round trip time has been described earlierby several authors(Barney 1985). The general form of the round trip time τ is
τ = + + +2 1Ht S t Mtv s M( ) (2)
where tv is the one floor drive time with nominal speed, ts is the average stop time of the elevator at afloor, M is the number of passengers inside the car when leaving the lobby, and tM is the passengertransfer time in and out of the car. An equation for the up-peak round trip time which considers theexact running times between floors (Roschier et al.1979) is
τ = + + +
=∑ ( )( )T D t t Mtr
r
N
r r d M
1 (3)
where Tr and Dr show the expected number of runs covering r floor distances in the up direction andin the down direction, tr is the elevator flight time of a run covering r floor distances, and td consistsof the door opening and closing times. Equations for Tr and Dr are based on elevator transitionprobabilities from one floor to another (Bailey 1954), where a uniform passenger arrival rate wasassumed. When passengers are assumed to arrive randomly, the equations for Tr and Dr becomemore compact, but the value of the round trip time remains about the same (Siikonen 1989). Anequation for the handling capacity, HC, derived from the up-peak round trip time is
HC
cL=
08.
τ (4)
where c is the car load in persons and L is the number of elevators in a group. When the passengerarrival rate during up-peak exceeds the handling capacity of the elevator group, all the arrivingpassengers do not fit in a car and the waiting times start to increase rapidly. Another parameterderived from the round trip time is the interval, which is used to give a rough indication of thepassenger service level. If there are several elevators in a group, the average interval shows theaverage frequency at which cars leave the lobby for the upper floors during up-peak. If the number ofelevators in the group is N, the interval is
I
N=
τ
(5)
26
5.3 Mean passenger ride and journey times
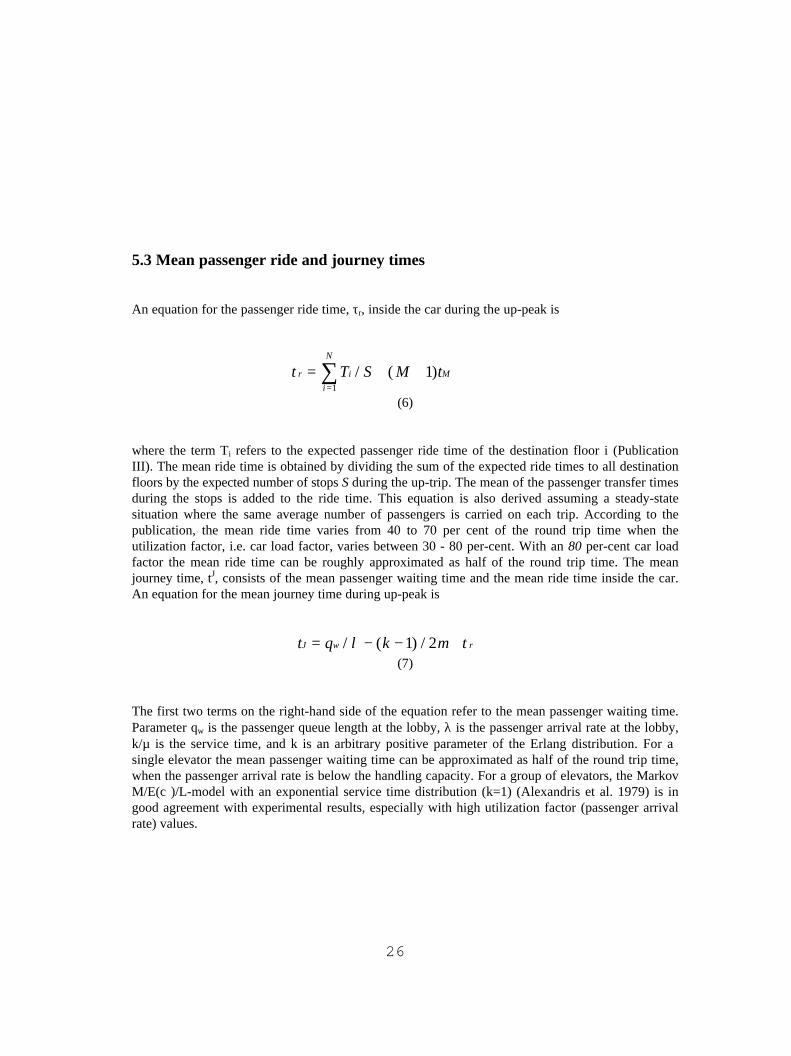
An equation for the passenger ride time, τr, inside the car during the up-peak is
τr i M
i
N
T S M t= + +=∑ / ( )1
1 (6)
where the term Ti refers to the expected passenger ride time of the destination floor i (PublicationIII). The mean ride time is obtained by dividing the sum of the expected ride times to all destinationfloors by the expected number of stops S during the up-trip. The mean of the passenger transfer timesduring the stops is added to the ride time. This equation is also derived assuming a steady-statesituation where the same average number of passengers is carried on each trip. According to thepublication, the mean ride time varies from 40 to 70 per cent of the round trip time when theutilization factor, i.e. car load factor, varies between 30 - 80 per-cent. With an 80 per-cent car loadfactor the mean ride time can be roughly approximated as half of the round trip time. The meanjourney time, tJ, consists of the mean passenger waiting time and the mean ride time inside the car.An equation for the mean journey time during up-peak is
t q kJ w r= − − +/ ( ) /λ µ τ1 2
(7)
The first two terms on the right-hand side of the equation refer to the mean passenger waiting time.Parameter qw is the passenger queue length at the lobby, λ is the passenger arrival rate at the lobby,k/µ is the service time, and k is an arbitrary positive parameter of the Erlang distribution. For a single elevator the mean passenger waiting time can be approximated as half of the round trip time,when the passenger arrival rate is below the handling capacity. For a group of elevators, the MarkovM/E(c )/L-model with an exponential service time distribution (k=1) (Alexandris et al. 1979) is ingood agreement with experimental results, especially with high utilization factor (passenger arrivalrate) values.
27
5.4 Performance and service level criteria
The same planning methods are used for all types of buildings, only the recommendations for theperformance parameter values and service level are different. Similar recommendations are used bythe elevator companies, architects and elevator consultants. In low residential buildings, elevators aremostly selected according to a proven practice, but planning calculations are needed in mid- andhigh-rise buildings with more than 12 - 13 floors.
In a new building, passenger traffic patterns are unknown. Performance recommendations arenormally given for the up-peak traffic. It provides sufficient handling capacity in all the other trafficsituations, as was discussed in Chapter 4.5. International recommendations for the handling capacityexist at least for residential buildings, offices, hotels and hospitals. The filling time of a buildingduring the up-peak, or the evacuation time of the building, are used when deciding the limits for thehandling capacity. The filling time of all the people to the building varies from 20 minutes to 100minutes depending on the type and usage of the building. For example, if the filling time is 20minutes, it means that 25 per cent of the total population of the building are transported in fiveminutes. The value of 25 per cent of total population in five minutes provides excellent handlingcapacity in all types of buildings according to the international practice. In residential buildings thelongest filling times are used, approximately 65 - 100 minutes. The handling capacity in residentialbuildings should exceed 5 - 7.5 per cent, and in commercial buildings 11 - 13 per cent of thepopulation in the building in five minutes (Strakosch 1983).
By using the handling capacity recommendations the size of the elevator system can be defined. Theexact number of elevators in a new building is adjusted by the interval value. Both the handlingcapacity and the interval indirectly affect the elevator speed. If the interval remains within a givenlimit, proper passenger waiting times are guaranteed in a building without special arrangements. Therecommended up-peak interval values are standardized. In commercial buildings the average intervalshould be between 20 - 30 s, in institutional buildings between 30 - 50 s, and in residential buildingsbetween 40 - 100 s (Barney et al.1985).
In addition to the handling capacity and the interval values, a third planning parameter is sometimesused. This parameter is not internationally standardized as well as the handling capacity and theinterval. It relates to the time a passenger spends in an elevator system by defining the minimumelevator speed and by restricting the number of served floors. Diverse definitions and the criteria ofthe third planning parameter are gathered in Table 2. The travel time is the time it takes for anelevator to run from the bottom floor to the top of the building at full speed and without any stops onthe way. It defines the minimum elevator speed v for travel height h. In office buildings it should bebelow 32 s and in residential buildings below 50 s (Roschier et al.1971). The transit time and themaximum passenger transit time to destination define the one-way transit time of the last exitingpassenger during up-peak. They should not exceed 150 s for residential and single-tenant buildings,and 180 s for diversified buildings (Strakosch 1984). For passengers leaving from the lobby theaverage time to destination consists of approximations of the average passenger waiting time andtravel time to the mid-point of a served zone. The mean passenger waiting time is approximated ashalf of the interval and the travel time as one quarter of the round trip time. The average time todestination is recommended to stay below 60 s (Fortune 1995). A rough estimation for the averagejourney time can be given for passenger arrival rates below handling capacity. The mean ride timeinside a car is then approximated as half of the round trip time, and the mean waiting time as half ofthe interval. To be consistent with the earlier definitions in Table 2, the average journey time insingle-tenant commercial buildings should be somewhere below 100 s, and below 110 s in hotels and
28
below 120 s in residential buildings.
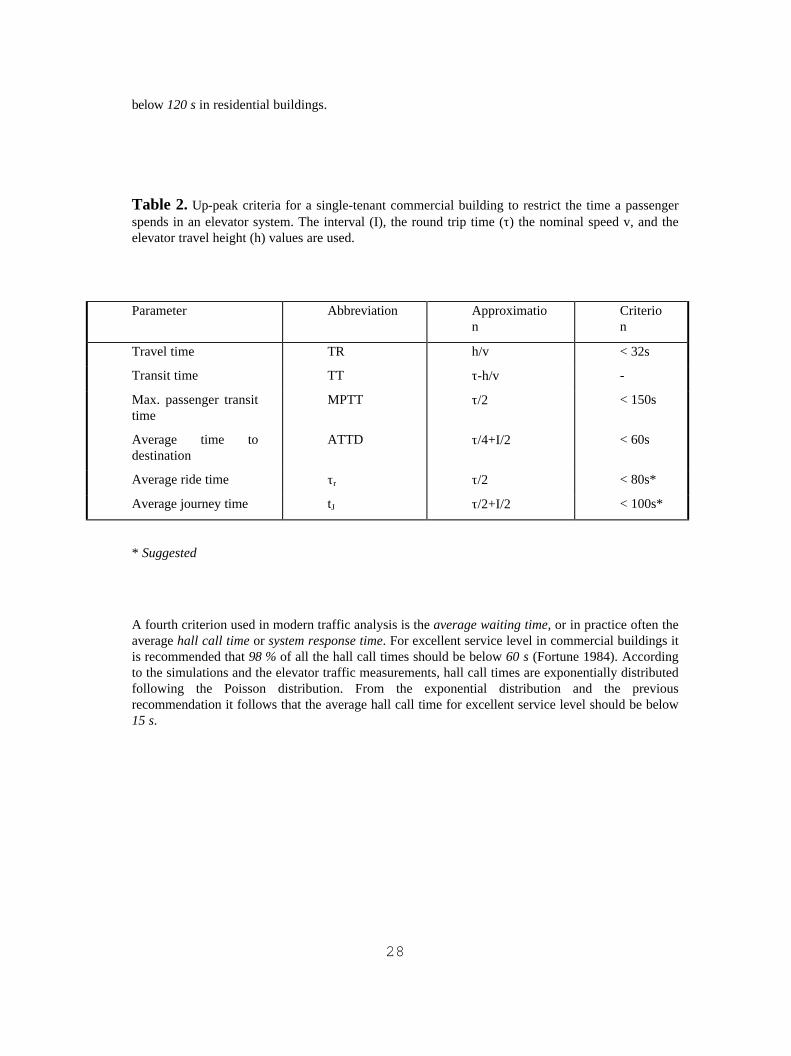
Table 2. Up-peak criteria for a single-tenant commercial building to restrict the time a passengerspends in an elevator system. The interval (I), the round trip time (τ) the nominal speed v, and theelevator travel height (h) values are used.
Parameter Abbreviation Approximation
Criterion
Travel time TR h/v < 32s
Transit time TT τ-h/v -
Max. passenger transittime
MPTT τ/2 < 150s
Average time todestination
ATTD τ/4+I/2 < 60s
Average ride time τr τ/2 < 80s*
Average journey time tJ τ/2+I/2 < 100s*
* Suggested
A fourth criterion used in modern traffic analysis is the average waiting time, or in practice often theaverage hall call time or system response time. For excellent service level in commercial buildings itis recommended that 98 % of all the hall call times should be below 60 s (Fortune 1984). Accordingto the simulations and the elevator traffic measurements, hall call times are exponentially distributedfollowing the Poisson distribution. From the exponential distribution and the previousrecommendation it follows that the average hall call time for excellent service level should be below15 s.
29
5.5 Simulation in elevator planning
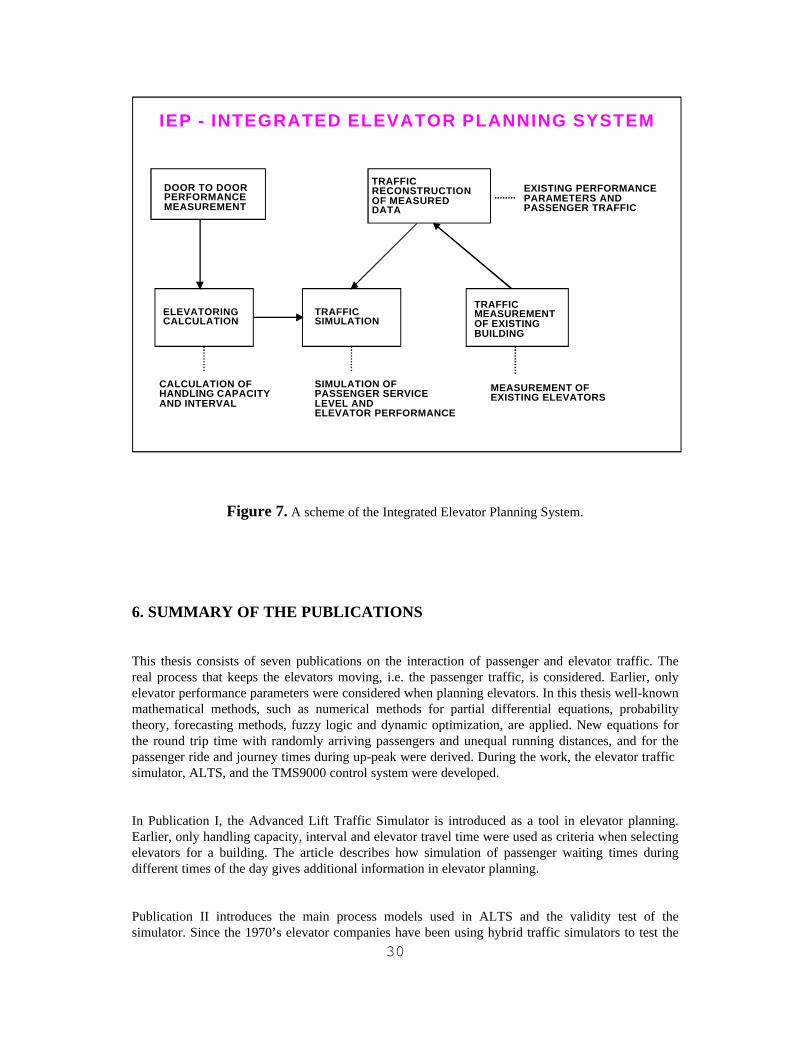
In existing buildings elevator shafts are already built and their number or sizes cannot be changed.The service level and capacity of old elevators can be improved by modernizing the existing elevatorswith new components. To find out the improvement potential the performance of the existingelevators has to be measured. Elevator operation times are measured over one, two, three, etc. floorflights until the elevator reaches full speed. The run and door times are measured separately. A quickway to measure the elevator performance is to use a stopwatch. More accurate measurements for thedoor-to-door performance times and the elevator stop times can be achieved with processor-baseddevices. Existing hall call times can be measured with temporarily connected traffic analyzers(Lustig 1986; McKay 1980; Roschier et al.1991). After the measurement the hall call times areanalysed, and the passenger traffic and the performance parameters can be reconstructed. Using themeasured performance data, the effect of current doors or the current drive system on the up-peakinterval and on the handling capacity can be calculated. The same calculations are repeated with theperformance values of new components. By comparing the performance parameter values of theexisting and the new elevators, the improvement potential can be estimated. The improvement inhall call times can be estimated by simulations. A typical improvement in average hall call times hasbeen 40 %, or more, when an old relay-based control has been modernized by a microprocessorcontrol system (Roschier, unpublished). About 20 % is due to the new control system, and the rest 20% is due to the new doors and drive system. In Figure 7 a scheme of the Integrated ElevatorPlanning System (Kaakinen et al. 1991) is shown. All the planning stages are used only in the mostdemanding modernization projects.
30
ELEVATORINGCALCULATION
TRAFFIC SIMULATION
TRAFFICMEASUREMENTOF EXISTINGBUILDING
CALCULATION OFHANDLING CAPACITYAND INTERVAL
SIMULATION OFPASSENGER SERVICE LEVEL AND ELEVATOR PERFORMANCE
MEASUREMENT OFEXISTING ELEVATORS
EXISTING PERFORMANCEPARAMETERS ANDPASSENGER TRAFFIC
IEP - INTEGRATED ELEVATOR PLANNING SYSTEM
DOOR TO DOORPERFORMANCEMEASUREMENT
TRAFFIC RECONSTRUCTION OF MEASUREDDATA
Figure 7. A scheme of the Integrated Elevator Planning System.
6. SUMMARY OF THE PUBLICATIONS
This thesis consists of seven publications on the interaction of passenger and elevator traffic. Thereal process that keeps the elevators moving, i.e. the passenger traffic, is considered. Earlier, onlyelevator performance parameters were considered when planning elevators. In this thesis well-knownmathematical methods, such as numerical methods for partial differential equations, probabilitytheory, forecasting methods, fuzzy logic and dynamic optimization, are applied. New equations forthe round trip time with randomly arriving passengers and unequal running distances, and for thepassenger ride and journey times during up-peak were derived. During the work, the elevator traffic simulator, ALTS, and the TMS9000 control system were developed.
In Publication I, the Advanced Lift Traffic Simulator is introduced as a tool in elevator planning.Earlier, only handling capacity, interval and elevator travel time were used as criteria when selectingelevators for a building. The article describes how simulation of passenger waiting times duringdifferent times of the day gives additional information in elevator planning.
Publication II introduces the main process models used in ALTS and the validity test of thesimulator. Since the 1970’s elevator companies have been using hybrid traffic simulators to test the
31
features of elevator controls. The control boards were attached to mini or mainframe computers. Thedevelopment of fully digitalized simulators started in universities in the mid of 1970’s. The controlcodes in these simulators were generic. The ALTS simulator was developed in the mid -1980’s bythe author. In ALTS, the original control software is used and the whole simulation sequence is runon a single personal computer. ALTS is used as a test tool in developing control software as well as atool in elevator planning.
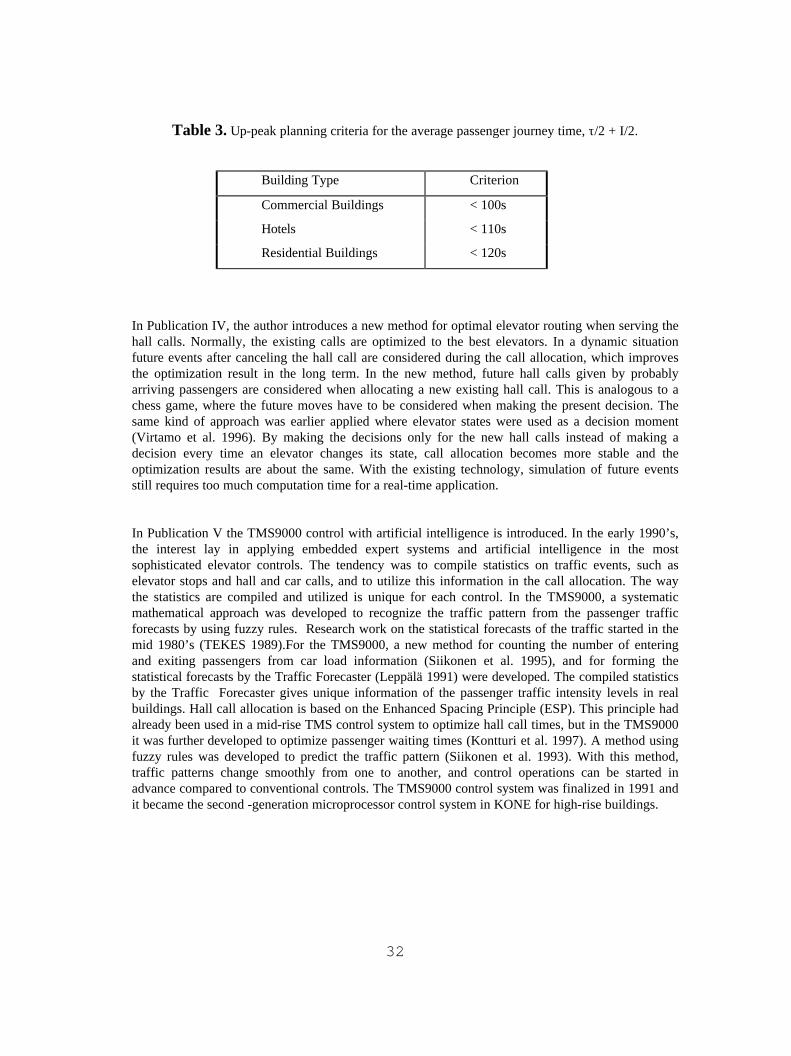
Publication III introduces new equations for the mean passenger ride time inside a car and for themean journey time in the up-peak situation. Earlier, passenger time to destination during up-peakwas estimated with diverse approximations. The new equation for mean passenger ride time is basedon the elevator transition probabilities from one floor to another. In this thesis, a new approximationfor the mean journey time is suggested to be nearer to the real mean journey time than the earlierapproximations. Planning criteria for the mean journey time are shown in Table 3, and their valuesare adjusted to be in good agreement with the old criteria in Table 2. In traffic situations other thanup-peak, passenger ride and journey times cannot be found in closed form since the control systemhas a large effect on these times.
32
Table 3. Up-peak planning criteria for the average passenger journey time, τ/2 + I/2.
Building Type Criterion
Commercial Buildings < 100s
Hotels < 110s
Residential Buildings < 120s
In Publication IV, the author introduces a new method for optimal elevator routing when serving thehall calls. Normally, the existing calls are optimized to the best elevators. In a dynamic situationfuture events after canceling the hall call are considered during the call allocation, which improvesthe optimization result in the long term. In the new method, future hall calls given by probablyarriving passengers are considered when allocating a new existing hall call. This is analogous to achess game, where the future moves have to be considered when making the present decision. Thesame kind of approach was earlier applied where elevator states were used as a decision moment(Virtamo et al. 1996). By making the decisions only for the new hall calls instead of making adecision every time an elevator changes its state, call allocation becomes more stable and theoptimization results are about the same. With the existing technology, simulation of future eventsstill requires too much computation time for a real-time application.
In Publication V the TMS9000 control with artificial intelligence is introduced. In the early 1990’s,the interest lay in applying embedded expert systems and artificial intelligence in the mostsophisticated elevator controls. The tendency was to compile statistics on traffic events, such aselevator stops and hall and car calls, and to utilize this information in the call allocation. The waythe statistics are compiled and utilized is unique for each control. In the TMS9000, a systematicmathematical approach was developed to recognize the traffic pattern from the passenger trafficforecasts by using fuzzy rules. Research work on the statistical forecasts of the traffic started in themid 1980’s (TEKES 1989).For the TMS9000, a new method for counting the number of enteringand exiting passengers from car load information (Siikonen et al. 1995), and for forming thestatistical forecasts by the Traffic Forecaster (Leppälä 1991) were developed. The compiled statisticsby the Traffic Forecaster gives unique information of the passenger traffic intensity levels in realbuildings. Hall call allocation is based on the Enhanced Spacing Principle (ESP). This principle hadalready been used in a mid-rise TMS control system to optimize hall call times, but in the TMS9000it was further developed to optimize passenger waiting times (Kontturi et al. 1997). A method usingfuzzy rules was developed to predict the traffic pattern (Siikonen et al. 1993). With this method,traffic patterns change smoothly from one to another, and control operations can be started inadvance compared to conventional controls. The TMS9000 control system was finalized in 1991 andit became the second -generation microprocessor control system in KONE for high-rise buildings.
33
Publication VI is the first publication of the TMS9000 and concentrates to describe the “artificialintelligence” (Traffic Forecaster). It describes the method how fuzzy logic is used to recognize thepassenger traffic pattern from the statistical forecasts in a building.
Publication VII is a general publication of the implementation of the TMS9000 control system. Itcompares the same control without and with artificial intelligence. With an example it is shown thatthe maximum waiting times at the busy floors are decreased and average waiting times are balancedfloor by floor when using artificial intelligence. The TMS9000 control system with artificialintelligence is effective especially in buildings with uneven passenger arrival rates at different floorsand in different directions.
7. CONCLUSIONS
The goal of this work was to add the passenger perspective to the control and planning of elevators inmultiple shafts. The passenger traffic in a building is divided into incoming, outgoing and inter-floortraffic components. With these three components, traffic in a building can be defined morecomprehensively than with the definition of conventional up and down traffic. These basicdefinitions have been adapted in the ALTS simulator and they are also used in the TMS9000 controlsystem to define the traffic pattern.
The service level of old relay systems have been measured with elevator traffic analyzers. Accordingto the measurements the traffic repeats a pattern quite consistently from day to day in most buildings.Thus the peak traffic hours and peak traffic floors can be forecast according to the historical data. Inthe TMS9000 control system, the information on the passenger traffic flow in the building is learnedfor every weekday. Passengers using the elevators are not aware of the measurement, and they do nothave to get used to new practices, such as destination buttons. According to the simulation tests, theTMS9000 control system improves the passenger service level in commercial buildings especiallyduring peak traffic hours when the passenger arrival rates at different floors and directions vary. Apractical example where an old electronic control system was modernized with the TMS9000 controlsystem showed an improvement of about 35-40 % in average hall call times. The improvement inpassenger waiting times is about the same since passenger waiting times correlate with call timeswhen the traffic intensity stays below handling capacity.
In the future, more sophisticated call allocation algorithms will be developed and new optimizationtargets will be found. In optimizing a single target, such as the average hall call time, a limit exists atwhich new call allocation algorithms do not bring much improvement. The present tendency is topay attention to several items simultaneously, such as to improve passenger service and comfortlevel, to increase handling capacity and to save of energy, ropes and other elevator equipment. Byminimizing passenger journey times, also waiting times, ride times and the number of stops areminimized. Often the optimization targets are in conflict with each other, and they cannot beachieved simultaneously. To make elevators ride smoothly their acceleration and jerk values have tobe decreased, which increases passenger waiting times and reduces handling capacity. If lowacceleration and jerk values are taken into account already when defining the elevator handlingcapacity in a new building, good ride comfort and short waiting times can be achievedsimultaneously. One way to achieve as many optimization targets as possible is to change the weightsof the optimization targets according to the traffic pattern during the day.
34
In elevator planning, the number, size and performance of the elevators are mostly determined bytwo planning parameters: the up-peak handling capacity and interval. In an elevator group withseveral elevators, the handling capacity may be good and the interval may be short, but the round triptime and passenger ride time inside the car may be long. Instead of the interval, more comprehensiveand understandable criteria would be to use the average passenger waiting and journey times in up-peak. For the average passenger waiting time, half of the interval value and criteria could be usedeven though they give rough estimations of the average waiting time. By using the average journeytime in elevator planning, the total time a passenger spends in an elevator system would remainshort. In a high-rise building the journey time criterion sets a limit on the number of floors served byan elevator group.
The present work is based on the assumption that each elevator occupies one shaft. Currently, theconstruction of mega high-rise buildings with heights in excess of 450 m has promoted thedevelopment of ropeless elevators (Kamaike et al. 1991; Kim et al. 1993). Building core space wouldbe saved if only one shaft were required for the up and another for the down direction for as manyelevator units as needed. These kinds of concepts arouse interesting speculations as to how thetransportation and control of the traffic in buildings should be planned to provide the best servicemost economically. In a single-shaft system, the planning of elevators would not be as critical as inthe present systems, since handling capacity could be increased later by adding the required numberof cars in the shaft. Elevators could be supervised by a group control, or they could be handled astrains, independently moving cars or robots. In these circumstances the whole elevator control systemshould be reconsidered. However, the main process, the passenger traffic flow in a building and thetransportation demand, is not affected by the elevator system. The statistical forecasts andmathematical methods applied to the passenger traffic analysis in this thesis remain valid even if theelevator configuration and control were greatly changed.

35
REFERENCES
Aalto, S., Odotuskustannusten minimointi joukkopalvelvussa jonossa, Lic. Thesis, University ofHelsinki, 1995. 109 p.
Alander, J.T., Ylinen, J., Tyni, T. Optimizingelevator control parameters, Proceedings of the SecondFinnish Workshop on Genetic Algorithms and Their Applications, Vaasa, Finland, 1994.
Alexandris, N.A. Statistical models in lift systems, Ph.D. Thesis, University of Manchester Instituteof Science and Technology, 1977. 252p.
Alexandris, N.A., Barney, G.C., Harris, C.J. Multi-car lift system analysis and design, Appl. Math.Modelling, 1979, Vol.3,No.8,pp. 269-274.
Al-Sharif, L. New concepts in lift traffic analysis: the inverse S-P (I-S-P) method, ElevatorTechnology 4. Stockport, England: IAEE Publications, 1992. pp. 8-17. ISBN 0-9513498-5-6.
Aoki, H., Sasaki, K. Group supervisory control system assisted by artificial intelligence, ElevatorWorld, 1990. No. 2, pp. 70-80.
Bailey, N. T. J. On queuing process with bulk service, Journal of the Royal Statistical Society, 1954.Vol. 16, No. 1, pp. 80-87.
Barney, G. C., dos Santos, S. M. Elevator traffic analysis, design and control, Peter Peregrinus Ltd.,UK, 1985. 386 p.
Barney, G. C. Lift simulation using PC’s, Proceedings of ELEVCON ‘88, IAEE, Karlsruhe, W.Germany, 1988. pp. 22-29.
Barney, G. C. Vertical transportation standards, Elevatori, 1995. No.7-8, pp. 109-114.
Bittar, J., Mendelsohn, A. Variable elevator up peak dispatching interval, U.S. Patent No. 4 305 479, 1981.
Browne, J. J., Kelly, J. J. Simulation of elevator system for world’s tallest buildings, TransportationScience, 1968. Vol.2, No. 1, pp. 35-56.
BS 5655. Lifts and service lifts, Part 6. Code of practice for selection and installation, BritishStandard , 1990. 44p.
36
Chapman, J. Supervisory panels from passenger to building management, Elevator World, 1994. No.3, pp.57-61.
Chapra, S. C., Canale, R. P. Numerical methods for engineers with personal computer applications, McGraw-Hill Book Company, 1985. 570p.
Closs, C. D. The computer control of passenger traffic in large lift systems, The Victoria Universityof Manchester, Ph.D. Thesis, 1970. 106p.
Crites, R. H. Large-scale dynamic optimization using teams of reinforcement learning agents, Ph.D.Thesis, University of Massachusetts, Computer Science, 1996. 104p.
Fortune, J. W. Elevatoring high rise buildings, International Conference on Tall Buildings,Singapore, 1984.
Fortune, J. W. Mega high-rise elevators; They could be hazardous to your health, Habitat and theHigh-Rise, Proceedings of the Fifth World Congress, Council on Tall Buildings and Urban Habitat,Amsterdam, Holland, 1995. pp. 661-676.
Fujino, A., Tobita, T., Yoneda, K. An on-line tuning method for multi-objective control of elevatorgroup, ISBN 0-7803-0582-5/92, International Conference on Industrial Electronics, Control,Instrumentation and Automation, Second Volume, San Diego, CA, U.S.A., 1992. pp. 795-800.
Hakala, H. Applications of linear motors in elevator hoisting machines, Ph.D. Thesis, TampereUniversity of Technology, 1995. 152p.
Hirasawa, K., Kuzunuki, S., Iwasaki, T., Kaneko, T. Optimal hall call assignment method ofelevator group supervisory control system, Joint Automatic Control Conference, USA, 1978. pp.305-313.
Jenkins, K. Structures and elevators, Elevator World,1993.No.1,pp. 48-59.
Jones, B. The probable number of stops made by an elevator, General Electric Review, 1923. Vol.26, No. 8, pp. 583-587.
Jones, B. W. Simple analytical method for evaluating lift performance during up peak,Transportation Researech, 1971. No. 5, pp. 301-306.
Kaakinen, M., Roschier, N-R. Integrated elevator planning system, Elevator World, 1991. No. 3, pp.73-76.

37
Kamaike, H., Ishii T., Watanable E., Matsukura Y. A ropeless linear drive elevator, Elevator World,1991. No.3, pp. 42-43.
Kameli, N. Intelligent elevator dispatching systems, AI Expert, 1989. No. 9, pp. 32-37.
Kawano, S., Yuminaka, T., Kobayashi, N. Remote and intelligent diagnostic system for elevatorsincorporating preventive maintenance, Elevator World, 1994. No. 5, pp. 66-71.
Kim, H. J., Takasi, Y., Torii, S., Watada, M., Ebihara, D. Study of the rope-less elevator with linearsynchronous motor, International Conference on Electrical Machines in Australia, Adelaide,Australia, 1993. pp. 439-444.
Kontturi, R., Siikonen, M-L. Procedure for controlling an elevator group, KONE Elevator, U.S.Patent No. 5 616 896, 1997.
Levy, D., Yadin, M., Alexandrovitz, A. Optimal control of elevators, International Journal Systems Science, 1977. Vol. 8, No. 3, pp. 301-320.
Leppälä, J. Forecasting passenger traffic in group control of elevators, Helsinki University ofTechnology, Master of Science Thesis, 1991. 75p. (In Finnish)
Lustig, A. Lift simulation program, Elevator World, 1986. No. 3, pp. 74-79.
Lustig, A. A data logger for lift engineers, Elevator World, 1986. No. 8, pp. 55-59.
McKay, E. M. A data logger for lift traffic engineering, Elevator World, 1980. No. 1, pp. 20-26.
Nakai, S., Kubo, S., Imasaki, N., Yoshitsuku, T., Kiji, J, Endo, T. Elevator group control systemwith fuzzy neural network model, The Fourth IEEE International Conference on Fuzzy Systems,Yokohama, Japan, 1995. pp. 37-38. ISBN 0-7803-2461-7/95. NEII Vertical TransportationStandards, National Elevator Industry, Inc. Performance Standards Committee, 7th edition, 1994.42p. 185 Bridge Plaza North, FT. Lee, NJ 07024, 201-944-3211.
Powell, B. A. Important issues in up peak traffic handling, Elevator Technology 4, Proceedings ofELEVCON’92, Amsterdam, Holland, 1992. pp. 207-218.
Powell, B. A., Sirag, D., J. Fuzzy logic - A new way of thinking about the complexities ofdispatching elevators, Elevator World, 1993. No. 9, pp. 78-84.

38
Roschier,N-R.,Kaakinen,M.,J. New fmulae or elevator round rip calcu-lation, Supplement toElevator World for ACIST members,1979.pp. 189-197.
Roschier, N-R., Virkkala, V. Planning of lift systems, Internal Publication of Kone Corporation,1971.
Roschier, N-R., Kangas, P., Korpela, J. Lift traffic analyzer LTA-3, User manual for logging,Internal Publication of Kone Corporation, 1991.
Roschier, N-R. Modern elevator traffic planning methods, KONE Elevators Research Center,unpublished.
Sakai,Y., Kurosawa,K. Development of elevator supervisory group control system with artificialintelligence,Hitachi Review,1984.Vol.33, No.1, pp. 25-30.
Sasaki, K., Markon, S., Nkagawa, M. Elevator group supervisory control system using neuralnetworks, Elevator World, 1996. No. 2, pp. 81-86.
Schröder, J. Pocket computer elevatoring - Optimizing for minimum cost, Elevator World, 1984.No. 2, pp. 19-20.
Schröder, J. Advanced dispatching - Destination hall calls + instant car-to-call assignment: M10,Elevator World, 1990. No. 3, pp. 40-46.
Siikonen, M-L. Computer modelling of elevator traffic and control, Helsinki University ofTechnology, Licentiate Thesis, 1989. 75p. (In Finnish)
Siikonen, M-L., Korhonen, T. Defining the traffic mode of an elevator, based on traffic statisticaldata and traffic type definitions, KONE Elevator, U.S. Patent No. 5 229 559, 1993.
Siikonen, M-L., Roschier, N-R. Determination of the number of persons entering and leaving anelevator car, KONE Elevator GMBH, U.S. Patent No. 5 435 416,1995.
Strakosch, G. R. Vertical transportation:elevators and escalators, John Wiley & Sons, Inc, 1967.495p.
Strakosch, G. R. Improve your elevatoring capability - Part I, Elevator World, 1983. No. 11, pp. 3-4.

39
Strakosch, G. R. Improve your elevatoring capability - Part IV, Elevator World, 1984. No. 2, pp.8-9.
TEKES Artificial intelligence, Tietotekniikan kehittämisohjelma FINPRIT, 1989. pp. 63-80.(InFinnish)
Tobita, T., Fujino, A., Inaba, H., Yoneda, K., Ueshima, T. An elevator characterized groupsupervisory control system, International Conference on Industrial Electronics, Control andInstrumentation, Japan, 1991. pp. 1972-1976. ISBN 0-87942-688-8.k
Tregenza, P. R. The prediction of lift performance in multi-storey buildings, Ph.D. Thesis,University of Nottingham, 1971. 138p.
Umeda, Y., Uetani, K., Ujihara, H., Tsuji, S. Fuzzy theory and intelligent options, Elevator World,1989. No. 7, pp. 86-91.
Virkkala, V. Hissitekniikan perusasioita, Internal Publication of Kone Corporation, 1983. 153p. (InFinnish)
Virtamo, J., Aalto, S. Procedure for controlling an elevator group, KONE Elevator GMBH, USPatent No. 5 503 249, 1996.
Väljä, M. Modelling of passenger traffic based on measurements with an elevator group, HelsinkiUniversity, Master of Science Thesis, 1990. 103p. (In Finnish)
Weinberger, W. A lift traffic simulator, Födern und Heben, 1967. Vol. 17, No. 16, pp. 923-925.