Embed Size (px)
Citation preview
Planning Issues inPlanning Issues inAgricultureAgriculture
www.csustan.edu/AgStudies/courseswww.csustan.edu/AgStudies/courses
Fall 2007Fall 2007
Population and Urban Growth
58 Counties in California
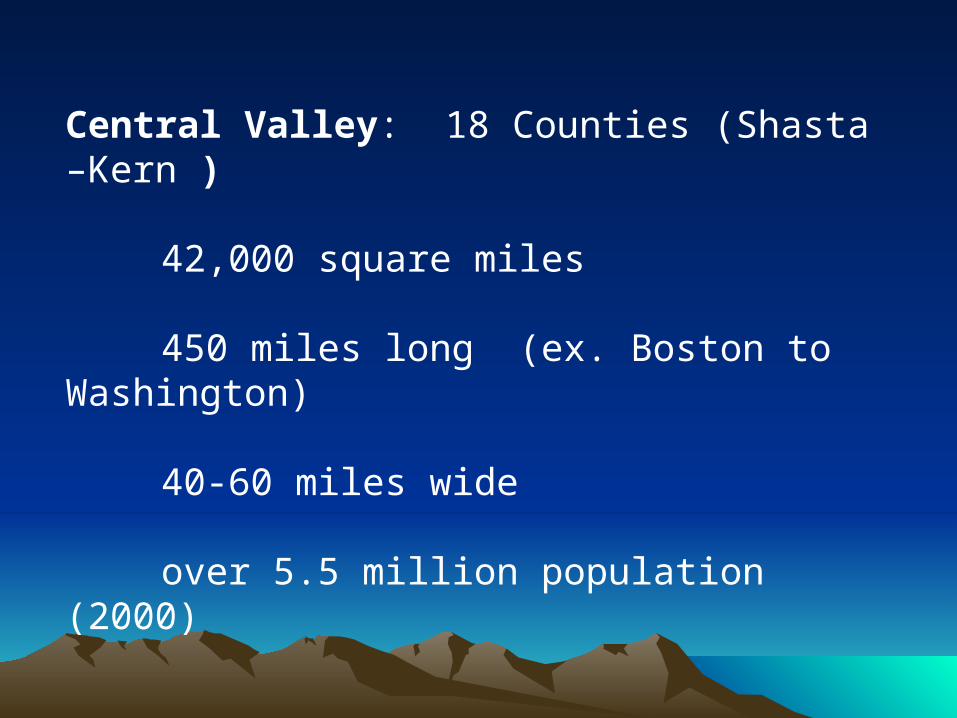
Central Valley: 18 Counties (Shasta –Kern )
42,000 square miles
450 miles long (ex. Boston to Washington)
40-60 miles wide
over 5.5 million population (2000)
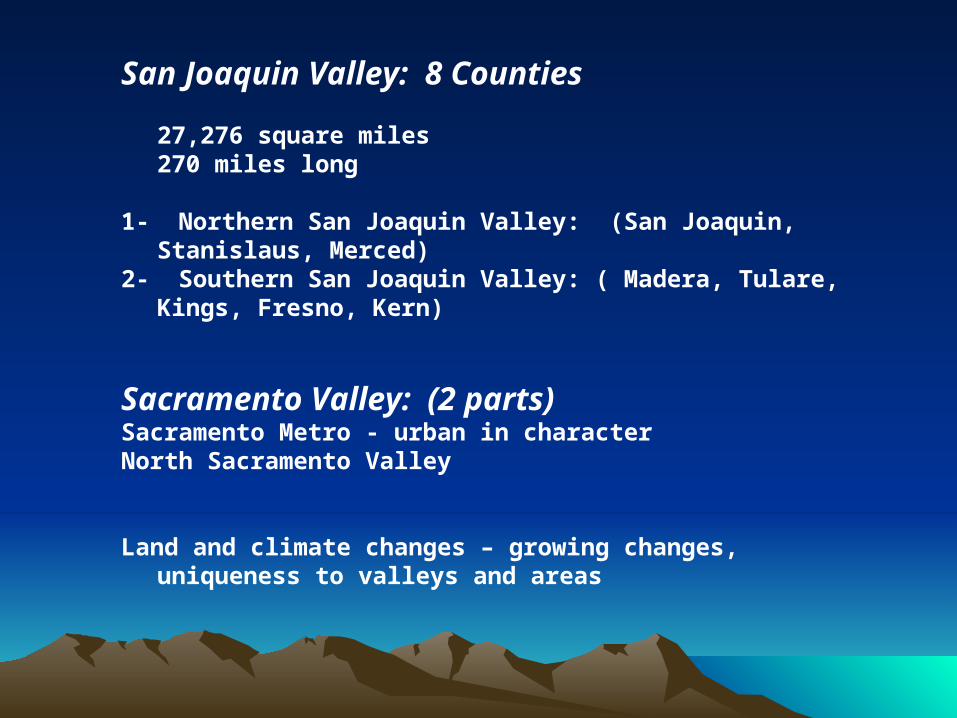
San Joaquin Valley: 8 Counties
27,276 square miles270 miles long
1- Northern San Joaquin Valley: (San Joaquin, Stanislaus, Merced)
2- Southern San Joaquin Valley: ( Madera, Tulare, Kings, Fresno, Kern)
Sacramento Valley: (2 parts)Sacramento Metro - urban in characterNorth Sacramento Valley
Land and climate changes – growing changes, uniqueness to valleys and areas
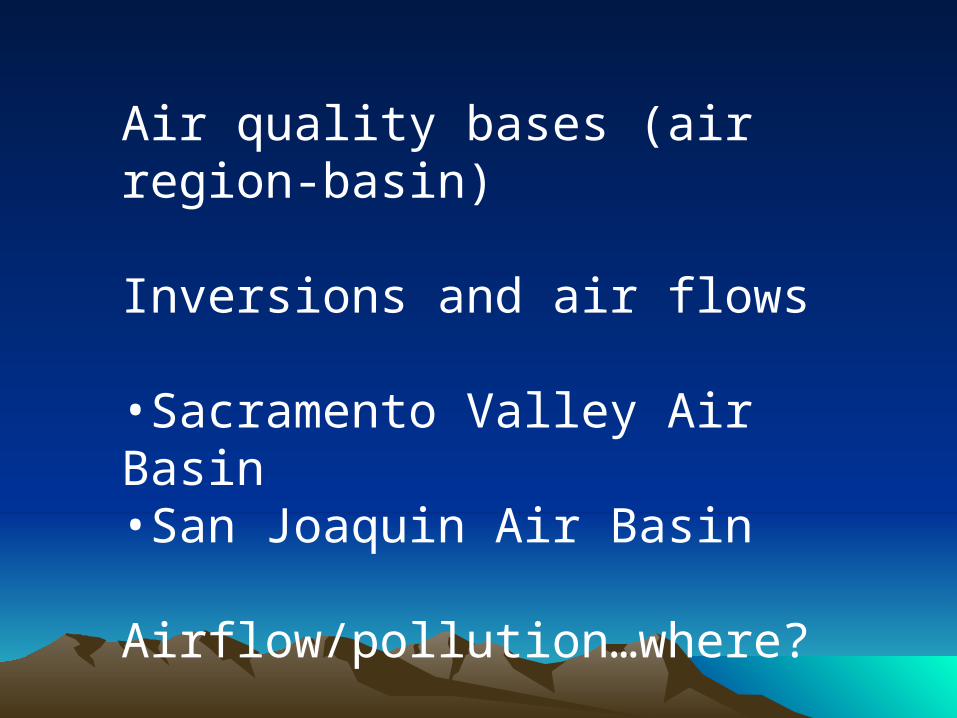
Air quality bases (air region-basin)
Inversions and air flows
•Sacramento Valley Air Basin•San Joaquin Air Basin
Airflow/pollution…where?
Watersheds: (All rivers flow downhill ?)
1-Sacramento River2-San Joaquin River3-Tulare/Kings
Where do they all end up?

Common characteristics of the valley region
Agriculture- linkage Diversity
30% employment
California is the most productive ag state ( # 1 in production)
San Joaquin valley produces ½ of states total in its 8 counties
6 of 8 counties produce more than a billion dollars/ year
Entire Central Valley produces 2/3 of states production

Valley Characteristics
Common Themes

1 – Fast paced population growth
California 1950-2000 – 220%
Valley 190.8%Stanislaus 251.3%Madera 233.1%Merced 201.7%Kern 189.8%Fresno 189.1%San Joaquin 180.7%Kings 176.8%Tulare 146.6%
2 – Increasing urbanization
•Bay Area commuters
•Prison Construction
•Traffic Congestion

3 – Increasing diversity• Cultural• Economic
4 – Increasing divergenceAreas becoming different • Diverging from coastal areas• and the rest of the state
5 – Unique CharacterEach county, city, and unincorporated community has a story to tell
Historical Growth in California
1950 – 1970 CA. 88.57%Valley not growing as fast (only 44%)Bay area and coastal areas – incredible
growth1970 – 2000 CA. 69.8%
Valley – 103.1%Highest growth in the valley – Stanislaus, Merced, Fresno, Madera (prison) 196.5%

Population Growth 1990 – 2000
CA. 13.8%Valley 20.5%Madera 39.8%Kings 27.6%Kern 21.4%Stanislaus 20.6%
Highest shift from North Valley to South valley
Assignment for next week…what has the population done since 2000? (hint: look up the CA Dept of Finance)
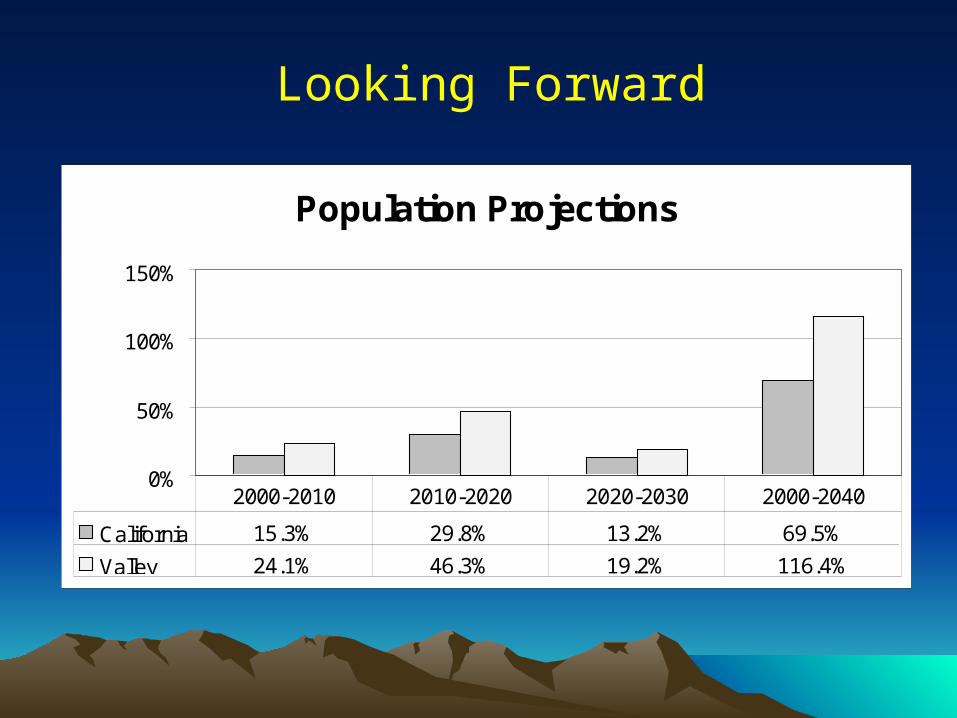
Population Projections
0%
50%
100%
150%
California 15.3% 29.8% 13.2% 69.5%
Valley 24.1% 46.3% 19.2% 116.4%
2000-2010 2010-2020 2020-2030 2000-2040
Looking Forward
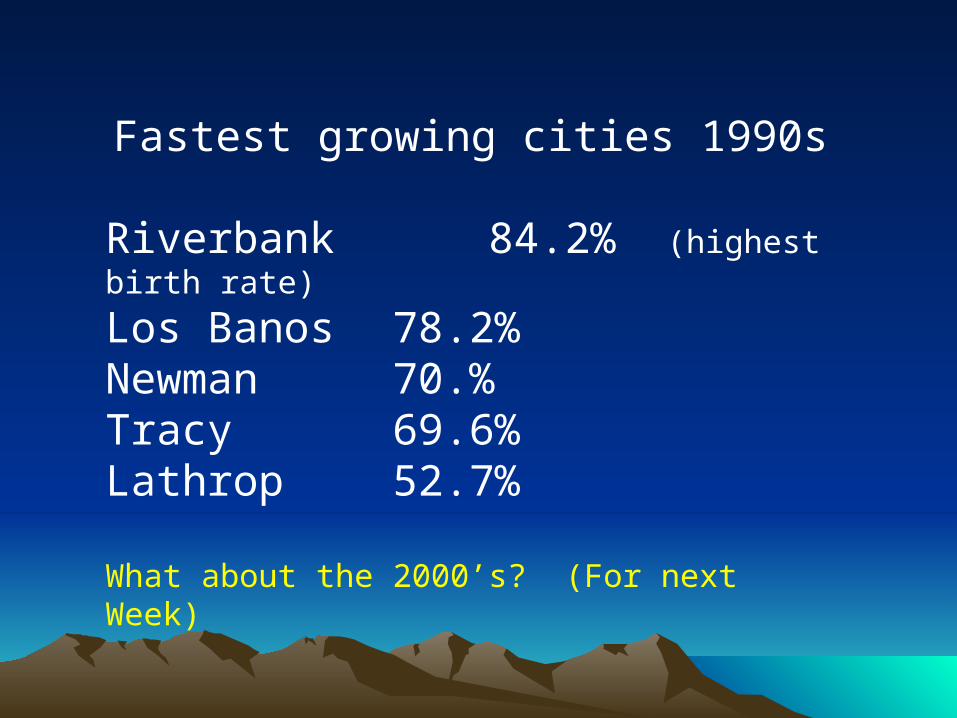
Fastest growing cities 1990s
Riverbank 84.2% (highest birth rate)
Los Banos 78.2%Newman 70.%Tracy 69.6%Lathrop 52.7%
What about the 2000’s? (For next Week)
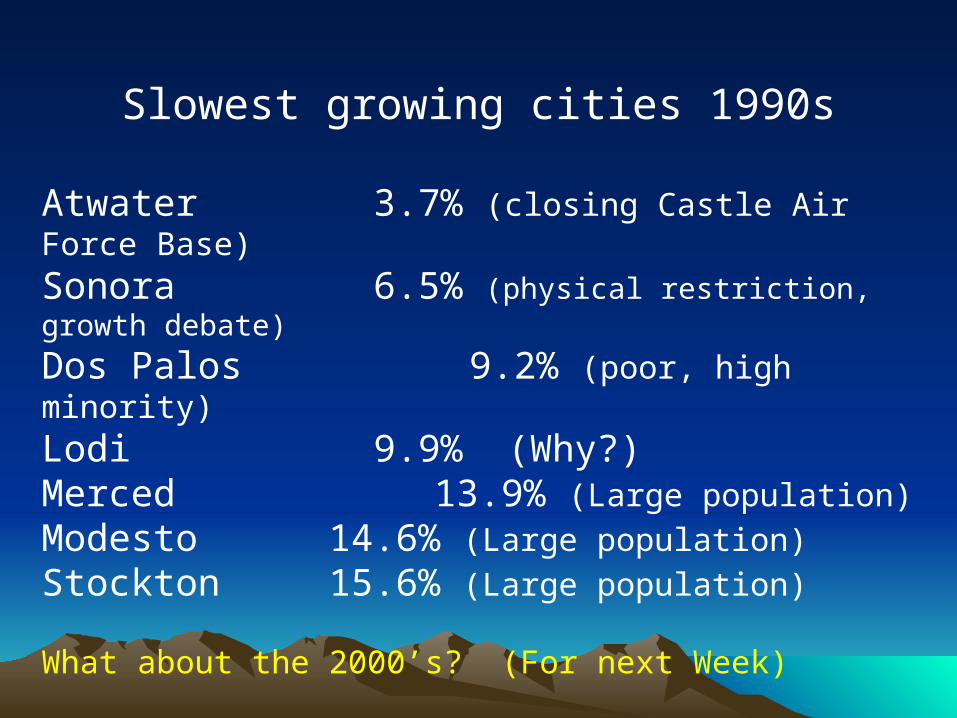
Slowest growing cities 1990s
Atwater 3.7% (closing Castle Air Force Base)
Sonora 6.5% (physical restriction, growth debate)
Dos Palos 9.2% (poor, high minority)
Lodi 9.9% (Why?)Merced 13.9% (Large population)
Modesto 14.6% (Large population)
Stockton 15.6% (Large population)
What about the 2000’s? (For next Week)
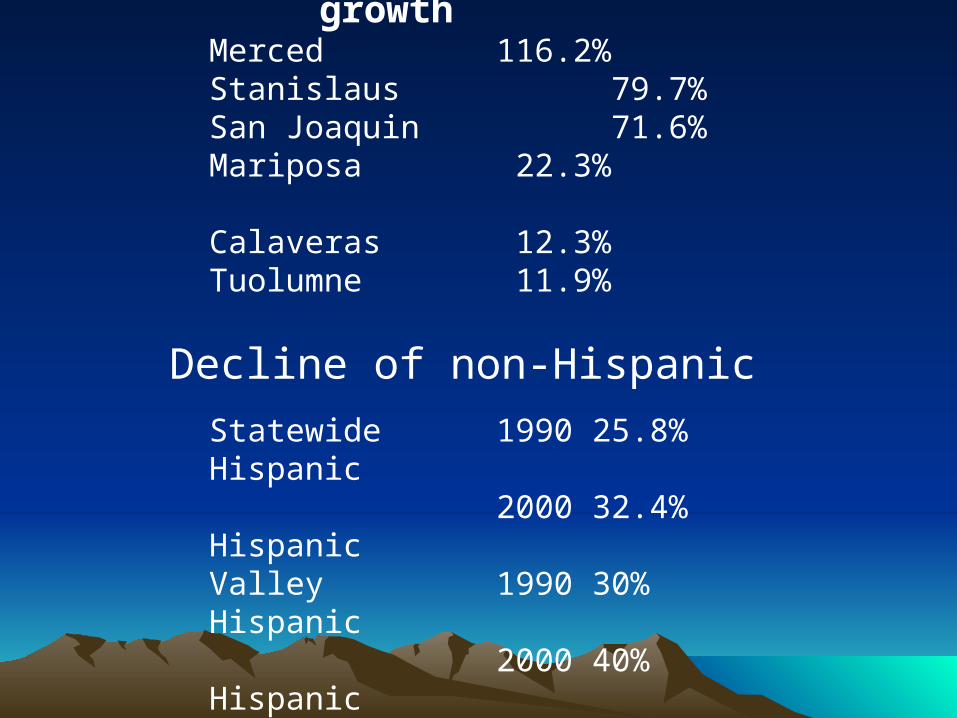
Hispanic share of population growth
Merced 116.2% Stanislaus 79.7%San Joaquin 71.6% Mariposa 22.3% Calaveras 12.3%Tuolumne 11.9%
Decline of non-Hispanic
Statewide 1990 25.8% Hispanic2000 32.4% Hispanic
Valley 1990 30% Hispanic2000 40% Hispanic

In 1990:San Jose 4545 Atwater 4250Modesto 5368 Stockton 3987Lodi 4896 Tracy 3380Ceres 4616 Merced 3460Manteca 4614 Los Banos 1964
In 2002:San Jose 5359 Atwater 4625Modesto 6576 Stockton 4825Lodi 5604 Tracy 6833Ceres 6366 Merced 4106Manteca 6250 Los Banos 4021
((NormallyNormally density down in large cities – growth spreading) density down in large cities – growth spreading) CyclesCycles
Population Density of our Cities (people per square mile)
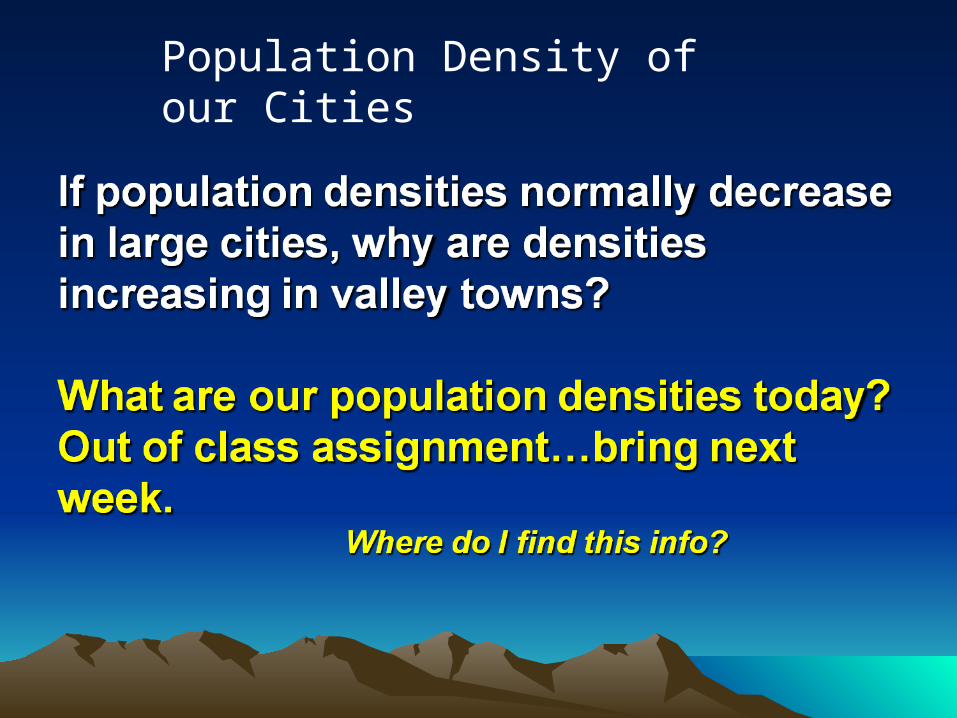
Population Density of our Cities

Population Density WebPopulation Density Web
Investigate the Internet for other links for
information as well as the list for the class.
If you can’t access this site from home, you will
have to use a university computer.
http://ca.rand.org/stats/community/popdensity.html
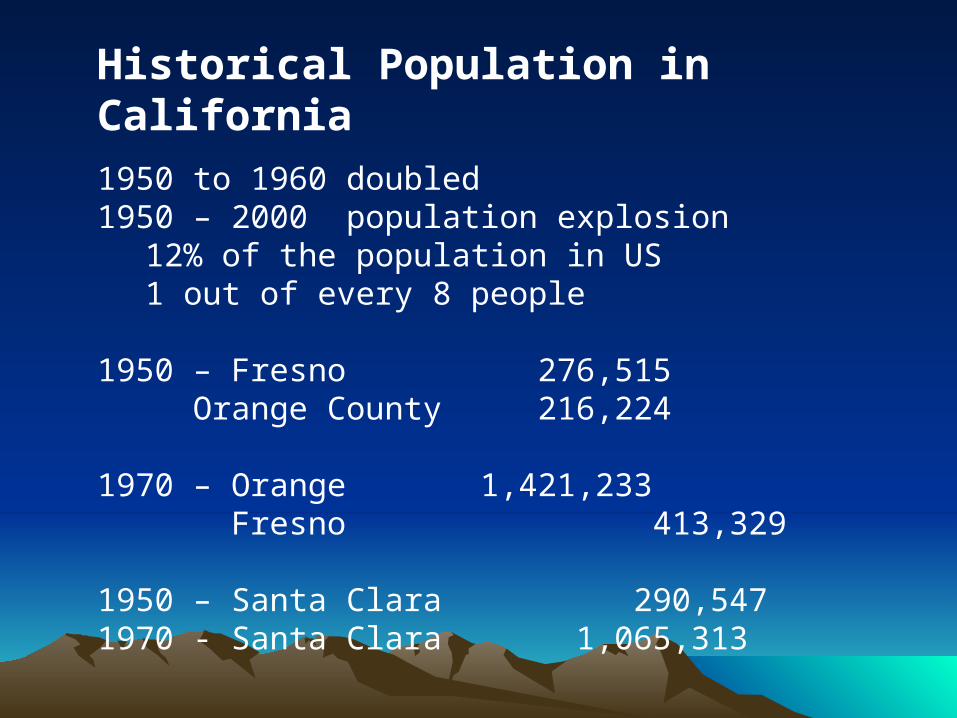
Historical Population in California
1950 to 1960 doubled1950 – 2000 population explosion
12% of the population in US 1 out of every 8 people
1950 – Fresno 276,515Orange County 216,224
1970 – Orange 1,421,233 Fresno 413,329
1950 – Santa Clara 290,5471970 - Santa Clara 1,065,313

Population continued…
Point: incredible coastal growth due to economic change
San Jose (surpassed population of San Francisco)Became city in 1950 95,0001960 204,0001970 569,400
L.A. value of Agriculture Production1950 – 4.1 million1970 – 7 millionToday – 7 million?____ Inflation? (Ag Census
data)
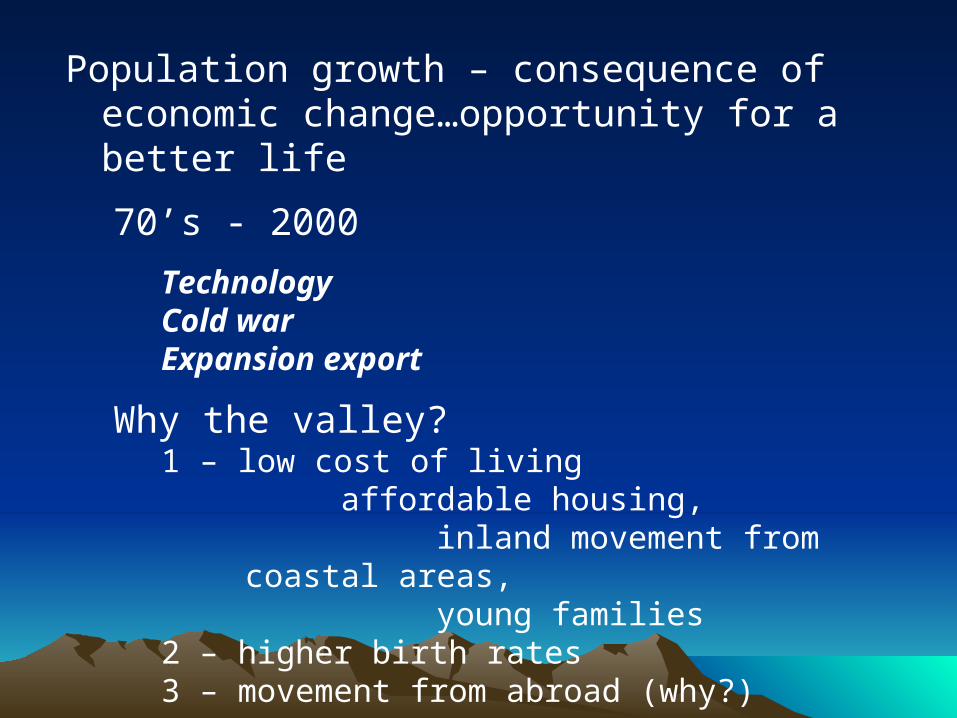
Population growth – consequence of economic change…opportunity for a better life
70’s - 2000
TechnologyCold warExpansion export
Why the valley? 1 – low cost of living
affordable housing, inland movement from coastal
areas, young families
2 – higher birth rates3 – movement from abroad (why?)

Growth effects:• More retail• Crowded• Pollution• More consumer choices• Faster population growth within cities
Racially and ethnically changing• Diversity increased in valley• Highest in Tulare, Merced, Madera,
Fresno, Kings
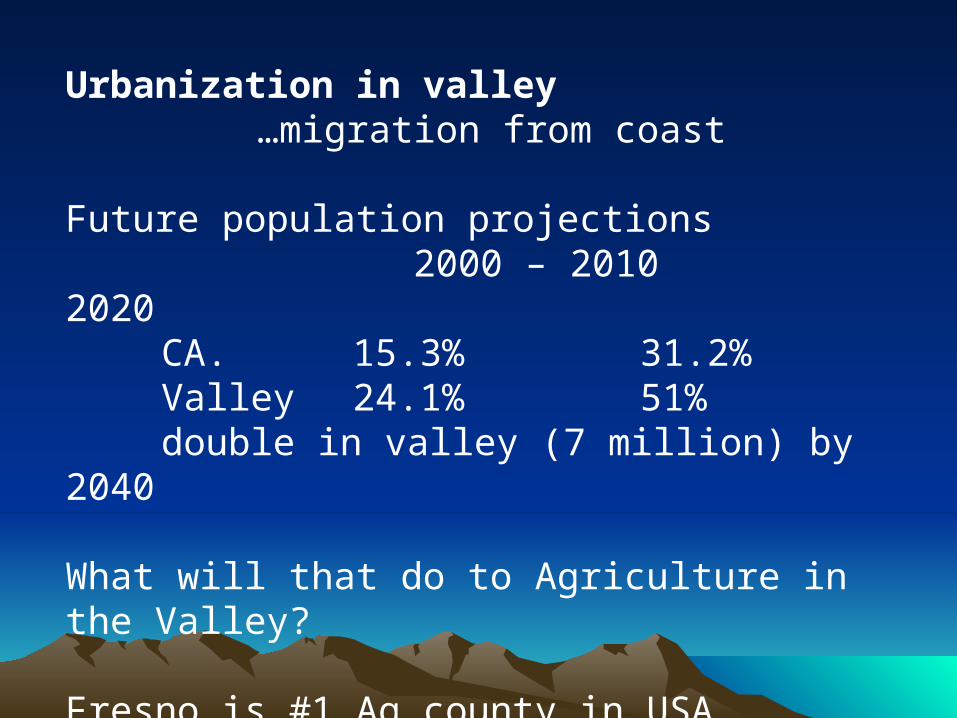
Urbanization in valley…migration from coast
Future population projections 2000 – 2010 2020
CA. 15.3% 31.2%Valley 24.1% 51%double in valley (7 million) by 2040
What will that do to Agriculture in the Valley?
Fresno is #1 Ag county in USA ________ NASS

Other Valley statistics.
California population under 18
CaliforniaCalifornia 27.3%27.3%Merced 34.5%Stanislaus 31.1%San Joaquin 31.0%___?____Calaveras 22.8%____?____
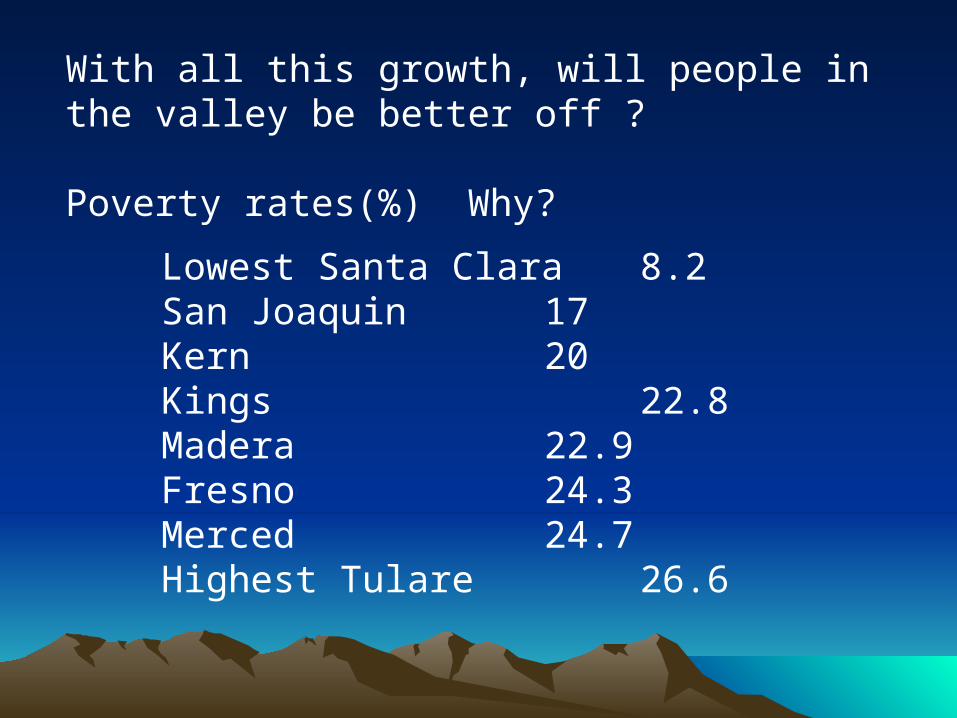
With all this growth, will people in the valley be better off ?
Poverty rates(%) Why?
Lowest Santa Clara 8.2San Joaquin 17Kern 20Kings 22.8Madera 22.9Fresno 24.3Merced 24.7Highest Tulare 26.6

As a function of Education Level?
% HS graduate Bachelors degreeUS 81.6 25.1CA 78 27.5SC 85.1 41.9SJ 77.2 13.8Kern 69.4 13.8Fresno 67.8 19.1Stan. 63 13.5Tulare 62.1 11.9

As a function of Income ?
Valley average
•State has changed, valley has not
•Middle valley – Ag has not changed
•Housing prices go up in the valley
•affordability goes down
•higher % of people married

Unemployment rates
2000 Nov. 20012006State 5.0 5.8 ____
SC 2.0 6.6 ____
SJ 8.8 9.6 ____
Stan. 10.4 10.8 ____
Kern 11.3 10.7 ____
King 14.0 13.8 ____
Fresno 14.3 13.6 ____
Merced 14.4 14.6 ____
Tulare 15.4 15.8 ____ Extra Credit…fill in the blanks…site source..
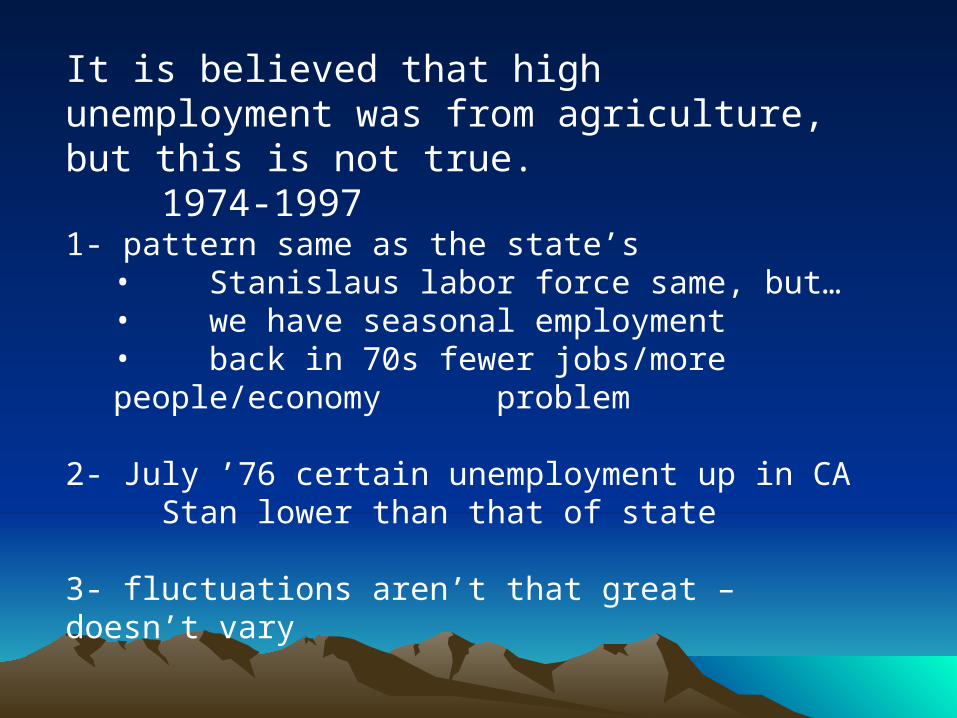
It is believed that high unemployment was from agriculture, but this is not true.
1974-19971- pattern same as the state’s
• Stanislaus labor force same, but…• we have seasonal employment• back in 70s fewer jobs/more people/economy problem
2- July ’76 certain unemployment up in CAStan lower than that of state
3- fluctuations aren’t that great – doesn’t vary
Relationship –
Ag contributes but does not become the main reason for unemployment

Next…Should we be concerned about preserving Agriculture land in the Valley?