Embed Size (px)
Citation preview
PLANT 815~: A NEW ARCHAEOLOGICAL TOOL
Rob G. Commisso MA Simon Fraser University 2002 BA Simon Fraser University 2000
THESIS SUBNlITTED IN PARTIAL FULFILLMENT OF THE REQUIREMENTS FOR THE DEGREE OF
DOCTOR OF PHILOSOPHY
In the Department
of Archaeology
O Rob G. Commisso 2007
SIMON FRASER UNIVERSITY
Fall 2007
All rights reserved. This work may not be reproduced in whole or in part, by photocopy
or other means, without permission of the author.

APPROVAL
Name:
Degree:
Title of Thesis:
Examining Committee:
Rob Commisso
Ph.D.
Plant 615 N: a new archaeological tool
Chair: Ross Jamieson Associate Professor
Erle Nelson, Senior Supervisor Professor, Archaeology
Rolf Mathewes, Supervisor Professor, Biological Science
Jon Driver, Internal Examiner Professor, Archaeology
Charles Schweger, External Examiner Professor, Anthropology, University of Alberta
Date DefendedlApproved: 0-,- % . XY->T

Declaration of Partial Copyright Licence The author, whose copyright is declared on the title page of this work, has granted to Simon Fraser University the right to lend this thesis, project or extended essay to users of the Simon Fraser University Library, and to make partial or single copies only for such users or in response to a request from the library of any other university, or other educational institution, on its own behalf or for one of its users.
The author has further granted permission to Simon Fraser University to keep or make a digital copy for use in its circulating collection (currently available to the public at the "Institutional Repository" link of the SFU Library website <www.lib.sfu.ca> at: <http:Nir.lib.sfu.ca/handlell892/112>) and, without changing the content, to translate the thesislproject or extended essays, if technically possible, to any medium or format for the purpose of preservation of the digital work.
The author has further agreed that permission for multiple copying of this work for scholarly purposes may be granted by either the author or the Dean of Graduate Studies.
It is understood that copying or publication of this work for financial gain shall not be allowed without the author's written permission.
Permission for public performance, or limited permission for private scholarly use, of any multimedia materials forming part of this work, may have been granted by the author. This information may be found on the separately catalogued multimedia material and in the signed Partial Copyright Licence.
While licensing SFU to permit the above uses, the author retains copyright in the thesis, project or extended essays, including the right to change the work for subsequent purposes, including editing and publishing the work in whole or in part, and licensing other parties, as the author may desire.
The original Partial Copyright Licence attesting to these terms, and signed by this author, may be found in the original bound copy of this work, retained in the Simon Fraser University Archive.
Simon Fraser University Library Burnaby, BC, Canada
Revised: Fa11 2007
ABSTRACT
This empirical study was undertaken to test the unlikely postulate that past human
activity has left an imprint on the stable nitrogen isotopic ratio of the plants currently
growing on archaeological sites. In each of three summers, plants were taken from a
variety of defined features at Norse and Thule sites in southwest Greenland. The data
obtained clearly establish the effect of past human activity on the F ' ~ N of modern plants.
Despite the sites being in widely separated regions and of varying ages, the plants from
each had significantly higher 6 1 5 ~ values than those growing on the surrounding natural
terrain. The unusual values were directly correlated to defined activity areas and the
isotopic effect was measured at the metre scale. The magnitudes of the values observed
within each context were consistent with the expected 6 1 5 ~ of the various nitrogen
sources deposited at these locales in the past, indicating the very strong conservation of
the isotopic composition of the anthropogenically introduced nitrogen.
These observations show that plant F ' ~ N can be used as a new, non-invasive tool
to identify and delineate ancient human activity, and to some extent to characterize that
activity based on the magnitude of the signature. Whereas more study is needed to fully
realize both the potential and the limitations of the tool, the data obtained provide a basic
framework for future application. The usefulness of the tool is already demonstrated by
the important information obtained for Norse farming practices in Greenland. Continued
study of the phenomenon will likely provide many applications in archaeology and
perhaps will be of interest to other disciplines. . . . 111

DEDICATION
This work is dedicated to Leeanne for her constant love, support, and
encouragement.
ACKNOWLEDGEMENTS
I would first like to thank my supervisory committee Erle Nelson and Rolf
Mathewes. Erle Nelson consistently provided guidance, mentorship, and the funding for
the project. 1 have always felt very fortunate to work with Erle throughout my graduate
career and have gained a great deal under his guidance. Rolf Mathewes always provided
encouragement, and his insights and comments were greatly appreciated.
Special thanks goes to the National Museum of Greenland and to SILA of the
National Museum of Denmark. This project would not have been possible without the
logistical support provided by both institutions. The advice, insight, and enthusiasm of
the staff of both museums were greatly appreciated. Specific thanks goes to Mikkel
Myrup for safely guiding us in and out of the Western Settlement. Georg Nyegaard also
provided valuable assistance in Greenland.
Cheryl Takahashi made significant contributions with her help in the laboratory
and with numerous administrative tasks. Much appreciated support was also provided by
Robyn Banerjee, Merrill Farmer, Ann Sullivan, C h s Papaianni, and Shannon Wood.
Finally I would like to thank Charles Schweger and Jon Driver for their insightful
comments, as well as those from the anonymous reviewers.
Financial support was from NSERC and SSHRC grants to D.E.N. and an Iso-
Analytical Ltd. Student Award to R.G.C.
TABLE OF CONTENTS
Approval ............................................................................................................................ ii ... Abstract ............................................................................................................................. III
Dedication .................................................................................................................. iv
Acknowledgements ............................................................................................................ v
Table of Contents ............................................................................................................. vi
List of Figures ................................................................................................................... i x
List of Tables .................................................................................................................... xi
Chapter 1 General Introduction ................................................................................. 1 1 . 1 Introduction ......................................................................................................... 1 1.2 Nitrogen cycle in soil and plants ......................................................................... 6 1.3 Reference list ....................................................................................................... 9
Chapter 2 A review of fractionation in the nitrogen cycle ..................................... 11 2.1 Fractionation of nitrogen isotopes in the environment .................................... 1 1
2.1 . 1 Fractionation processes in soil systems ..................................................... 12 2.1.2 Fractionation factors in plant uptake and metabolism ............................... 16 2.1.3 Observed fractionation in natural and laboratory settings ......................... 20 2.1.4 Summary and considerations ..................................................................... 24
2.2 Reference List ................................................................................................... 26
Chapter 3 Modern plant &"N values reflect ancient human activity .................... 28 3.1 Abstract ............................................................................................................. 28 3.2 Introduction ....................................................................................................... 28 3.3 The sites studied and the samples taken ............................................................ 33
3.3.1 The Thule site 'Kujallerpaat ..................................................................... 33 3.3.2 The Norse site 0 8 7 .................................................................................... 34 3.3.3 Plant values for natural soils ..................................................................... 35
3.4 Analytic methods .......................................................................................... 36 3.5 Results and discussion ...................................................................................... 37
3.5.1 The natural samples ................................................................................... 37 3.5.2 Kujallerpaat ............................................................................................... 38 3.5.3 0 8 7 ............................................................................................................. 40
3.6 Conclusion ....................................................................................................... -42 3.7 Figures ............................................................................................................... 44 3.8 Tables ................................................................................................................ 49
................................................................................................... 3.9 Reference List 51
................... Chapter 4 Patterns of plant 6 1 5 ~ values on a Greenland Norse farm 53
............................................................................................................. 4.1 Abstract 53 4.2 Introduction ....................................................................................................... 53
4.2.1 Overview of Norse settlement and farms in Greenland ............................. 55 4.2.2 NorseFarm037 ......................................................................................... 57
............................................................................................................. 4.3 Methods 58 4.3.1 Natural samples .......................................................................................... 59 4.3.2 On-site sample collection ........................................................................... 60 4.3.3 Analytical measurement ............................................................................ 62
4.4 Results ............................................................................................................... 63 4.4.1 Natural samples ........................................................................................ 63 4.4.2 On-site samples .......................................................................................... 64
4.5 Discussion ......................................................................................................... 66 4.6 Conclusions ....................................................................................................... 72 4.7 Figures ............................................................................................................... 75 4.8 Tables ................................................................................................................ 79 4.9 Reference List .................................... ... ............................................................ 80
Chapter 5 Correlation Between Modern plant 6 " ~ values and activity Areas of Medieval Norse Farms ..................................................................................... 82
5.1 Abstract ............................................................................................................. 82 5.2 Introduction ....................................................................................................... 82
...................................................................................................... 5.3 Background 84 5.3.1 Norse Settlement ........................................................................................ 84 5.3.2 Nitrogen isotope ratios in plants ................................................................ 85
5.4 The present study .............................................................................................. 87 5.5 Sampling and measurement methodology ........................................................ 88 5.6 Sample locations and results ............................................................................. 89
5.6.1 Natural grasses ........................................................................................... 90 5.6.2 The farm site 035 ...................................................................................... 90 5.6.3 The farmsite 036 ...................................................................................... 91 5.6.4 The farmsite 0 4 ......................................................................................... 92 5.6.5 The farmsite 0 1 98 ..................................................................................... 96
................................................................................... 5.6.6 The ruin group 00-2 98 ......................................................................................................... 5.7 Discussion 99
5.8 Conclusion ..................................................................................................... 1 0 6 5.9 Figures ............................................................................................................. 108 5.1 0 Tables ............................................................................................................. 115
................................................................................................ 5.1 1 Reference List 116
Chapter 6 Stable nitrogen isotopic examination of Norse sites in the Western Settlement of Greenland ................................................................................ 119
6.1 Abstract ........................................................................................................... 119 6.2 Introduction ..................................................................................................... 119 6.3 Sampling and measurement methodology ...................................................... 122 6.4 Natural vegetation ........................................................................................... 123
............................................. 6.5 Farms studied and results for the samples taken 124
vii
.......................................................................................... 6.5.1 V5 1 -(Sandnes) 125 6.5.2 V59 ........................................................................................................... 126 6.5.3 V52 (Umiviarssuk) ................................................................................ 127 6.5.4 V52a ......................................................................................................... 129
....................................................................................... 6.5.5 V48 (Niaqussat) 131 6.6 Discussion ...................................................................................................... 132
................................................................................... 6.6.1 The isotopic effect -132 6.6.2 The magnitude of the values .................................................................... 134
.......................................................................................... 6.6.3 Species effect 135 ..................................................................................................... 6.7 Conclusions 136
............................................................................................................. 6.8 Figures 138 .................................................................................................. 6.9 Reference list -144
Chapter 7 Summary and Conclusions ................................................................... 146 ......................................................................................................... 7.1 Overview 146
7.2 Methodological framework ............................................................................. 147 .................................................................... 7.2.1 Source of the isotopic effect 148
............................................................................ 7.2.2 Fractionation processes 149 7.2.3 Spatial resolution ..................................................................................... 152 7.2.4 Species effect ........................................................................................... 153
..................................................................................... 7.2.5 The effect of time 154 ................................... .................. 7.2.6 General considerations for the tool .... 156
7.3 Cultural information ........................................................................................ 158 ............................................................................................ 7.3.1 Background 1 58
............................................................... 7.3.2 Previous evidence of fertilizing 160 .................................................... 7.3.3 Evidence of fertilizing from this study 162
............................................ 7.3.4 Isotopic inferences from the farm buildings 166 ................................................... 7.3.5 General implications of the infield data 167
......................................................................... 7.4 Final conclusions of the study 168 ................................................................................................ 7.5 Reference List 1 7 1
LIST OF FIGURES
Figure 3.1
Figure 3.2
Figure 3.3
Figure 3.4
Figure 3.5
Figure 3.6
Figure 3.7
Figure 4.1
Figure 4.2
Figure 4.3
Figure 4.4
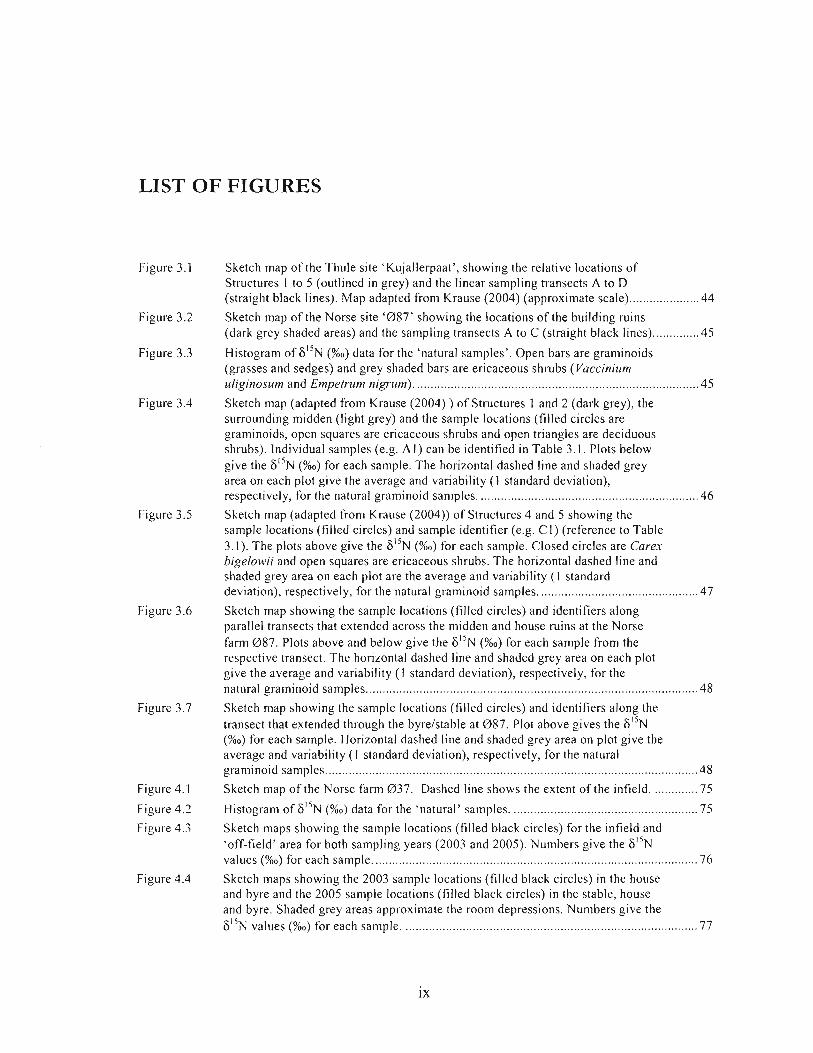
Sketch map of the Thule site 'Kujallerpaat', showing the relative locations of Structures 1 to 5 (outlined in grey) and the linear sampling transects A to D (straight black lines). Map adapted from Krause (2004) (approximate scale) ..................... 44
Sketch map of the Norse site '087' showing the locations of the building ruins (dark grey shaded areas) and the sampling transects A to C (straight black lines) .............. 45
Histogram of 6 1 5 ~ (%o) data for the 'natural samples'. Open bars are graminoids (grasses and sedges) and grey shaded bars are ericaceous shrubs (Vaccinium
................................................................................... uliginostrm and Empetrum nigrum). .45
Sketch map (adapted from Krause (2004) ) of Structures 1 and 2 (dark grey), the surrounding midden (light grey) and the sample locations (filled circles are graminoids, open squares are ericaceous shrubs and open triangles are deciduous shrubs). Individual samples (e.g. A I) can be identified in Table 3.1. Plots below give the 6"N (%o) for each sample. The horizontal dashed line and shaded grey area on each plot give the average and variability ( 1 standard deviation), respectively, for the natural graminoid samples. ................................................................. 46
Sketch map (adapted from Krause (2004)) of Structures 4 and 5 showing the sample locations (filled circles) and sample identifier (e.g. C1) (reference to Table 3.1). The plots above give the F"N (%o) for each sample. Closed circles are Carex bigelowii and open squares are ericaceous shrubs. The horizontal dashed line and shaded grey area on each plot are the average and variability (I standard deviation), respectively, for the natural graminoid samples. ............................................... 47
Sketch map showing the sample locations (filled circles) and identifiers along parallel transects that extended across the midden and house ruins at the Norse farm 0 8 7 . Plots above and below give the 6I5N (%o) for each sample from the respective transect. The horizontal dashed line and shaded grey area on each plot give the average and variability ( 1 standard deviation), respectively, for the natural graminoid samples ................................................................................................... 48
Sketch map showing the sample locations (filled circles) and identifiers along the transect that extended through the byrelstable at 087. Plot above gives the 6 " ~ (%o) for each sample. Horizontal dashed line and shaded grey area on plot give the average and variability ( I standard deviation), respectively, for the natural graminoid samples. .............................................................................................................. 48
Sketch map of the Norse farm 037. Dashed line shows the extent of the infield. ............. 75
....................................................... Histogram of 6 1 5 ~ (%o) data for the 'natural' samples. 75
Sketch maps showing the sample locations (filled black circles) for the infield and 'off-field' area for both sampling years (2003 and 2005). Numbers give the 6 1 5 ~ values (%o) for each sample. ................................................................................................ 76
Sketch maps showing the 2003 sample locations (filled black circles) in the house and byre and the 2005 sample locations (filled black circles) in the stable, house and byre. Shaded grey areas approxinlate the room depressions. Numbers give the 6 " ~ values (%o) for each sample. ....................................................................................... 77
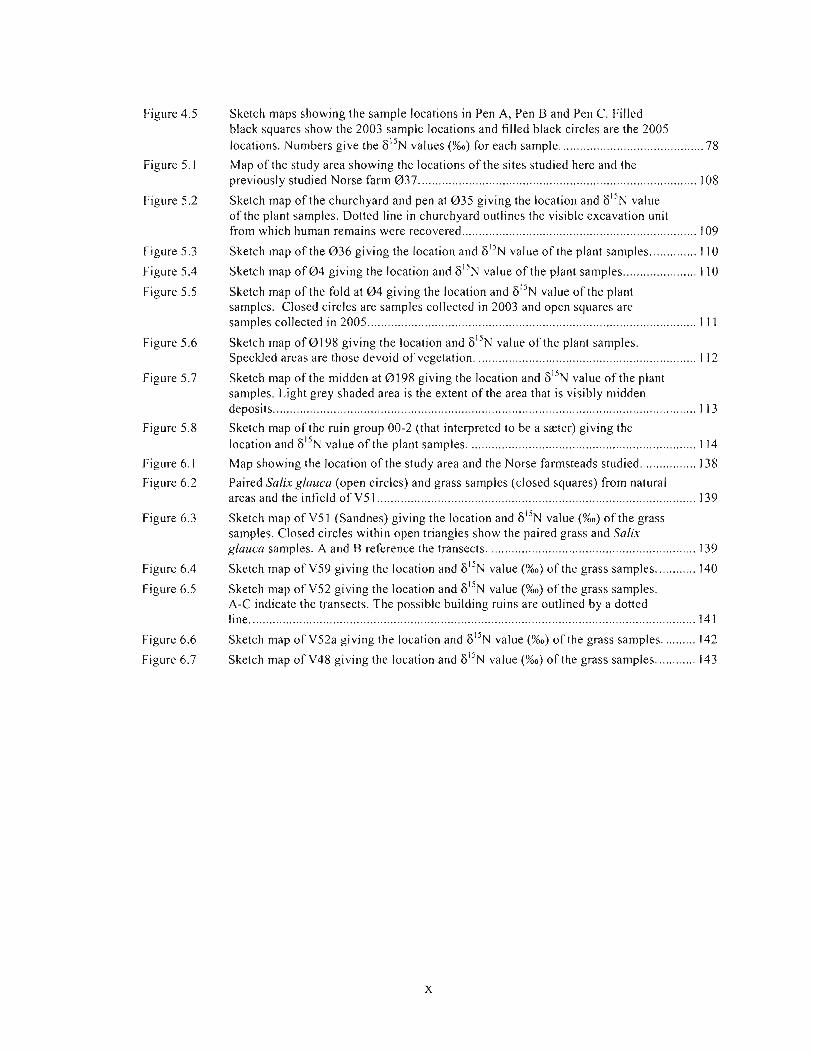
Figure 4.5
Figure 5.1
Figure 5.2
Figure 5.3
Figure 5.4
Figure 5.5
Figure 5.6
Figure 5.7
Figure 5.8
Figure 6.1
Figure 6.2
Figure 6.3
Figure 6.4
Figure 6.5
Figure 6.6
Figure 6.7
Sketch maps showing the sample locations in Pen A, Pen B and Pen C. Filled black squares show the 2003 sample locations and filled black circles are the 2005 locations. Numbers give the 6 " ~ values (%o) for each sample. .......................................... 78
Map of the study area showing the locations of the sites studied here and the previously studied Norse farm 037 ........................................................................... I08
Sketch map of the churchyard and pen at 0 3 5 giving the location and 6 1 5 ~ value of the plant samples. Dotted line in churchyard outlines the visible excavation unit from which human remains were recovered ................................................................. 109
Sketch map of the 036 giving the location and 6I5N value of the plant samples .............. I 10
Sketch map of 0 4 giving the location and 615N value of the plant samples ...................... 1 10
Sketch map of the fold at 0 4 giving the location and 6'jN value of the plant samples. Closed circles are samples collected in 2003 and open squares are samples collected in 2005 ............................................................................................... I 1 1
Sketch map of 8198 giving the location and 6 " ~ value of the plant samples. Speckled areas are those devoid of vegetation. ............................................................... I 12
Sketch map of the midden at 0198 giving the location and 6 ' ' ~ value of the plant samples. Light grey shaded area is the extent ofthe area that is visibly midden deposits ............................. ... ............................................................................ 1 13
Sketch map of the ruin group 00-2 (that interpreted to be a saeter) giving the location and 6 " ~ value of the plant samples. ................................................................. 1 14
Map showing the location of the study area and the Norse farmsteads studied. ............... 138
Paired Salix glauca (open circles) and grass samples (closed squares) from natural areas and the infield of V5 1 .................................................................................... 139
Sketch map of V5l (Sandnes) giving the location and F"N value (%o) of the grass samples. Closed circles within open triangles show the paired grass and Salix glauca samples. A and B reference the transects. .......................................................... 139
Sketch map of V59 giving the location and 6I5N value (%o) ofthe grass samples. ........... 140
Sketch map of V52 giving the location and 6I5N value (%o) of the grass samples. A-C indicate the transects. The possible building ruins are outlined by a dotted line. ................................................................................................................................... 14 1
Sketch map of VS2a giving the location and 6I5N value (%o) of the grass samples. ......... 142
Sketch map of V48 giving the location and 6 ' j ~ value (%o) of the grass samples. ........... 143
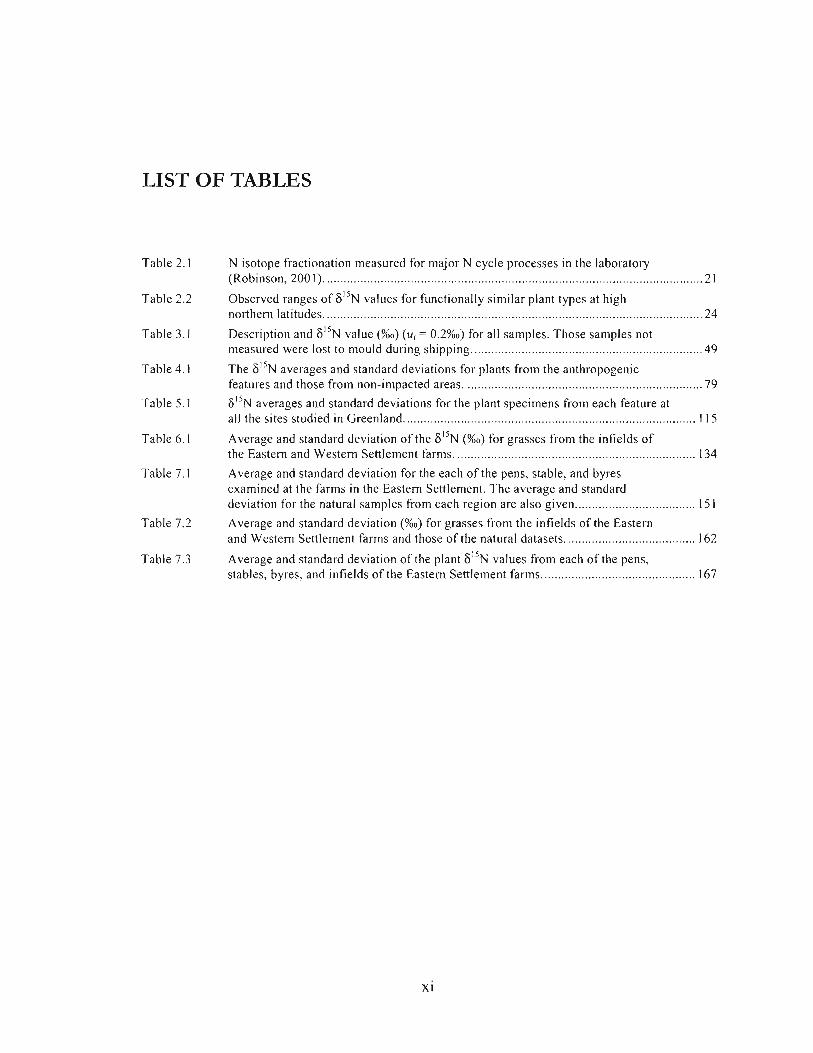
LIST OF TABLES
Table 2.1
Table 2.2
Table 3.1
Table 4.1
Table 5.1
Table 6.1
Table 7.1
Table 7.2
Table 7.3
N isotope fractionation measured for major N cycle processes in the laboratory (Robinson, 200 1). ................................................................................................................ 2 1
Observed ranges of values for functionally similar plant types at high northern latitudes. .............................................................................................................. 24
Description and F1'N value (%o) (u, = 0.2%0) for all samples. Those samples not measured were lost to mould during shipping. .................................................................... 49
The 6 " ~ averages and standard deviations for plants from the anthropogenic features and those from non-impacted areas. ...................................................................... 79
6I5N averages and standard deviations for the plant specimens from each feature at all the sites studied in Greenland. ............................................................................... 1 15
Average and standard deviation of the 6I5N (%o) fbr grasses from the infields of the Eastern and Western Settlement farms. ....................................................................... 134
Average and standard deviation for the each of the pens, stable, and byres examined at the farms in the Eastern Settlement. The average and standard deviation for the natural samples from each region are also given .................................... 151
Average and standard deviation (%o) for grasses from the infields of the Eastern and Western Settlement farms and those of the natural datasets. ...................................... 162
Average and standard deviation of the plant 6 ' ' ~ values from each of the pens, stables, byres, and infields of the Eastern Settlement farms .............................................. 167
CHAPTER 1 GENERAL INTRODUCTION
1.1 Introduction
Past human settlement is often readily evident by the physical remnants left
behind, whether a monumental structure or a single artefact. Yet, early in the
development of archaeological methodology it was recognized that some human
activities can leave much more subtle evidence on the landscape, such as in small
changes to the chemical properties of soils (Arrhenius, 193 1 ). This realization has had
profound influence on archaeological practice and chemical soil analysis is now routinely
used to identify human activity that would otherwise not be evident (for example, Wilson
et al. 2007 and references within). The work presented here was an exploratory study to
determine whether such human-induced chemical alterations of soils might also affect the
chemical make-up of the plants now growing on archaeological sites. Conceivably, if
such an effect could be found, it could provide a situation in which it would be possible
to move beyond traditional methods of soil analysis to one in which simple analytic
measures of plants could be used as a completely non-invasive means of identifying past
human activity.
To explore this possibility, in each of three summers, plants were collected from a
variety of features at several medieval Norse farms and an 1 8Ih century Thule site in
southwest Greenland. The particular chemical constituents examined in the plants were
the two stable nitrogen isotopes ' 4 ~ and I5lV. As described below, it was postulated that
the ratio of these isotopes could provide a characteristic isotopic signature that could be
used to trace certain human activities.
In the atmosphere, the ratio of the ' 4 ~ and I5N isotopes is so homogeneous that it
is used as an International Standard for measurement. Yet, when atmospheric nitrogen
enters the biosphere the isotopic ratio can change as physical, chemical, and biotic
processes may preferentially select one isotope over the other - a process known as
fractionation. The change in the ratio of I 4 ~ / l 5 ~ from that of atmospheric nitrogen is
presented as 6I5N, and as the differences are small it is given as per mil (%o). Fortunately,
and of particular importance here, nitrogen isotopic fractionation is particularly evident in
food chains and follows a predictable pattern. The F ' ~ N values of the plants at the base of
the food chains typically fall within a small range. The average measured values for these
are -7%0 for marine phytoplankton, -1 %O for terrestrial plants, and =I %O for nitrogen
fixing plants (Kelly, 2000). The tissues of consumers that ingest these plants display
values within a narrow range that are typically 3 to 4 %O higher than the plant material
consumed (Games et al., 1998). At each trophic level there is a further stepwise 3 to 4%0
increase above the dietary source (Ambrose, 1986; DeNiro and Epstein, 198 1). High
trophic level animals thus have much higher 6I5N values than the plants at the base of the
food chain. As this process occurs in both marine and terrestrial food chains, the
comparatively higher 6 " ~ values at base of the marine food chain results in substantial
differences between the 6 1 5 ~ values of terrestrial plants and those of high trophic level
marine mammals (i.e. 6I5N values of seals are typically 16 to l8%0) (Schoeninger and
DeNiro, 1984). Given these very large differences, it was postulated that in
archaeological sites where there are large accumulations of discarded animal remains -
particularly those of marine mammals - the plants growing on such deposits would have
access to "N enriched nitrogen. Accordingly, the g 5 N values of these plants should be
very different than the plants which do not have access to the marine derived sources of
nitrogen.
Numerous ecological studies provide ample evidence that the incorporation of
marine derived nitrogen into terrestrial soil systems affects plant 6 1 5 ~ values. At sea-bird
and sea-mammal nesting and breeding grounds, soils and plants consistently have
elevated 6 " ~ values as compared to the plants growing in areas where these animals
have not congregated (for example, Erskine et al., 1998; Hawke et al., 1999; Kameda et
al., 2006; Liu et al., 2004; Wainwright et a]., 1998 ). The elevated values can be directly
attributed to the large amounts of ' 5 ~ enriched excrement deposited within these areas,
and of particular relevance to this study is that the isotopic impact of the marine nitrogen
is still evident at sea-bird rookeries which were abandoned centuries ago (Mizutani el al.,
1991).
Although these ecological studies suggested that there was merit to the study
proposed here, there was uncertainty as to whether the same isotopic impact could be
found at archaeological sites. Unlike nesting or breeding grounds, the circumstances
within an archaeological site are much different. Human activity would result in very
localized deposition of comparatively small amounts of nitrogen, and as this was mixed
and cycled within the relatively large soil nitrogen pools any distinctive isotopic signature
could be readily diluted. A further consideration was that a variety of nitrogenous
substances with very different F ' ~ N values could be deposited within a site, some of
which would be only slightly "N enriched as compared to the soil nitrogen pools. Again,
the isotopic impact of these materials could be too small to effectively alter the soil
nitrogen pools.
These negative considerations were reinforced by a vast literature which largely
indicated that since the time of deposition - which could be measured in centuries - the
isotopic composition of the anthropogenic nitrogen could be considerably altered by
fractionation processes both in the soils and plants as it was cycled through the system
(reviews in Handley & Scrimgeour, 1997; Hogberg, 1997). These processes are discussed
in more detail below, but given the general complexity of the nitrogen cycle in soil and
plants, it seemed unlikely that past human activity would be reflected in plant 8 ' ' ~
values, and accordingly, the proposition was met with scepticism by experts in nitrogen
cycling.
Nevertheless, preliminary tests at large coastal middens of the Pacific Northwest
and a Classic Thule period settlement in the high Arctic (Cornmisso, 2002) showed that a
signature was to be found in some archaeological circumstances and that the concept was
worth pursuing. Even though the nitrogen isotope literature could provide little
information to predict the particular circumstances for which this would be the case, it
did provide a basic framework to begin the study.
Large changes in the isotopic composition of soil nitrogen pools are ultimately
related to either significant additions or losses of nitrogen (Amundsen et al., 2003); as
such, the low nitrogen input, slow nutrient cycling and high nitrogen conservation in cold
environments (Nadelhoffer et al., 1996; Schimel et al., 1996) would potentially provide a
situation in which the marine isotopic signature would be conserved within the soillplant
system. Further, the characteristics of nitrogen cycling in cold environments also result in
4
soil and plant 6 1 5 ~ values which are close to that of atmospheric nitrogen (Amundsen el
al., 2003), thus providing a situation in which sources of marine nitrogen would have
markedly different F ' ~ N values.
Given the environmental considerations, the cold sub-arctic zone of southwest
Greenland provided an ideal setting for the study. The region also had a number of other
characteristics which contributed to its selection as the test area.
There are large numbers of high trophic level faunal remains in both Thule and Greenlandic Norse middens.
The cultural chronology of the region is relatively well established and plants could be taken from sites of different ages.
Many areas have little or no development and many of the features are still clearly evident on the landscape.
There are numerous contexts of very different nature in which to test the idea.
In sum, the area was ideally suited for the study. If an isotopic signature couldn't
be found for plants growing on at least some of the archaeological sites in the region, the
postulate would be shown to be untenable.
Even with the ideal nature of the test area, the uncertainty meant that neither a
detailed hypothesis nor program of research could be planned at the outset. Rather the
intention was simply to make empirical observations of plant 6 1 5 ~ values within the
archaeological sites and then use these observations to guide the research as it progressed.
The results of the study were presented in an incremental series of published
papers, which are separately presented in Chapters 3 to 6. These begin with a first test of
the concept, followed by a more detailed study of a single site to explore the contexts for
which a signature could be found, expansion to a comparative study of several sites, and
finally, a test of whether the effect would be found in a completely new geographic area.
Underlying these studies was the hope that the project could also yield information of
interest to archaeological interpretation. In particular, Norse fields are important features
which have been notably understudied in Greenland. Even though the intent of the study
was to explore the potential of plant i3I5FJ values as an archaeological tool, it was
recognized that the data could possibly make a significant contribution to the
understanding of Norse farming practices in Greenland.
1.2 Nitrogen cycle in soil and plants
An obvious and necessary requirement for past human activity to be reflected in
values of modem plants would be the permanence of the isotopic composition of the
anthropogenically deposited nitrogen in the soillplant system. Yet, during decomposition,
mineralization, and uptake, nitrogen sources can be transformed along a number of paths
by various physical, biological, and chemical processes, and at each point of
transformation or movement there is the possibility of isotopic fractionation. These
transformations and fractionation processes have been well studied in plant and soil
science. In part, it was thought that such studies might lead to an understanding in which
F"N could be used to identify and trace specific nitrogen sources. Yet, this has had
limited success due to the complexity of the nitrogen cycle and the dynamics and
interactions of the various processes within the system (Handley & Scrimgeour, 1997). If
nitrogen pools mix, or 1 4 ~ and 1 5 ~ undergo fractionation, differences in 6% between
sources can be effectively eliminated. As it is not possible to predict when mixing or
fractionation will occur, and it is difficult to measure the processes and resulting FI'N in
6
silu, the widespread application of natural 6 " ~ as a tracer has not been realized
(Robinson, 2001). This is especially true for plant 6I5N values, as these may be the net
result of several fractionation processes both in the soil and plants themselves, and plants.
may assimilate nitrogen from more than one soil nitrogen pool. Accordingly, there is the
general agreement that with few exceptions natural F"N cannot be used as a tracer
(Robinson, 2001). Rather, patterns or variation of F ' ~ N provide more general information
on nitrogen cycling within an ecosystem.
Circumstances in which there are large differences in 6I5N between sources
provide an exception to this statement (Robinson, 2001). As noted, this condition has
been met in certain ecological settings where nitrogen from high trophic level marine
animals has been added to terrestrial soils. In these locales, unusually high hJ5N values
are found for both the soils and plants, which directly reflect the addition of the I5N
enriched marine nitrogen (Wainwright et al., 1998). Even though the potential application
for archaeology was based on the same large differences in 6 1 5 ~ (for example, the
nitrogen derived fi-om the remains of high trophic level marine mammal as compared to
the natural nitrogen pools in terrestrial soil), the very different nature of the
archaeological context promoted questions as to whether some of the limiting factors
identified above would essentially mask or destroy any isotopic signature that could be
attributed to past human activity. For example:
Would mixing the relatively small amounts of anthropogenically deposited
nitrogen into the comparatively large soil nitrogen pools dilute the isotopic
signature to a point where any differences in 6 1 5 ~ would be essentially
eliminated? Or would this only be the case for anthropogenic nitrogen sources
which had S I 5 ~ values that were slightly different than that of the natural
nitrogen pools?
Over time would any characteristic isotopic signature of the anthropogenically
deposited nitrogen be effectively erased through nitrogen loss from the system or
by natural fractionation processes?
The current understanding of the nitrogen cycle in soils and plants did not provide
answers to these questions. Yet, it was recognized that the principles of nitrogen
fractionation in soils and plants could be used as a framework for the study, as these
could be used to identify regions where such e-ffects may be minimized. Additionally,
these insights could be used to identify processes that may be contributing to the variation
(or lack thereof) of measured plant F ' ~ N values in an archaeological context. Finally, if a
signature was found within an archaeological context, the principles could provide a first
estimate of where the proposed methodology may be most applicable for future
application.
The following Chapter provides an overview of nitrogen cycling and the
associated fractionation processes. This information is provided for readers with an
interest in these details, but others may wish to skip this Chapter (or only read the
relevant summary at the end which outlines some considerations for the study) and
proceed directly to the published papers. As noted, the knowledge of nitrogen cycling
largely indicated that an isotopic signature was not to be found, and so the positive results
of the study primarily rest on the empirical data presented in the reproduced papers in
Chapters 3 to 6.
1.3 Reference list
Amundson,R., Austin,A.T., Schuur,E.A.G., Yoo,K., Matzek,V., Kendall,C., Uebersax,A., Brenner,D., Baisden,W.T., 2003. Global patterns of the isotopic composition of soil and plant nitrogen. Global Biogeochem.Cycles. 17.
Arrhenius,O., 193 1. Markanalysen i arkeologins tjanst. Geologiska Foreningens Forhandlingar. 53, H.3.
Commisso,R.G., 2002. Foliar 6'" values as an indicator of anthropogenic sediments. Unpublished Master's Thesis, Simon Fraser University, Burnaby.
DeNiro,M.J., Epstein,S., 1981. Influence of diet on the distribution of nitrogen isotopes in animals. Geochimica et Cosmochimica Acta. 45, 341-35 1.
Erskine,P.D., Bergstrom,D.M., Schmidt,S., Stewart,G.R., Tweedie,C.E., Shaw,J.D., 1998. Subantartic Macquarie Island - a model ecosystem for studying animal- derived nitrogen sources using ' 5 ~ natural abundance. Oecologia. 1 17, 187-193.
Gannes,L.Z., Martinez dl Rio,C., Koch,P., 1998. Natural abundance variations in stable isotopes and their potential uses in animal physiological ecology. Comp.Biochem.Physio1. 1 19A, 725-737.
Handley,L.L., Scrimgeour,C.M., 1997. Terrestrial plant ecology and ' 5 ~ natural abundance: The present limits to interpretation for uncultivated systems with original data from a Scottish'Old Field. Adv.Ecol.Res. 27, 133-21 2.
Hawke,D.J., Holdaway,R.N., Causer,J.E., Ogden,S., 1999. Soil indicators of pre- european seabird breeding in New Zealand at sites identified by predator deposits. Aust.J.Sojl Res. 37, 103-1 13.
Hogberg,P., 1997. "N natural abundance in soil-plant systems. New Phytol. 137, 179- 203.
Kameda,K., Koba,K., Hobara,S., Osono,T., Terai,M., 2006. Pattern of natural N-15 abundance in lakeside forest ecosystem affected by cormorant-derived nitrogen. Hydrobiologia. 567,69-86.
Kelly,J.F., 2000. Stable isotopes of carbon and nitrogen in the study of avian and mammalian trophic ecology. Can.J.Zoo1. 78, 1-27.
Liu,X.D., Sun,L.G., Yin,X.B., Zhu,R.B., 2004. Paleoecological implications of the nitrogen isotope signatures in the sediments amended by Antarctic seal excrements. Progress in Natural Science. 14, 786-792.
Mizutani,H., Kabaya,Y., Moors,P.J., Speir,T.W., Lyon,G.L., 1991. Nitrogen isotope ratios identify deserted seabird colonies. Auk. 108, 960-964.
Nadelhoffer,K., Shaver,G., Fry,B., Giblin,A., Johnson,L., McKane,R., 1996. ' 5 ~ natural abundances and N use by tundra plants. Oecologia. 107, 386-394.
Robinson,D., 2001. F ' ~ N as an integrator of the nitrogen cycle. Trends in Ecology and Evolution. 16, 153-162.
Schimel,J.P., Kielland,K., Chapin III,F.S., 1996. Nutrient availability and uptake by tundra plants in: Reynolds J.F., Tenhunen J.D. (Eds.), Landscape function and disturbance in Arctic tundra, Springer-Verlag, Berlin, pp. 203-221.
Schoeninger,M.J., DeNiro,M.J., 1984. Nitrogen and carbon isotopic composition of bone collagen from marine and terrestrial animals. Geochimica et Cosmochimica. 48, 625-639.
Wainright,S.C., Haney,J.C., Kerr,C., Golovkin,A.N., Flint,M.V., 1998. Utilization of nitrogen derived from seabird guano by terrestrial and marine plants at St. Paul, Pribilof Islands, Bering Sea, Alaska. Mar.Bio1. 13 1,63-71.
Wilson,C., Davidson,D., Cresser,M., 2007. Multi-element soil analysis: an assessment of its potential as an aid to archaeological interpretation. Journal of Archaeological Science. In Press.
CHAPTER 2 A REVIEW OF FRACTIONATION I N T H E NITROGEN CYCLE
2.1 Fractionation of nitrogen isotopes in the environment
Excellent reviews of nitrogen cycling and the associated fractionation processes in
soils and plants are given by Handley and Scrimgeour (1 997) and Hogberg ( I 997).
Although the following addresses these processes individually, it should be kept in mind
that they are inter-connected and the extent of transformation and fractionation is not
only contingent on environmental conditions and soil characteristics, but on the activity
rate of the other processes within the system.
Fractionation is the result of both kinetic and equilibrium effects, in circumstances
in which not all of the nitrogen atoms of the substrate go into the product (Yoneyama et
al., 1998). The preferential selection of one nitrogen isotope over another reflects the
isotopic composition of the nitrogen source and the energy requirements needed for the
reaction. The slightly lower atomic mass of ' 4 ~ as compared to ''N means that less
energy is required to disassociate it from a chemical compound. Consequently, there will
be a tendency for the substrate to be isotopically heavy as compared with the product in
cjrcumstances in which not all of the nitrogen source is transferred from the substrate to
the product.
2.1.1 Fractionation processes in soil systems
2.1.1.1 Nitrogen mineralization
Nitrogen mineralization or ammonification is the transformation or decomposition
of organic nitrogen to NH~'. This process primarily occurs through the de-amination of
proteins and other nitrogenous compounds by decomposer organisms that excrete excess
nitrogen in the form of N H ~ ' (Hopkins et al., 1998). However, in arid regions which lack
a decomposer community, physical fragmentation and photochemical degradation play a
much more important role in the transformation of organic nitrogen to inorganic forms
(Handley and Scrimgeour, 1997).
There is very little information regarding the fractionation effects associated with
the biotic transformations of organic nitrogen compounds in natural systems because of
the problems associated with isolating a specific pool for measurement (Handley and
Scrimgeour, 1997). In mineralization, there is a relatively rapid assimilation of a portion
of the N H ~ ' released by those organisms associated with nitrification and immobilization
processes (as described in the following sections). As such, measures of the N h f pool
give the net fractionation of the various processes rather than specific differences
between the organic substrate and N H ~ + product. Yet, Hogberg (1 997) suggests that in
areas that are thought to exhibit little nitrification, total soil 6I5N does not vary
substantially from the root 6 1 5 ~ . This would suggest that there is little fractionation
during the mineralization process.
2.1.1.2 Immobilization
Immobilization is the opposite reaction of mineralization. In this process
microbial con~munities convert mineral nitrogen (NO3-, NH~') back into organic forms
12
through re-assimilation. This process is dependent on the carbon to nitrogen ratio of the
organic material being decomposed. Low nitrogen levels in the humic material require
the uptake of mineral nitrogen to complete the synthesis of proteins (Brady and Weil,
1996).
Micro-organisms are apparently more successful when competing with vegetation
for mineral nitrogen. It is estimated that approximately one third of the mineralized
nitrogen can be immobilized within a year in a deciduous forest (Haynes, 1986), resulting
in a large portion of the nitrogen budget remaining in stable organic forms. Therefore the
amount of nitrogen available to the plants is highly dependent upon the net mineralized
nitrogen that is not re-assimilated during immobilization.
As with mineralization, there is little known about the fractionation associated
with immobilization in terrestrial systems (Handley and Scrimgeour, 1997). However,
nitrogen demand in a system with low nitrogen levels would indicate that there would be
little preferential isotopic selection by the micro-organisms during assimilation.
2.1.1.3 Nitrification
Nitrification is the oxidation of the biologically released N H ~ ' by two classes of
bacteria (Nitrosomonas and Nitrobacter), which use the energy of oxidation to "fix" C 0 2
(Postgate, 1978). Nitrosomonas are responsible for the initial conversion of N H ~ ' to N02-
, and Nitrobacter completes the subsequent conversion of NO2- to NO3-. The conversion
of N H ~ ' to NO3- has two significant results. From a benefi cia1 perspective, the oxidized
form is more readily available for plant uptake; in contrast, nitrate is also more
susceptible to leaching and denitrification, and thus substantial amounts of nitrogen can
be lost from the system (Hopkins et al., 1 998).
13
Fractionation during the nitrification process can be large and is primarily
associated with the initial conversion of N~d ' to NO2- since the second step is not rate
limiting and should not express fractionation (Hogberg, 1997). Nitrification varies
throughout different soil systems but is typically associated with fertile soils that are not
very acidic @H > 4.0) (Nadelhoffer and Fry, 1994). The extent of fractionation is also
variable and dependent on the microbial activity and the influx supply of ammonium. If
all of the substrate is consumed there can be no fractionation. However, changes in the
supply of ammonium can influence the degree of fractionation. Feigin et al. (1 974),
observed increased fractionation during the addition of ammonium fertilizers, and then
subsequent decreases in fractionation as the substrate was consumed over time.
In sum, the process of nitrification results in a I5N enriched substrate of
ammonium and a potentially mobile ' 5 ~ depleted nitrate pool.
2.1.1.4 Denitrification
Nitrate that is not utilized by plants or leached from the system is available to a
group of bacteria that reduce it to nitrogen gas. The subsequent N 2 0 or N2 products are
released from the soil system into the atmosphere, resulting in both a reduction in the size
and I5N enrichment of the nitrate pool. Although there are some indications that
denitrification is widespread in aerobic environments (Lloyd, 1993 cited in Hogberg,
1997), the process is more commonly associated with anaerobic soil conditions such as
aquatic and wet terrestrial systems. Measurements of denitrification in non-saturated soil
conditions suggest that areas that display temporal periods of denitrification are highly
dependent on hydrological processes, which in turn are mediated by topographic and
pedological factors (Farrell et al., 1996; van Kessel et al., 1993).
14
As with nitrification, fractionation factors associated with denitrification are
highly variable and controlled by several environmental factors (Hogberg, 1997). As
previously mentioned, soil water content plays a significant role in mediating an O2
limiting environment for the bacteria. Other factors that contribute to denitrification
include the concentration of nitrate, the availability of a carbon source (Kohl & Shearer
1999 , and temperature (van Kessel et al., 1993).
2.1.1.5 Ammonia volatilization
Ammonia volatilization is described as the loss of gaseous NH3 to the atmosphere
from the soil surface. Several steps in the process can affect the extent of conversion and
net fractionation. These steps include the equilibrium effects of N&+ -+ NH3 in solution,
diffusion of NH3 to the site of volatilization, volatilization of NH3, and diffusion away
from the site (Hogberg, 1997).
Volatilization is most evident in areas that experience elevated contributions of
N H ~ " in such forms as animal manure, anhydrous ammonia, or urea. The extent of
nitrogen loss through volatilization is strongly dependent on soil conditions. The
equilibrium of N H ~ ' + NH3 is controlled by the concentration of NH~', how well bonded
the N H ~ ' is in the soil, and the availability of OH- ions (Brady and Weil, 1996). Another
factor that is particularly significant for the assessment of fractionation in anthropogenic
sediments is the presence of CaC03, which facilitates the conversion of N H ~ + + NH3 by
increasing the soil pH (i.e. an increase in hydroxyl ion concentration) through dissolution
(Haynes, 1986).
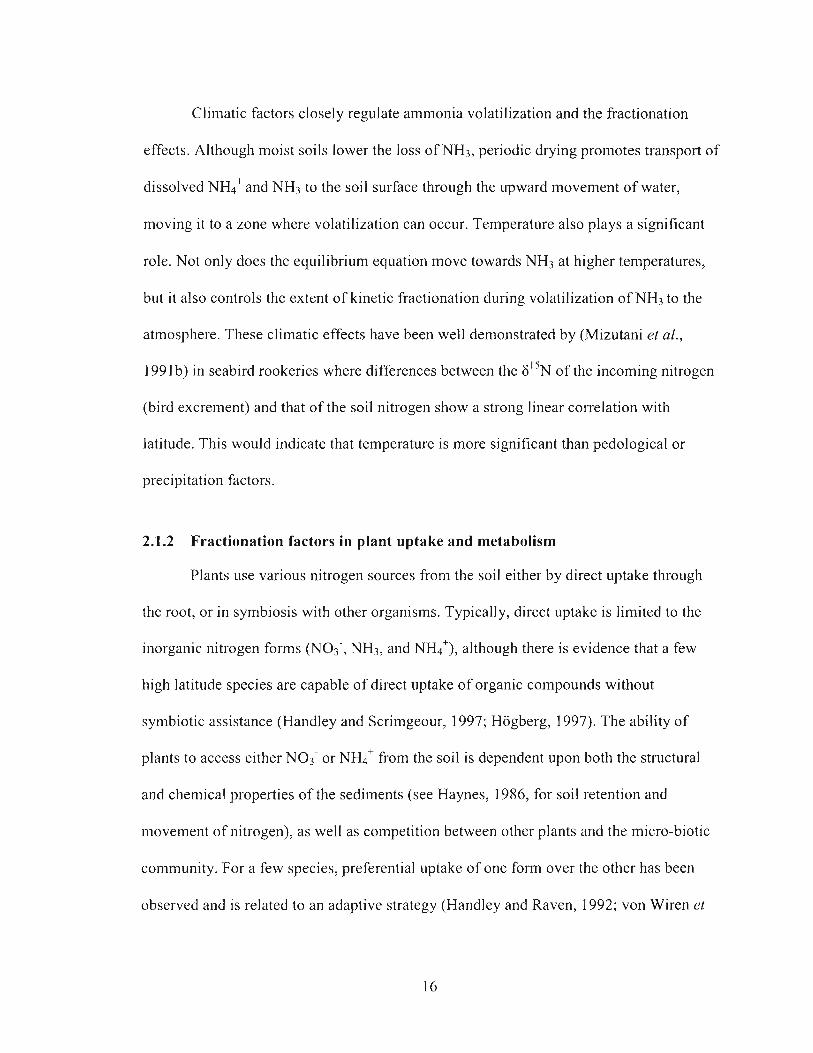
Climatic factors closely regulate ammonia volatilization and the fractionation
effects. Although moist soils lower the loss of NH3, periodic drying promotes transport of
dissolved N H ~ + and NH3 to the soil surface through the upward movement of water,
moving it to a zone where volatilization can occur. Temperature also plays a significant
role. Not only does the equilibrium equation move towards NH3 at higher temperatures,
but it also controls the extent of kinetic fractionation during volatilization of NH3 to the
atmosphere. These climatic effects have been well demonstrated by (Mizutani et al.,
1991 b) in seabird rookeries where differences between the 6 1 5 ~ of the incoming nitrogen
(bird excrement) and that of the soil nitrogen show a strong linear correlation with
latitude. This would indicate that temperature is more significant than pedological or
precipitation factors.
2.1.2 Fractionation factors in plant uptake and metabolism
Plants use various nitrogen sources from the soil either by direct uptake through
the root, or in symbiosis with other organisms. Typically, direct uptake is limited to the
inorganic nitrogen forms (NO3-, NH3, and NH~'), although there is evidence that a few
high latitude species are capable of direct uptake of organic compounds without
symbiotic assistance (Handley and Scrimgeour, 1997; Hogberg, 1997). The ability of
plants to access either NO3- or N H ~ ' from the soil is dependent upon both the structural
and chemical properties of the sediments (see Haynes, 1986, for soil retention and
movement of nitrogen), as well as competition between other plants and the micro-biotic
community. For a few species, preferential uptake of one form over the other has been
observed and is related to an adaptive strategy (Handley and Raven, 1992; von Wiren et
al., 1997). Yet, most plants, including grasses, appear not to specialize in nitrogen
sources (Handley et al., 1998).
Fractionation factors associated with the uptake of nitrogen are connected with
enzyme mediated reactions at the points of assimilation and transamination within the
plant or symbiotic organism. There is no evidence that physical transport or diffusion
across the membranes, including the initial absorption by roots, has any effect on the
6I5N values of the plants relative to the source (Handley et al., 1998).
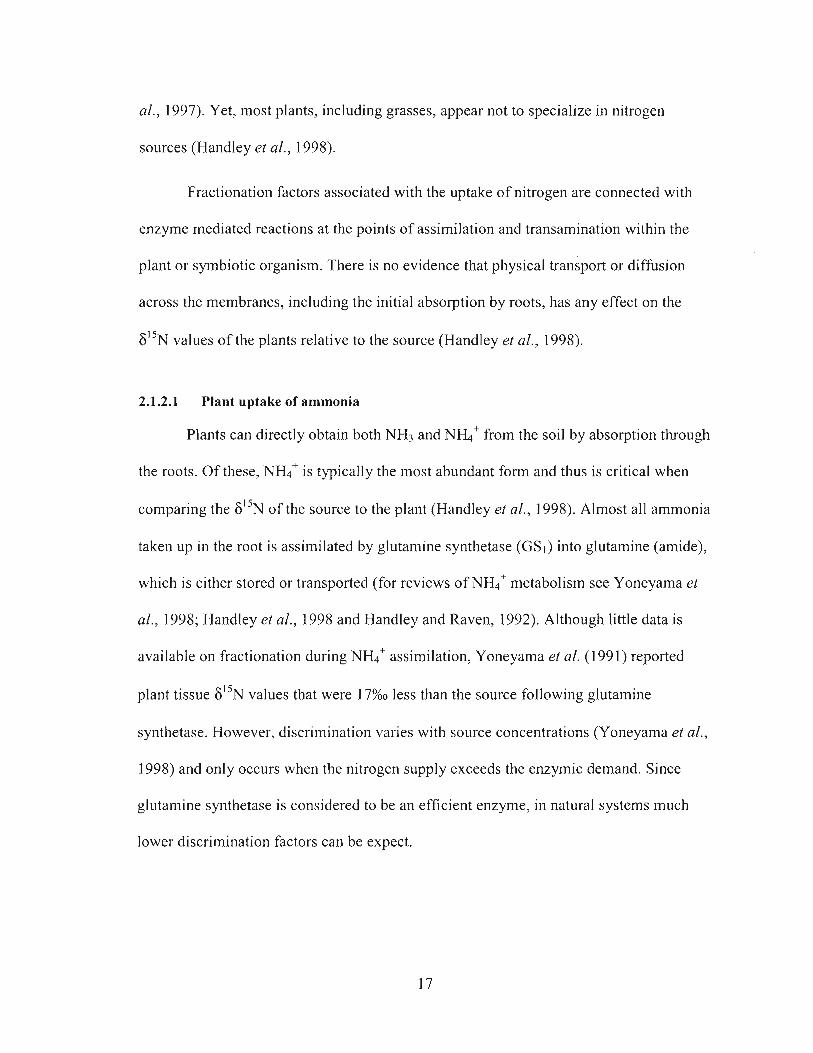
2.1.2.1 Plant uptake of ammonia
Plants can directly obtain both NH3 and N&+ from the soil by absorption through
the roots. Of these, N H ~ ' is typically the most abundant form and thus is critical when
comparing the 6I5N of the source to the plant (Handley et al., 1998). Almost all ammonia
taken up in the root is assimilated by glutamine synthetase (GS,) into glutamine (amide),
which is either stored or transported (for reviews of NH~ ' metabolism see Yoneyama et
al., 1998; Handley et al., 1998 and Handley and Raven, 1992). Although little data is
available on fractionation during N H ~ ' assimilation, Yoneyama et al. ( I 991) reported
plant tissue g 5 N values that were 17%0 less than the source following glutamine
synthetase. However, djscrimination varies with source concentrations (Yoneyama et al.,
1998) and only occurs when the nitrogen supply exceeds the enzymic demand. Since
glutamine synthetase is considered to be an efficient enzyme, in natural systems much
lower discrimination factors can be expect.
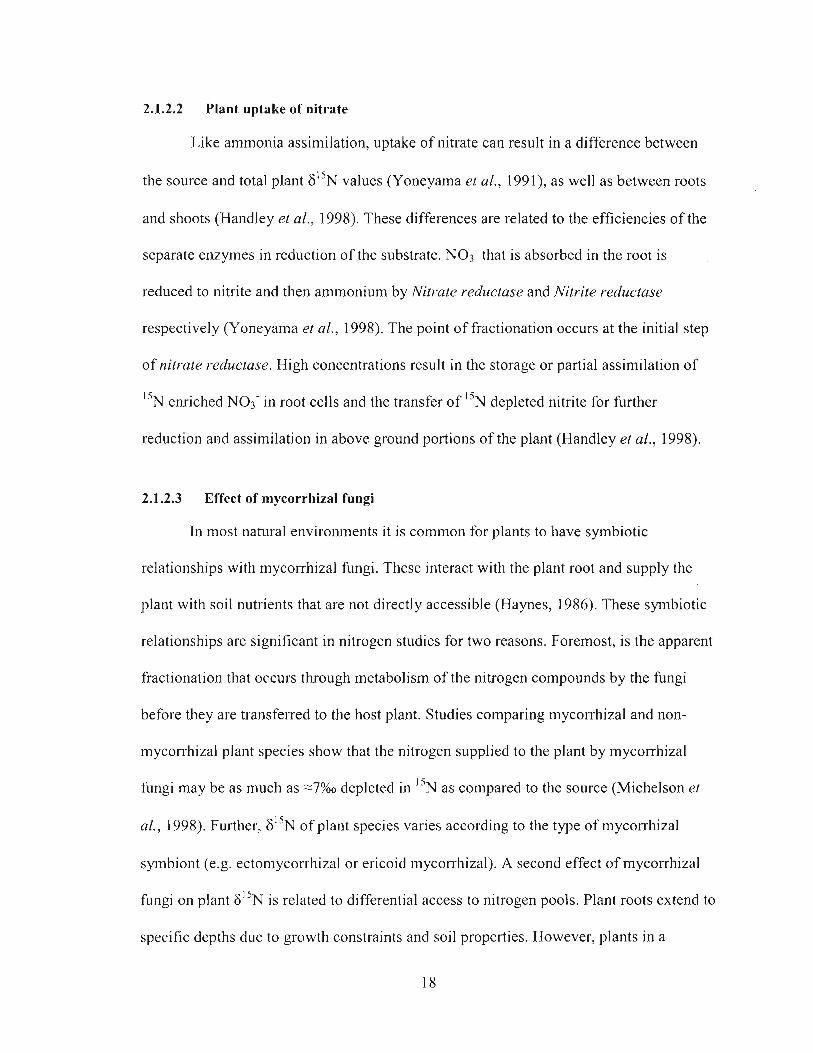
2.1.2.2 Plant uptake of nitrate
Like ammonia assimilation, uptake of nitrate can result in a difference between
the source and total plant F"N values (Yoneyama et al., 1991), as well as between roots
and shoots (Handley et al., 1998). These differences are related to the efficiencies of the
separate enzymes in reduction of the substrate. NO3- that is absorbed in the root is
reduced to nitrite and then ammonium by Nitrate reductase and Nitrite reductase
respectively (Yoneyama et al., 1998). The point of fractionation occurs at the initial step
of nitrate reductase. High concentrations result in the storage or partial assimilation of
15 N enriched NO3- in root cells and the transfer of "N depleted nitrite for further
reduction and assimilation in above ground portions of the plant (Handley et al., 1998).
2.1.2.3 Effect of mycorrhizal fungi
In most natural environments it is common for plants to have symbiotic
relationships with mycorrhizal fungi. These interact with the plant root and supply the
plant with soil nutrients that are not directly accessible (Haynes, 1986). These symbiotic
relationships are significant in nitrogen studies for two reasons. Foremost, is the apparent
fractionation that occurs through metabolism of the nitrogen compounds by the fungi
before they are transferred to the host plant. Studies comparing mycorrhizal and non-
mycorrhizal plant species show that the nitrogen supplied to the plant by mycorrhizal
fungi may be as much as -7% depleted in 1 5 ~ as compared to the source (Michelson el
al., 1998). Further, 6 " ~ of plant species varies according to the type of mycorrhizal
symbiont (e.g. ectomycorrhizal or ericoid mycorrhizal). A second effect of mycorrhizal
fungi on plant F"N is related to differential access to nitrogen pools. Plant roots extend to
specific depths due to growth constraints and soil properties. However, plants in a
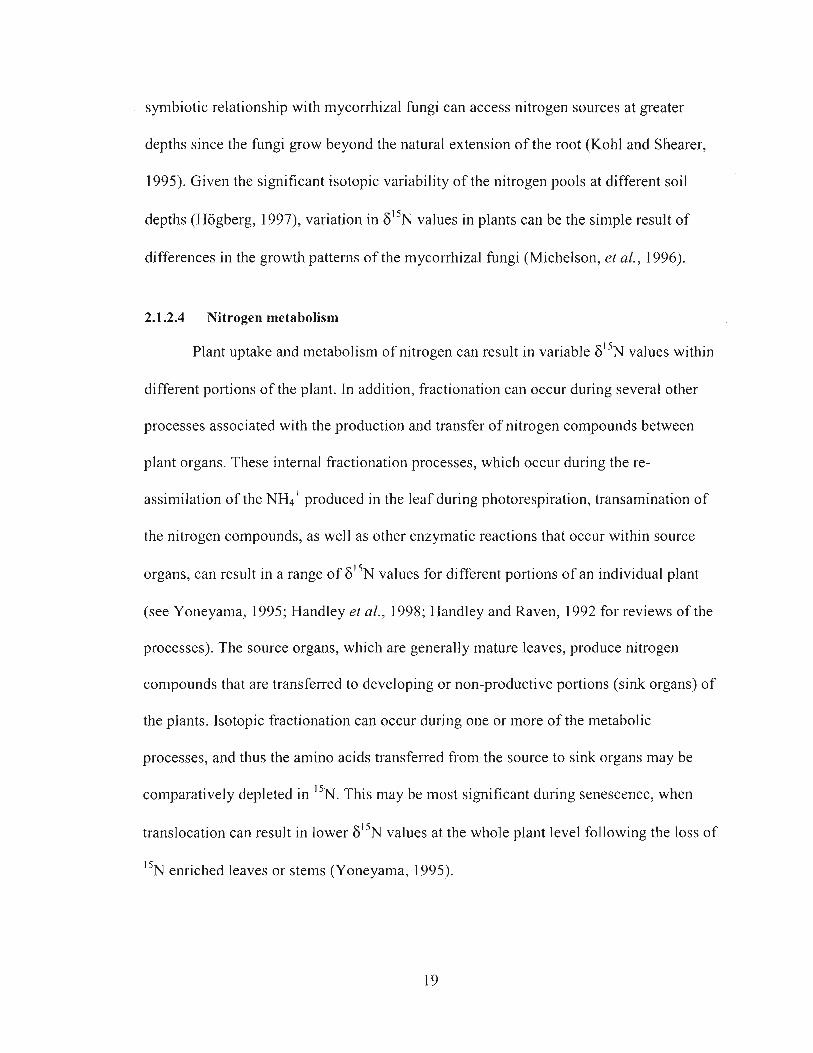
symbiotic relationship with mycorrhizal fimgi can access nitrogen sources at greater
depths since the fungi grow beyond the natural extension of the root (Kohl and Shearer,
1995). Given the significant isotopic variability of the nitrogen pools at different soil
depths (Hogberg, 1997), variation in 8I5N values in plants can be the simple result of
differences in the growth patterns of the mycorrhizal fungi (Michelson, el al., 1996).
2.1.2.4 Nitrogen metabolism
Plant uptake and metabolism of nitrogen can result in variable F ' ~ N values within
different portions of the plant. In addition, fractionation can occur during several other
processes associated with the production and transfer of nitrogen compounds between
plant organs. These internal fractionation processes, which occur during the re-
assimilation of the N H ~ ' produced in the leaf during photorespiration, transamination of
the nitrogen compounds, as well as other enzymatic reactions that occur within source
organs, can result in a range of 8l5N values for different portions of an individual plant
(see Yoneyama, 1995; Handley el al., 1998; Handley and Raven, 1992 for reviews of the
processes). The source organs, which are generally mature leaves, produce nitrogen
compounds that are transferred to developing or non-productive portions (sink organs) of
the plants. Isotopic fractionation can occur during one or more of the metabolic
processes, and thus the amino acids transferred from the source to sink organs may be
comparatively depleted in 1 5 ~ . This may be most significant during senescence, when
translocation can result in lower values at the whole plant level following the loss of
15 N enriched leaves or stems (Yoneyama, 1995).
2.1.2.5 Nitrogen losses from plants
In addition to changes in 6I5N values associated with the abscission of plant
organs during senescence, further variation and depletion of nitrogen occurs through
gaseous NH3 losses from leaves. Whereas this process is not well understood, an
estimated maximum of 10% of the total leaf NH~' may be lost at peak stages during
senescence, which could result in 3%0 enrichment in the remaining plant. This level of
enrichment is however considered to be a maximum, and the amount of enrichment in
most cases is expected to be much lower (Handley and Raven, 1992).
2.1.2.6 Nitrogen fixing plants
The previous sections on nitrogen uptake by plants primarily relate to non-fixing
plants. Still, plants that have a symbiotic relationship with N2-fixing bacteria can have a
significant effect on the total nitrogen pool within an ecosystem, as these are able to
directly assimilate atmospheric nitrogen. Several researchers have attempted to assess the
spatial relationship of leguminous plants with non-fixing plants. Although there is some
variability in the results of these studies (see Handley et al., 1998; van Kessel et al., 1993
for reviews), 6I5N values of non-fixing plants typically move towards atmospheric values
when in proximity to leguminous vegetation. This is due to changes in the isotopic
signature of the organic content of the soil with the addition of N2 -fixing leaf litter.
2.1.3 Observed fractionation in natural and laboratory settings
The descriptions above outline the complexity of nitrogen isotope fractionation in
soils and plants. Local climatic and topographic factors, soil properties, nutrient content,
and biological activity all contribute to the amount of fractionation in a system.
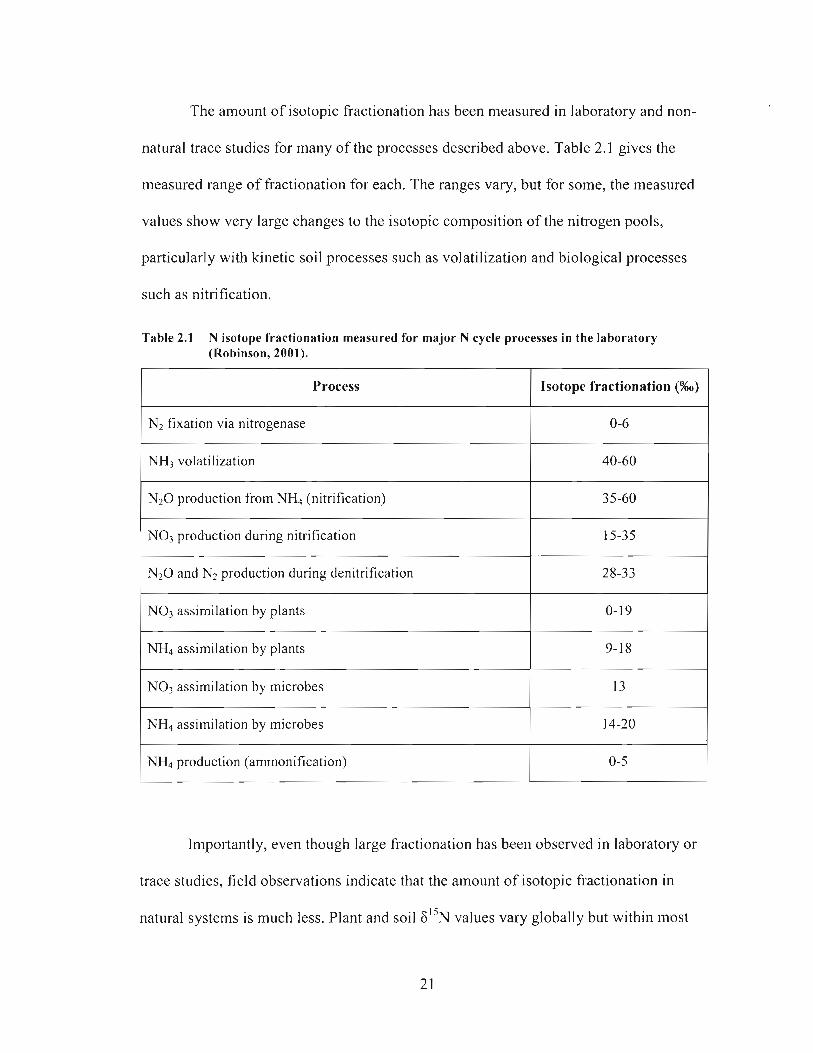
The amount of isotopic fractionation has been measured in laboratory and non-
natural trace studies for many of the processes described above. Table 2.1 gives the
measured range of fi-actionation for each. The ranges vary, but for some, the measured
values show very large changes to the isotopic composition of the nitrogen pools,
particularly with kinetic soil processes such as volatilization and biological processes
such as nitrification.
Table 2.1 N isotope fractionation measured for major N cycle processes in the laboratory (Robinson, 2001).
Process
N 2 0 production from N& (nitrification)
Isotope fractionation (%o)
N2 fixation via nitrogenase
NH3 volatilization
0-6
40-60
NO3 assimilation by plants
NO3 production during nitrification
N 2 0 and N2 production during denitrification
NH4 assimilation by plants
15-35
28-33
NH4 production (amrnonification)
NO3 assimilation by microbes
NH4 assimilation by microbes
Importantly, even though large fractionation has been observed in laboratory or
trace studies, field observations indicate that the amount of isotopic fractionation in
natural systems is much less. Plant and soil F ' ~ N values vary globally but within most
13
14-20
ecosystems plant 6 1 5 ~ values are only a few per mil different than that of atmospheric
nitrogen. (Most plant 6 1 5 ~ values are in the range of -5 to 5%0 (Handley st al., 1999)).
The relatively small deviation from atmospheric- as compared to the isotopic
discrimination found in laboratory studies - provides a clear indication that in most
natural settings fractionation processes cause, at most, small changes to the isotopic
composition of the nitrogen pools.
The discrepancy between the laboratory studies and field observations can be
understood by the unique nature of the experiments. For example, large discrimination
has been observed in the laboratory for both ammonia and nitrate uptake by plants under
high N soil concentrations. Yet, within most natural systems nitrogen concentrations
rarely exceed the nutritional demands of the plants (Hogberg, 1997). As such, all of the
available substrate will go into the product and there will be no isotopic discrimination. It
is only in extreme environmental circumstances, such as in tropical rain forests or in very
arid climates, that the conditions are such that they encourage large isotope
discrimination by particular fractionation processes. For example, plant 6 1 5 ~ values >7%0
are frequently observed in tropical (Martinelli et al., 1999) and desert environments
(Heaton, 1987).
This discussion raises two points for consideration. First, distinguishing
anthropogenically deposited nitrogen from that of the natural nitrogen pools is more
likely in environ.ments where circumstances do not promote large fractionation. Large
isotopic changes in the nitrogen pools are ultimately related to nitrogen loss from the
system. In cold and/or wet environments there are comparatively low values, which
indicate that the nitrogen cycle is relatively closed or has reached a steady state. It is in
these environments that the isotopic signature of the anthropogenic nitrogen will most
likely be conserved. Second, it should be recognized that some anthropogenic soils may
have very different properties than the surrounding natural soils. Conceivably, in
anthropogenic soils, factors such as high nutrient content could increase microbial
activity, or there may be higher rates of nitrification and possibly ammonia volatilization
due to changes in soil pH, organic content, or increased levels of CaC03. How such
characteristics may affect fractionation processes in anthropogenic soils as compared to
those of natural soils is not easily predicted, but it is a point for consideration.
There are no known 8l5N data for soils or plants in southwest Greenland, but
several studies have made 6 1 5 ~ measures of plants at high latitude locales (Hobbie et a!.,
2000; Kielland et al., 1998; Michelson et al., 1998; Nadelhoffer et al., 1996; Schulze el
al., 1994; Welker et al, 2003). These data provide a first broad estimate for the 6 1 5 ~
values of natural vegetation in the study area. They also provide a large reference sample
of 6I5N values for plants growing on naturally formed soils in various northern regions
(studies are almost circumpolar in coverage), which can be used as a general measure
against which to compare the 6 1 5 ~ for plants growing on archaeological sites.
Table 2.2 provides the range of values found for general plant types in these high
latitude studies. As seen, graminoids (grasses and sedges) have values that are within a
few per mil from that of atmospheric nitrogen. Deciduous shrubs (i.e. Salix and Betula
species) have notably lower values than those of graminoids, and the lowest range of
values is observed for ericaceous shrubs (i.e. Vaccinium and Empetrum species). The
evident differences in the F ' ~ N for these plant types are due to factors such as rooting
depth, the type and activity of the mycorrhizal fungi, and nitrogen uptake from different
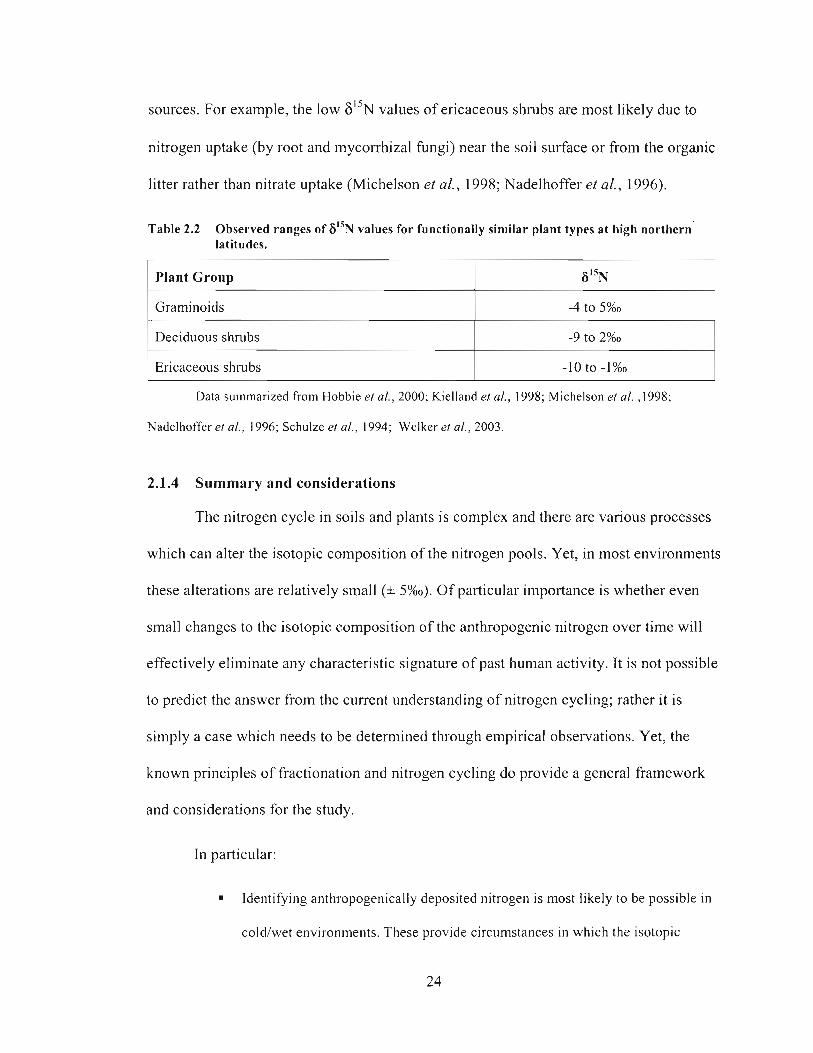
sources. For example, the low values of ericaceous shrubs are most likely due to
nitrogen uptake (by root and mycorrhizal fungi) near the soil surface or from the organic
litter rather than nitrate uptake (Michelson el al., 1998; Nadelhoffer et al., 1996).
Table 2.2 Observed ranges o f 6'" values fbr functionally similar plant types at high northern' latitudes.
I I I
1 Plant Group 1 6 " ~ 1 I Graminoids I -4 to 5%0 1 1 Deciduous shrubs I -9 to 2Y60 I 1 Ericaceous shrubs I -10 to - 1 % ~ I
Data summarized from Hobbie et al., 2000; Kielland et al., 1998; Michelson et a/. , I 998;
Nadelhoffer et a/., 1996; Schulze et al., 1994; Welker et al., 2003.
2.1.4 Summary and considerations
The nitrogen cycle in soils and plants is complex and there are various processes
which can alter the isotopic composition of the nitrogen pools. Yet, in most environments
these alterations are relatively small (+ 5%0). Of particular importance is whether even
small changes to the isotopic composition of the anthropogenic nitrogen over time will
effectively eliminate any characteristic signature of past human activity. It is not possible
to predict the answer from the current understanding of nitrogen cycling; rather it is
simply a case which needs to be determined through empirical observations. Yet, the
known principles of fractionation and nitrogen cycling do provide a general framework
and considerations for the study.
In particular:
Identifying anthropogenically deposited nitrogen is most likely to be possible in
cold/wet environments. These provide circumstances in which the isotopic
composition of the deposited nitrogen is most likely to be conserved. Further, any
signature should be most evident in such environments, as the .low 6'% values of
natural nitrogen pools are much different than that of some materials that may be
incorporated into the soil system at archaeological sites (i.e. nitrogen from
marine animal remains has values >l5%0).
Functionally different plants (different rooting depths or symbiosis with different
mycorrhizal fungi) have differing F"N values. As such, meaningful comparisons
must be made between similar species. There is the additional possibility that the
isotopic effect, if present, may only be evident in a few species.
Fractionation processes in high latitude environments produce relatively small
changes to the isotopic composition of the nitrogen pools. But, it must be
considered that the very different physical and chemical properties of
anthropogenic soils may result in greater fractionation and thus may significantly
alter the isotopic composition of the anthropogenically deposited nitrogen.
The published papers in Chapters 3 to 6 are co-authored by R.G. Commisso and
D.E. Nelson. Commisso was largely responsible for the experimental design, data
collection, sample preparation, the interpretatjon of the results, and the writing. Nelson
provided assistance and input at each of the stages with significant contributions to the
writing and final thoughts contained within the papers.
2.2 Reference List
Brady,N.C., Weil,R.R., 1996. The nature and properties of soils. Prentice Hall, Upper Saddle River, N.J.
Farrell,R.E., Sandercock,P.J., Pennock,D.J., van Kessel,C., 1996. Landscape-scale variations in leached nitrate: Relationship to denitrification and natural nitrogen- 15 abundance. Soil Sci. Soc. Am. J. 60, 141 0-141 5.
Feigin,A., Shearer,G., Kohl,D.H., Commoner,B., 1974. The amount and nitrogen-] 5 content of nitrate in soil profiles from two Illinois fields in corn-soybean rotation. Soil Science Society of America Proceedings. 38,465-471.
Handley,L.L., Austin,A.T., Robison,D., Scrimgeour,C.M., Raven,J.A., Heaton,T.H.E., Schrnidt,S., Stewart,G.R., 1999. The natural abundance of ecosystem samples reflects measures of water availability. Aust. J. Plant Physiol. 26, 185-1 99.
Handley,L.L., Raven,J.A., 1992. The use of natural abundance of nitrogen isotopes in plant physiology and ecology. Plant, Cell and Environment. 15,965-985.
Handley,L.L., Scrimgeour,C.M., 1997. Terrestrial plant ecology and I5N natural abundance: The present limits to interpretation for uncultivated systems with original data from a Scottish Old Field. Adv. Ecol. Res. 27, 133-212.
15 Handley,L.L., Scrimgeour,C.M., Raven,J.A., I 998. N at natural abundance levels in terrestrial vascular plants in: Griffiths H. (Ed.), Stable isotopes: integration of biological, ecological and geochemical processes, BIOS Scientific Publishers Lid, Oxford.
Haynes,R.J., 1986, Origin, Distribution and Cycling of Nitrogen in Terrestrial Ecosystems in: Kozlowski (Ed.), Mineral Nitrogen in the Plant-Soil System, Academic Press Inc, Orlando, Florida.
Heaton,T.H.E., 1987. The ' 5 ~ / ' 4 ~ ratios of plants in South Africa and Nambia: relationship to climate and coastal/saline environments. Chemical Geology. 59, 87-1 02.
Hobbie,E.A., Macko,S.A., Williams,M., 2000. Correlations between foliar 6 1 5 ~ and nitrogen concentrations may indicate plant-mycorrhizal interactions. Oecologia. 273-283.
Hogberg,P., 1997. I5N natural abundance in soil-plant systems. New Phytol. 137, 179- 203.
Hopkins,D.W., Wheatley,R.E., Robinson,D., 1998, Stable isotope studies of soil nitrogen in: Griffiths H. (Ed.), Stable Isotopes: integration of biological, ecological and geochemical processes, Bios Scientific Publishers Limited, Oxford, pp. 75-84.
Kielland,K., Barnett,B., Schell,D., 1998. Intraseasonal variation in the 6I5N signature of taiga trees and shrubs. Canadian Journal of Forest Research. 28, 485-488.
Kohl,D.H., Shearer,G., 1995, Using variation in natural "N abundance to investigate N cycle processes in: Wada, E., Yoneyama, T., Minawaga, M., Ando, T., Fry, B.D. (Ed.), Stable Isotopes in the Biosphere, Kyoto University Press, Japan, pp. 103- 130.
Martinelli,L.A., Picco10,M.C.~ Townsend,A.R., Vitousek,P.M., Cuevas,E., McDowell,W., Robertson,G.P., Santos,O.C., Treseder,K., 1999. Nitrogen stable isotopic composition of leaves and soil: Tropical versus temperate forests. Biogeochemistry. 46, 45-65.
Michelsen,A., Quarmby,C., Sleep,D., Jonasson,S., 1998. Vascular plant ' 5 ~ natural abundance in heath and forest tundra ecosystems is closely correlated with presence and type of mycorrhizal fungi in roots. Oecologia. 1 15,406-4 18.
Michelsen,A., Schrnidt,I.K., Jonasson,S., Quarmby,C., Sleep,D., 1996. Leaf N-15 abundance of subarctic plants provides field evidence that ericoid, ectomycorrhizal and non- and arbuscular mycorrhizal species access different sources of soil nitrogen. Oecologia. 105, 53-63.
Mizutani,H., Kabaya,Y., Wada,E., 1991. Linear correlation between latitude and soil 15N enrichment at seabird rookeries. Naturwissenschaften. 78, 34-36.
Nadelhoffer,K., Shaver,G., Fry,B., Giblin,A., Johnson,L., McKane,R., 1996. ''N natural abundances and 1V use by tundra plants. Oecologia. 107, 386-394.
Nadelhoffer,K.J., Fry,B., 1994, Nitrogen isotope studies in forest ecosystems in: Lajtha K., Marshall J.D. (Eds.), Stable isotopes in ecology and environmental science, Blackwell Scientific Publications, London, pp. 22-44.
Postgate,J., 1978. Nitrogen Fixation. Edward Arnold, Southampton.
Schulze,E.D., Chapin III,F.S., Gebauer,G., 1994. Nitrogen nutrition and isotope differences among life forms at the northern treeline of Alaska. Oecologia. 100, 406-41 2.
van Kessel,C., Pennock,D.J., Farrell,R.E., 1993. Seasonal variations in denitrification and nitrous oxide evolution at the landscape Icale. Soil Sci. Soc. Am. J. 57, 988-995.
von Wiren,N., Gazzarrini ,S., Frommer,W .B., 1 997. Regulation of mineral nitrogen uptake in plants. Plant and Soil. 196, 191 -1 99.
Welker,J.M., Jonsdottir,I.S., Fahnestock,J.T., 2003. Leaf isotopic (delta C-13 and delta N-15) and nitrogen contents of Carex plants along the Eurasian Coastal Arctic: results from the Northeast Passage expedition. Polar Biol. 27, 29-37.
Yoneyama,T., Fujiwara,H., Wilson,J.M., 1998, Variations in fractionation of carbon and nitrogen isotopes in higher plants: N metabolism and partitioning in phloem and xylem in: Griffiths H. (Ed.), Stable Isotopes: integration of biological, ecological and geochemical processes, BIOS Scientific Publishers Ltd, Oxford,.
Yoneyama,T., Omata,T., Nakata,S., J.Yazaki, 199 I. Fractionation of nitrogen isotopes during the uptake and assimilation of ammonia by plants. Plant and Cell Physiology. 32, 121 1-1 21 7.
CHAPTER 3 MODERN PLANT 6 1 5 ~ VALUES REFLECT ANCIENT HUMAN ACTIVITY
3.1 Abstract
We have observed circumstances in which the ancient human activities that
formed archaeological sites have left a strong imprint on the stable nitrogen isotopic ratio
of the plants currently growing there. There is apparent meter-scale spatial variability and
the effect can persist for at least several centuries. To our knowledge, this isotopic effect
has not previously been reported. Here, we introduce this phenomenon and begin to
consider its potential as an analytical tool in archaeological reconstruction.
3.2 Introduction
The stable isotope ratio ( ' 5 ~ / 1 4 ~ ) of atmospheric nitrogen is so homogeneous that
i t is used as an international standard to define the zero point ( 6 ' 5 ~ A ~ R = O%O) of the
nitrogen isotope scale (Hogberg, 1997). As this nitrogen is incorporated into the
biosphere, the isotopic ratio may change as various biological, chemical and physical
processes can preferentially select one isotope over the other. These fractionation
processes have been studied thoroughly and there is detailed knowledge of the extent to
which they can affect the isotopic ratio of nitrogen in both soils and plants. (Readers
unfamiliar with these topics will find the reviews in Handley and Scrimegeour ( 1 997) and
Hogberg (1997), and the references therein useful.) Although individual processes can
' The following chapter has been published in the Journal of Archaeological Science (2006) Vol. 33, pg 1 167-1 176, under the co-authorship of R.G. Commisso and D.E. Nelson.
potentially have a large effect, empirical observations show that in most natural systems
the net fractionation results in only small deviations from the zero point (Handley and
Raven, 1992). For example, the F ' ~ N values of plant tissue are typically between -8 %O to
+2 %o, with values outside that range occasionally observed (Nadelhoffer and Fry, 1996).
There are certain circumstances in which plants and soils consistently have F ' ~ N
values well above the typical range, such as in locales where large amounts of marine
nitrogen are transferred to terrestrial soils though extensive deposition of excrement by
marine animals and birds (Ben David el al., 1998; Erskine et al., 1998; Hawke et al.,
1999; Liu et al., 2004; Mizutani et al., 1991; Mizutani et al., 199 1 b; Wainwright et al.,
1998). The same effect has been noted for plants on the shores of the spawning streams
of anadromous salmon (Ben David et al., 1998b; Bilby et al. 1996; Helfield and Naiman,
2002; Hildebrand et al., 1999). Marine fauna, especially those species at high trophic
levels, are highly ' 5 ~ enriched as compared to terrestrial soils (Schoeninger and Deniro,
1984) and as a consequence, the high 6 ' 5 ~ values of plants growing on soils fertilized by
marine nitrogen reflect the contribution of this isotopically distinct nitrogen (Robinson,
2003).
From these observations, one might expect that a similar effect would be found
for plants growing on archaeological middens containing the remains of marine animals
deposited in antiquity. For example, seal bone collagen has values typically in the
range of 14 to 18 %O (Kelly, 2000). Will this isotopically-distinct nitrogen that has been
added to the soil be reflected in the F"N values of the plants now growing on these
middens? A review of the literature suggested that this postulate was unlikely given the
complexity of the soillplant nitrogen cycle. Over the years, as the relatively small
2 9
amounts of marine nitrogen in middens (e.g. as compared to a bird rookery or salmon-
bearing stream) are mixed into and cycled with the larger, mobile terrestrial soil nitrogen
pool, the distinguishing isotopic characteristics would be lost through dilution and a
number of fractionation processes both at the soil and plant level.
Despite this negative prognosis, we decided to empirically test this 'unlikely
postulate' by finding some appropriate archaeological sites and simply comparing the
F ' ~ ~ v values of plants growing on the site features against those growing on natural soils
in the area. No comprehensive experimental planning could be undertaken as we had no
idea what to expect, but basic considerations of the nitrogen cycle suggested that first
tests should take place on archaeological sites in cold environments such as the Arctic.
Large changes in the isotopic composition of soil nitrogen pools are ultimately related to
either significant additions or losses of nitrogen (Amundsen et al., 2003); as such, the low
nitrogen input, slow nutrient cycling and high nitrogen conservation in cold environments
(Nadelhoffer et al., 1996; Schimel et al., 1996) would potentially provide a situation in
which the marine isotopic signature would be conserved. If the effect cannot be observed
there, it will not be observed anywhere. Further, coastal Arctic archaeological middens
contain abundant remains of marine animals.
Another basic consideration was the known isotopic differences between plant
species. These are interpreted to reflect differences in rooting depth, temporal differences
in N acquisition, uptake of different forms of nitrogen and the types of mycorrhizal
associations (Nadelhoffer et al., 1996). While it would be best to compare samples of the
same species, we could not anticipate finding specimens of any one at all locales. In the
Arctic, we would be likely to encounter plants from three groups of related species,
graminoids (grasses and sedges), ericaceous shrubs, and deciduous shrubs. As the species
within each group share functional traits, they thus tend to have relatively similar F ' 5 ~
values (Michelsen et al., 1998). We decjded to concentrate on the graminoids when
possible, and take specimens of the others when necessary and for first tests of
differences.
The basic question addressed was then "Will the presence of decayed marine
animal remains deposited on an archaeological midden in antiquity affect the values
of the plants now growing on them?" If the answer was positive, then we hoped to
provide first answers to the corollary questions;
How distinct are these isotopic signatures in comparison to those of the plants growing naturally in the same locale?
How localized are any such signatures? Over what distance can differences be detected?
Over what lengths of time do they persist?
Other than middens containing marine nitrogen, are there archaeological features in which similar signatures can be found?
We were fortunate, both for environmental and cultural factors, to be granted
permission to pursue this study on archaeological sites in Greenland. Several centuries
ago, two very different groups of people inhabited the inland fjords and coast of
southwest Greenland. Norse pastoralists established two settlements there in about
I OOOAD, which were then abandoned around 1350 and 1450 AD. Near the time of the
Norse abandonment, people of the Thule Culture migrated south into the same area (An
excellent overview of Greenlandic archaeology is given in Gullsv (2004)). These Thule
people depended very heavily on marine animals for their subsistence, while the Norse
3 1
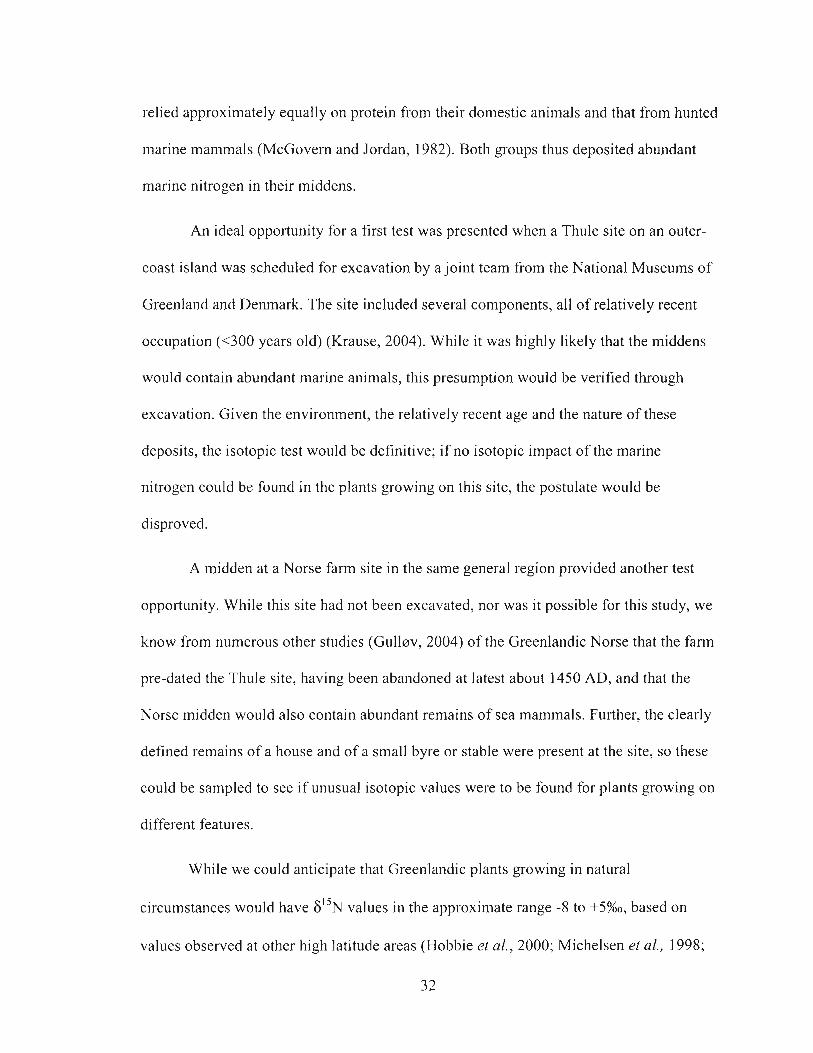
relied approximately equally on protein from their domestic animals and that from hunted
marine mammals (McGovern and Jordan, 1982). Both groups thus deposited abundant
marine nitrogen in their middens.
An ideal opportunity for a first test was presented when a Thule site on an outer-
coast island was scheduled for excavation by a joint team from the National Museums of
Greenland and Denmark. The site included several components, all of relatively recent
occupation (<300 years old) (Krause, 2004). While it was highly likely that the middens
would contain abundant marine animals, this presumption would be verified through
excavation. Given the environment, the relatively recent age and the nature of these
deposits, the isotopic test would be definitive; if no isotopic impact of the marine
nitrogen could be found in the plants growing on this site, the postulate would be
disproved.
A midden at a Norse farm site in the same general region provided another test
opportunity. While this site had not been excavated, nor was it possible for this study, we
know from numerous other studies (Gullarv, 2004) of the Greenlandic Norse that the farm
pre-dated the Thule site, having been abandoned at latest about 1450 AD, and that the
Norse midden would also contain abundant remains of sea mammals. Further, the clearly
defined remains of a house and of a small byre or stable were present at the site, so these
could be sampled to see if unusual isotopic values were to be found for plants growing on
different features.
While we could anticipate that Greenlandic plants growing in natural
circumstances would have F ' ~ N values in the approxin~ate range -8 to +5%o, based on
values observed at other high latitude areas (Hobbie et al., 2000; Michelsen el al., 1998;
3 2
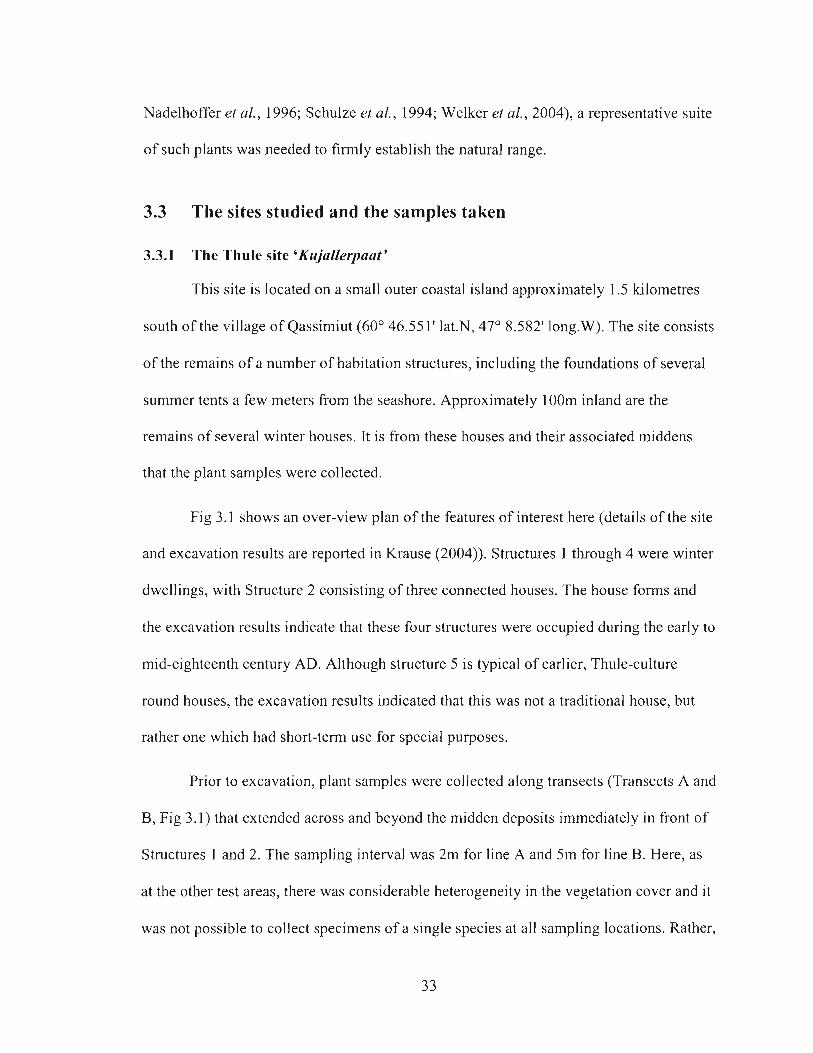
Nadelhoffer et al., 1996; Schulze el al., 1994; Welker et al., 2004), a representative suite
of such plants was needed to firmly establish the natural range.
3.3 The sites studied and the samples taken
3.3.1 The Thule site 'Kujallerpaat'
This site is located on a small outer coastal island approximately 1.5 kilometres
south of the village of Qassimiut (60" 46.551' lat.N, 47" 8.582' 1ong.W). The site consists
of the remains of a number of habitation structures, including the foundations of several
summer tents a few meters from the seashore. Approximately 100m inland are the
remains of several winter houses. It is from these houses and their associated middens
that the plant samples were collected.
Fig 3.1 shows an over-view plan of the features of interest here (details of the site
and excavation results are reported in Krause (2004)). Structures 1 through 4 were winter
dwellings, with Structure 2 consisting of three connected houses. The house forms and
the excavation results indicate that these four structures were occupied during the early to
mid-eighteenth century AD. Although structure 5 is typical of earlier, Thule-culture
round houses, the excavation results indicated that this was not a traditional house, but
rather one which had short-term use for special purposes.
Prior to excavation, plant samples were collected along transects (Transects A and
B, Fig 3.1) that extended across and beyond the midden deposits immediately in front of
Structures I and 2. The sampling interval was 2m for line A and 5m for line B. Here, as
at the other test areas, there was considerable heterogeneity in the vegetation cover and i t
was not possible to collect specimens of a single species at all sampling locations. Rather,
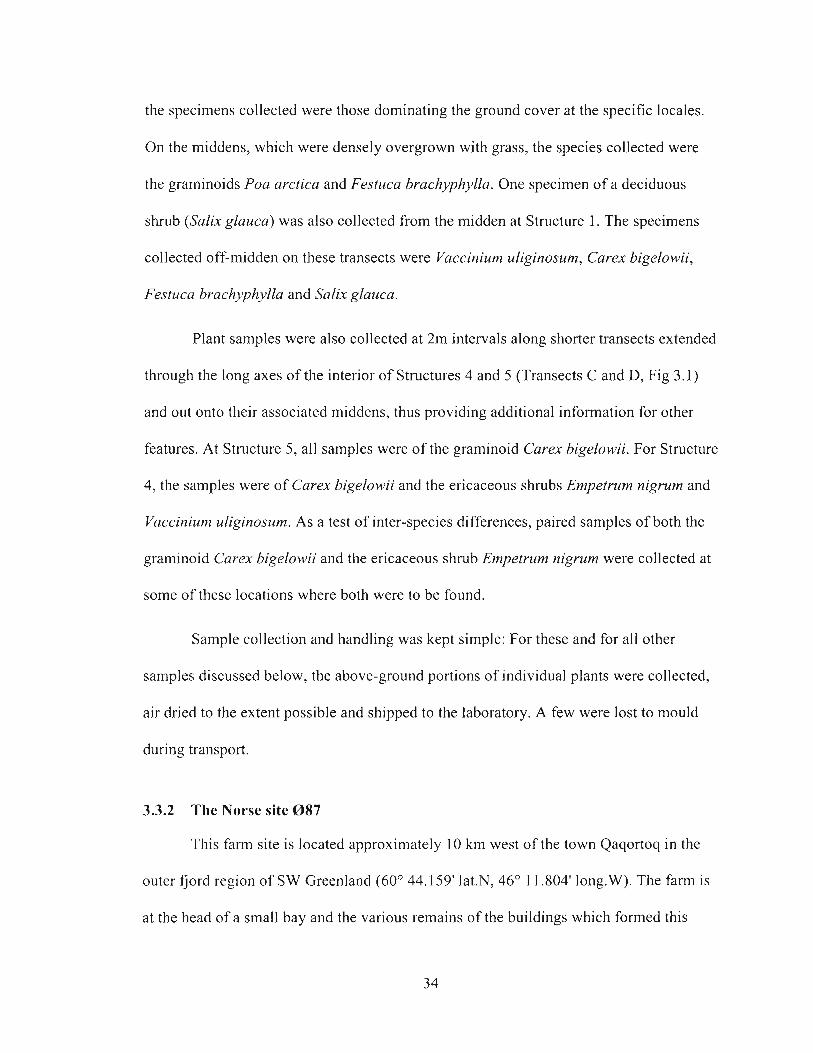
the specimens collected were those dominating the ground cover at the specific locales.
On the middens, which were densely overgrown with grass, the species collected were
the graminoids Poa arctica and Festuca brachyphylla. One specimen of a deciduous
shrub (Salix glauca) was also collected from the midden at Structure 1. The specimens
collected off-midden on these transects were Vacciniunz uliginosum, Carex bigelowii,
Festuca brachyphylla and Salix glauca.
Plant samples were also collected at 2m intervals along shorter transects extended
through the long axes of the interior of Structures 4 and 5 (Transects C and D, Fig 3.1)
and out onto their associated middens, thus providing additional information for other
features. At Structure 5, all samples were of the graminoid Carex bigelowii. For Structure
4 , the samples were of Carex bigelowii and the ericaceous shrubs Empetrum nigrum and
Vaccinium uliginosum. As a test of inter-species differences, paired samples of both the
graminoid Carex bigelowii and the ericaceous s h b Empetrum nigrum were collected at
some of these locations where both were to be found.
Sample collection and handling was kept simple: For these and for all other
samples discussed below, the above-ground portions of individual plants were collected,
air dried to the extent possible and shipped to the laboratory. A few were lost to mould
during transport.
3.3.2 The Norse site 0 8 7
This farm site is located approximately 10 krn west of the town Qaqortoq in the
outer fjord region of SW Greenland (60" 44.1 59' lat.N, 46" I I .804' 1ong.W). The farm is
at the head of a small bay and the various remains of the buildings which formed this
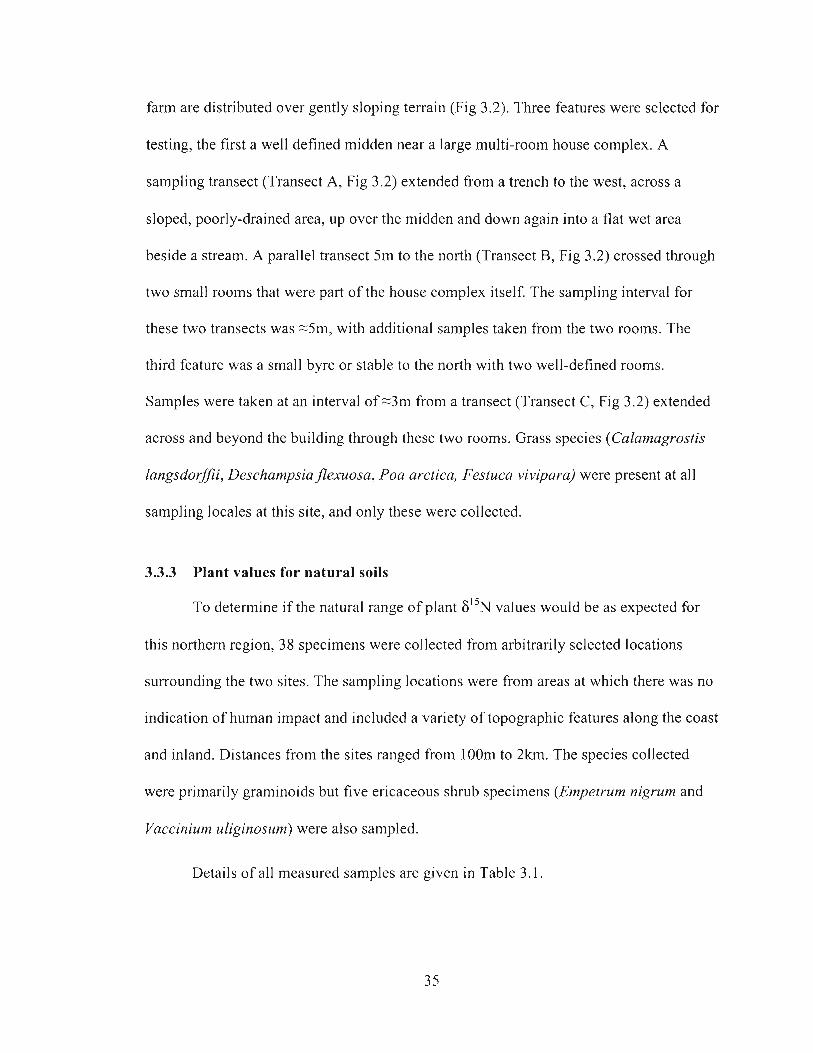
farm are distributed over gently sloping terrain (Fig 3.2). Three features were selected for
testing, the first a well defined midden near a large multi-room house complex. A
sampling transect (Transect A, Fig 3.2) extended from a trench to the west, across a
sloped, poorly-drained area, up over the midden and down again into a flat wet area
beside a stream. A parallel transect 5m to the north (Transect B, Fig 3.2) crossed through
two small rooms that were part of the house complex itself. The sampling interval for
these two transects was "5m, with additional samples taken from the two rooms. The
third feature was a small byre or stable to the north with two well-defined rooms.
Samples were taken at an interval of-3m from a transect (Transect C, Fig 3.2) extended
across and beyond the building through these two rooms. Grass species (Calamagrostis
langsdoi$ji, Deschampsiaflexuosa, Poa arclica, Festuca vivipara) were present at all
sampling locales at this site, and only these were collected.
3.3.3 Plant values for natural soils
To determine if the natural range of plant values would be as expected for
this northern region, 38 specimens were collected from arbitrarily selected locations
surrounding the two sites. The sampling locations were from areas at which there was no
indication of human impact and included a variety of topographic features along the coast
and inland. Distances from the sites ranged from 100m to 2km. The species collected
were primarily graminoids but five ericaceous shrub specimens (Empetrum nigruin and
Vaccinium uliginosum) were also sampled.
Details of all measured samples are given in Table 3.1.
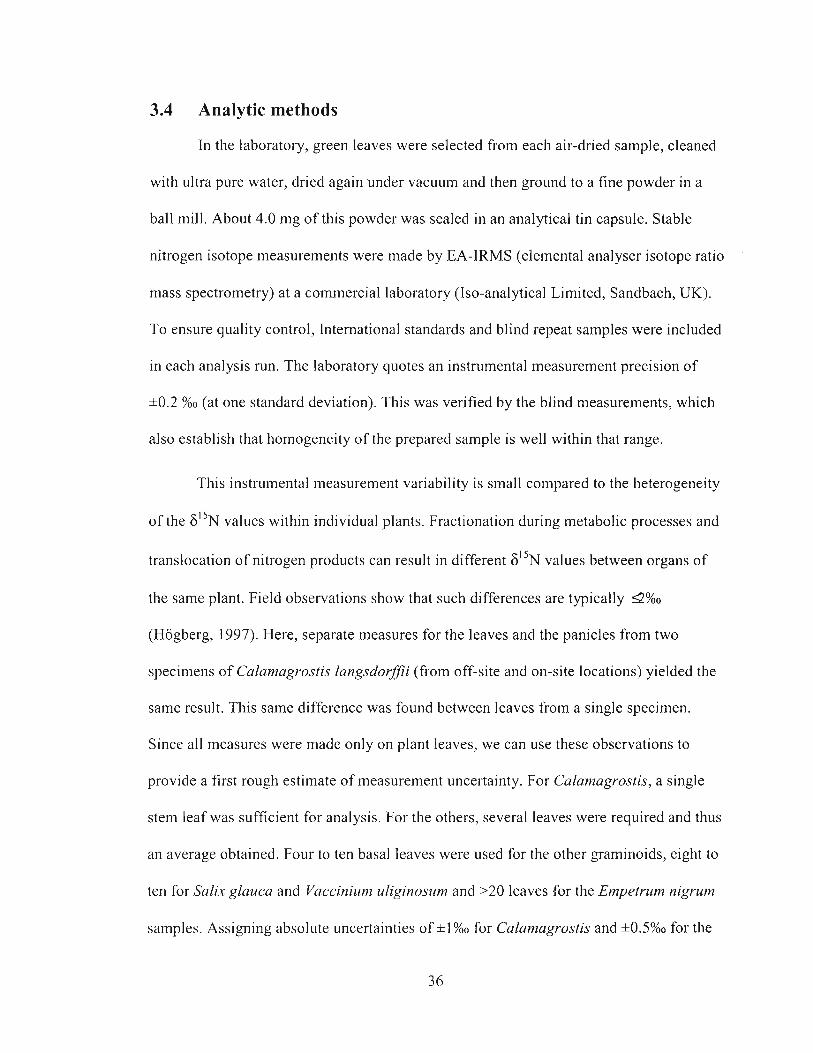
3.4 Analytic methods
In the laboratory, green leaves were selected from each air-dried sample, cleaned
with ultra pure water, dried again under vacuum and then ground to a fine powder in a
ball mill. About 4.0 mg of this powder was sealed in an analytical tin capsule. Stable
nitrogen isotope measurements were made by EA-IRMS (elemental analyser isotope ratio
mass spectrometry) at a commercial laboratory (Iso-analytical Limited, Sandbach, UK).
To ensure quality control, International standards and blind repeat samples were included
in each analysis run. The laboratory quotes an instrumental measurement precision of
*0.2 %O (at one standard deviation). This was verified by the blind measurements, which
also establish that homogeneity of the prepared sample is well within that range.
This instrumental measurement variability is small compared to the heterogeneity
of the 6 1 5 ~ values within individual plants. Fractionation during metabolic processes and
translocation of nitrogen products can result in different 6 1 5 ~ values between organs of
the same plant. Field observations show that such differences are typically 4 % 0
(Hogberg, 1997). Here, separate measures for the leaves and the panicles from two
specimens of Calamagrostis langsdorfii (from off-site and on-site locations) yielded the
same result. This same difference was found between leaves from a single specimen.
Since all measures were made only on plant leaves, we can use these observations to
provide a first rough estimate of measurement uncertainty. For Calanzagrostis, a single
stem leaf was sufficient for analysis. For the others, several leaves were required and thus
an average obtained. Four to ten basal leaves were used for the other graminoids, eight to
ten for Salix glauca and Vaccinium uliginosurn and >20 leaves for the Empetrum nigruin
samples. Assigning absolute uncertainties of *l %O for Calumagrostis and *0.5%0 for the
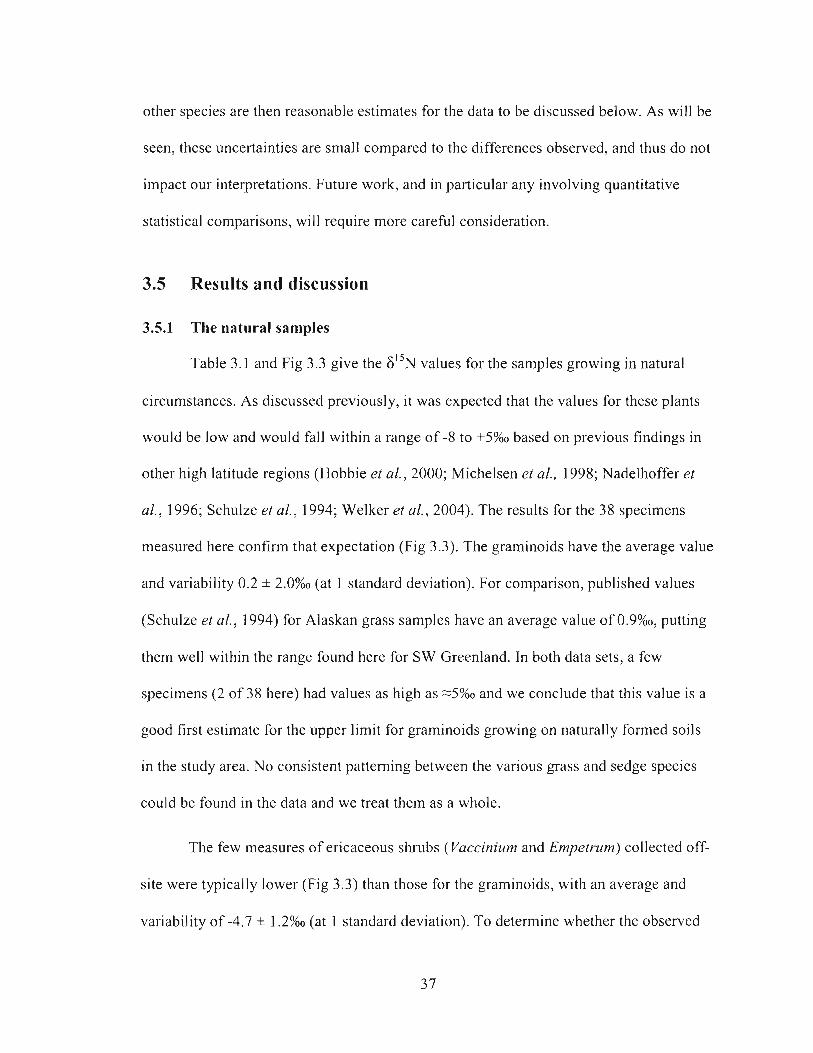
other species are then reasonable estimates for the data to be discussed below. As will be
seen, these uncertainties are small compared to the differences observed, and thus do not
impact our interpretations. Future work, and in particular any involving quantitative
statistical comparisons, will require more careful consideration.
3.5 Results and discussion
3.5.1 The natural samples
Table 3.1 and Fig 3.3 give the F ' ~ N values for the samples growing in natural
circumstances. As discussed previously, it was expected that the values for these plants
would be low and would fall within a range of -8 to +5%0 based on previous findings in
other high latitude regions (Hobbie et al., 2000; Michelsen et al., 1998; Nadelhoffer et
al., 1996; Schulze et al., 1994; Welker et al., 2004). The results for the 38 specimens
measured here confirm that expectation (Fig 3.3). The graminoids have the average value
and variability 0.2 h 2.0%0 (at 1 standard deviation). For comparison, published values
(Schulze et al., 1994) for Alaskan grass samples have an average value of 0.9%0, putting
them well within the range found here for SW Greenland. In both data sets, a few
specimens (2 of 38 here) had values as high as -5%0 and we conclude that this value is a
good first estimate for the upper limit for graminoids growing on naturally formed soils
in the study area. No consistent patterning between the various grass and sedge species
could be found in the data and we treat them as a whole.
The few measures of ericaceous shrubs (Vaccinium and Empetrunz) collected off-
site were typically lower (Fig 3.3) than those for the graminoids, with an average and
variability of -4.7 * 1.2%0 (at 1 standard deviation). To determine whether the observed
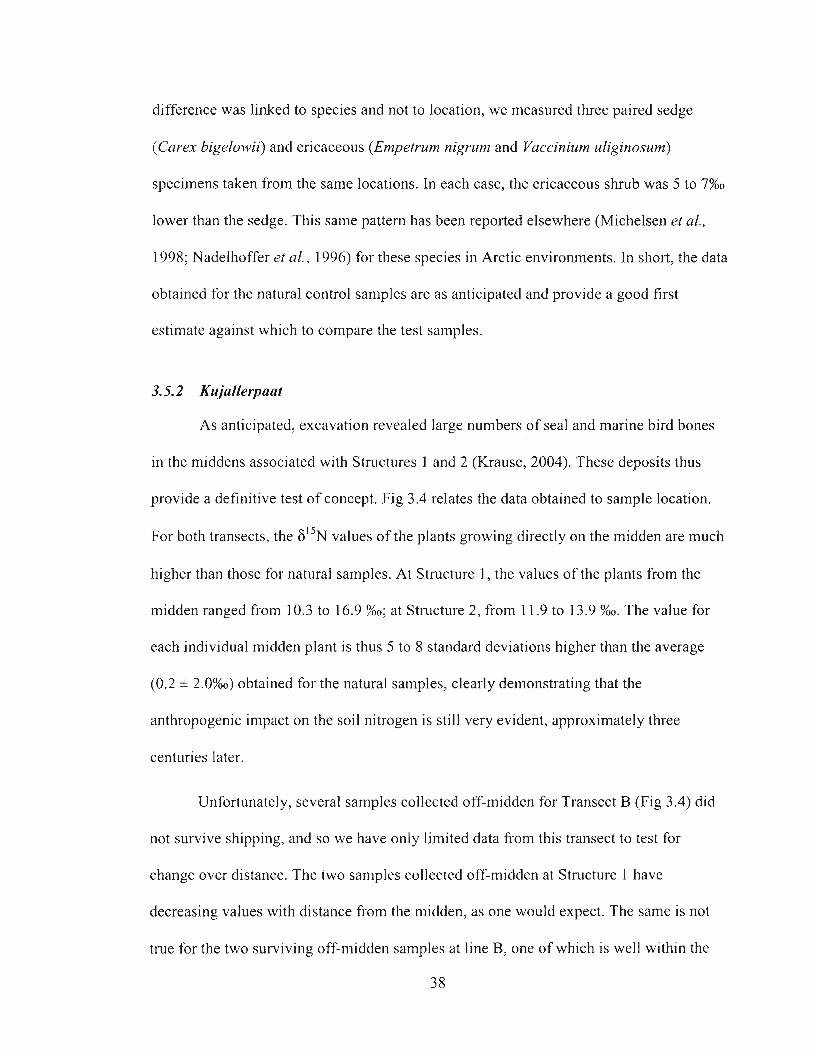
difference was linked to species and not to location, we measured three paired sedge
(Carex bigelowii) and ericaceous (Empetrum nigrum and Vacciniurn uliginosurn)
specimens taken from the same locations. In each case, the ericaceous shrub was 5 to 7%0
lower than the sedge. This same pattern has been reported elsewhere (Michelsen et al.,
1998; Nadelhoffer et al., 1996) for these species in Arctic environments. In short, the data
obtained for the natural control samples are as anticipated and provide a good first
estimate against which to compare the test samples.
3.5.2 Kujallerpaat
As anticipated, excavation revealed large numbers of seal and marine bird bones
in the middens associated with Structures 1 and 2 (Krause, 2004). These deposits thus
provide a definitive test of concept. Fig 3.4 relates the data obtained to sample location.
For both transects, the 6 ' ' ~ values of the plants growing directly on the midden are much
higher than those for natural samples. At Structure I , the values of the plants from the
midden ranged from 10.3 to 16.9 %o; at Structure 2, from 1 1.9 to 13.9 %o. The value for
each individual midden plant is thus 5 to 8 standard deviations higher than the average
(0.2 * 2.0%0) obtained for the natural samples, clearly demonstrating that the
anthropogenic impact on the soil nitrogen is still very evident, approximately t h e e
centuries later.
Unfortunately, several samples collected off-midden for Transect B (Fig 3.4) did
not survive shipping, and so we have only limited data fi-om this transect to test for
change over distance. The two samples collected off-midden at Structure I have
decreasing values with distance from the midden, as one would expect. The same is not
true for the two surviving off-midden samples at line B, one of which is well within the
3 8
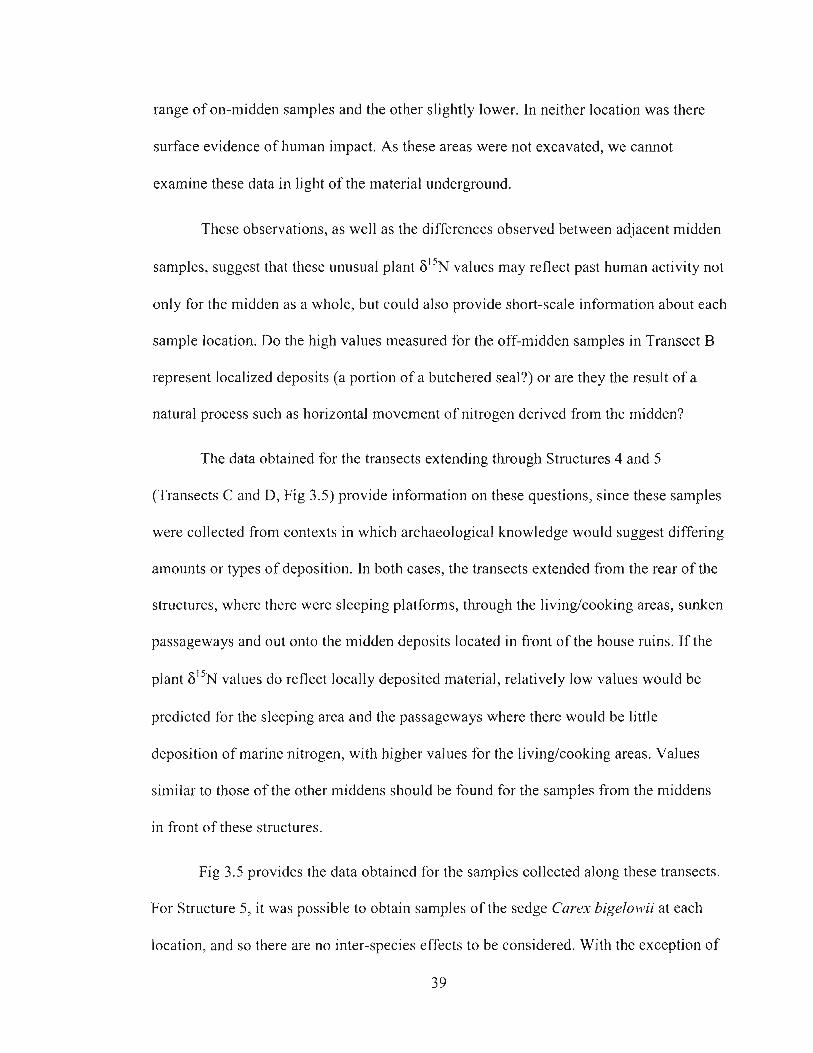
range of on-midden samples and the other sljghtly lower. In neither location was there
surface evidence of human impact. As these areas were not excavated, we cannot
examine these data in light of the material underground.
These observations, as well as the differences observed between adjacent midden
samples, suggest that these unusual plant 6 1 5 ~ values may reflect past human activity not
only for the midden as a whole, but could also provide short-scale information about each
sample location. Do the high values measured for the off-midden samples in Transect B
represent localized deposits (a portion of a butchered seal?) or are they the result of a
natural process such as horizontal movement of nitrogen derived from the midden?
The data obtained for the transects extending through Structures 4 and 5
(Transects C and D, Fig 3.5) provide information on these questions, since these samples
were collected from contexts in which archaeological knowledge would suggest differing
amounts or types of deposition. In both cases, the transects extended from the rear of the
structures, where there were sleeping platforms, through the living/cooking areas, sunken
passageways and out onto the midden deposits located in front of the house ruins. Jf the
plant values do reflect locally deposited material, relatively low values would be
predicted for the sleeping area and the passageways where there would be little
deposition of marine nitrogen, with higher values for the livinglcooking areas. Values
similar to those of the other middens should be found for the samples from the middens
in front of these structures.
Fig 3.5 provides the data obtained for the samples collected along these transects.
For Structure 5, i t was possible to obtain samples of the sedge Carex bigelowii at each
location, and so there are no inter-species effects to be considered. With the exception of
39
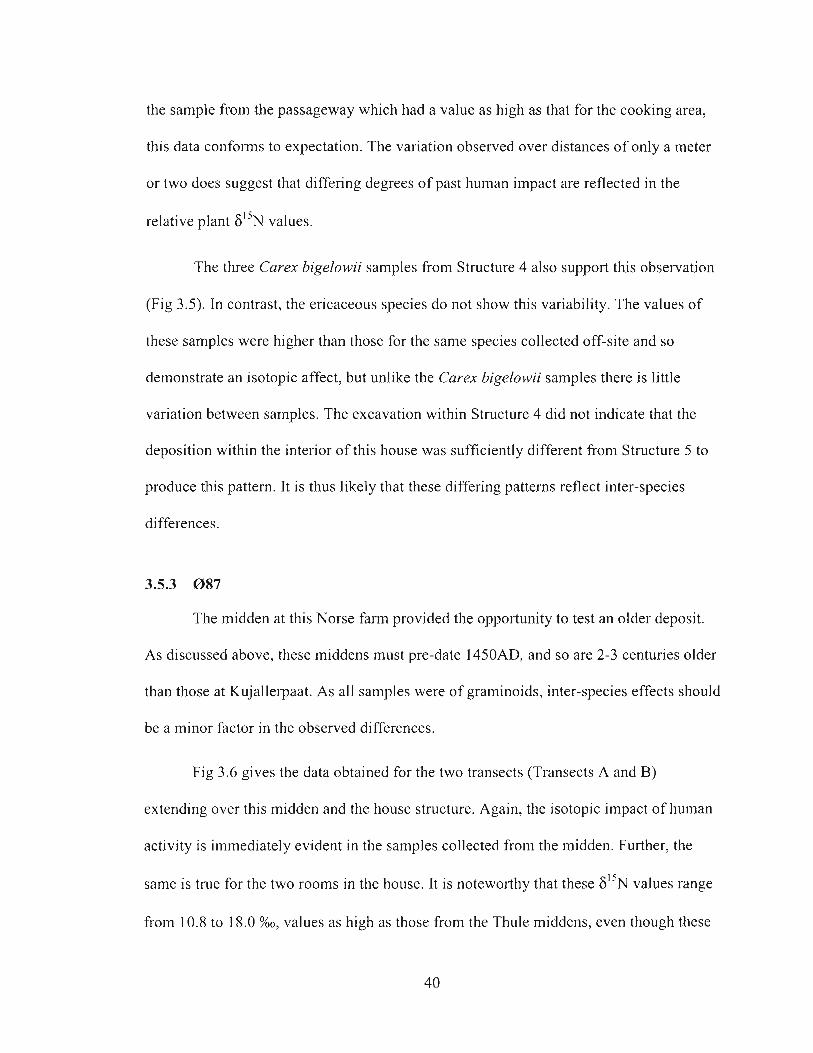
the sample from the passageway which had a value as high as that for the cooking area,
this data conforms to expectation. The variation observed over distances of only a meter
or two does suggest that differing degrees of past human impact are reflected in the
relative plant 6 ' ' ~ values.
The three Carex bigelowii samples from Structure 4 also support this observation
(Fig 3.5). In contrast, the ericaceous species do not show this variability. The values of
these samples were higher than those for the same species collected off-site and so
demonstrate an isotopic affect, but unlike the Carex bigelowii samples there is little
variation between samples. The excavation within Structure 4 did not indicate that the
deposition within the interior of this house was sufficiently different from Structure 5 to
produce this pattern. It is thus likely that these differing patterns reflect inter-species
differences.
3.5.3 0 8 7
The midden at this Norse farm provided the opportunity to test an older deposit.
As discussed above, these middens must pre-date 1450AD, and so are 2-3 centuries older
than those at Kujallerpaat. As all samples were of graminoids, inter-species effects should
be a minor factor in the observed differences.
Fig 3.6 gives the data obtained for the two transects (Transects A and B)
extending over this midden and the house structure. Again, the isotopic impact of human
activity is immediately evident in the samples collected from the midden. Further, the
same is true for the two rooms in the house. It is noteworthy that these 6 ' ' ~ values range
from 10.8 to 18.0 %o, values as high as those from the Thule middens, even though these
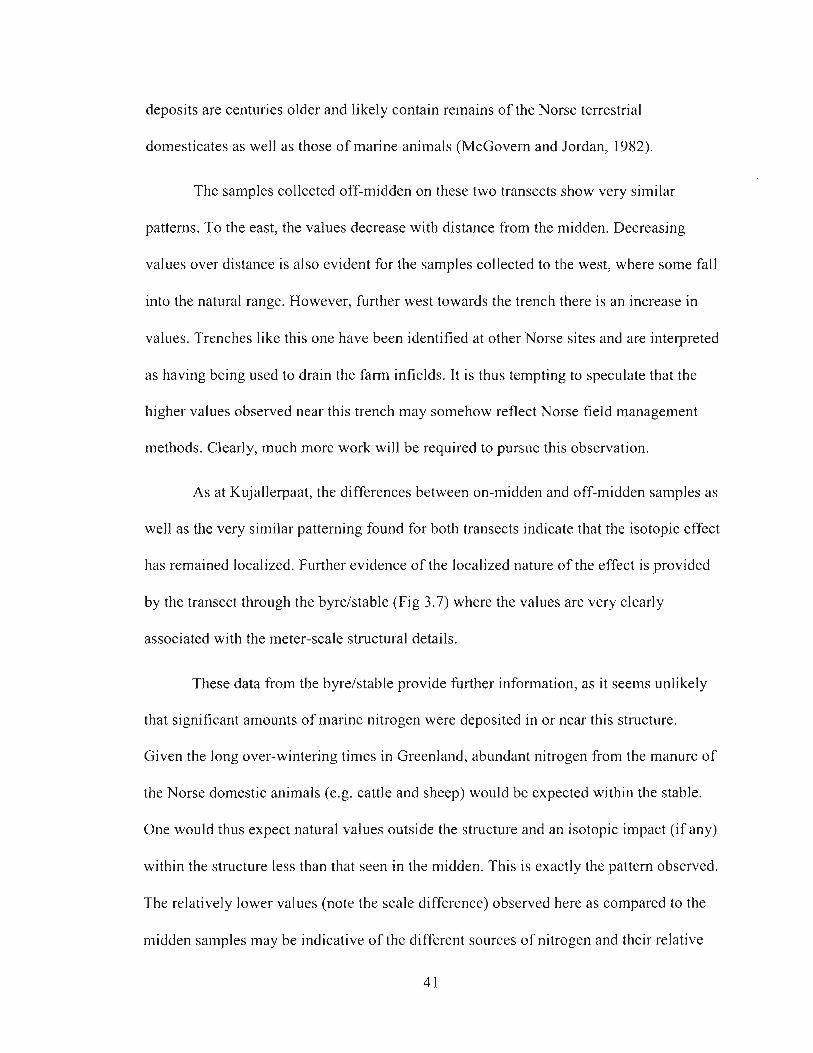
deposits are centuries older and likely contain remains of the Norse terrestrial
domesticates as well as those of marine animals (McGovern and Jordan, 1982).
The samples collected off-midden on these two transects show very similar
patterns. To the east, the values decrease with distance from the midden. Decreasing
values over distance is also evident for the samples collected to the west, where some fall
into the natural range. However, further west towards the trench there is an increase in
values. Trenches like this one have been identified at other Norse sites and are interpreted
as having being used to drain the farm infields. It is thus tempting to speculate that the
higher values observed near this trench may somehow reflect Norse field management
methods. Clearly, much more work will be required to pursue this observation.
As at Kujallerpaat, the differences between on-midden and off-midden san~ples as
well as the very similar patterning found for both transects indicate that the isotopic effect
has remained localized. Further evidence of the localized nature of the effect is provided
by the transect through the byrelstable (Fig 3.7) where the values are very clearly
associated with the meter-scale structural details.
These data from the byre/stable provide further information, as it seems unlikely
that significant amounts of marine nitrogen were deposited in or near this structure.
Given the long over-wintering times in Greenland, abundant nitrogen from the manure of
the Norse domestic animals (e.g. cattle and sheep) would be expected within the stable.
One would thus expect natural values outside the structure and an isotopic impact (if any)
within the structure less than that seen in the midden. This is exactly the pattern observed.
The relatively lower values (note the scale difference) observed here as compared to the
midden samples may be indicative of the different sources of nitrogen and their relative
4 1
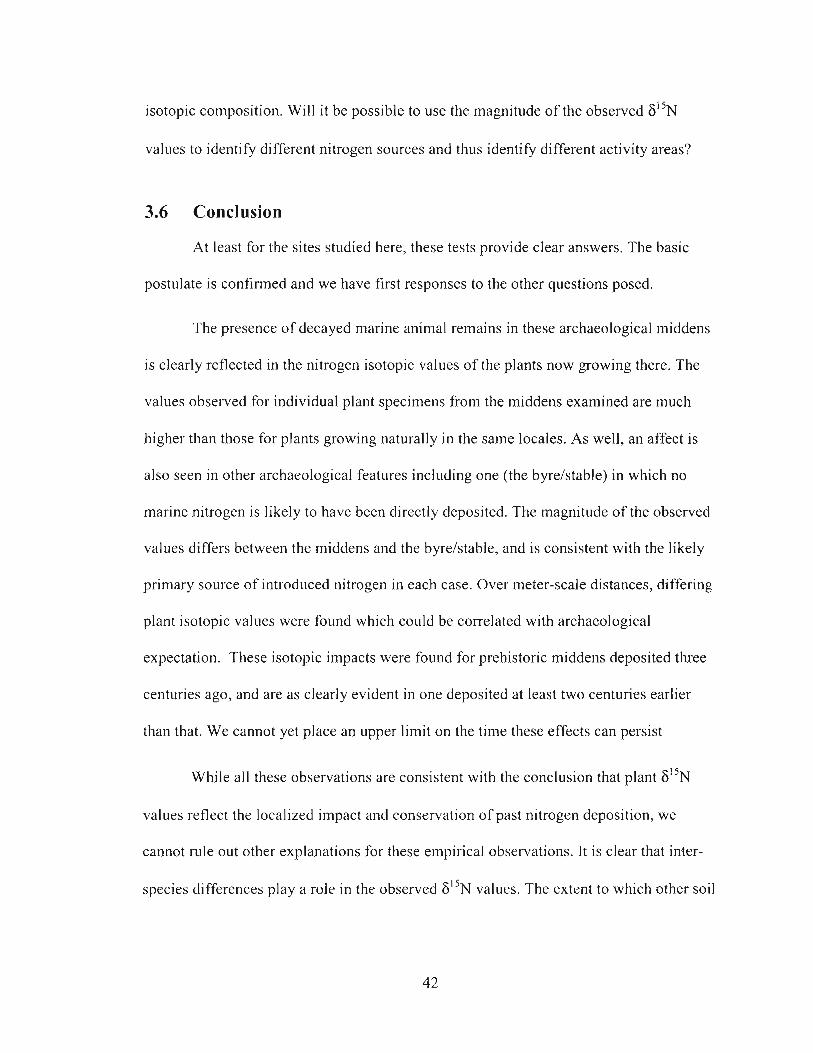
isotopic con~position. Will it be possible to use the magnitude of the observed 6 1 5 ~
values to identify different nitrogen sources and thus identify different activity areas?
3.6 Conclusion
At least for the sites studied here, these tests provide clear answers. The basic
postulate is confirmed and we have first responses to the other questions posed.
The presence of decayed marine animal remains in these archaeological middens
is clearly reflected in the nitrogen isotopic values of the plants now growing there. The
values observed for individual plant specimens from the middens examined are much
higher than those for plants growing naturally in the same locales. As well, an a6fect is
also seen in other archaeological features including one (the byrektable) in which no
marine nitrogen is likely to have been directly deposited. The magnitude of the observed
values differs between the middens and the byrelstable, and is consistent with the likely
primary source of introduced nitrogen in each case. Over meter-scale distances, differing
plant isotopic values were found which could be correlated with archaeological
expectation. These isotopic impacts were found for prehistoric middens deposited three
centuries ago, and are as clearly evident in one deposited at least two centuries earlier
than that. We cannot yet place an upper limit on the time these effects can persist
While all these observations are consistent with the conclusion that plant 6 1 5 ~
values reflect the localized impact and conservation of past nitrogen deposition, we
cannot rule out other explanations for these empirical observations. It is clear that inter-
species differences play a role in the observed &'" values. The extent to which other soil
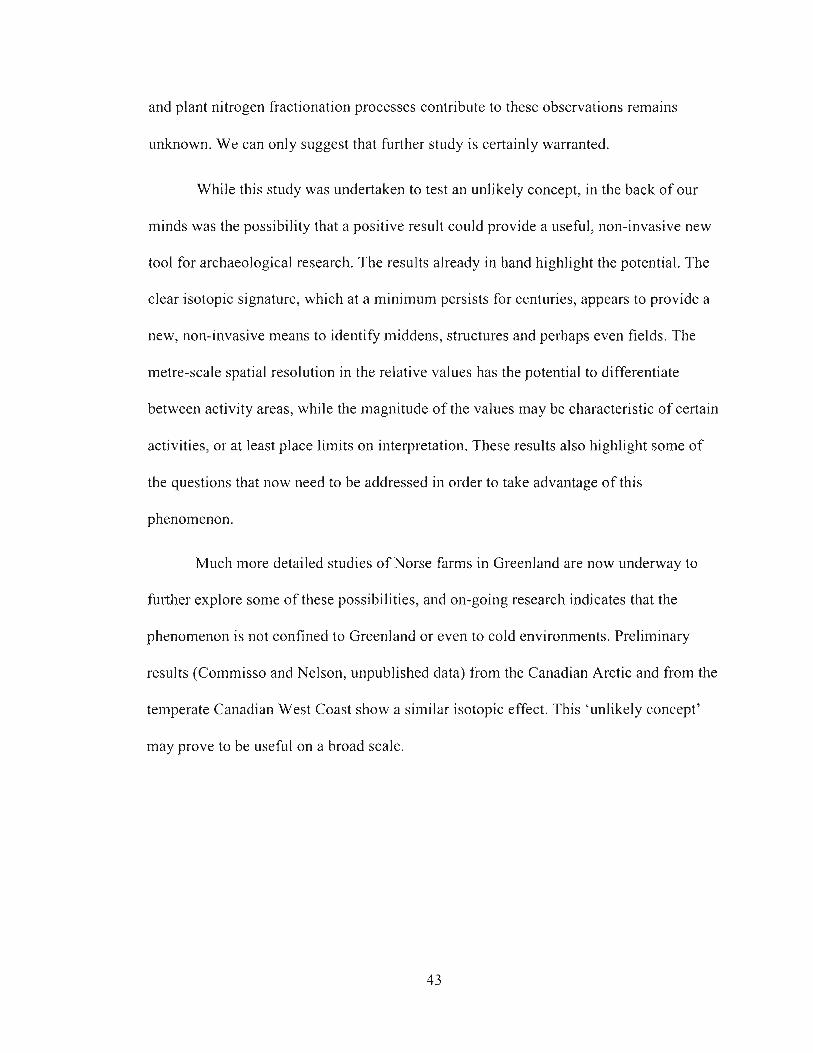
and plant nitrogen fractionation processes contribute to these observations remains
unknown. We can only suggest that further study is certainly warranted.
While this study was undertaken to test an unlikely concept, in the back of our
minds was the possibility that a positive result could provide a useful, non-invasive new
tool for archaeological research. The results already in hand highlight the potential. The
clear isotopic signature, which at a minimum persists for centuries, appears to provide a
new, non-invasive means to identify middens, structures and perhaps even fields. The
metre-scale spatial resolution in the relative values has the potential to differentiate
between activity areas, while the magnitude of the values may be characteristic of certain
activities, or at least place limits on interpretation. These results also highlight some of
the questions that now need to be addressed in order to take advantage of this
phenomenon.
Much more detailed studies of Norse farms in Greenland are now underway to
further explore some of these possibilities, and on-going research indicates that the
phenomenon is not confined to Greenland or even to cold environments. Preliminary
results (Commisso and Nelson, unpublished data) from the Canadian Arctic and from the
temperate Canadian West Coast show a similar isotopic effect. This 'unlikely concept'
may prove to be useful on a broad scale.
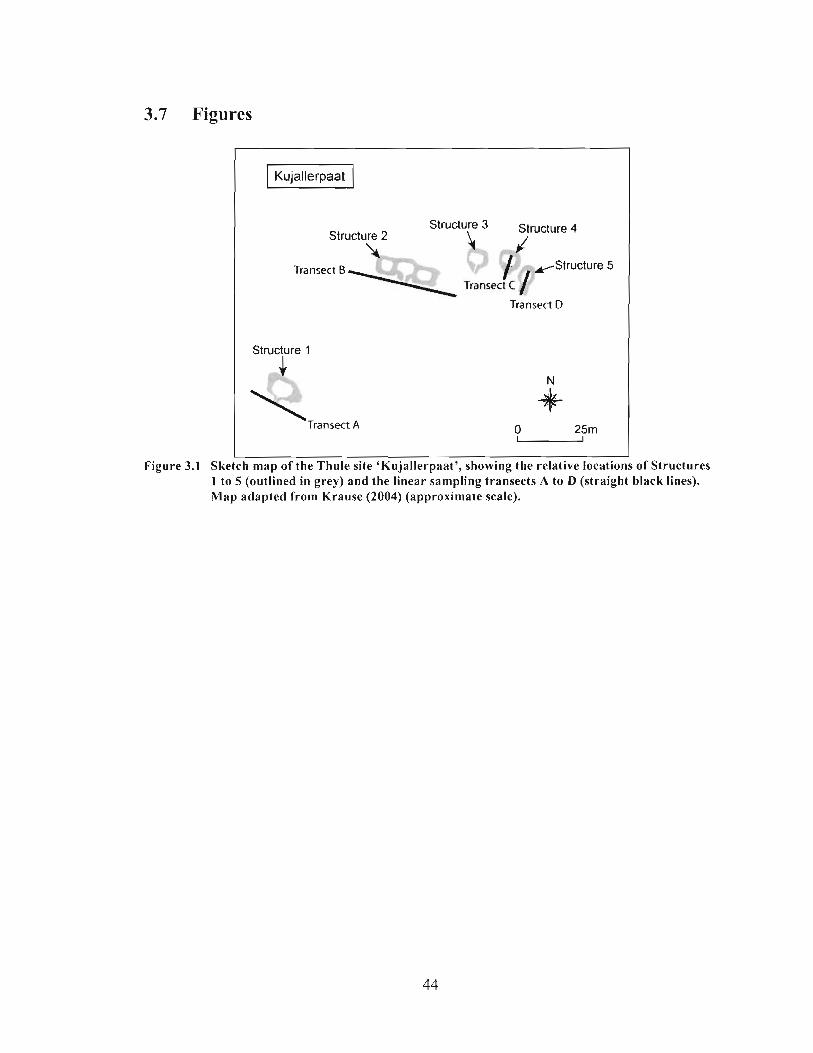
3.7 Figures
Structure 2 Strudu{ 7rudure 4
L. / - ,+trmture 5 '1 Transect C / Transect D
I I Figure 3.1 Sketch map of the Thule site 'Kujallerpaat', showing the relative locations of Structures
1 to 5 (outlined in grey) and the linear sampling transects A to D (straight black lines). Map adapted from Krause (2004) (approximate scale).
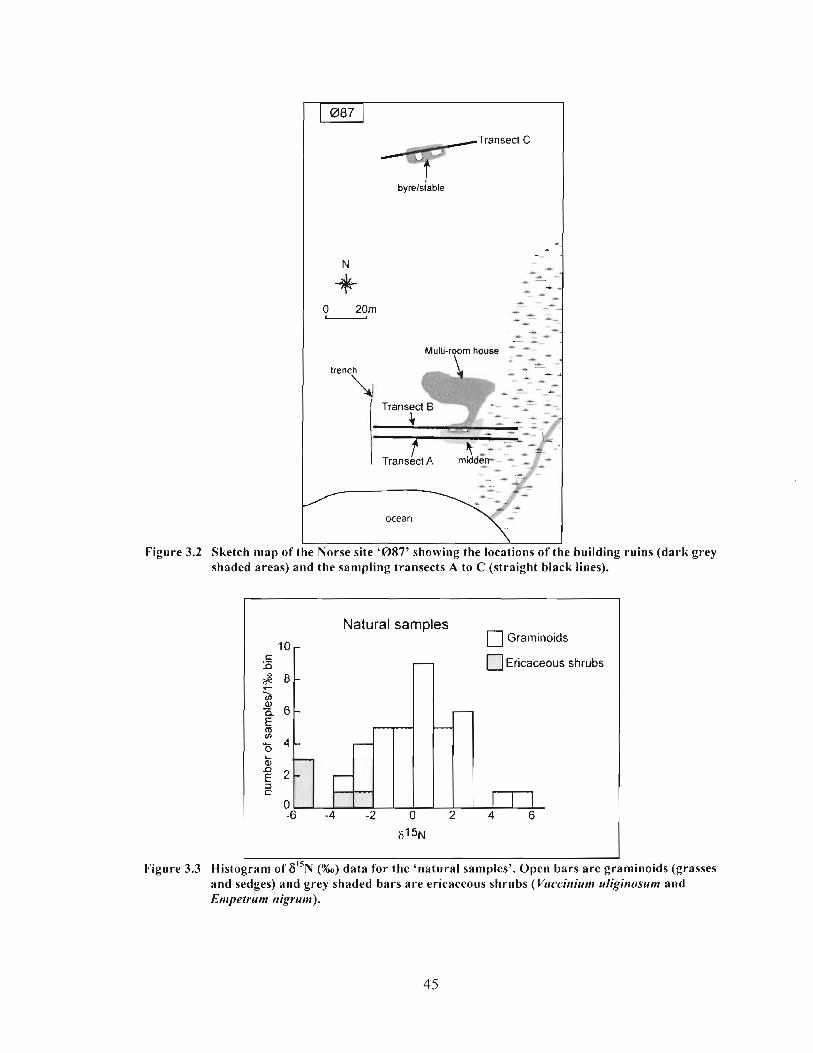
Transect C
7
Multi-room house :--- a
trench .-
* - - * Transect 8 - _ - -_
A
ocean
I \
Figure 3.2 Sketch map of the Norse site '087' showing the locations o f t e building ruins (dark grey shaded areas) and the sampling transects A to C (straight black lines).
Natural samples Graminoids
Ericaceous shrubs
Figure 3.3 Histogram of 6''~ (XO) data for the 'natural samples'. Open bars are graminoids (grasses and sedges) and grey shaded bars a r e ericaceous shrubs (Vnccinium uliginosum and Enrpctrum nigrum).
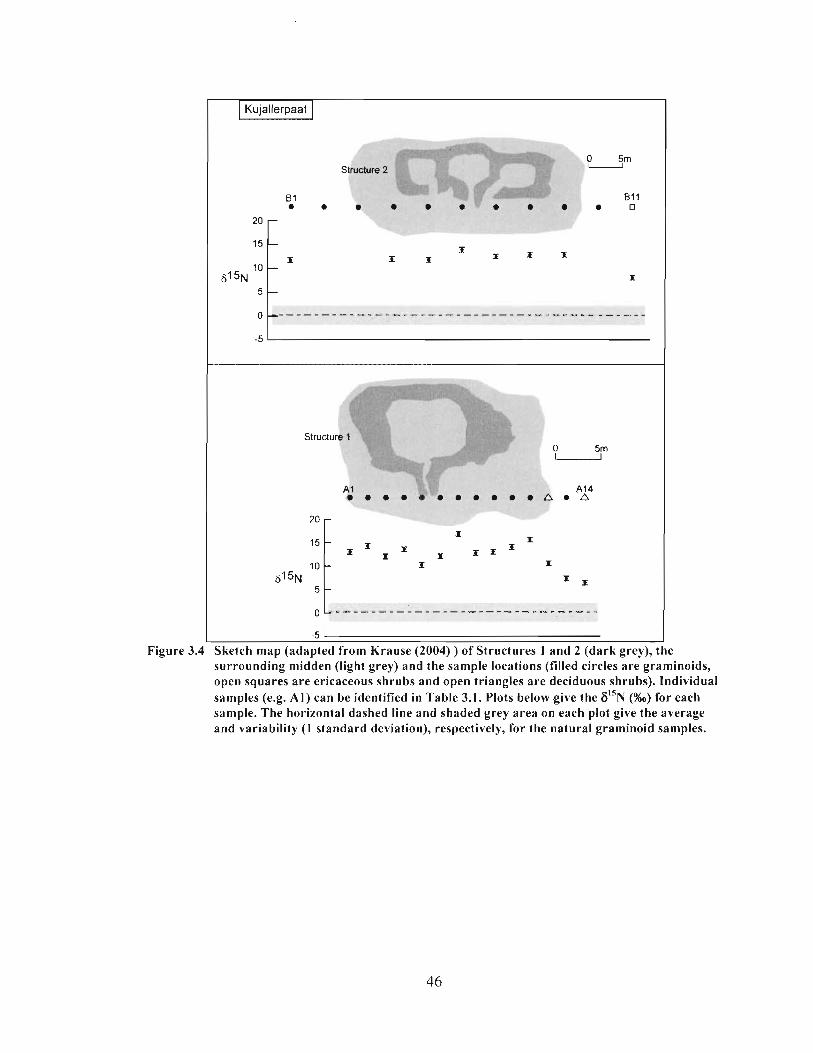
Kujallerpaat
B1 B l l 0 . . m . . . . . . .
20 r
Structure
Figure 3.4 Sketch map (adapted f rom Krause (2004) ) o f Structures 1 and 2 (dark grey), the surrounding midden (light grey) and the sample locations (fil led circles are graminoids, open squares are ericaceous shrubs and open triangles are deciduous shrubs). Indiv idual samples (e.g. A l ) can be identif ied in Table 3.1. Plots below give the 6% (%) fo r each sample. The horizontal dashed l ine and shaded grey area o n each plot give the average and var iabi l i ty (1 standard deviation), respectively, Tor the natural graminoid samples.
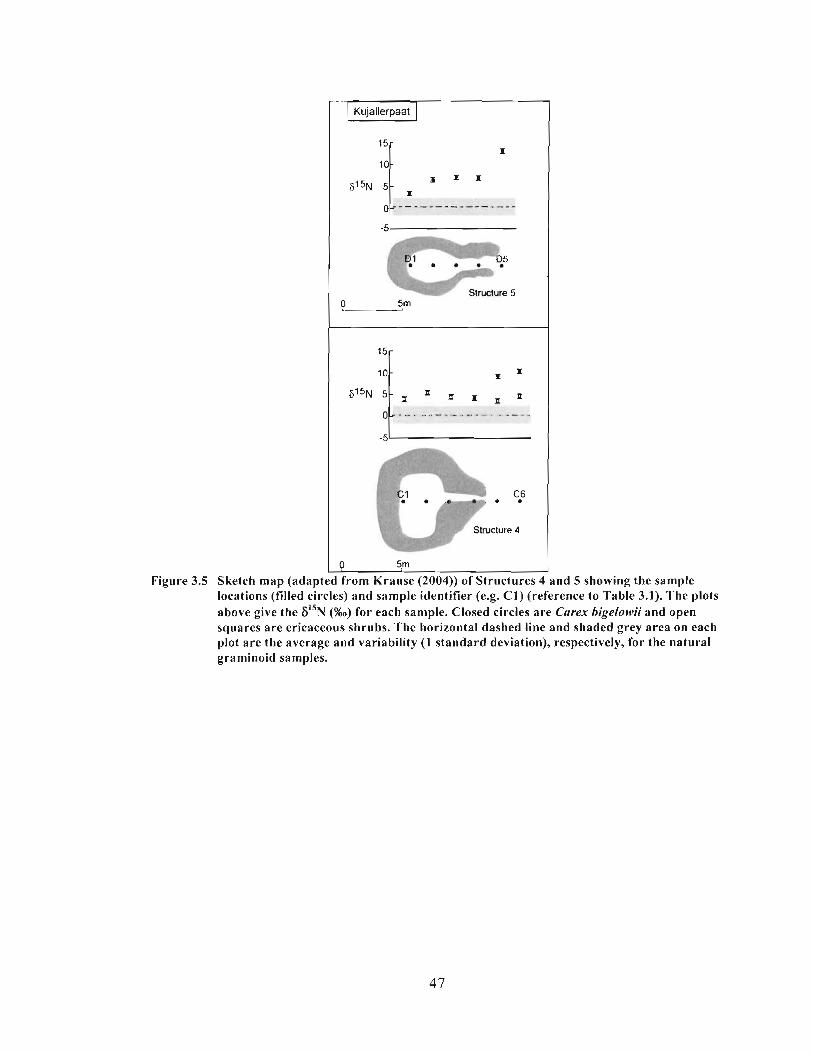
Kujallerpaat
-5
--#'
0 Structure 5
5m
0 5m
Figure 3.5 Sketch map (adapted from Krause (2004)) of Structures 4 and 5 showing the sample locations (filled circles) and sample identifier (e.g. C1) (reference to Table 3.1). The plots above give the 6 " ~ (740) for each sample. Closed circles a re Carex bigelowii and open squares a re ericaceous shrubs. The horizontal dashed line and shaded grey area on each plot are the average and variability ( 1 standard deviation), respectively, for the natural grarninoid samples.
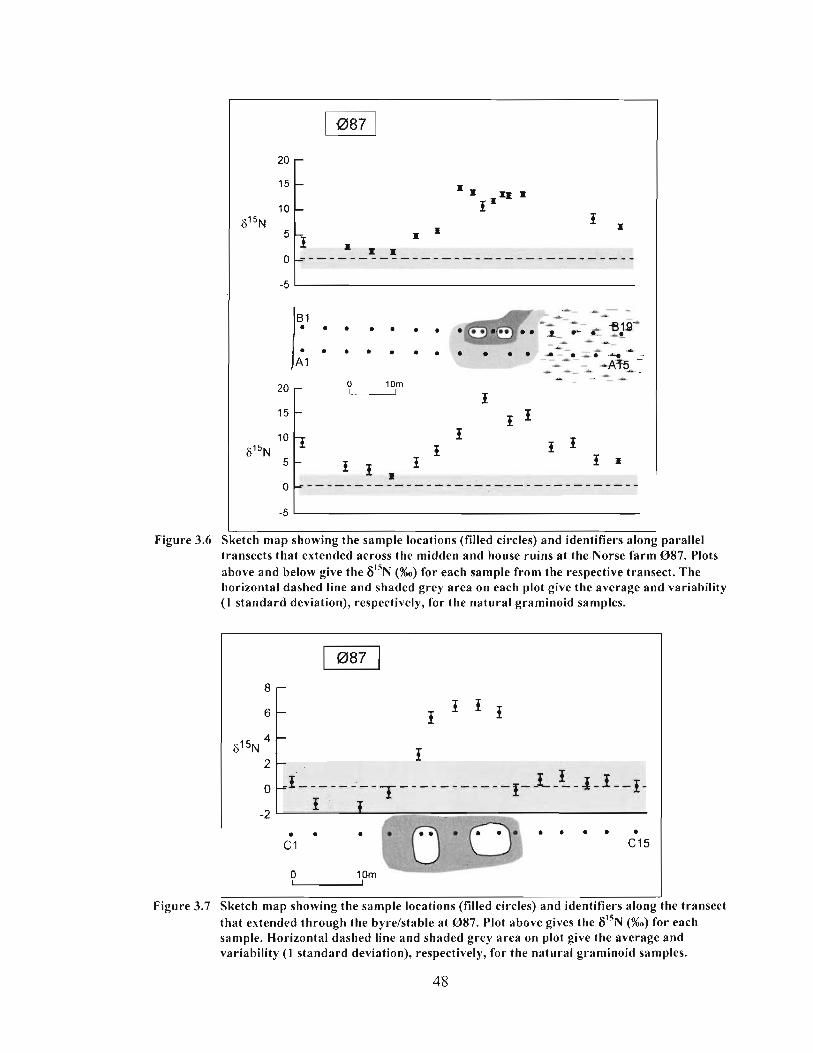
Figure 3.6
-_ - - - qu- . . . . . . o . . . a.. x-.-s? -- P < ;--- A -- - -
Sketch map showing the sample locations (filled circles) and identifiers along parallel transects that extended across the midden and house ruins a t the Norse farm 087. Plots above and below give the 6'" (%o) for each sample from the respective transect. The horizontal dashed line and shaded grey area on each plot give the average and variability (1 standard deviation), respectively, for the natural graminoid samples.
Figure 3.7 Sketch map showing the sample locations (filled circles) and identifiers along the transect that extended through the byrelstable at 087. Plot above gives the 6% (%o) for each sample. Horizontal dashed line and shaded grey area on plot give the average and variability ( I standard deviation), respectively, for the natural graminoid samples.
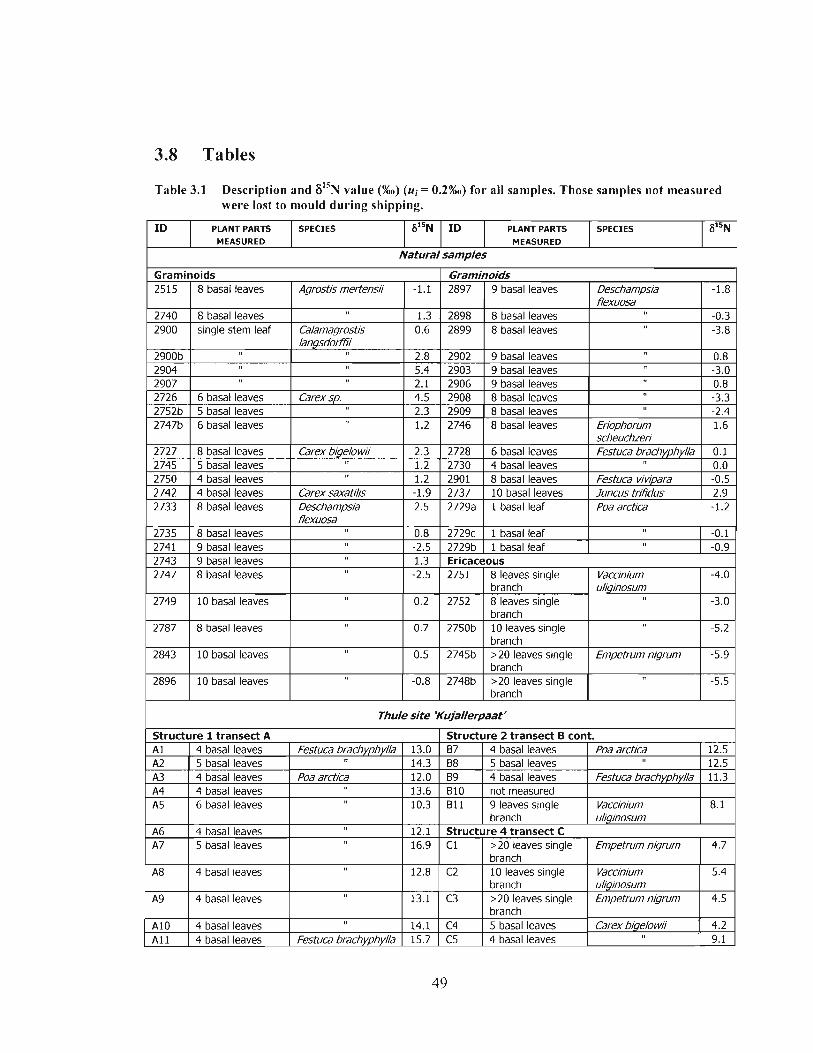
3.8 Tables
Table 3.1 Description and 6 " ~ value (%o) (ui = 0.2%0) for all samples. Those samples not measured were lost to mould during shipping.
Thule site 'Kujallerpaat'
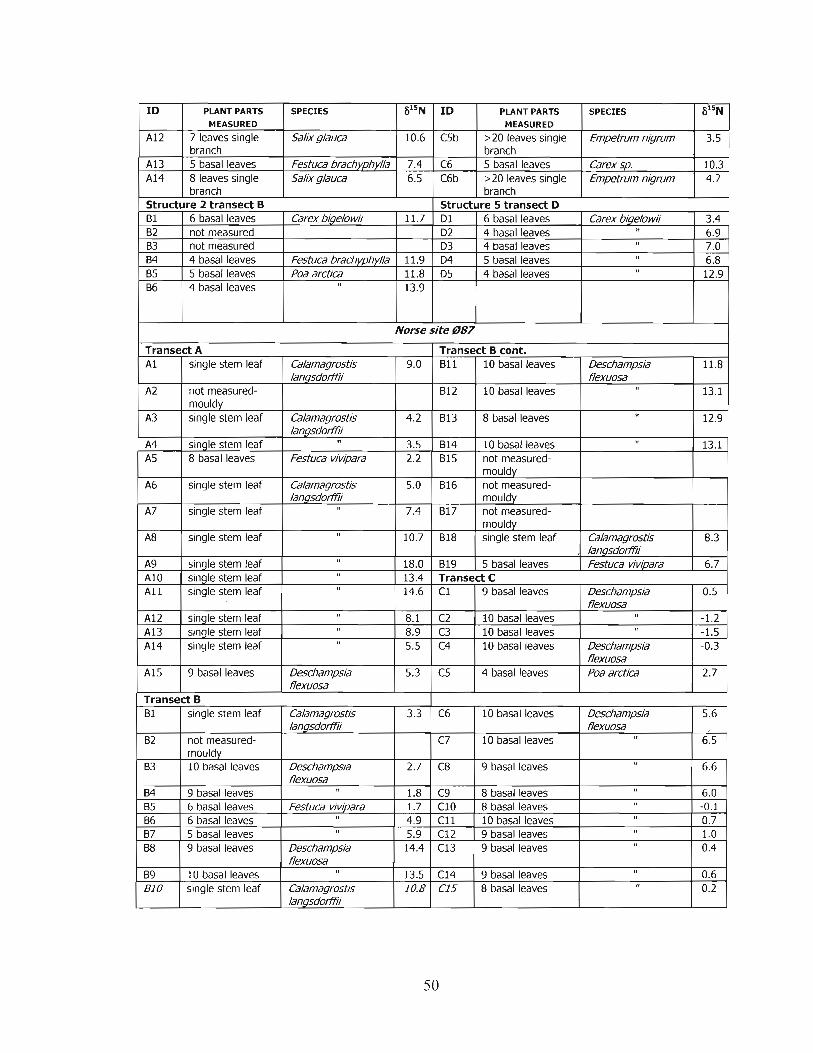
I Norse site 087 I
ID PLANT PARTS SPECIES PLANT PARTS MEASURED MEASURED
A12 7 leaves single Salixglauca 10.6 C5b >20 leaves single
SPECIES
pp
Ernpetrum nigrurn
I34 85 86 87 B8
3.5
09 610
9 basal leaves 6 basal leaves 6 basal leaves 5 basal leaves 9 basal leaves
10 basal leaves single stem leaf
flexuosa
Festuca vivipara
Descharn~sia flexuosa
Cblamagrosttis IangsdonWi
1.8 1.7 4.9 5.9 14.4
13.5 10.8
C9 ClO C11 C12 C13
C14 C15
8 basal leaves 8 basal leaves 10 basal leaves 9 basal leaves 9 basal leaves
6.0 -0.1 0.7 1.0 0.4
9 basal leaves 8 basal leaves
0.6 0.2
3.9 Reference List
Amundson,R., Austin,A.T., Schuur,E.A.G., Yoo,K., Matzek,V., Kendall,C., Uebersax,A., Brenner,D., Baisden,W.T., 2003. Global patterns of the isotopic composition of soil and plant nitrogen. Global Biogeochem.Cycles. 17.
Ben-David,M., Bowyer,R.T., Duffy,L.K., Roby,D.D., Schell,D.M., 1998. Social behaviour and ecosystem processes: River otter latrines and nutrient dynamics of terrestrial vegetation. Ecology. 79, 2567-2571.
Ben-David,M., Hanley,T.A., Schell,D.M., 1998b. Fertilization of terrestrial vegetation by spawning Pacific salmon: the role of flooding and predator activity. Oikos. 83, 47-55.
Bilby,R.E., Fransen,B.R., Bisson,P.A., 1996. Incorporation of nitrogen and carbon from spawning Coho salmon into the trophic system of small streams: evidence from stable isotopes. Canadian Journal of Fish and Aquatic Science. 53, 164-1 73.
Erskine,P.D., Bergstrom,D.M., Schrnidt,S., Stewart,G.R., Tweedie,C.E., Shaw,J.D., 1998. Subantartic Macquarie Island - a model ecosystem for studying animal- derived nitrogen sources using ' 5 ~ natural abundance. Oecologia. 1 17, 187- 193.
Gullarv,H.C., Grernlands Forhistorie. Gyldendal, Nordisk Forlag, Copenhagen, 2004.
Handley,L.L., Raven,J.A., 1992. The use of natural abundance of nitrogen isotopes in plant physiology and ecology. Plant, Cell and Environment. 15,965-985.
Handley,L.L., Scrimgeour,C.M., 1997. Terrestrial plant ecology and 15N natural abundance: The present limits to interpretation for uncultivated systems with original data from a Scottish Old Field. Adv. Ecol. Res. 27, 133-21 2.
Hawke,D.J., Holdaway,R.N., Causer,J.E., Ogden,S., 1999. Soil indicators ofpre- European seabird breeding in New Zealand at sites identified by predator deposits. Aust.J.Soi1 Res. 37, 103-1 13.
Helfield,J.M., Naiman,R.J., 2002. Salmon and alder as nitrogen sources to riparian forests in a boreal Alaskan watershed. Oecologia. 133, 573-582.
Hilderbrand,G.V., Hanley,T.A., Robbins,C.T., Schwartz,C.C., 1999. Role of brown bears (Ursus arctos) in the flow of marine nitrogen into a terrestrial ecosystem. Oecologia. 121, 546-550.
Hobbie,E.A., Macko,S.A., Williams,M., 2000. Correlations between foliar and nitrogen concentrations may indicate plant-mycorrhizal interactions. Oecologia. 273-283.
Hogberg,P., 1997. ''N natural abundance in soil-plant systems. New Phytol. 137, 179- 203.
Kelly,J.F., 2000. Stable Isotopes of carbon and nitrogen in the study of avian and mammalian trophic ecology. Can.J.Zoo1. 78, 1-27.
Krause,C., 2004. Historisk-arkzologisk for-forskerskole i Qassimiut for gymnasieklassen 2P fra Sydgrranlands Gymnasiale Skole. 15.
Liu,X.D., Sun,L.G., Yin,X.B., Zhu,R.B., 2004. Paleoecological implications of the nitrogen isotope signatures in the sediments amended by Antarctic seal excrements. Progress in Natural Science. 14, 786-792.
McGovern,T.H., Jordan,R.H., 1982. Settlement and land use in the inner fjords of Godthaab District, West Greenland. Arctic Anthropology. 19,63-80.
Michelsen,A., Quarmby,C., Sleep,D., Jonasson,S., 1998. Vascular plant "N natural abundance in heath and forest tundra ecosystems is closely correlated with presence and type of mycorrhizal fungi in roots. Oecologia, 1 15,406-4 1 8.
Mizutani,H., Kabaya,Y ., Moors,P.J., Speir,T.W., Lyon,G.L., 1991. Nitrogen isotope ratios identify deserted seabird colonies. Auk. 108, 960-964.
Mizutani,H., Kabaya,Y., Wada,E., 1991 b. Linear correlation between latitude and soil ' 5 ~ enrichment at seabird rookeries. Natunvissenschaften, 78, 34-36.
Nadelhoffer,K.J., Fry,B., 1994, Nitrogen Isotope Studies in Forest Ecosystems in: Lajtha K., Marshall J.D. (Eds.), Stable Isotopes in Ecology and Environmental Science, Blackwell Scientific Publications, London, pp. 22-44.
Nadelhoffer,K., Shaver,G., Fry,B., Giblin,A., Johnson,L., McKane,R., 1996. 1 5 ~ natural abundances and N use by tundra plants. Oecologia, 107, 386-394.
Robinson,D., 2001. 6 1 5 ~ as an integrator of the nitrogen cycle. Trends in Ecology and Evolution. 16, 153-1 62.
Schimel,J.P., Kielland,K., Chapin III,F.S., 1996, Nutrient availability and uptake by tundra plants in: Reynolds J.F., Tenhunen J.D. (Eds.), Landscape function and disturbance in Arctic tundra, Springer-Verlag, Berlin, pp. 203-221.
Schoeninger,M.J., DeNiro,M.J., 1984. Nitrogen and carbon isotopic composition of bone collagen from marine and terrestrial animals. Geochimica et Cosmochimica. 48, 625-639.
Schulze,E.D., Chapin III,F.S., Gebauer,G., 1994. Nitrogen nutrition and isotope differences among life forms at the northern treeline of Alaska. Oecologia, 406- 412.
Wainright,S.C., Haney,J.C., Kerr,C., Golovkin,A.N., Flint,M.V., 1998. Utilization of nitrogen derived from seabird guano by terrestrial and marine plants at St. Paul, Pribilof Islands, Bering Sea, Alaska. Mar. Biol. 13 I, 63-71.
We1 ker,J.M., Jonsdottir,I.S., Fahnestock,J.T., 2003. Leaf isotopic (delta C-13 and delta N-15) and nitrogen contents of Carex plants along the Eurasian Coastal Arctic: results from the Northeast Passage expedition. Polar Biol. 27,29-37.
CHAPTER 4 PATTERNS OF PLANT 6 1 5 ~ VALUES ON A GREENLAND NORSE FARM
4.1 Abstract
In a further empirical study of the impact of past human activities on modern
plant 6 1 5 ~ values, plants were collected in each of two growing seasons from several
defined contexts of an inland Norse farm in southwest Greenland. The 6I5N measures of
the plants show a clear distinction between areas with definite evidence of past human
activity and those without. The data for the plants on this farm's infield indicates that it
was purposely fertilized. The intriguing intra- and inter-variations in the "N values of
plants from several structures are not easily explained, but the differences appear to
reflect the different functions of the various farm structures. The findings of this study
suggest practical applications for future use of plant F ' ~ N values in archaeology.
4.2 Introduction
We recently reported the results of a test-of-concept study in which we examined
the 8'" values of plants currently growing on features of two Greenlandic
archaeological sites, one a Thule-culture dwelling site and the other a Norse farmstead
(Commisso and Nelson, 2006). The aim of that study was to determine whether past
human deposition of isotopically-distinct nitrogenous substances would son~ehow be
reflected in the isotopic values of the plants growing on the sites today. The data obtained
2 The following chapter has been published in the Journal of Archaeological Science (2007) Vol. 34, pg 440-450, under the co-authorship of R.G. Conlmisso and D.E. Nelson.
5 3
strongly confirmed this postulate, in that plants growing on the Thule and Norse middens
containing marine mammal remains had much higher 6 1 5 ~ values than did those of plants
growing in natural locales in the same region. A distinct isotopic signature was also
found for plants growing within the Thule house remains and those in a Norse barn or
stable. For each site, ancient human activity was clearly correlated with the nitrogen
isotopic values of the plants.
The complexity of the soillplant nitrogen cycle prevents simple causal
explanations for plant 6 1 5 ~ values (Handley and Raven, 1992; Hogberg, 1997) and thus
the particular mechanisms producing the unusually high values remain unknown. Even
so, the general correlation observed between the 6 j 5 ~ values of the materials deposited in
the past and those of the plants now growing on these deposits suggests that the
isotopically distinct nitrogen introduced centuries ago has remained locally conserved in
the soil/plant system. Whether or not this is the case, we can conclude from these new
observations that plant 6 1 5 ~ values may provide archaeology with a useful non-invasive
analytical tool.
Here we report a further empirical exploration of this phenomenon. We have
investigated in some detail a Norse farm in southwest Greenland that has lain undisturbed
since it was abandoned at some time prior to the end of the 15th century AD (Buckland et
nl., 1996). The previous sites studied were on the outer-coast, whereas this farm was
located inland and we could thus examine the effect in a different geographic and
climatic setting. The well-preserved ruins at this site provided an ideal situation to
conduct further tests. Numerous structures remain accurately defined by still-standing
portions of exterior walls. Some still retain evidence of interior divisions and the original
function of most is known. Further, on this farm the infield is clearly evident and well
demarcated from the surrounding land.
In each of two summers we systematically collected plants from several of the
defined features and from the surrounding landscape to provide comparative data for
areas with definite evidence of human activity and for those without. The data from the
different years also allowed us to examine the extent to which the plant 6 ' ' ~ values were
a product of particular growing conditions and to test the year-to-year reproducibility of
the measurements.
The results of this study again clearly show the effect of past human activity on
modern plant 6I5N values. Plants from all but one of the anthropogenic contexts sampled
had 6 ' ' ~ values that were distinct from those of plants growing in non-impacted settings.
Some intriguing intra- and inter-variation for the plant 6 1 5 ~ values was observed even
between similar contexts. Although detailed knowledge of Greenlandic Norse farming
practices is limited, it does provide some first explanations for the observed patterns, and
suggests that current plant 6 " ~ values reflect specific activities in antiquity.
4.2.1 Overview of Norse settlement and farms in Greenland
At the end of the 10th century AD the Norse established two settlements in
southwest Greenland, the so-called Western Settlement (at about 64 degrees north) and
Eastern Settlement (60 to 61 degrees north) , which were respectively abandoned in the
mid-fourteenth and mid-fifteenth centuries (Barlow et al., 1997). These were rural
settlements and the farms were typically spaced 2-3 kilometers apart in relatively wann
areas along the inner fjords and in the valleys, at elevations below 200m (Albrethsen and
Keller, 1986). Farms ranged in size, but typically consisted of several buildings and
structures: a house, byre and barn, stables, storage facilities and pens or folds. Buildings
were either constructed separately or joined together in multi-function complexes
(Andreasen, 198 1 ). Previous excavations of Norse farms have shown that function can
often be inferred for individual ruins based on form and construction method (Roussell,
1941).
The animal remains found in excavated middens indicate that the dietary
economy was based on domestic animals and on the hunting of wild animals (McGovern,
1985). Of the latter, seals were particularly important, as even at inland farms seal
remains constitute a large proportion of the faunal assemblage (McGovern, 1992). In the
Greenlandic climate, grazing pastures could only be exploited for four to five months
each year; for the remainder, the domestic animals would need to be supplied with fodder
(Albrethesen and Keller, 1986). This would be especially true for the cattle, which were
kept in the b y e s for at least six months through long, cold winters (ibid). The production
and harvest of sufficient amounts of winter fodder would thus have been a key
component in this farming system (Amorosi et al., 1998).
Much of the required fodder would have been harvested from the infield
surrounding the farm. Besides physical evidence of irrigation systems , there is little hard
data on field management practices for Norse farms in Greenland and there is some
disagreement as to whether the Norse were consciously fertilizing their fields. Evidence
and arguments for and against have been presented by McGovern et al. ( 1 988).
4.2.2 Norse Farm 0 3 7
The farm studied here (traditionally referred to as 037) is located at the northern
extent of the Eastern Settlement in the central portion of Qorlortup Itinnera, a long,
narrow valley connecting Tunugdliarfik Fjord and Nordre Sermilik. The valley is a short
distance north of the modern settlement of Qassiarssuk, which is believed to have been
the location of Brattahlid, Erik the Red's farm (Krogh, 1982).
Fig 4.1 provides an over-view plan of the farm. Previous surveys of the site and
interpretations of individual ruins (which are followed here) are given by Guldager et al.
(2002). The main ruins of the farm are located on the eastern half of a large alluvial fan
that has been formed by a river that issues above the site. Centrally located are two large
structures: a house and a byre. The house is an elongated complex consisting of a series
of rooms of which the eastern end is suggested to have been used as a byre for domestic
animals (Guldager et al., 2002). A separate byre is located approximately 15m southwest
of the house and again is an elongated structure with a series of rooms. This byre most
likely would have been a combination of both byre and barn; respectively, housing
animals and storing fodder (ibid). The walls of both house and byre were of stone and sod
construction. Portions of individual rooms are still visible as depressed areas within both
ruins, although all contain varying amounts of collapsed roof and wall debris. Midden
deposits are frequently identified at these farms as low mounds or by distinctive
vegetation cover (Roussell, 1941). Neither indicator was present at 0 3 7 and thus the
location of the midden deposits remains unknown.
Further to the southwest across what appears to have been an old river channel-
which also may have been used as part of an irrigation system (Albrethsen and Keller,
1986) - are two stone built pens (Pens A and B, Fig 4. I ) . Northwest of the house at the
base of the slope is a small sod and stone built stable with two well-defined rooms.
Above this on the slope are several stone pens with attached dry-masonry buildings. Also
to the north, on a relatively steep slope, is an arch-shaped feature which is outlined by a
series of stones on the ground surface (Pen C, Fig 4.1). This feature has been interpreted
as a small pen (Guldager el al., 2002), but if so, it is clearly different than the others for
this farm as the walls would not have been of stone construction.
Unlike the majority of Norse farms in the area, the infield is clearly identifiable
and its extent can be easily defined. It surrounds the house and byre and extends north to
the valley slope, west to the old river channel which has a stone built dyke along its edge,
and south to the Qorlortup River. To the east, the field gently slopes down into a low, wet
marsh. The primary indicator that this area was used as an infield is the complete lack of
surface cobbles which are a dominant feature on the remaining portions of the alluvial
fan.
4.3 Methods
Plant specimens were collected both on the farm and, for direct comparison, from
local naturally-accumulated soils. (Below, we refer to these respectively as the 'on-site'
and the 'natural' samples). We had previously found it best to compare plants with
similar functional traits (Commisso and Nelson, 2006), and so the sampling for this
project was limited to graminoids (grasses and sedges), mostly focusing on the grass
species Deschampiajlexuosa and Festuca brachyphylla.
Sampling took place at the height of the growing season in two different years,
August 2-4,2003 and July 17-1 8,2005. Collection and handling was kept simple: For all
samples discussed below, the above-ground portions of individual healthy green plants
were removed, air dried to the extent possible and shipped to the laboratory. A few were
lost to mould during transport to the laboratory.
Growing conditions differed for these two years. Sampling in 2003 followed an
unusually arid period. Local sheep farmers were concerned about their hay crops and the
plant growth on the site reflected this concern, as the vegetation cover was sparse and
many plants were already in senescence. These factors did affect the sampling procedure,
as at some sampling locations it was not possible to obtain healthy specimens of the
sought-after species. The conditions in 2005 were much better and because of the
comparatively lush vegetation cover we were able to select only those grass species of
interest.
Sheep and horses graze throughout the Qorlortup Valley and neighbouring upland
areas during the summer. Both the farm site and the areas from which the background
samples were taken are equally accessible to the animals. Any modem inputs of nitrogen
from these animals should be equally represented both on and off-site.
4.3.1 Natural samples
Any discussion of the affect of past human activity on plant 6 ' ' ~ values requires
an understanding of the range of 6 1 5 ~ values that characterize plants growing on natural
soils. Our previous measurements of graminoids growing in natural circumstances in
outer-coast areas of this region show that they fall within the range -3.8%0 to +5.5%0, with
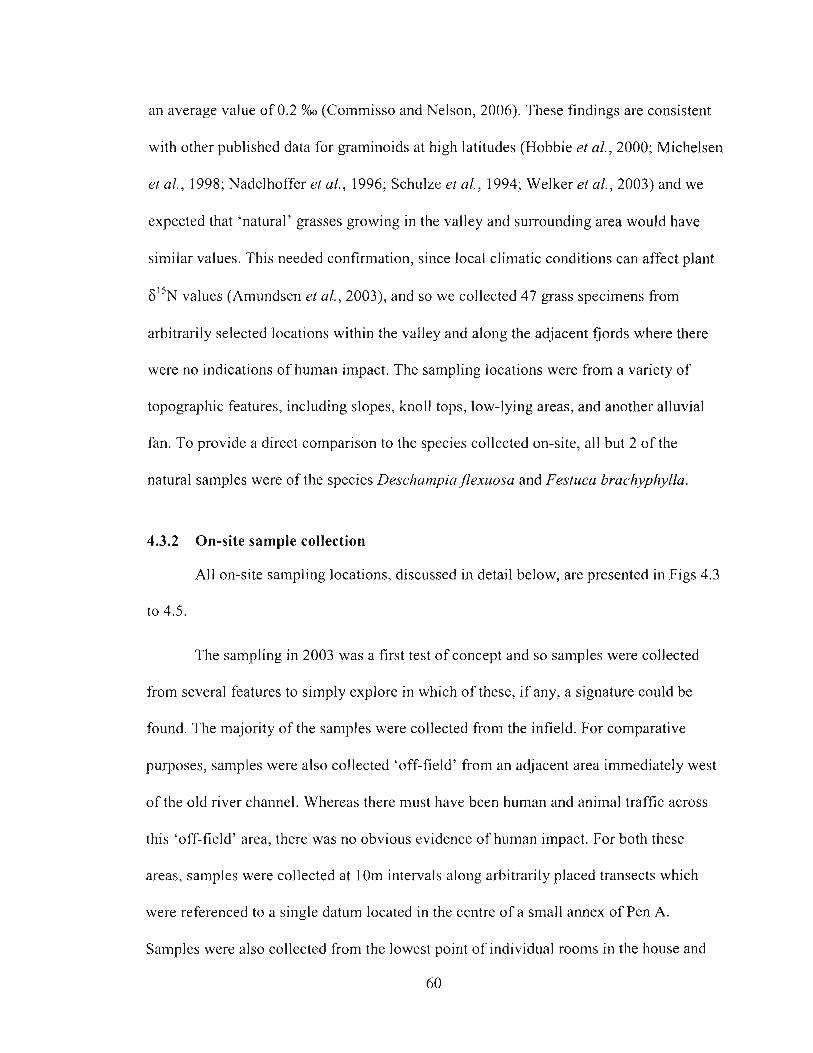
an average value of 0.2 %O (Commisso and Nelson, 2006). These findings are consistent
with other published data for graminoids at high latitudes (Hobbie et al., 2000; Michelsen
et al., 1998; Nadelhoffer et al., 1996; Schulze et al., 1994; Welker et al., 2003) and we
expected that 'natural' grasses growing in the valley and surrounding area would have
similar values. This needed confirmation, since local climatic conditions can affect plant
values (Amundsen et al., 2003), and so we collected 47 grass specimens from
arbitrarily selected locations within the valley and along the adjacent fjords where there
were no indications of human impact. The sampling locations were fi-om a variety of
topographic features, including slopes, knoll tops, low-lying areas, and another alluvial
fan. To provide a direct comparison to the species collected on-site, all but 2 of the
natural samples were of the species Deschampiaflexuosa and Festuca brachyphylla.
4.3.2 On-site sample collection
All on-site sampling locations, discussed in detail below, are presented in Figs 4.3
to 4.5.
The sampling in 2003 was a first test of concept and so samples were collected
fi-om several features to simply explore in which of these, if any, a signature could be
found. The majority of the samples were collected from the infield. For comparative
purposes, samples were also collected 'off-field' from an adjacent area immediately west
of the old river channel. Whereas there must have been human and animal traftic across
this 'off-field' area, there was no obvious evidence of human impact. For both these
areas, samples were collected at 1 Om intervals along arbitrarily placed transects which
were referenced to a single datum located in the centre of a small annex of Pen A.
Samples were also collected from the lowest point of individual rooms in the house and
60
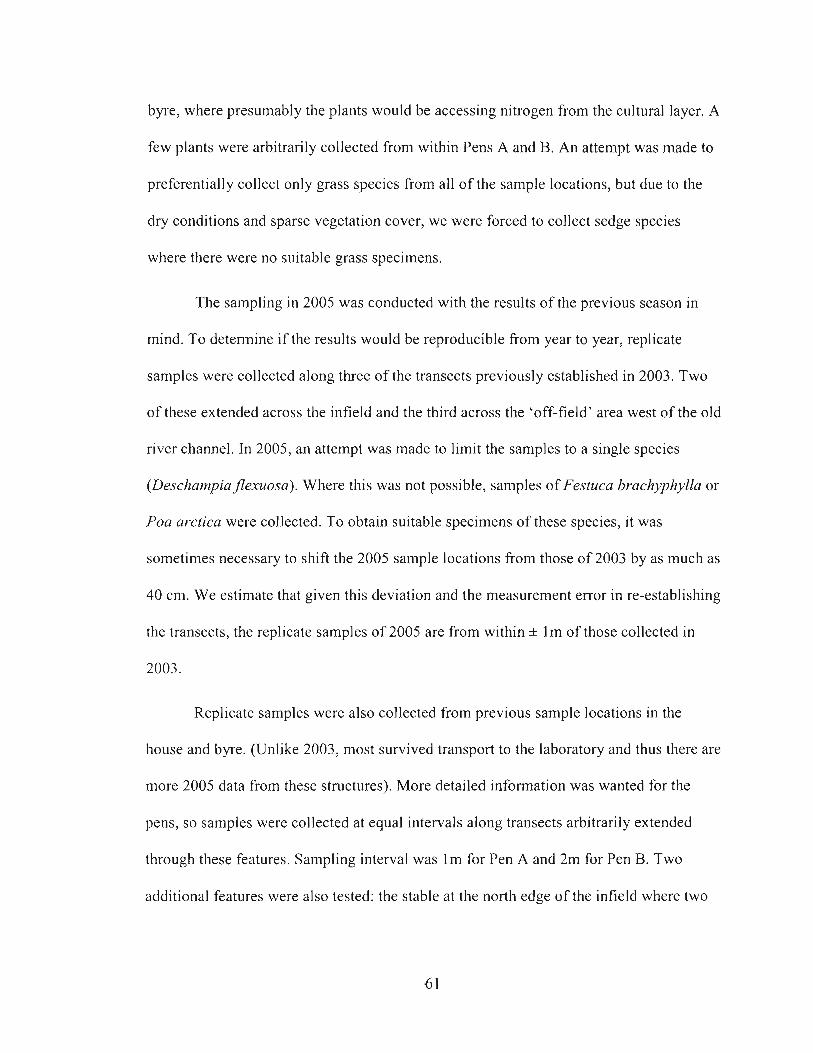
byre, where presumably the plants would be accessing nitrogen from the cultural layer. A
few plants were arbitrarily collected from within Pens A and B. An attempt was made to
preferentially collect only grass species from all of the sample locations, but due to the
dry conditions and sparse vegetation cover, we were forced to collect sedge species
where there were no suitable grass specimens.
The sampling in 2005 was conducted with the results of the previous season in
mind. To determine if the results would be reproducible from year to year, replicate
samples were collected along three of the transects previously established in 2003. Two
of these extended across the infield and the third across the 'off-field' area west of the old
river channel. In 2005, an attempt was made to limit the samples to a single species
(Deschampiajlexuosa). Where this was not possible, samples of Festuca brachyphylla or
Poa arctica were collected. To obtain suitable specimens of these species, it was
sometimes necessary to shift the 2005 sample locations from those of 2003 by as much as
40 cm. We estimate that given this deviation and the measurement error in re-establishing
the transects, the replicate samples of 2005 are from within * I m of those collected in
2003.
Replicate samples were also collected from previous sample locations in the
house and byre. (Unlike 2003, most survived transport to the laboratory and thus there are
more 2005 data from these structures). More detailed information was wanted for the
pens, so samples were collected at equal intervals along transects arbitrarily extended
through these features. Sampling interval was l m for Pen A and 2m for Pen B. Two
additional features were also tested: the stable at the north edge of the infield where two
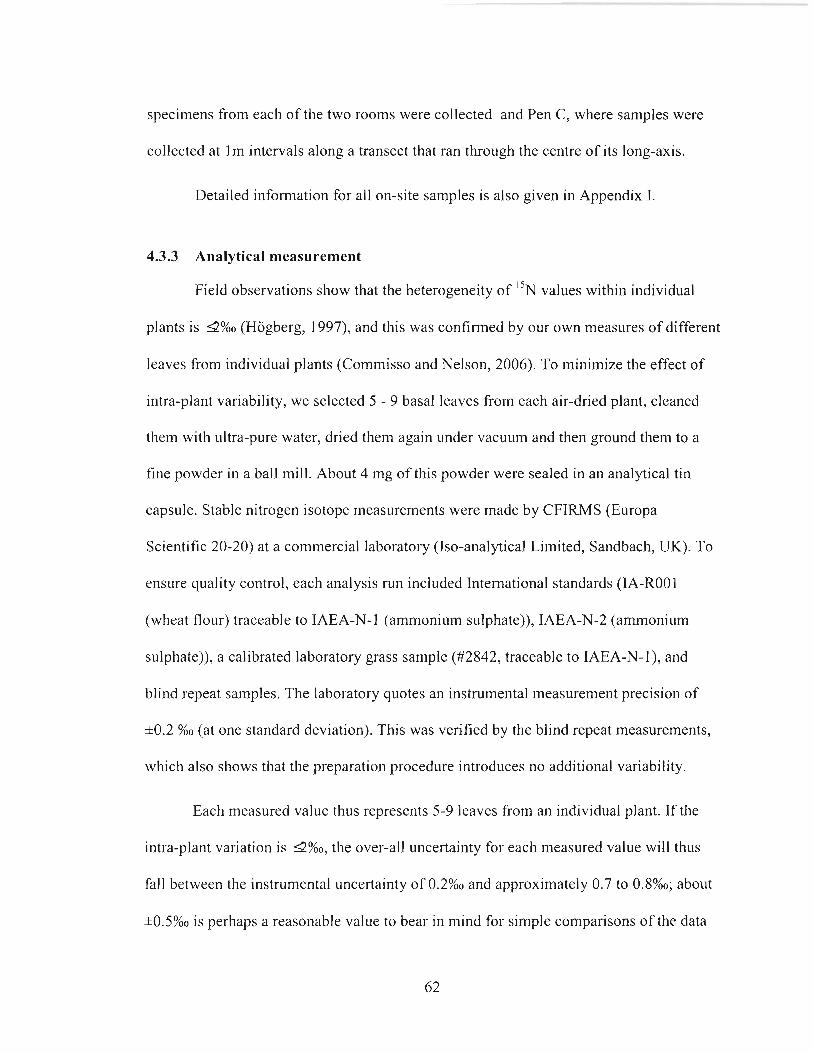
specimens from each of the two rooms were collected and Pen C, where samples were
collected at 1m intervals along a transect that ran through the centre of its long-axis.
Detailed information for all on-site samples is also given in Appendix 1.
4.3.3 Analytical measurement
Field observations show that the heterogeneity of 1 5 ~ values within individual
plants is 4 % 0 (Hogberg, 1997), and this was confirmed by our own measures of different
leaves from individual plants (Commisso and Nelson, 2006). To minimize the effect of
intra-plant variability, we selected 5 - 9 basal leaves from each air-dried plant, cleaned
them with ultra-pure water, dried them again under vacuum and then ground them to a
fine powder in a ball mill. About 4 mg of this powder were sealed in an analytical tin
capsule. Stable nitrogen isotope measurements were made by CFIRMS (Europa
Scientific 20-20) at a commercial laboratory (Iso-analytical Limited, Sandbach, UK). To
ensure quality control, each analysis run included International standards (IA-ROO1
(wheat flour) traceable to IAEA-N-1 (ammonium sulphate)), IAEA-N-2 (ammonium
sulphate)), a calibrated laboratory grass sample (#2842, traceable to IAEA-N-I), and
blind repeat samples. The laboratory quotes an instrumental measurement precision of
lt0.2 %O (at one standard deviation). This was verified by the blind repeat measurements,
which also shows that the preparation procedure introduces no additional variability.
Each measured value thus represents 5-9 leaves from an individual plant. If the
intra-plant variation is 4 % 0 , the over-all uncertainty for each measured value will thus
fall between the instrumental uncertainty of 0.2%0 and approximately 0.7 to 0.8%0; about
*0.5%0 is perhaps a reasonable value to bear in mind for simple comparisons of the data
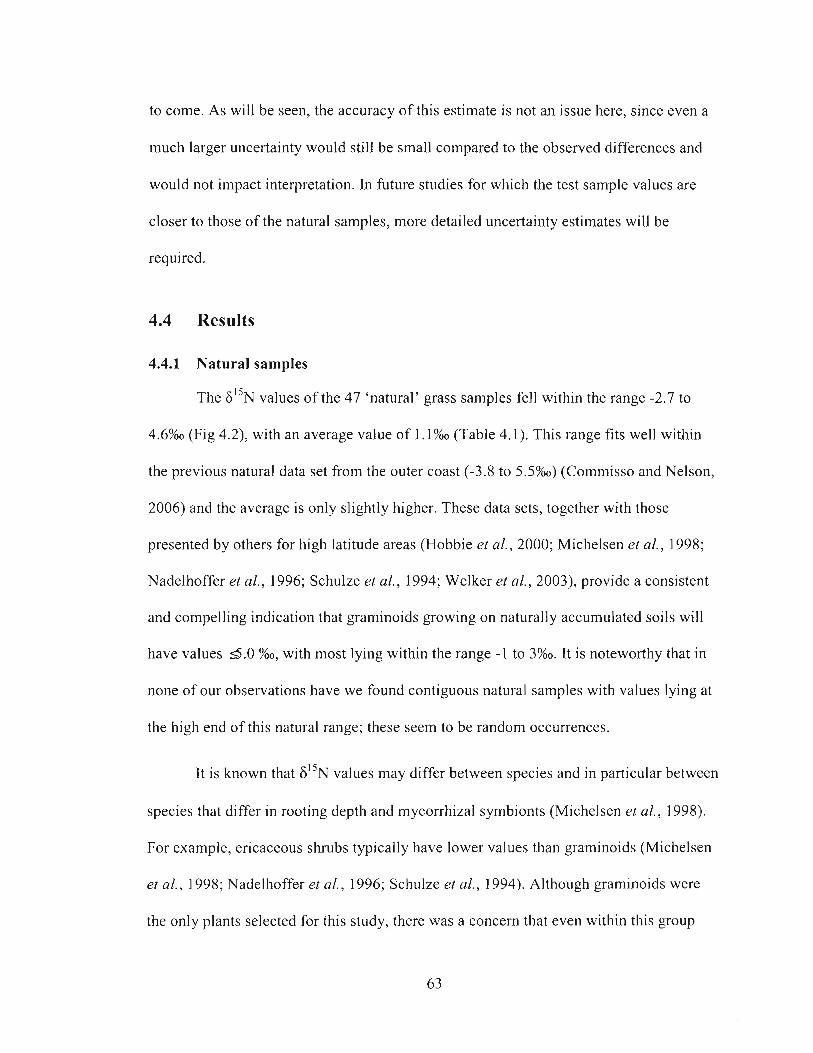
to come. As will be seen, the accuracy of this estimate is not an issue here, since even a
much larger uncertainty would still be small compared to the observed differences and
would not impact interpretation. In future studies for which the test sample values are
closer to those of the natural samples, more detailed uncertainty estimates will be
required.
4.4 Results
4.4.1 Natural samples
The 6 1 5 ~ values of the 47 'natural' grass samples fell within the range -2.7 to
4.6%0 (Fig 4.2), with an average value of I . 1 %O (Table 4.1). This range fits well within
the previous natural data set from the outer coast (-3.8 to 5.5%0) (Commisso and Nelson,
2006) and the average is only slightly higher. These data sets, together with those
presented by others for high latitude areas (Hobbie et al., 2000; Michelsen el al., 1998;
Nadelhoffer et al., 1996; Schulze et al., 1994; Welker et al., 2003), provide a consistent
and compelling indication that graminoids growing on naturally accumulated soils will
have values 4 . 0 %o, with most lying within the range -1 to 3%0. It is noteworthy that in
none of our observations have we found contiguous natural samples with values lying at
the high end of this natural range; these seem to be random occurrences.
It is known that F"N values may differ between species and in particular between
species that differ in rooting depth and mycorrhizal symbionts (Michelsen et al., 1998).
For example, ericaceous shrubs typically have lower values than graminoids (Michelsen
et al., 1998; Nadelhoffer et a!. , 1996; Schulze et al., 1994). Although graminoids were
the only plants selected for this study, there was a concern that even within this g o u p
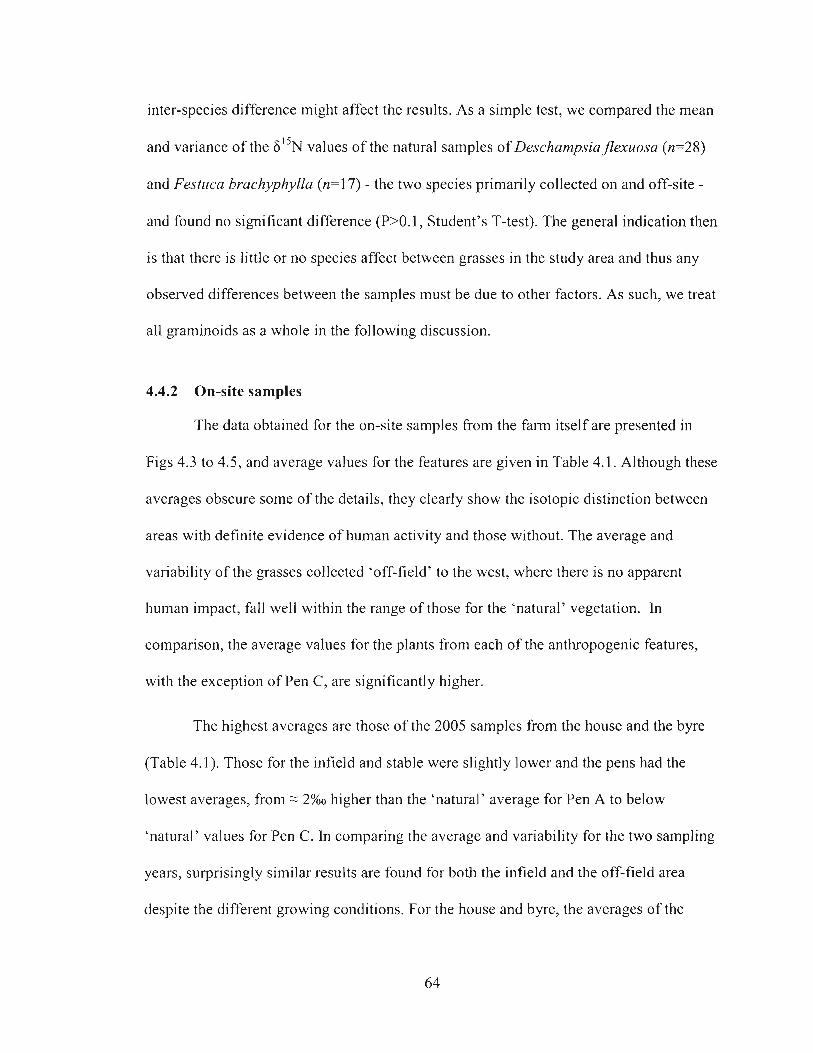
inter-species difference might affect the results. As a simple test, we compared the mean
and variance of the 6 1 5 ~ values of the natural samples of DeschampsiafIexuosa (n=28)
and Festtrca brachyphylla (n=17) - the two species primarily collected on and off-site -
and found no significant difference (P>0.1, Student's T-test). The general indication then
is that there is little or no species affect between grasses in the study area and thus any
observed differences between the samples must be due to other factors. As such, we treat
all graminoids as a whole in the following discussion.
4.4.2 On-site samples
The data obtained for the on-site samples from the farm itself are presented in
Figs 4.3 to 4.5, and average values for the features are given in Table 4.1. Although these
averages obscure some of the details, they clearly show the isotopic distinction between
areas with definite evidence of human activity and those without. The average and
variability of the grasses collected 'off-field' to the west, where there is no apparent
human impact, fall well within the range of those for the 'natural7 vegetation. In
comparison, the average values for the plants from each of the anthropogenic features,
with the exception of Pen C, are significantly higher.
The highest averages are those of the 2005 samples from the house and the byre
(Table 4.1). Those for the infield and stable were slightly lower and the pens had the
lowest averages, from - 2%0 higher than the 'natural' average for Pen A to below
'natural7 values for Pen C. In comparing the average and variability for the two sampling
years, surprisingly similar results are found for both the infield and the off-field area
despite the different growing conditions. For the house and byre, the averages of the
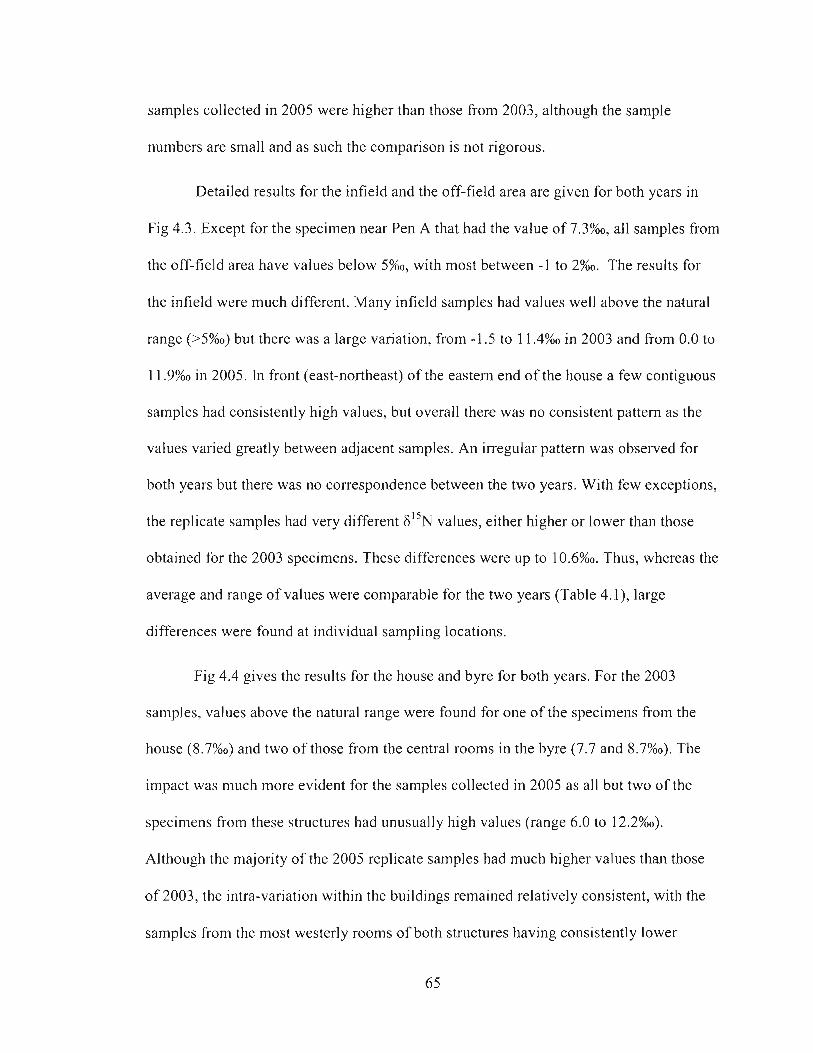
samples collected in 2005 were higher than those from 2003, although the sample
numbers are small and as such the comparison is not rigorous.
Detailed results for the infield and the off-field area are given for both years in
Fig 4.3. Except for the specimen near Pen A that had the value of 7.3%0, all samples from
the off-field area have values below 5%0, with most between -1 to 2%0. The results for
the infield were much different. Many infield samples had values well above the natural
range (>5%0) but there was a large variation, from -1.5 to 1 1.4%0 in 2003 and fiom 0.0 to
I 1.9%0 in 2005. In front (east-northeast) of the eastern end of the house a few contiguous
samples had consistently high values, but overall there was no consistent pattern as the
values varied greatly between adjacent samples. An irregular pattern was observed for
both years but there was no correspondence between the two years. With few exceptions,
the replicate samples had very different 6 ' ' ~ values, either higher or lower than those
obtained for the 2003 specimens. These differences were up to 10.6%0. Thus, whereas the
average and range of values were comparable for the two years (Table 4. I ) , large
differences were found at individual sampling locations.
Fig 4.4 gives the results for the house and byre for both years. For the 2003
samples, values above the natural range were found for one of the specimens from the
house (8.7%0) and two of those fiom the central rooms in the byre (7.7 and 8.7%0). The
impact was much more evident for the samples collected in 2005 as all but two of the
specimens from these structures had unusually high values (range 6.0 to 12.2%0).
Although the majority of the 2005 replicate samples had much higher values than those
of 2003, the intra-variation within the buildings remained relatively consistent, with the
samples from the most westerly rooms of both structures having consistently lower
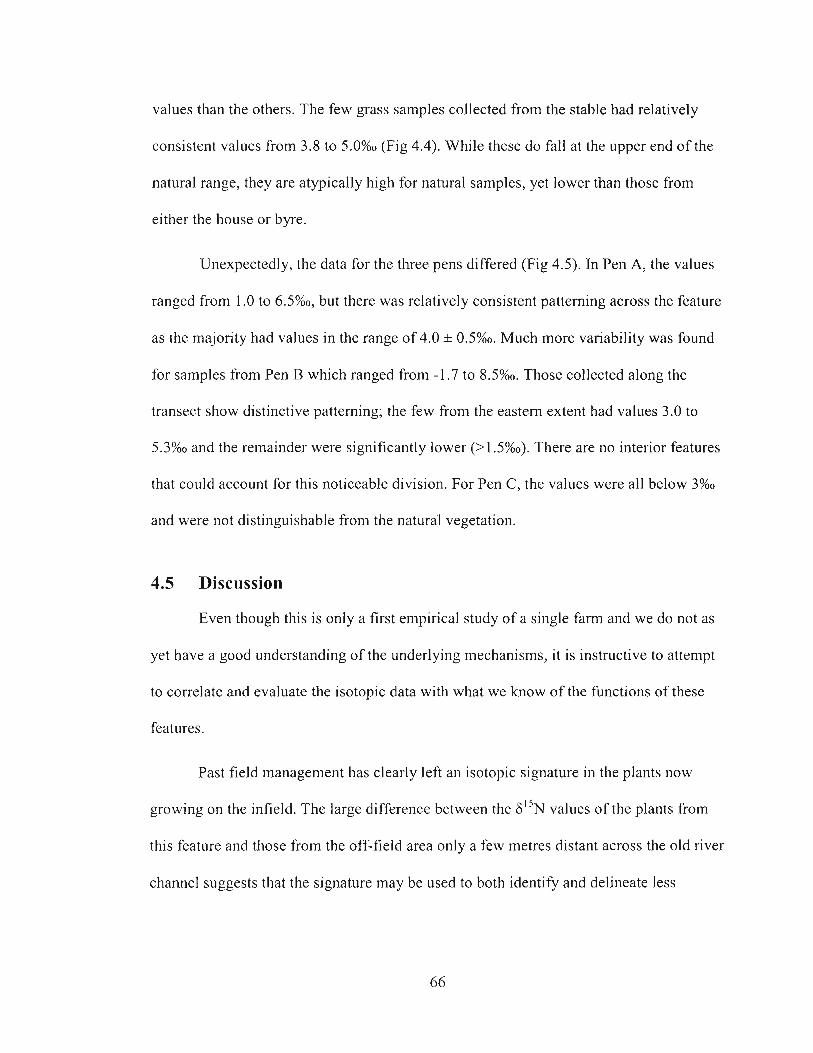
values than the others. The few grass samples collected from the stable had relatively
consistent values from 3.8 to 5.0%0 (Fig 4.4). While these do fall at the upper end of the
natural range, they are atypically high for natural samples, yet lower than those from
either the house or byre.
Unexpectedly, the data for the three pens differed (Fig 4.5). In Pen A, the values
ranged from 1.0 to 6.5%0, but there was relatively consistent patterning across the feature
as the majority had values in the range of 4.0 * 0.5%0. Much more variability was found
for samples from Pen B which ranged from -1.7 to 8.5%0. Those collected along the
transect show distinctive patterning; the few from the eastern extent had values 3.0 to
5.3%0 and the remainder were significantly lower (>1.5%0). There are no interior features
that could account for this noticeable division. For Pen C, the values were all below 3%0
and were not distinguishable from the natural vegetation.
4.5 Discussion
Even though this is only a first empirical study of a single farm and we do not as
yet have a good understanding of the underlying mechanisms, it is instructive to attempt
to correlate and evaluate the isotopic data with what we k.now of the functions of these
features.
Past field management has clearly left an isotopic signature in the plants now
growing on the infield. The large difference between the values of the plants from
this feature and those from the off-field area only a few metres distant across the old river
channel suggests that the signature may be used to both identify and delineate less
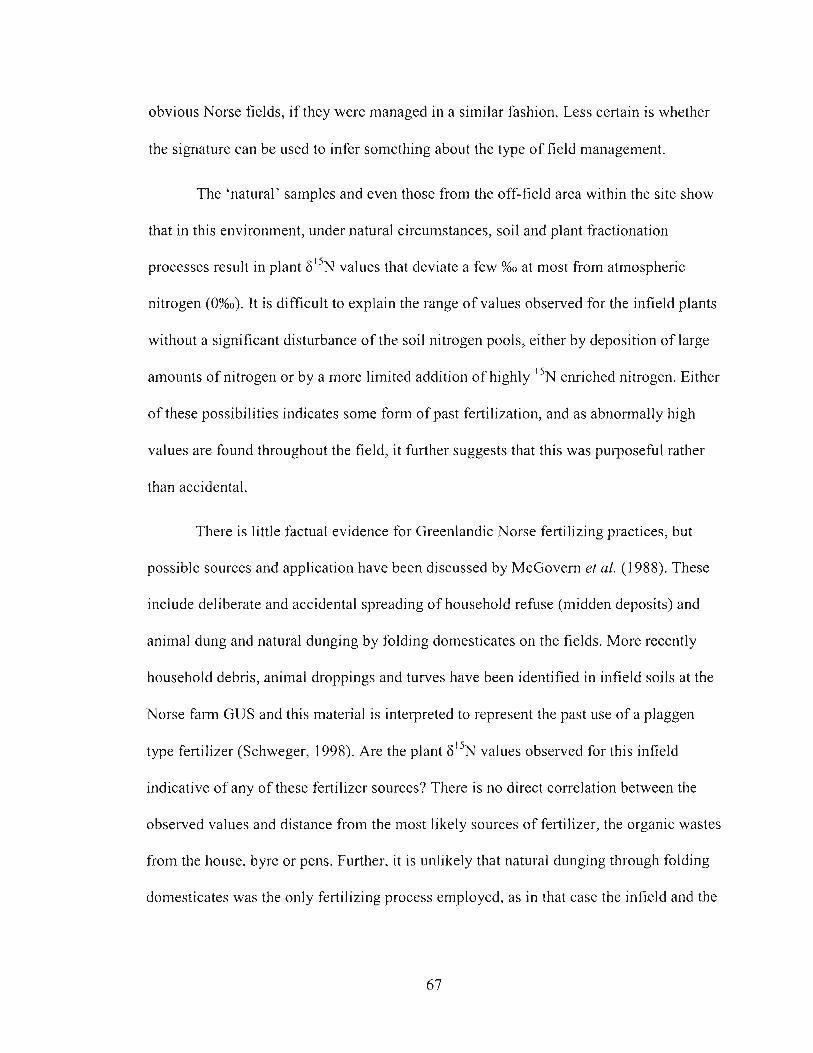
obvious Norse fields, if they were managed in a similar fashion. Less certain is whether
the signature can be used to infer something about the type of field management.
The 'natural' samples and even those from the off-field area within the site show
that in this environment, under natural circumstances, soil and plant fractionation
processes result in plant 6I5N values that deviate a few %O at most from atmospheric
nitrogen (O%O). It is difficult to explain the range of values observed for the infield plants
without a significant disturbance of the soil nitrogen pools, either by deposition of large
amounts of nitrogen or by a more limited addition of highly I5N enriched nitrogen. Either
of these possibilities indicates some form of past fertilization, and as abnormally high
values are found throughout the field, it further suggests that this was puiposeful rather
than accidental.
There is little factual evidence for Greenlandic Norse fertilizing practices, but
possible sources and application have been discussed by McGovern el ul. (1 988). These
include deliberate and accidental spreading of household refuse (midden deposits) and
animal dung and natural dunging by folding domesticates on the fields. More recently
household debris, animal droppings and turves have been identified in infield soils at the
Norse farm GUS and this material is interpreted to represent the past use of a plaggen
type fertilizer (Schweger, 1998). Are the plant 6 1 5 ~ values observed for this infield
indicative of any of these fertilizer sources? There is no direct correlation between the
observed values and distance from the most likely sources of fertilizer, the organic wastes
from the house, byre or pens. Further, it is unlikely that natural dunging through folding
domesticates was the only fertilizing process employed, as in that case the infield and the
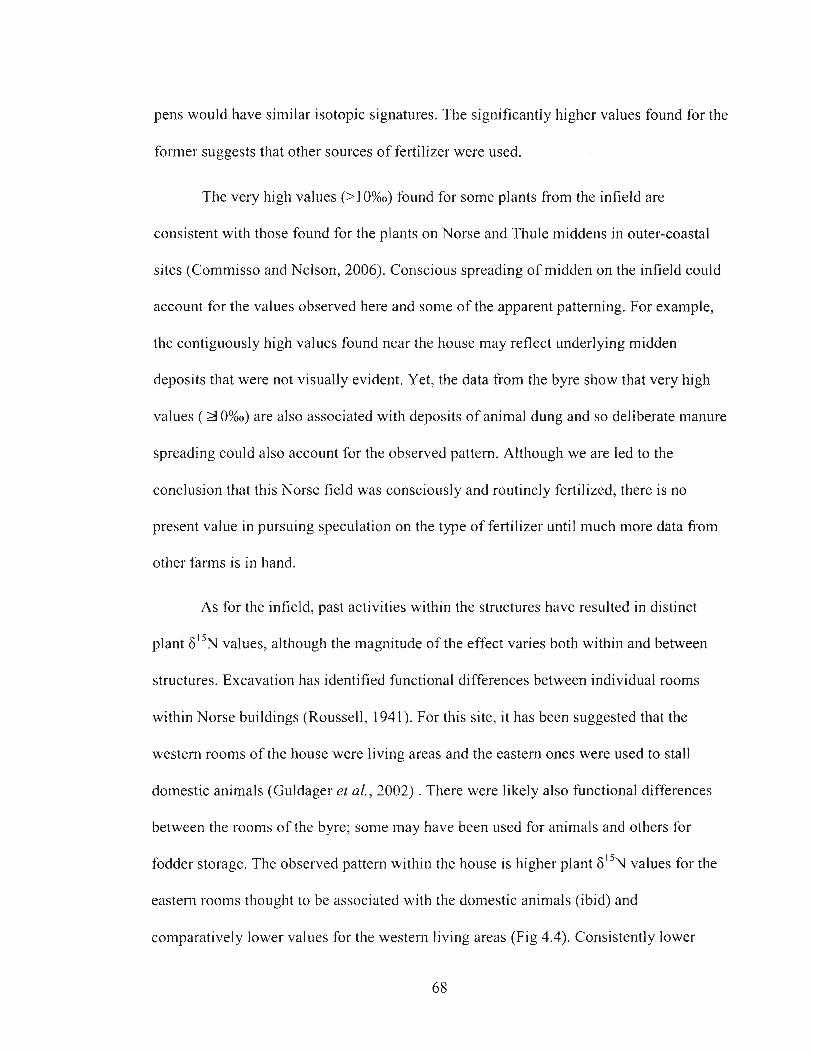
pens would have similar isotopic signatures. The significantly higher values found for the
former suggests that other sources of fertilizer were used.
The very high values (>I O%O) found for some plants from the infield are
consistent with those found for the plants on Norse and Thule middens in outer-coastal
sites (Commisso and Nelson, 2006). Conscious spreading of midden on the infield could
account for the values observed here and some of the apparent patterning. For example,
the contiguously high values found near the house may reflect underlying midden
deposits that were not visually evident. Yet, the data from the byre show that very high
values ( Y O%O) are also associated with deposits of animal dung and so deliberate manure
spreading could also account for the observed pattern. Although we are led to the
conclusion that this Norse field was consciously and routinely fertilized, there is no
present value in pursuing speculation on the type of fertilizer until much more data from
other farms is in hand.
As for the infield, past activities within the structures have resulted in distinct
plant 6 1 5 ~ values, although the magnitude of the effect varies both within and between
structures. Excavation has identified functional differences between individual rooms
within Norse buildings (Roussell, 1941). For this site, it has been suggested that the
western rooms of the house were living areas and the eastern ones were used to stall
domestic animals (Guldager et al., 2002) . There were likely also functional differences
between the rooms of the byre; some may have been used for animals and others for
fodder storage. The observed pattern within the house is higher plant F ' ~ N values for the
eastern rooms thought to be associated with the domestic animals (ibid) and
comparatively lower values for the western living areas (Fig 4.4). Consistently lower
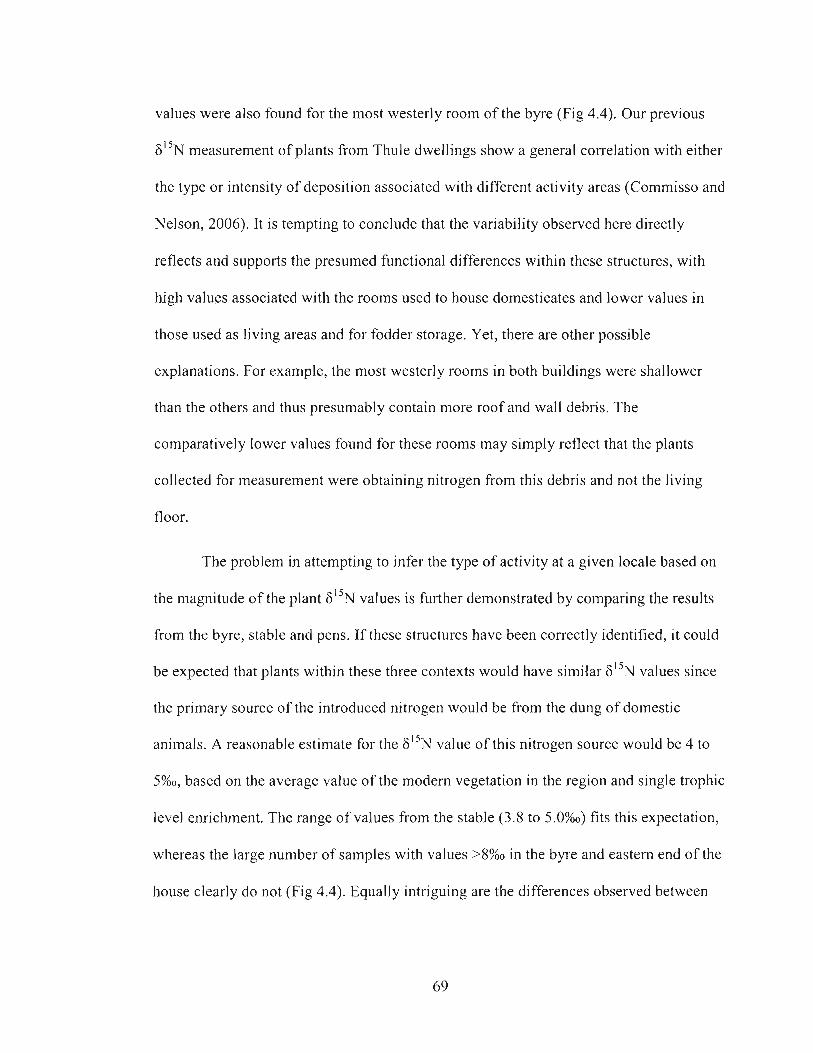
values were also found for the most westerly room of the byre (Fig 4.4). Our previous
measurement of plants fi-om Thule dwellings show a general correlation with either
the type or intensity of deposition associated with different activity areas (Commisso and
Nelson, 2006). It is tempting to conclude that the variability observed here directly
reflects and supports the presumed functional differences within these structures, with
h g h values associated with the rooms used to house domesticates and lower values in
those used as living areas and for fodder storage. Yet, there are other possible
explanations. For example, the most westerly rooms in both buildings were shallower
than the others and thus presumably contain more roof and wall debris. The
comparatively lower values found for these rooms may simply reflect that the plants
collected for measurement were obtaining nitrogen from this debris and not the living
floor.
The problem in attempting to infer the type of activity at a given locale based on
the magnitude of the plant 6 1 5 ~ values is further demonstrated by comparing the results
from the byre, stable and pens. If these structures have been correctly identified, it could
be expected that plants within these three contexts would have similar 6I5N values since
the primary source of the introduced nitrogen would be from the dung of domestic
animals. A reasonable estimate for the 6I5N value of this nitrogen source would be 4 to
5%0, based on the average value of the modern vegetation in the region and single trophic
level enrichment. The range of values from the stable (3.5 to 5.0%0) fits this expectation,
whereas the large number of samples with values >8%0 in the byre and eastern end of the
house clearly do not (Fig 4.4). Equally intriguing are the differences observed between
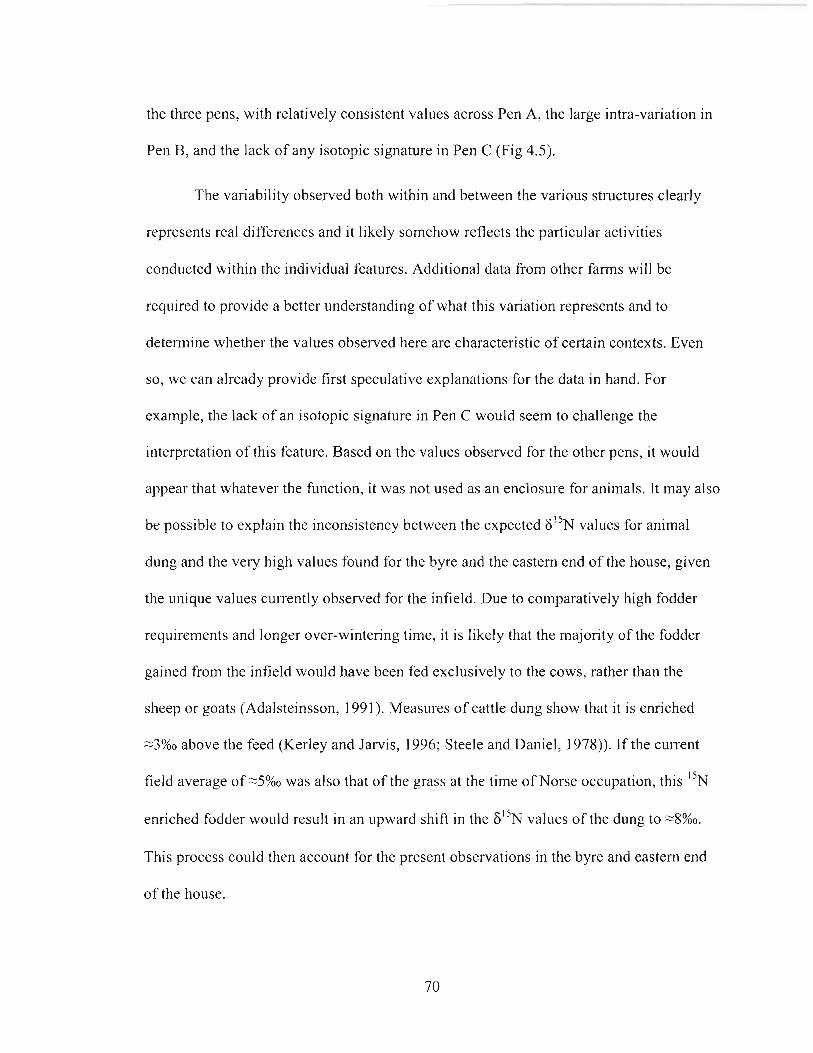
the three pens, with relatively consistent values across Pen A, the large intra-variation in
Pen B, and the lack of any isotopic signature in Pen C (Fig 4.5).
The variability observed both within and between the various structures clearly
represents real differences and it likely somehow reflects the particular activities
conducted within the individual features. Additional data from other farms will be
required to provide a better understanding of what this variation represents and to
determine whether the values observed here are characteristic of certain contexts. Even
so, we can already provide first speculative explanations for the data in hand. For
example, the lack of an isotopic signature in Pen C would seem to challenge the
interpretation of this feature. Based on the values observed for the other pens, it would
appear that whatever the function, it was not used as an enclosure for animals. It may also
be possible to explain the inconsistency between the expected 6 1 5 ~ values for animal
dung and the very high values found for the byre and the eastern end of the house, given
the unique values currently observed for the infield. Due to comparatively high fodder
requirements and longer over-wintering time, it is likely that the majority of the fodder
gained from the infield would have been fed exclusively to the cows, rather than the
sheep or goats (Adalsteinsson, 1991). Measures of cattle dung show that it is enriched
-3%0 above the feed (Kerley and Jarvis, 1996; Steele and Daniel, 1978)). If the current
field average of -5%0 was also that of the grass at the time of Norse occupation, this ' 5 ~
enriched fodder would result in an upward shift in the F ' ~ N values of the dung to ~ 8 % 0 .
This process could then account for the present observations in the byre and eastern end
of the house.
Elevated field plant values in the past could have broader implications.
Recent isotopic dietary studies of some prehistoric agrarian communities have found
elevated human F"N values that are seemingly at odds with the associated faunal data
and the entirely terrestrial carbon isotope signals (Muldner and Richards, 2005;
Thompson et al., 2005). The usual explanation for these discrepancies is the inclusion of
fresh water fish in the diet. Given the results of this study, we cautiously propose that
isotopic dietary studies of past agrarian human populations should include considerations
of a food chain enriched in ' 5 ~ at its base.
With very few exceptions, the values obtained for the plants collected in 2'005 are
different than those from 2003 in each of the contexts where replicate samples were
collected. These differences ranged from small deviations of O .~%O (within measurement
variability) to extremely large differences of 10.6%0. For the replicate samples for the
byre and house, the specimens from 2005 tended to be 1 5 ~ enriched as compared to the
2003 samples from these same locations. On the infield this same pattern was not found,
as the 2005 samples had both higher and lower values than those from 2003. A much
more detailed and controlled analysis is required to determine what these year-to-year
differences represent. Slight deviation from previous sampling location may be the cause.
In our earlier study, we found metre-scale differences between samples (Commisso and
Nelson, 2006) and the year-to-year variation observed here may indicate that large
differences may be found at even smaller distances. Are the slightly higher values within
the byre and house an indication of the better growing conditions for this year? What the
current data do indicate is that even though the details may vary greatly, the overall
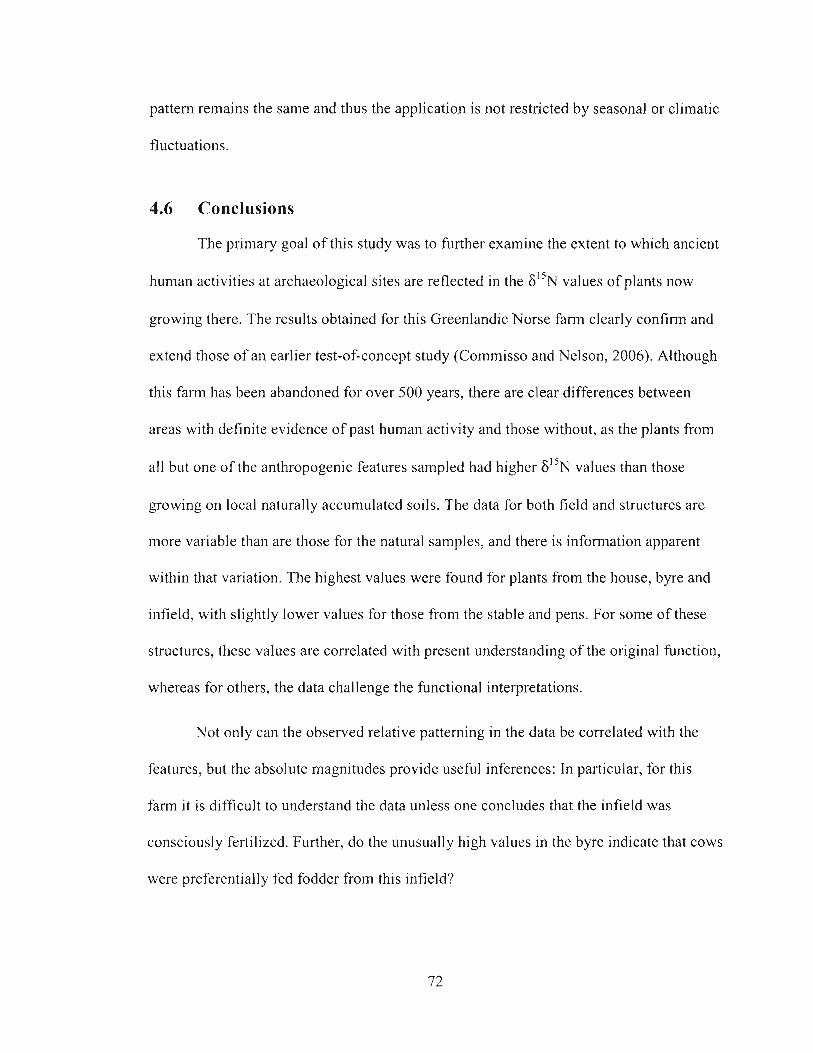
pattern remains the same and thus the application is not restricted by seasonal or climatic
fluctuations.
4.6 Conclusions
The primary goal of this study was to further examine the extent to which ancient
human activities at archaeological sites are reflected in the 6 " ~ values of plants now
growing there. The results obtained for this Greenlandic Norse farm clearly confirm and
extend those of an earlier test-of-concept study (Commisso and Nelson, 2006). Although
this farm has been abandoned for over 500 years, there are clear differences between
areas with definite evidence of past human activity and those without, as the plants from
all but one of the anthropogenic features sampled had higher 6 " ~ values than those
growing on local naturally accumulated soils. The data for both field and structures are
more variable than are those for the natural samples, and there is information apparent
within that variation. The highest values were found for plants from the house, byre and
infield, with slightly lower values for those from the stable and pens. For some of these
structures, these values are correlated with present understanding of the original function,
whereas for others, the data challenge the functional interpretations.
Not only can the observed relative patterning in the data be correlated with the
features, but the absolute magnitudes provide useful inferences: In particular, for this
farm it is difficult to understand the data unless one concludes that the infield was
consciously fertilized. Further, do the unusually high values in the byre indicate that cows
were preferentially fed fodder from this infield?
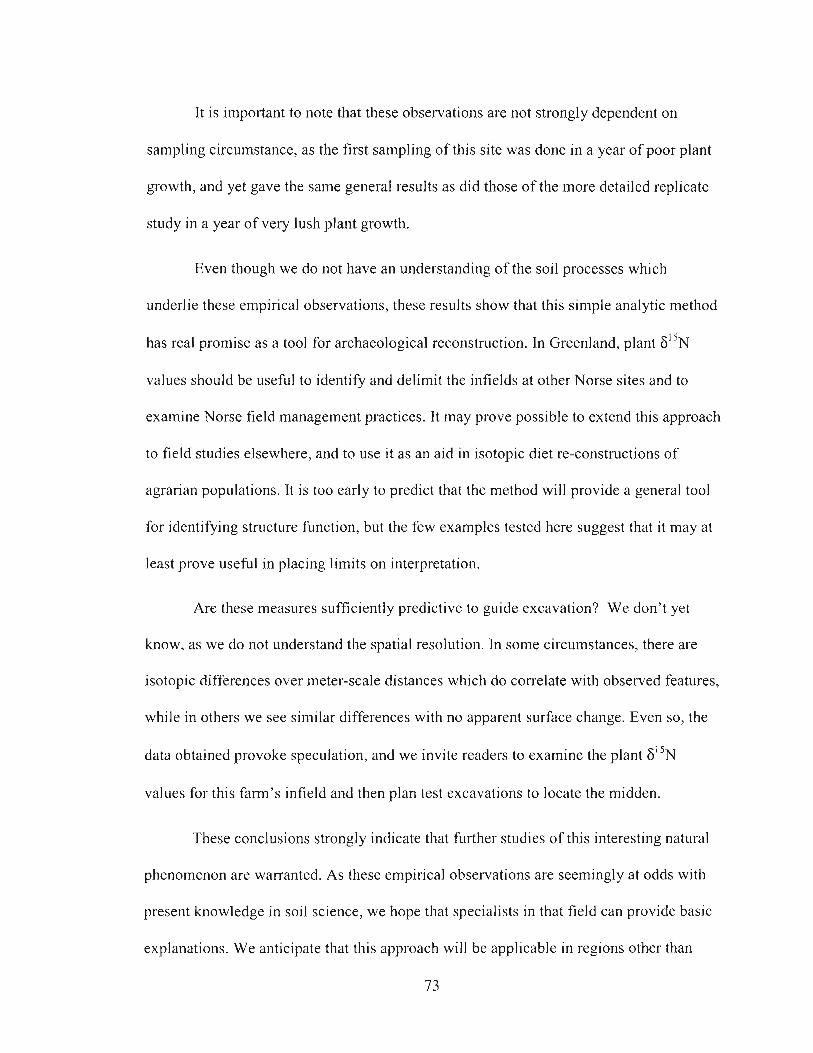
It is important to note that these observations are not strongly dependent on
sampling circumstance, as the first sampling of this site was done in a year of poor plant
growth, and yet gave the same general results as did those of the more detailed replicate
study in a year of very lush plant growth.
Even though we do not have an understanding of the soil processes which
underlie these empirical observations, these results show that this simple analytic method
has real promise as a tool for archaeological reconstruction. In Greenland, plant 8 1 5 ~
values should be useful to identify and delimit the infields at other Norse sites and to
examine Norse field management practices. It may prove possible to extend this approach
to field studies elsewhere, and to use it as an aid in isotopic diet re-constructions of
agrarian populations. It is too early to predict that the method will provide a general tool
for identifying structure function, but the few examples tested here suggest that it may at
least prove useful in placing limits on interpretation.
Are these measures sufficiently predictive to guide excavation? We don't yet
know, as we do not understand the spatial resolution. In some circumstances, there are
isotopic differences over meter-scale distances which do correlate with observed features,
while in others we see similar differences with no apparent surface change. Even so, the
data obtained provoke speculation, and we invite readers to examine the plant S I 5 ~
values for this farm's infield and then plan test excavations to locate the midden.
These conclusions strongly indicate that further studies of this interesting natural
phenomenon are warranted. As these empirical observations are seemingly at odds with
present knowledge in soil science, we hope that specialists in that field can provide basic
explanations. We anticipate that this approach will be applicable in regions other than
7 3

Greenland, but we will continue exploring and using it on Greenlandic Norse farms
where it seems to have immediate application.
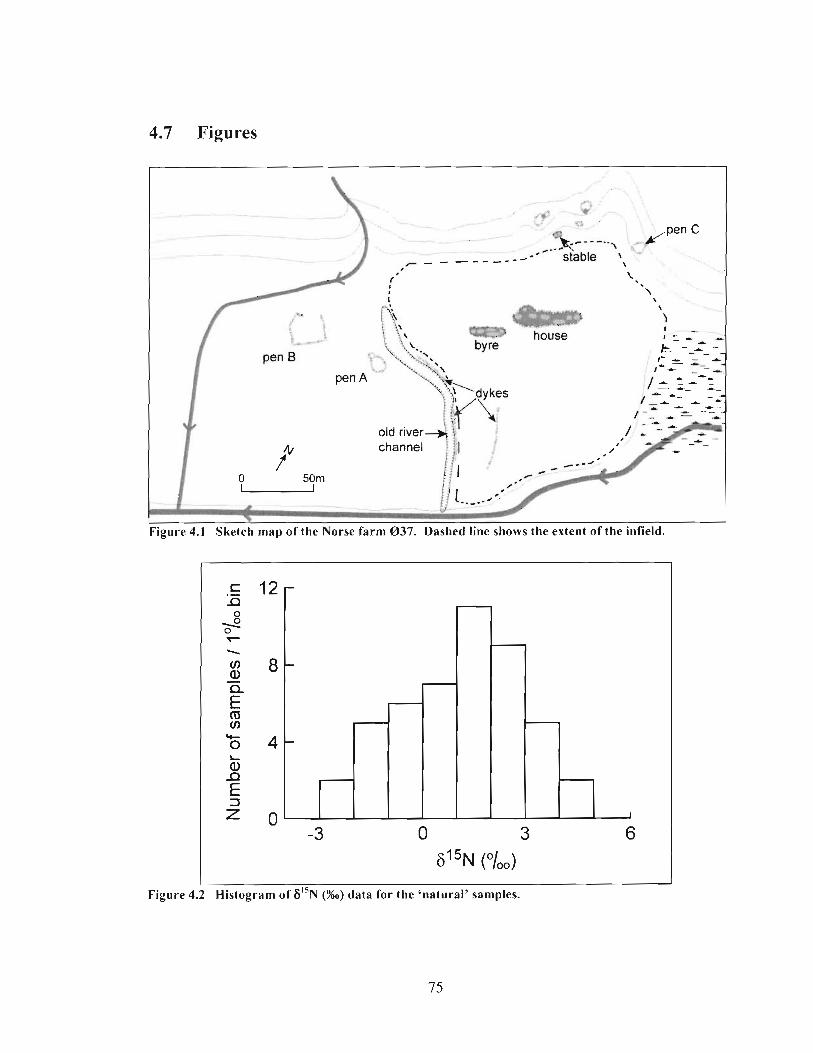
4.7 Fi, ou res
. , . e /Pen C ,.-.!!------,
- - - - - stable \, ' 8
f '., \
I \
t";;, - \
$
house I - I : - - * k --A_-
I ' c - * :-- * pen A d -A 1 2 z: z-
i - -- - I - * 4. + * & & -
/ - - * -- --A
V * I I
I / 0 50m
i - - M
igure 4.1 Sketch map of the Norse farm 037. Dashed line shows the extent of the infield.
Figure 4.2 Histogram of 6 ' 5 ~ (%a) data for the 'natural' samples.
Figure 4.3 sketchmaps showing the sarnp l~ locat~ns (filled black ci&es) for the infield and 'off- field' area for both sampling years (2003 and 2005). Numbers give the 6'" values (%o) for each sample.
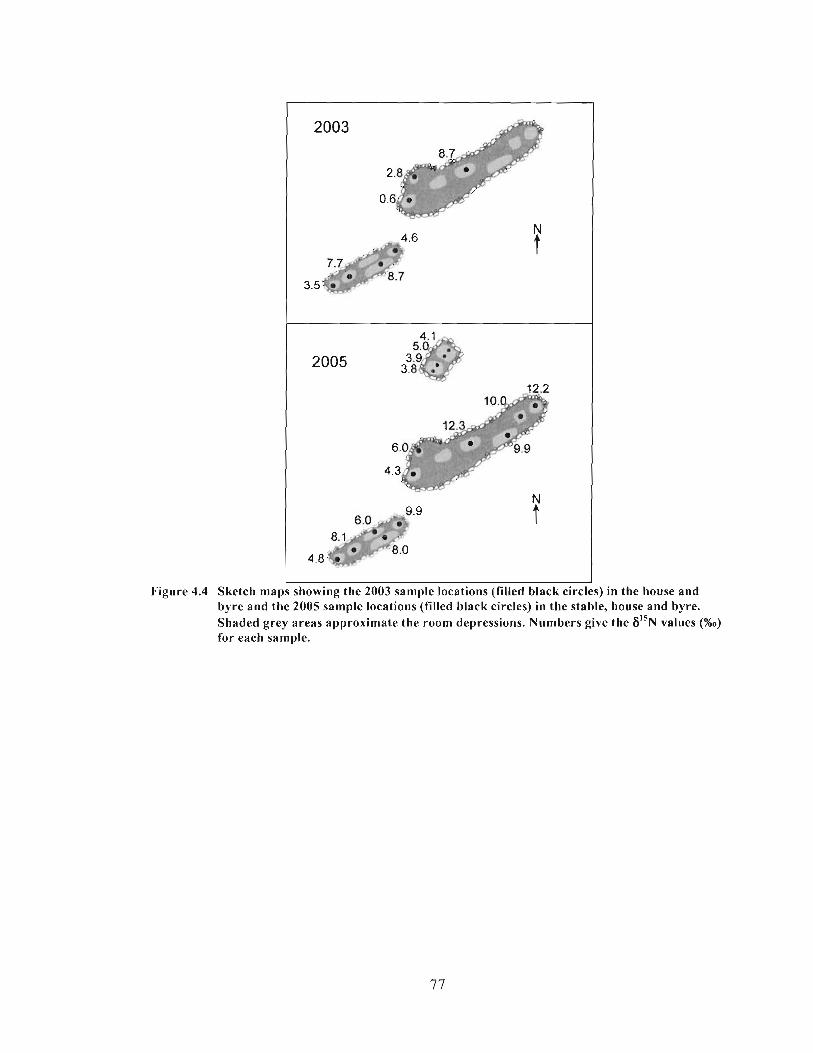
I Figure 4.4 Sketch maps showing the 2003 sample locations (filled black circles) in the house and
byre and the 2005 sample locations (filled black circles) in the stable, house and byre. Shaded grey areas approximate the room depressions. Numbers give the 6'" values (%a)
for each sample.
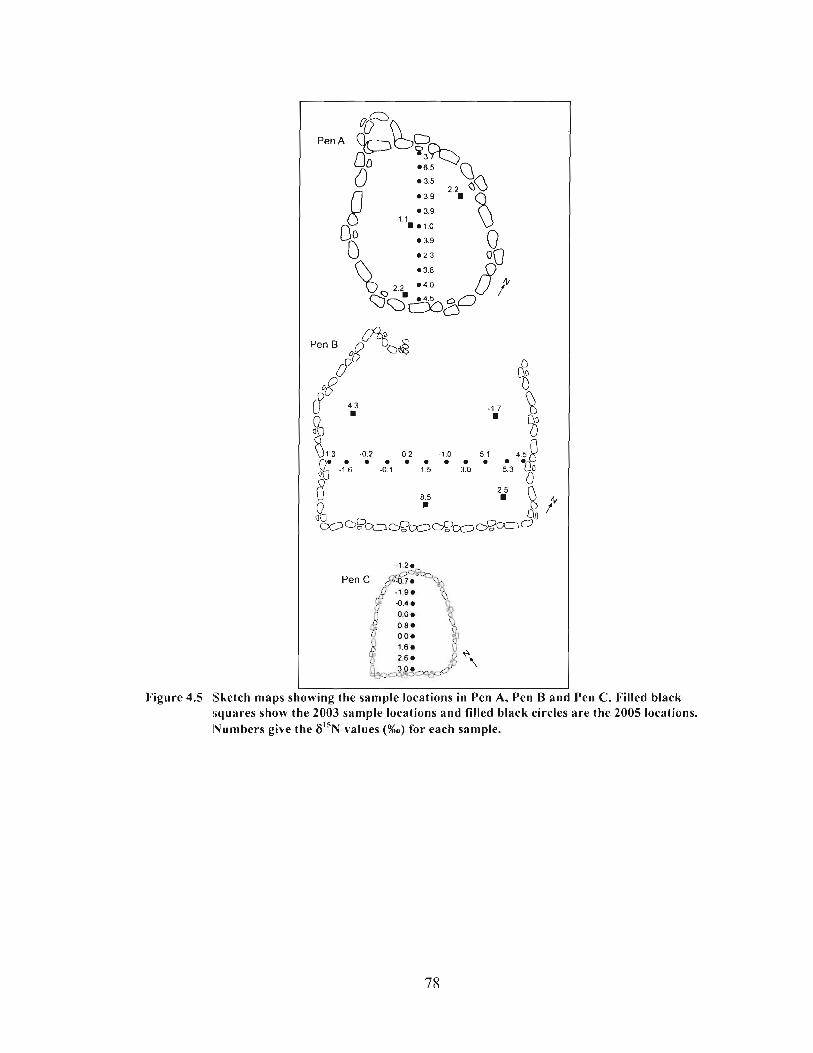
Figure 4.5
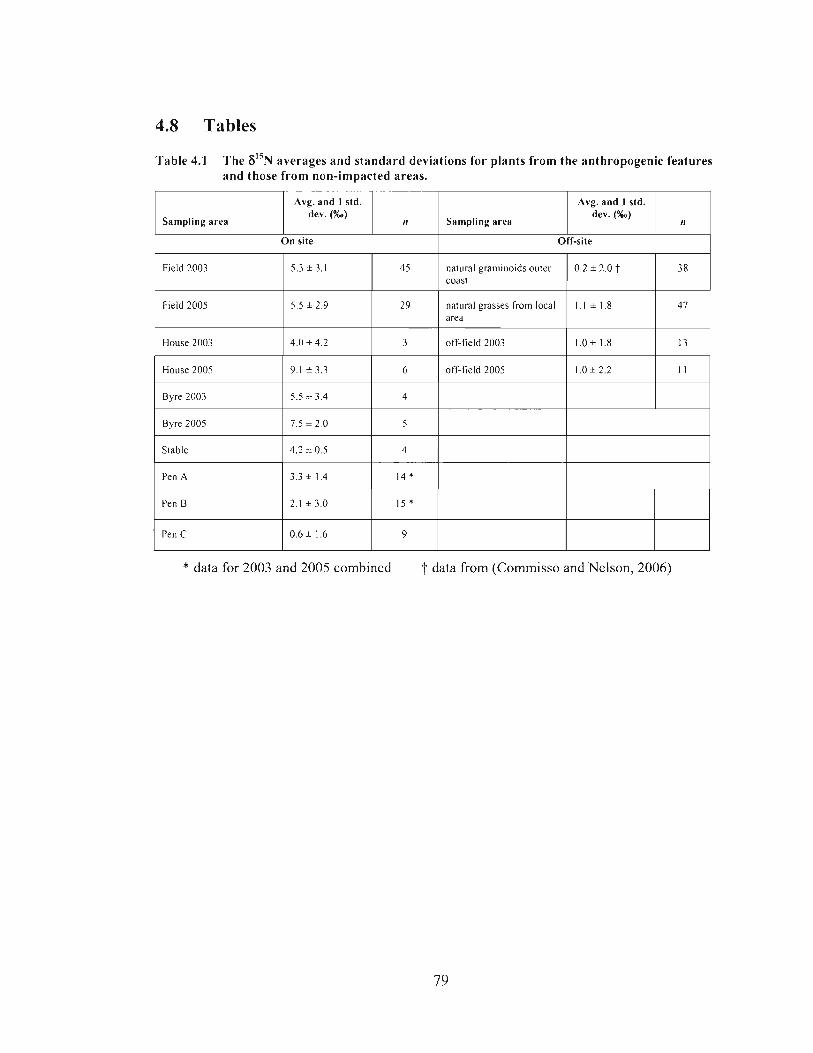
4.8 Tables
Table 4.1 The 6'" averages and standard deviations for plants from the anthropogenic features and those from non-impacted areas.
I Sampling area
Avg. and 1 std.
I On site I Off-site I
Avg. and 1 std.
F~eld 2003 5.3 * 3.1 4 5 natural grarn~no~ds outer 0.2 * 2.0 f coast
1 Field 2005 natural grasses from local 1.1 * 1.8 29 1 area
* data for 2003 and 2005 combined t data from (Commisso and Nelson, 2006)
House 2003 4.0 * 4.2 3 off-field 2003 I .O * 1.8
House 2005
Byre 2003
Byre 2005
Stable
Pen A
Pen B
Pen C
9.1 +3 .3
5.5 * 3.4
7.5 * 2.0
4.2 * 0.5
3.3 * 1.4
2.1 * 3.0
0.6 * 1.6
6
4
5
4
14 *
15 *
9
off-lield 2005 1 .O i 2.2 I I
4.9 Reference List
Adalsteinsson,S., 1991. Importance of sheep in early Icelandic agriculture. Acta Archaeologica. 61,285-29 1.
Albrethsen,S.E., Keller,C., 1986. The use of the saeter in medieval Norse farming in Greenland. Arctic Anthropology. 23, 91-1 07.
Amorosi,T., Buckland,P., Edwards,K.J., MainlandJ., McGovern,T.H., Sadler,J.P., Skidmore,P., 1998. They did not live by grass alone: the politics and paleoecology of animal fodder in the North Atlantic region. Environmental Archaeology. 1,41- 54.
Amundson,R., Austin,A.T., Schuur,E.A.G., Yoo,K., Matzek,V., Kendall,C., Uebersax,A., Brenner,D., Baisden,W.T., 2003. Global patterns of the isotopic composition of soil and plant nitrogen. Global Biogeochem.Cycles. 17.
Andreasen,C., 198 1. Langhus-ganghus-centraliseret gard. Nogle betragtninger over de norrone gardtyper. Hikuin. 7, 179- 1 84.
Barlow,L.K., Sadler,J.P., Ogilvie,A.E.J., Buckland,P.C., Amorosi,T., Ingimundarson,J.H., Skidmore,P., Dugrnore,A.J., McGovern,T.H., 1997. Interdisciplinary investigation of the end of the Norse Western Settlement in Greenland. The Holocene. 7.
Buckland,P.C., Amorosi,T., Barlow,L.K., Dugmore,A.J., Mayewski,P.A., McGovern,T.H., Ogilvie,A.E.J., Sadler,J.P., Skidmore,P., 1996. Bioarchaeological and climatological evidence for the fate of Norse farmers in medieval Greenland. Antiquity. 70, 88-96.
Commisso,R.G., Nelson,D.E., 2006. Modem plant 61 5N values reflect ancient human activity. Journal of Archaeological Science. 33, I 167-1 176.
Guldager,O., Hansen,S.S., Gleie,S., 2002. Medieval Farmsteads in Greenland: The Brattahild region 1999-2000., Danish Polar Centre, Copenhagen.
Handley,L.L., Raven,J.A., 1992. The use of natural abundance of nitrogen isotopes in plant physiology and ecology. Plant, Cell and Environment. 15,965-985.
Hobbie,E.A., Macko,S.A., Williams,M., 2000. Correlations between foliar 6 ' j ~ and nitrogen concentrations may indicate plant-mycorrhizal interactions. Oecologia. 273-283.
Hogberg,P., I 997. ''N natural abundance in soil-plant systems. New Phytol. 137, 179- 203.
Kerley,S.J., Jarvis,S.C., 1996. Preliminary studies of the impact of excreted N on cycling and uptake of N in pasture systems using natural abundance stable isotopic discrimination. Plant Soil. 178, 287-294.
Krogh,K.J., 1982. Erik den Rodes Grmland., Nationalmuseets, Copenhagen.
McGovern,T.H., Bigelow,G., Arnold,T., Russell ,D., I 988. Northern islands, human en-or, and environmental degradation: A view of social and ecological change in the Medieval North Atlantic. Human Ecology. 16, 225-270.
McGovern,T.H., 1992, Bones, buildings and boundaries: Paleoeconomic approaches to Norse Greenland in: Christopher D. Morris, D. James Rackham (Eds.), Norse and later settlement and subsistence in the North Atlantic, Department of Archaeology, University of Glasgow, Glasgow, pp. 193-230.
McGovern,T.H., 1985. Contributions to the paeleoeconomy of Norse Greenland. A,cta Archaeologica. 54, 73- 122.
Michelsen,A., Quarmby,C., Sleep,D., Jonasson,S., 1 998. Vascular plant ' 5 ~ natural abundance in heath and forest tundra ecosystems is closely correlated with presence and type of mycorrhizal fungi in roots. Oecologia. 1 15, 406-41 8.
Muldner,G., Richards,M.P., 2005. Fast or feast: reconstructing diet in later medieval England by stable isotope analysis. Journal of Archaeological Science. 32, 39-48.
Nadelhoffer,K., Shaver,G., Fry,B., Giblin,A., Johnson,L., McKane,R., 1996. "N natural abundances and N use by tundra plants. Oecologia. 107,386-394.
Roussell,A., 1941. Farms and Churches in Medieval Norse Settlements in Greenland. Meddelelser om Gronland. 86.
Schulze,E.D., II1,F. S., Gebauer,G., 1 994. Nitrogen nutrition and isotope differences among life forms at the northern treeline of Alaska. Oecologia. 406-41 2.
Schweger,C.E., 1998, Geoarchaeology of the GUS site: A preliminary framework in: Arneborg J., Gullarv H.C. (Eds.), Man, Culture and Environment in Ancient Greenland, Danish Polar Centre and Danish National Museum, Copenhagen, pp. 14-18.
Steele,K.W., Daniel,R.M., 1978. Fractionation of nitrogen isotopes by animals: a further complication to the use of variation in the natural abundance of "N for tracer studies. Journal of Agricultural Science. 90, 7-9.
Thompson,A.H., Richards,M.P., Shortland,A., Zakrzewski,S.R., 2005. Isotopic palaeodiet studies of Ancient Egyptian fauna and humans. Journal of Archaeological Science. 32,45 1-463.
Welker,J.M., Jonsdottir,I.S., Fahnestock,J.T., 2003. Leaf isotopic (delta C-13 and delta N-I 5) and nitrogen contents of Carex plants along the Eurasian Coastal Arctic: results from the Northeast Passage expedition. Polar Biol. 27, 29-37.
CHAPTER 5 CORRELATION BETWEEN MODERN PLANT 6 1 5 ~ VALUES AND ACTIVITY AREAS OF MEDIEVAL NORSE FARMS^
5.1 Abstract
This further nitrogen isotopic study of Greenlandic Norse archaeological sites
provides new evidence of the affect of past human activity on modem plant 6 " ~ values.
Grass samples were taken from a number of spatially-defined features at four Norse
farms and one site interpreted to be a seasonally occupied herding station (szter). At the
farms, un-naturally high plant 6 1 5 ~ values were found for each sampled feature,
including those from the likely infields and a churchyard. At the szter no strong isotopic
effect was expected and none was found. Comparing the data from the farms we found
that the average plant 6 1 5 ~ values were similar for features that were functionally alike.
We conclude from these observations, that the unusually high plant 6 1 5 ~ values reflect
the strong conservation of the isotopic composition of the nitrogenous materials
deposited in the past, and the magnitude of the values reflects the amount of this material
admixed in the soil. The results confirm previous exploratory studies of this isotopic
effect and further demonstrate its potential value as an archaeological tool.
5.2 Introduction
We have recently shown that past human activity has left an isotopic signature in
the plants now growing on Greenlandjc archaeological sites. In two studies- the first a
- - -
"he following chapter has been published in the Jo~irnal of Archaeological Science ( in press, 2007) (doi: 10.101 6/j.jas.2007.05.012) under the co-authorship of R.G. Commisso and D.E. Nelson.
test-of-concept study at a Thule-culture settlement and an outer-coast Norse farmstead
(Commisso and Nelson, 2006), and the second, a detailed study of an inland Norse farm
(Commisso and Nelson, 2007)- the 6 " ~ values of plants now growing on anthropogenic
features were markedly higher than those of the plants from the surrounding natural
terrain. These elevated values on the Norse sites clearly show that this isotopic signature
is present for sites at least 500 years old. Even though we have only begun to study this
natural phenomenon, it is already evident that there are practical applications in
archaeology and perhaps in other disciplines.
An intriguing result at each of the sites studied was the variation observed in the
plant 6I5N values. Large differences were found between different activity areas and at
each, the 8 ' ' ~ values of the modern plants were generally consistent with those of the
various nitrogen-containing materials that were likely deposited at the respective locales
in the past (Commisso and Nelson, 2006, 2007). These observations suggest that the
isotopic composition of the deposited nitrogen has been strongly conserved in the
soillplant system and continues to be the primary influence on the 6 1 5 ~ values of the
plants now growing there. Even so, this simple conclusion may be premature, as
providing explanations for plant 6I5N values is complicated: not only the isotopic
composition of the N source, but the form of N taken up by the plant (i.e. as NH4 and
NO3), the depth from which the N is obtained, and fractionation processes which alter
local soil N pools can all affect plant 6'" values (Handley and Raven, 1992; Hogberg,
1997). Thus, it yet remains uncertain whether it is the isotopic signatures of the ancient
deposits or one or more of these other mechanisms which have produced the unusual
plant 6 1 5 ~ values observed within the archaeological sites.
The purpose of this present study was to continue to explore empirically the
phenomenon by obtaining plants from other Norse farms in southwest Greenland.
Specifically, we wanted
to investigate whether the effect would be observed at all sites studied
to explore the variability of plant 6 ' ' ~ within specific contexts. Would we
continue to see large differences i n the plant 6I5N values for different activity
areas? Moreover, would the magnitude of the plant F"N values for a particular
structure be the same from farm to farm?
to attempt first explanations for the mechanisms most likely underlying the
source of the plant 6I5N values in these archaeological sites.
5.3 Background
5.3.1 Norse Settlement
The Norse founded two settlements in western Greenland at the end of the tenth
century AD, the so-called Eastern and Western Settlements, which were respectively
abandoned in the late 14th and mid 15th centuries AD (Ameborg, 2004). These pastoral
settlements consisted of individual farmsteads situated in relatively warm regions along
the inner fjords and in the valleys. Climatic conditions prevented cereal crop production
(McGovern et al., 1988), but off-farm rangeland and fodder produced on the infield at the
farm were sufficient to maintain livestock, including cattle, sheep and goats (Albrethsen
and Keller, 1986). Farms are generally located at elevations below 200m a.s.l., but
several small ruin groups have been identified at elevations of 200 to 400m a.s.1.. These
ruins are interpreted to be 'saeters', or upland stations at some distance from the
farmstead to which the livestock could be moved in the summer (ibid). This seasonal re-
84
location of the livestock would both keep the animals away from the hay-producing
infield in the summer and make use of the upland vegetation. Winter supplies such as
preserved milk or meat products and possibly additional winter fodder may also have
been produced at these szeters (ibid). None of the Greenlandic ruin groups identified as
szters have been excavated and this functional designation is based on analogous
examples from Iceland and Norway. This interpretation is likely correct, as the location
and form of many of these upland ruin groups are similar to the known foreign examples.
As saeters can include dwellings, byres, barns, stables and pens, it can be difficult to
distinguish between these seasonally-occupied sites and small independent farms or
tenant farms located at higher elevations (Bruun, 1928).
5.3.2 Nitrogen isotope ratios in plants
Plant F"N values have been studied extensively. While the data show that plant
6 1 5 ~ values vary globally, the variation is relatively small within a given region (Handley
et al., 1999). For example, at high northern latitudes, plant F ' ~ N values are typically low
with values close to that of atmospheric nitrogen (O%O) (Michelsen et al., 1998;
Nadelhoffer et al., 1996; Schulze el al., 1994; Welker et al., 2003). Our measurements of
plants growing on naturally accumulated soils in southwest Greenland are consistent with
these findings. Grasses from natural areas on the outer coast had an average and standard
deviation of -O.3*2.0%0 (Commisso and Nelson, 2006), and those from an inner fjord
region had only slightly higher values with an average and standard deviation of
1.1*1.8%0 (Commisso and Nelson, 2007). Both datasets included a few values as high as
5%0 or as low as -4%0, but most were in the range of -2 to 3%0.
There are a few circumstances in which plant 6 " ~ values fall well outside the
usual natural range. These have mostly been identified in ecological studies where, for
example, unnaturally high plant or soil 6 1 5 ~ values indicate the presence of rnarine-
derived N in terrestrial systems (for example, Erskine et al., 1998; Hawke et al., 1999;
Kameda et al., 2006; Liu et al., 2004; Wainwright et al., 1998 ). Marine nitrogen, and
particularly that derived from high trophic level animals, is highly "N enriched as
compared to that in terrestrial soils (Kelly, 2000). Accordingly, unusually high 6 " ~
values are found for plants and soils where marine N is incorporated into the terrestrial
system. Marine bird and mammal breeding and nesting sites are typical examples.
In our first test-of-concept study (Commisso and Nelson, 2006), we found a
similar outcome in archaeological sites. Very high 6 1 5 ~ values (>10%0) were observed for
plants growing on Thule and Norse middens containing large numbers of seal bones. It is
noteworthy that an archaeological context is very different from those of the seabird and
marine mammal sites, in that the impact of human activities can be very localized, the
intensity of the impact can vary greatly across a site, and a variety of N sources with very
different values may have been deposited at different locales within the site.
The variability of anthropogenic N deposition is reflected in the isotopic data we
obtained in our second study, a detailed examination of the Greenlandic Norse farm 037
(Commisso and Nelson, 2007). Several different features of this farm showed that the
6 1 5 ~ values of the grass specimens collected from each are not only distinct from the
values of plants fkom natural settings, but that the magnitude of the values also differed
between features. Average values of -8%o were found for grasses growing in a cattle
byre, 4%0 for those from a stable, and 3 and 2%0 for the samples from two stone built
pens. Above-natural values (averaging 5.5%0) were also found for the grasses from this
farm's well-defined infield, a result which can only be explained by some form of
fertilization of the field in the past.
5.4 The present study
A primary objective here was to investigate whether the isotopic variation found
at 0 3 7 was simply a fortuitous observation, or whether the same pattern would be present
at other Norse farms. Rather than conduct another detailed study of a single site, we
chose to sample a number of well-defined features at several Norse sites. To ensure the
data were comparable to that already obtained - by minimizing variables such as local
climatic factors- we chose sites near the previously studied farm of 037. As well,
specimen collection was limited to the few grass species previously collected. Sampling
focused on features for which we already had comparative data (middens, byres, stables,
pens), but we also obtained samples from a small churchyard in which humans had been
interred, and from a unusual, stone-built structure interpreted as a storage facility to
determine whether isotopic signatures are present in the grass growing on these features.
We also made first tests of the possibility of using the isotopic signature to
identify and delineate Norse infields. At 037, plants from the well-defined infield of this
farm had values that were distinct from those growing on an 'off-field' area only a
few metres away (Commisso and Nelson, 2007). If elevated plant 6'" values are
characteristic of Norse infields, then at sites where the infields are poorly defined there is
the potential to both identify and demarcate these important features.
We chose four farms and one site believed to be a sater for the study (Fig 5.1).
The majority are in the Qorlortup Valley, a long narrow valley extending between the
Tunugdliarfik and Nordre Sermilik fjords. Two of these sites, 0 3 5 and 036, are inland
farms located short distances east of 0 3 7 in the base of the valley. The third, 0 4 , is a
coastal farm west of 8 3 7 on the shores of the Nordre Sermilik fjord, and the fourth farm,
01 98, is another coastal farm further west on a headland that extends into the Nordre
Sermilik fjord. The site interpreted to be a sseter (ruin group 00-2) is located in an upland
region north of 0 4 at an elevation of 220m a.s.1. As 0 4 is the closest farm to this site, and
as there remains a well-worn trail connecting the two, it is likely these two sites were
associated.
5.5 Sampling and measurement methodology
On site, the above-ground portions of individual plants were collected at each
sampling location. The species selected were mostly Deschampiaflexuosa and Festuca
brachyphylla, the same grass species collected at 0 3 7 and in the natural locales in this
general area. Occasionally, neither grass was available at a sampling location and Poa
arctica was taken instead. At the present level of interpretation, we have found that there
are no significant differences in 6 ' 5 ~ values between these grasses that can be attributed
to a species effect (Commisso and Nelson, 2007), and as such, we treat all these grasses
as a sjngle group.
In the lab, we selected 5 to 9 basal leaves from each air-dried plant, cleaned them
with ultra-pure water, dried them again under vacuum and then ground them to a fine
powder in a ball mill. About 4mg of this powder were sealed jn an analytical tin capsule.
Stable nitrogen isotope measurements were made by CFIRMS (Europa Scientific 20-20)
8 8
at a commercial laboratory (Iso-analytical Limited, Sandbach, UK). To ensure quality
control, each analysis run included International standards (IA-ROO1 (wheat flour)
traceable to IAEA-N-I (ammonium sulphate)), IAEA-N-2 (ammonium sulphate)), a
calibrated laboratory grass sample (#2842, traceable to IAEA-N-I), and blind repeat
samples. The laboratory quotes an instrumental measurement precision of +0.2 %O (at one
standard deviation). This was verified by blind repeat measurements.
As in our previous studies, we estimate measurement error at about *0.5%0, as
discussed in (Commisso and Nelson, 2006, 2007). Again, we note that even a larger
measurement error would not affect the interpretations of this study.
5.6 Sample locations and results
A brief overview of the sites, the sample locations, and the results obtained
follows. Detailed descriptions of each site, of previous archaeological surveys, and of the
interpretations of individual ruins are given in (Guldager et al., 2002). As there have been
no detailed archaeological investigations of these sites, the interpreted function of
individual structures is based on construction method and form. Here, we use these
interpretations as a guide to assess the data obtained.
As in our previous study (Commisso and Nelson, 2007), all sampling sites, both
archaeological and natural, are in the current rangeland of sheep and horses. Thus, any
modern N inputs are equally represented on- and off-site and play no role in interpreting
the observed differences.
5.6.1 Natural grasses
The natural samples (n=47) described previously (Commisso and Nelson, 2007)
are equally applicable here, as the present sites are in the same study locale. As
mentioned, the F ' ~ N average and standard deviation for these was 1.1*1.8%0, with most
samples lying within the range -2 to 3%0. While a few samples had values as high as
=5%0, in none of the natural areas sampled did we observe contiguous values above 3%0.
In natural settings, values >3%0 appear to be rare and random occurrences.
5.6.2 The farm site 0 3 5
This Norse farm lies on gently sloping terrain at the base of the north slope of the
Qorlortup Itinnera valley. Nearby is a modem sheep farm. A field of the modem farm is
only a few metres south of the ruins and likely overlies the old Norse infield. Most of the
building ruins contain large amounts of roof and wall debris, but two features provided a
good sampling context: a stone-built pen with interior divisions, and a well-defined
churchyard.
The pen is located at the northeastern extent of the farm. Samples were taken at
I m intervals along a transect extended through the long axis of the structure.
The church ruin is typical of other small churches or chapels at some Norse farms.
The ruins of the church are roughly square and approximately 4m on a side. The structure
is centred in the churchyard, which is defined by a circular stone enclosure. Samples were
taken at 2m intervals on a transect extending across and beyond the southern portion of
the churchyard. The transect was within 50cm of an old excavation unit from which
human remains were recovered (Ameborg et al., 2001).
The data obtained for these features are given in Fig 5.2. In the churchyard, the
plants had relatively consistent values ranging from 3.2 to 4.3%0. These are higher than
those for the natural vegetation and for those samples collected immediately outside the
stone enclosure, which had values <2.5%0. There was more variability for the specimens
from the pen, which ranged fiom 1.8 to 5.5%0, with a general increase in the values from
northwest to southeast. No apparent differences were noted at the time of collection
which could be correlated with this pattern.
5.6.3 The farmsite 0 3 6
This site is also located at the base of the north slope of the Qorlortup Itinnera
valley. Here, the structures were built on top of several knolls. Below the farm, to the
south, are the Qorlortup River and an associated marsh. East, across a small stream, is a
stony alluvial fan with a large number of cobbles and boulders on the surface. There is no
obvious infield at this site, but the vegetation cover is relatively lush in the areas between
the structures and these may have formed at least a part of the infield.
Samples were collected from a byre, from the presumed infield, and from the
stony alluvial fan. In the byre, four specimens were taken from the lowest parts of the two
central rooms. These sample locations were deep enough to be on or near the floor of the
structure. Five more specimens were taken at 5m intervals along a transect that extended
from a point west of the dwelling out across what was presumed to be a portion of the
infield. The sample collected nearest the dwelling was from a very low mound which was
suspected to be a part of a midden deposit. The final area sampled was the stony alluvial
fan east of the farm. Here, five samples were taken at 5m intervals from a transect that
extended east-west across the front portion of the fan, where there were fewer surface
9 1
cobbles and boulders. Although this feature did not appear to have been used as infield,
we collected these samples to compare with those fiom the suspected infield.
Fig 5.3 gives the data obtained. High values ranging from 6.3 to 9.7%0 were found
for the samples from the two rooms of the byre. Above-natural values were also found for
the specimens taken from the transect northeast of the dwelling on the presumed infield.
The result for the sample nearest the building on the suspected midden deposits was
11.7%0, a value much higher than the others for this transect, which ranged from 3. I to
6.1 %a. It is likely that this specimen was indeed growing on midden deposits, and as such,
it cannot be considered as a test of an infield.
The specimens taken fiom the stony alluvial fan east of the farm had values fiom
-0.6 to 1.8%0. These all fall within the lower range of the natural specimens, and provide
a clear indication that that there has been no anthropogenic impact in this area.
5.6.4 The farmsite 0 4
This farm is situated on a high terrace along the Nordre Sermilik fjord at the
mouth of the Qorlortup Itinnera valley. This farm, in comparison to others in the area, is
unusual both in size and in some of the structures. It contains a number of well-defined,
well-preserved features that were sampled: a byre with attached barn, a large pen or fold,
midden deposits, a presumed storage facility, and the infield.
The byre and attached barn is a large, elongated structure with three rooms. Here,
there is little doubt about the building's primary function. The central room was
obviously the byre, as there remain standing stones that would have formed individual
stalls for the cattle. A transect was extended through the long axis of the structure directly
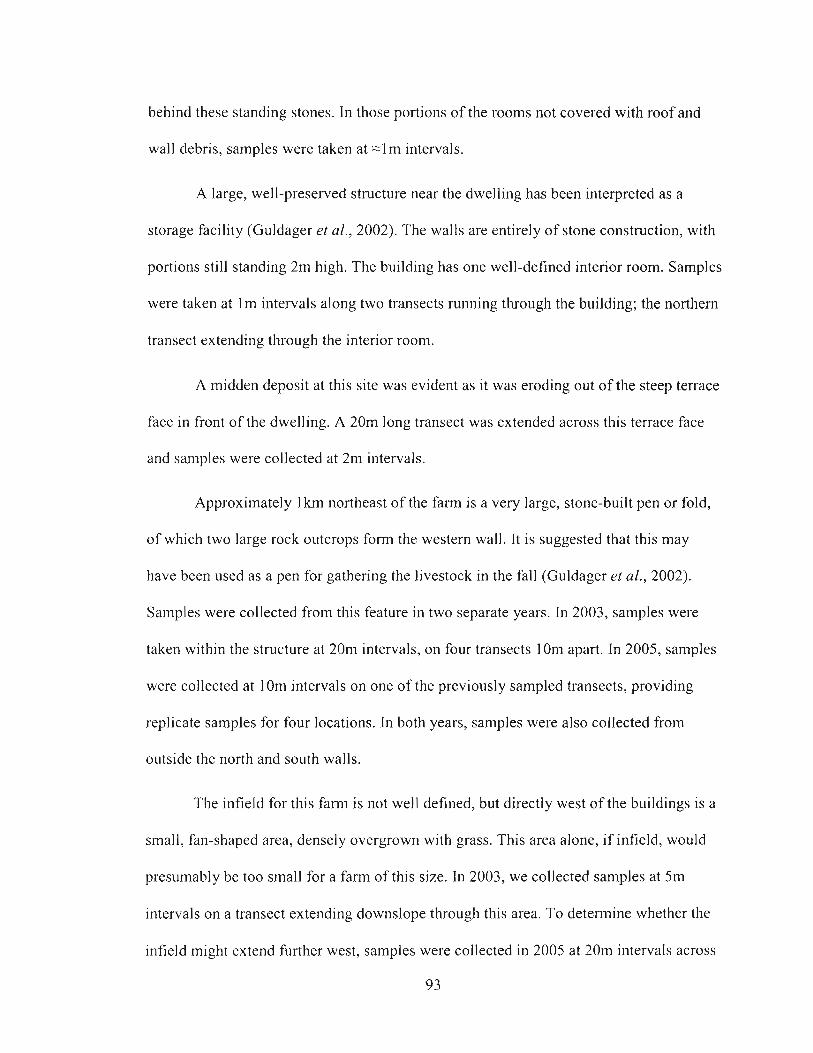
behind these standing stones. In those portions of the rooms not covered with roof and
wall debris, samples were taken at z l m intervals.
A large, well-preserved structure near the dwelling has been interpreted as a
storage facility (Guldager et al., 2002). The walls are entirely of stone construction, with
portions still standing 2m high. The building has one well-defined interior room. Samples
were taken at l m intervals along two transects running through the building; the northern
transect extending through the interior room.
A midden deposit at this site was evident as it was eroding out of the steep terrace
face in fiont of the dwelling. A 20m long transect was extended across this terrace face
and samples were collected at 2m intervals.
Approximately 1 krn northeast of the farm is a very large, stone-built pen or fold,
of which two large rock outcrops form the western wall. It is suggested that this may
have been used as a pen for gathering the livestock in the fall (Guldager el al., 2002).
Samples were collected from this feature in two separate years. In 2003, samples were
taken within the structure at 20m intervals, on four transects 1 Om apart. In 2005, samples
were collected at 1 Om intervals on one of the previously sampled transects, providing
replicate samples for four locations. In both years, samples were also collected from
outside the north and south walls.
The infield for this farm is not well defined, but directly west of the buildings is a
small, fan-shaped area, densely overgrown with grass. This area alone, if infield, would
presumably be too small for a farm of this size. In 2003, we collected samples at 5m
intervals on a transect extending downslope through this area. To determine whether the
infield might extend further west, samples were collected in 2005 at 20m intervals across
9 3
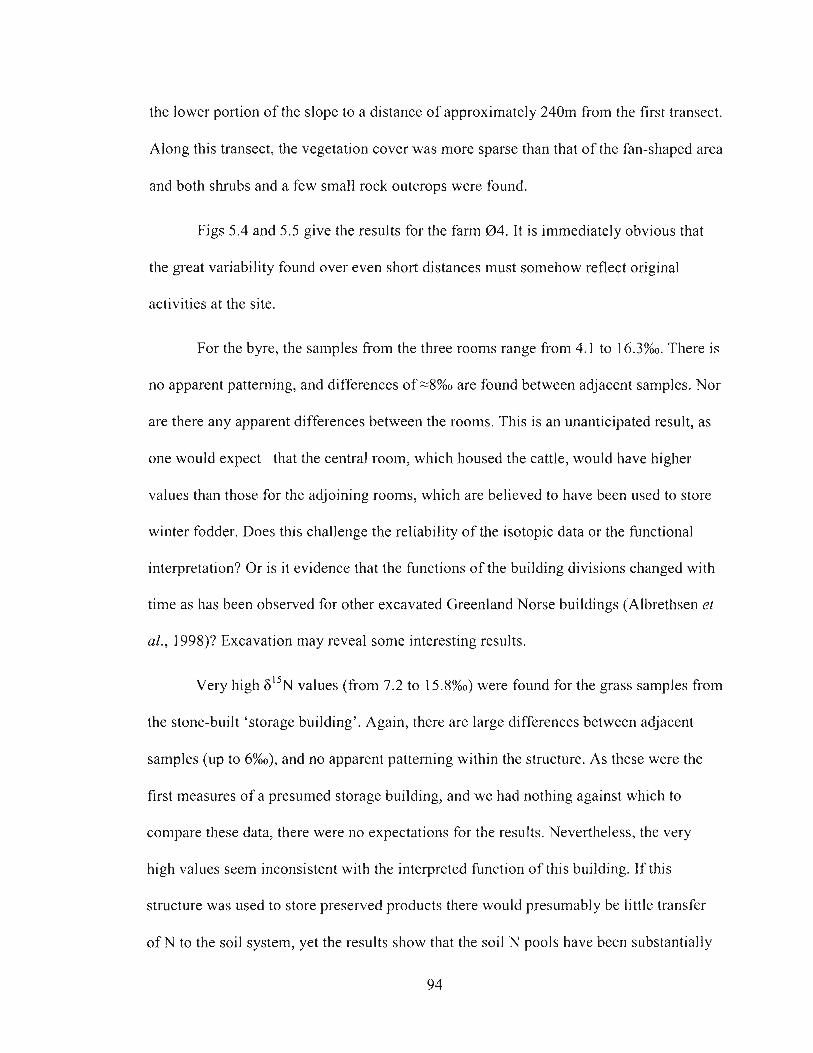
the lower portion of the slope to a distance of approximately 240m from the first transect.
Along this transect, the vegetation cover was more sparse than that of the fan-shaped area
and both shrubs and a few small rock outcrops were found.
Figs 5.4 and 5.5 give the results for the farm 0 4 . It is immediately obvious that
the great variability found over even short distances must somehow reflect original
activities at the site.
For the byre, the samples from the three rooms range from 4.1 to 16.3%0. There is
no apparent patterning, and differences of -8%o are found between adjacent samples. Nor
are there any apparent differences between the rooms. This is an unanticipated result, as
one would expect that the central room, which housed the cattle, would have higher
values than those for the adjoining rooms, which are believed to have been used to store
winter fodder. Does this challenge the reliability of the isotopic data or the functional
interpretation? Or is it evidence that the functions of the building divisions changed with
time as has been observed for other excavated Greenland Norse buildings (Albrethsen et
ul., 1998)? Excavation may reveal some interesting results.
Very high i S I 5 ~ values (from 7.2 to 15.8%0) were found for the grass samples from
the stone-built 'storage building'. Again, there are large differences between adjacent
samples (up to 6%0), and no apparent patterning within the structure. As these were the
first measures of a presumed storage building, and we had nothing against which to
compare these data, there were no expectations for the results. Nevertheless, the very
high values seem inconsistent with the interpreted function of this building. If this
structure was used to store preserved products there would presumably be little transfer
of N to the soil system, yet the results show that the soil N pools have been substan.tially
94
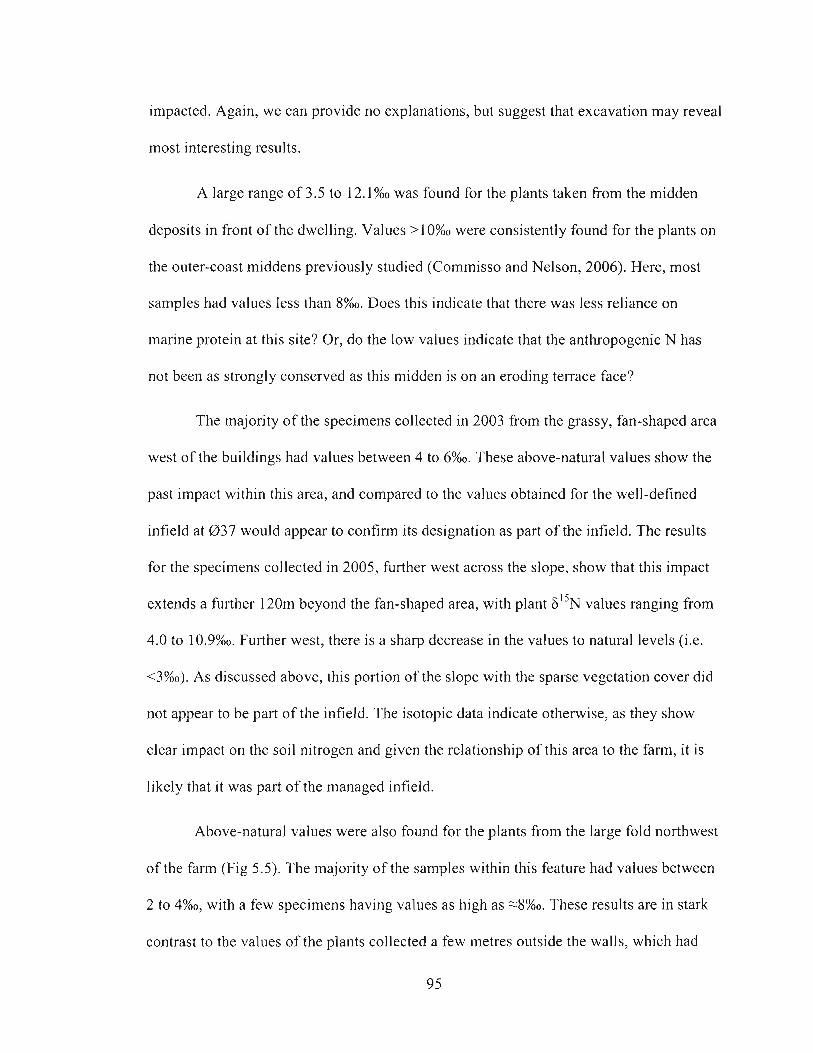
impacted. Again, we can provide no explanations, but suggest that excavation may reveal
most interesting results.
A large range of 3.5 to 12.1%0 was found for the plants taken from the midden
deposits in front of the dwelling. Values >1 O%O were consistently found for the plants on
the outer-coast middens previously studied (Commisso and Nelson, 2006). Here, most
samples had values less than 8%0. Does this indicate that there was less reliance on
marine protein at this site? Or, do the low values indicate that the anthropogenic N has
not been as strongly conserved as this midden is on an eroding terrace face?
The majority of the specimens collected in 2003 from the grassy, fan-shaped area
west of the buildings had values between 4 to 6%0. These above-natural values show the
past impact within this area, and compared to the values obtained for the well-defined
infield at 037 would appear to confirm its designation as part of the infield. The results
for the specimens collected in 2005, further west across the slope, show that this impact
extends a further 120m beyond the fan-shaped area, with plant 6 ' 5 ~ values ranging from
4.0 to 10.9%0. Further west, there is a sharp decrease in the values to natural levels (i.e.
<3%0). As discussed above, this portion of the slope with the sparse vegetation cover did
not appear to be part of the infield. The isotopic data indicate otherwise, as they show
clear impact on the soil nitrogen and given the relationship of this area to the farm, it is
likely that it was part of the managed infield.
Above-natural values were also found for the plants from the large fold northwest
of the farm (Fig 5.5). The majority of the samples within this feature had values between
2 to 4%0, with a few specimens having values as high as ~ 8 % 0 . These results are in stark
contrast to the values of the plants collected a few metres outside the walls, which had
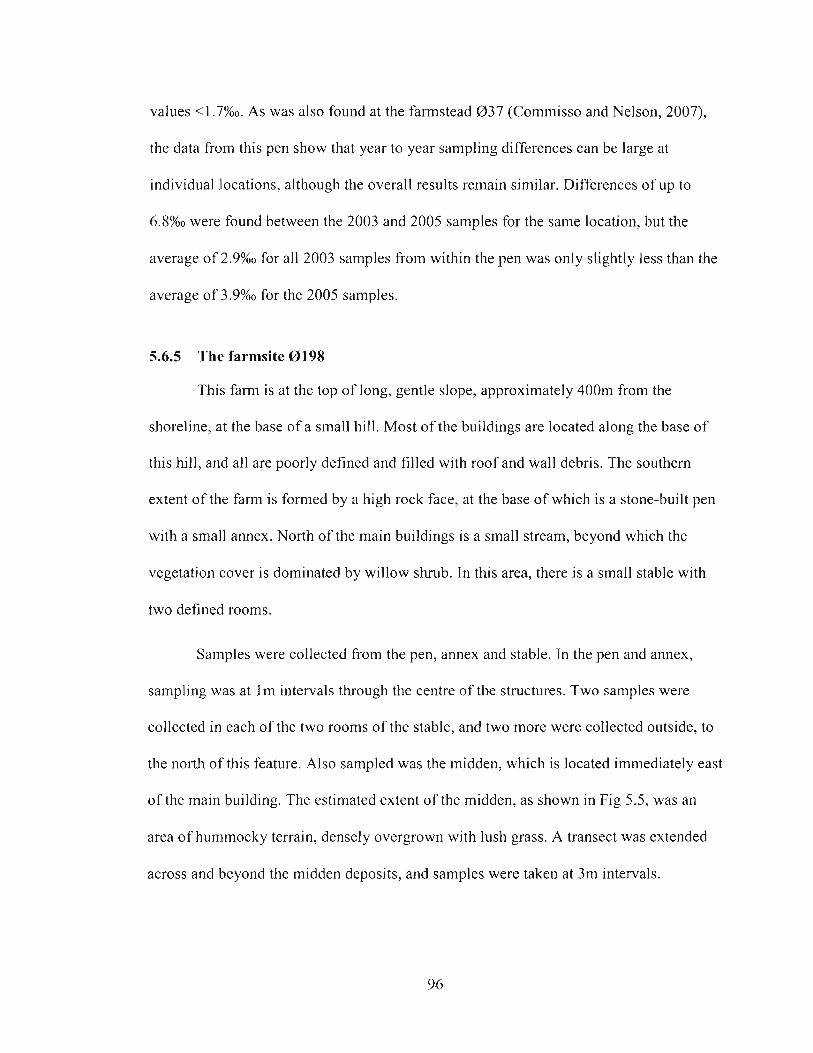
values <1.7%0. As was also found at the farmstead 0 3 7 (Commisso and Nelson, 2007),
the data from this pen show that year to year sampling differences can be large at
individual locations, although the overall results remain similar. Differences of up to
6.8%0 were found between the 2003 and 2005 samples for the same location, but the
average of 2.9%0 for all 2003 samples from within the pen was only slightly less than the
average of 3.9%0 for the 2005 samples.
5.6.5 The farmsite 0198
This farm is at the top of long, gentle slope, approximately 400m from the
shoreline, at the base of a small hill. Most of the buildings are located along the base of
this hill, and all are poorly defined and filled with roof and wall debris. The southern
extent of the farm is formed by a high rock face, at the base of which is a stone-built pen
with a small annex. North of the main buildings is a small stream, beyond which the
vegetation cover is dominated by willow shrub. In this area, there is a small stable with
two defined rooms.
Samples were collected horn the pen, annex and stable. In the pen and annex,
sampling was at Im intervals through the centre of the structures. Two samples were
collected in each of the two rooms of the stable, and two more were collected outside, to
the north of this feature. Also sampled was the midden, which is located immediately east
of the main building. The estimated extent of the midden, as shown in Fig 5.5, was an
area of hummocky terrain, densely overgrown with lush grass. A transect was extended
across and beyond the midden deposits, and samples were taken at 3m intervals.
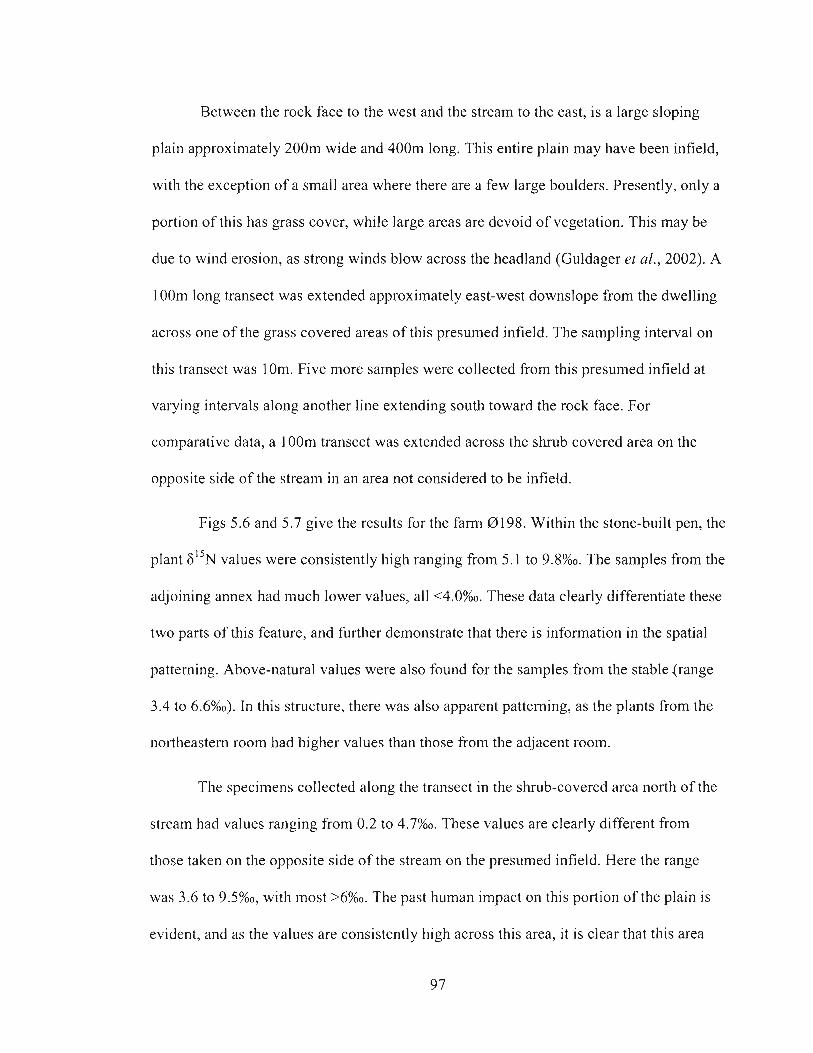
Between the rock face to the west and the stream to the east, is a large sloping
plain approximately 200m wide and 400m long. This entire plain may have been infield,
with the exception of a small area where there are a few large boulders. Presently, only a
portion of this has grass cover, while large areas are devoid of vegetation. This may be
due to wind erosion, as strong winds blow across the headland (Guldager et al., 2002). A
I OOm long transect was extended approximately east-west downslope from the dwelling
across one of the grass covered areas of this presumed infield. The sampling interval on
this transect was 1 Om. Five more samples were collected from this presumed infield at
varying intervals along another line extending south toward the rock face. For
comparative data, a I OOm transect was extended across the shrub covered area on the
opposite side of the stream in an area not considered to be infield.
Figs 5.6 and 5.7 give the results for the farm 0198. Within the stone-built pen, the
plant 6 " ~ values were consistently high ranging from 5.1 to 9.8%0. The samples from the
adjoining annex had much lower values, all <4.0%0. These data clearly differentiate these
two parts of this feature, and further demonstrate that there is information in the spatial
patterning. Above-natural values were also found for the samples from the stable (range
3.4 to 6.6%0). In this structure, there was also apparent patterning, as the plants from the
northeastern room had higher values than those from the adjacent room.
The specimens collected along the transect in the shrub-covered area north of the
stream had values ranging from 0.2 to 4.7%0. These values are clearly different from
those taken on the opposite side of the stream on the presumed infield. Here the range
was 3.6 to 9.5%0, with most >6%0. The past human impact on this portion of the plain is
evident, and as the values are consistently high across this area, it is clear that this area
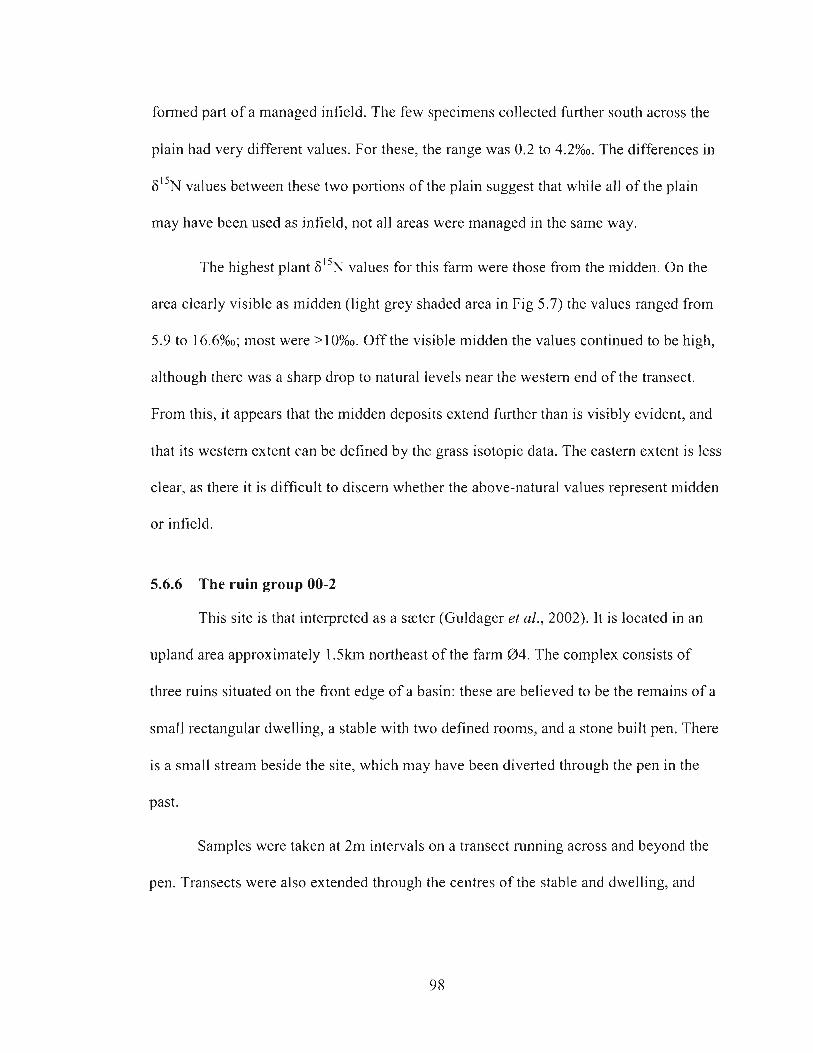
formed part of a managed infield. The few specimens collected further south across the
plain had very different values. For these, the range was 0.2 to 4.2%0. The differences in
6 1 5 ~ values between these two portions of the plain suggest that while all of the plain
may have been used as infield, not all areas were managed in the same way.
The highest plant values for this farm were those from the midden. On the
area clearly visible as midden (light grey shaded area in Fig 5.7) the values ranged from
5.9 to 16.6%0; most were >10%0. Off the visible midden the values continued to be high,
although there was a sharp drop to natural levels near the western end of the transect.
From this, it appears that the midden deposits extend further than is visibly evident, and
that its western extent can be defined by the grass isotopic data. The eastern extent is less
clear, as there it is difficult to discern whether the above-natural values represent midden
or infield.
5.6.6 The ruin group 00-2
This site is that interpreted as a szter (Guldager el al., 2002). It is located in an
upland area approximately 1.5krn northeast of the farm 04. The complex consists of
three ruins situated on the front edge of a basin: these are believed to be the remains of a
small rectangular dwelling, a stable with two defined rooms, and a stone built pen. There
is a small stream beside the site, which may have been diverted through the pen in the
past.
Samples were taken at 2m intervals on a transect running across and beyond the
pen. Transects were also extended through the centres of the stable and dwelling, and
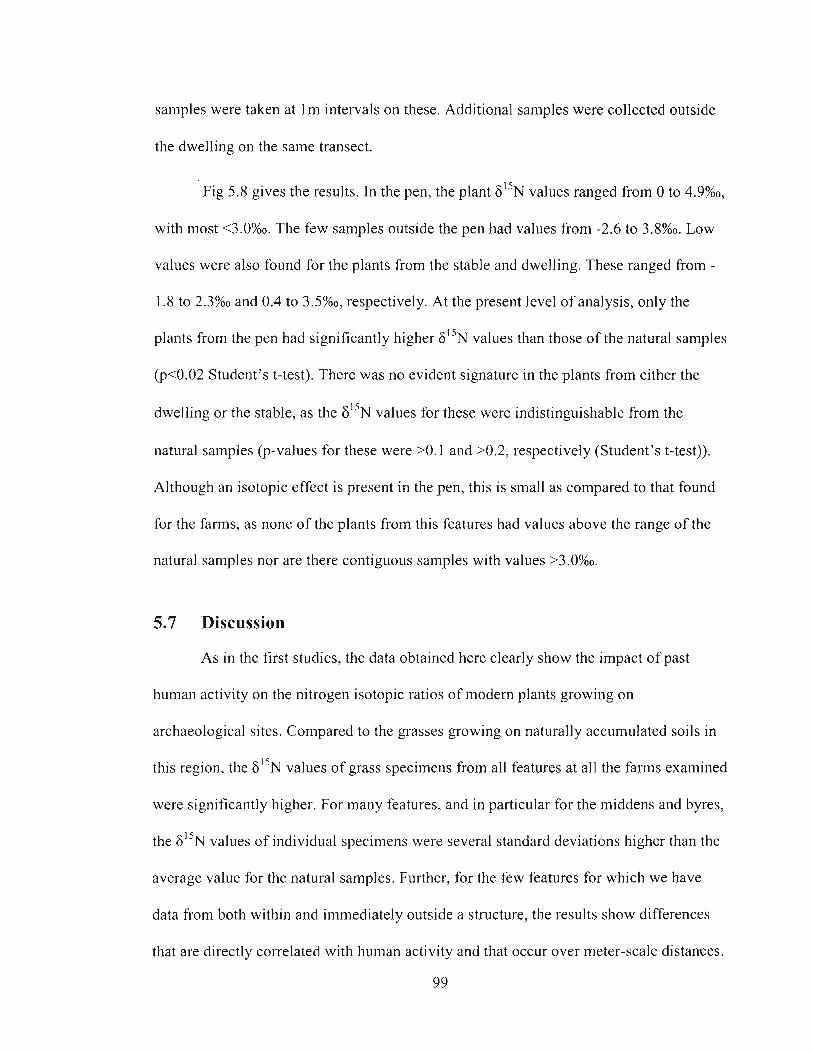
samples were taken at I m intervals on these. Additional samples were collected outside
the dwelling on the same transect.
Fig 5.8 gives the results. In the pen, the plant 6 " ~ values ranged from 0 to 4.9%0,
with most <3.0%0. The few samples outside the pen had values from -2.6 to 3.8%0. Low
values were also found for the plants from the stable and dwelling. These ranged from -
1.8 to 2.3%0 and 0.4 to 3.5%0, respectively. At the present level of analysis, only the
plants from the pen had significantly higher F"N values than those of the natural samples
@<0.02 Student's t-test). There was no evident signature in the plants from either the
dwelling or the stable, as the 6 1 5 ~ values for these were indistinguishable from the
natural samples @-values for these were >O. I and B0.2, respectively (Student's t-test)).
Although an isotopic effect is present in the pen, this is small as compared to that found
for the farms, as none of the plants from this features had values above the range of the
natural samples nor are there contiguous samples with values >3.0%0.
5.7 Discussion
As in the first studies, the data obtained here clearly show the impact of past
human activity on the nitrogen isotopic ratios of modern plants growing on
archaeological sites. Compared to the grasses growing on naturally accumulated soils in
this region, the values of grass specimens from all features at all the farms examined
were significantly higher. For many features, and in particular for the middens and byes,
the 6I5N values of individual specimens were several standard deviations higher than the
average value for the natural samples. Further, for the few features for which we have
data from both within and immediately outside a structure, the results show differences
that are directly correlated with human activity and that occur over meter-scale distances.
99
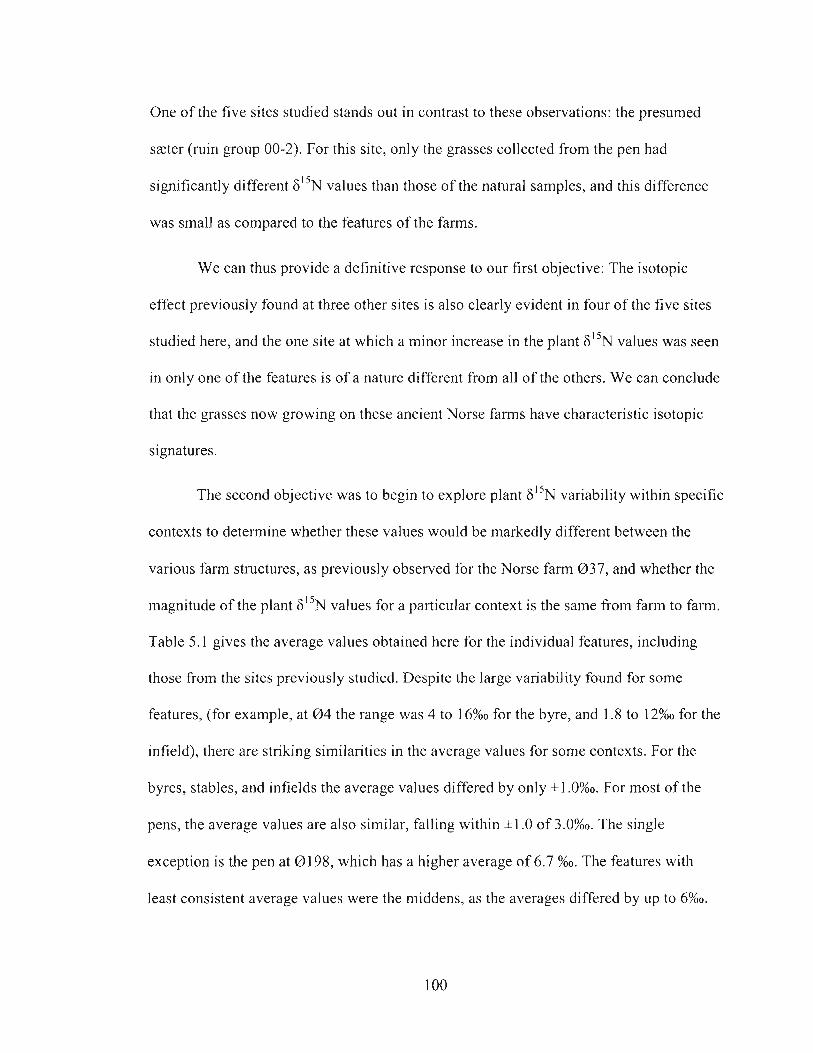
One of the five sites studied stands out in contrast to these observations: the presumed
szter (ruin group 00-2). For this site, only the grasses collected from the pen had
significantly different 6 " ~ values than those of the natural samples, and this difference
was small as compared to the features of the farms.
We can thus provide a definitive response to our first objective: The isotopic
effect previously found at three other sites is also clearly evident in four of the five sites
studied here, and the one site at which a minor increase in the plant values was seen
in only one of the features is of a nature different from all of the others. We can conclude
that the grasses now growing on these ancient Norse farms have characteristic isotopic
signatures.
The second objective was to begin to explore plant variability within specific
contexts to determine whether these values would be markedly different between the
various farm structures, as previously observed for the Norse farm 037, and whether the
magnitude of the plant 6 1 5 ~ values for a particular context is the same from farm to farm.
Table 5.1 gives the average values obtained here for the individual features, including
those from the sites previously studied. Despite the large variability found for some
features, (for example, at 0 4 the range was 4 to 16%0 for the byre, and 1.8 to 12%0 for the
infield), there are striking similarities in the average values for some contexts. For the
byres, stables, and infields the average values differed by only &1.0%0. For most of the
pens, the average values are also similar, falling within *I .0 of 3.0%0. The single
exception is the pen at 01 98, which has a higher average of 6.7 %o. The features with
least consistent average values were the middens, as the averages differed by up to 6%0.
Statistical comparisons (one-way ANOVA) for each of these contexts confiml
these evident observations. No significant differences were found ( p 0 . 5 for each
comparison) between each of the data sets from the byres, stables, and infields, while
significant differences were found for the pens Cp<0.0005) and the middens Cp< 0.005).
Further, the averages for some features are statistically distinct when compared to others.
For example, the values obtained for the b y e s are significantly different than those from
either the stables or infields (p< 0.005, for each comparison).
These new observations strongly suggest that the isotopic variation previously
observed at 037 and now for these farms does represent real differences that somehow
reflect ancient human activity. Further, for many features, the magnitude of the measured
values is similar from farm to farm, and so must in some way characterize specific past
activities.
With these empirical observations, we can address our third objective and propose
first explanations for the unusual plant 6 1 5 ~ values at these sites. Given the patterning
observed at each, we are again led to the conclusion that the isotopic composition of the
nitrogenous materials deposited in the past has been strongly conserved in the local soil
system and is a primary determinant for modem plant F ' ~ N values. Not only are similar
average values found for specific contexts, but also there is general concordance between
the plant 6 1 5 ~ values measured for each context and the 6I5N of the nitrogen likely
deposited there in the past. This is perhaps most evident in the results for the spatially-
limited and spatially-defined features, and we begin with these.
Cattle and sheep dung is enriched =3%0 above the feed (Kerley and Jarvis, 1996;
Sutoh el al., 1996). One can use the measured 6I5N average for the natural samples
( I . 1 %o) and this amount of enrichment to predict that the sheep, and presumably goat
dung, would have been - 4%0. This corresponds well with the averages obtained for the
features interpreted as animal stables and those for most pens, as these are within the
range 4* I %o.
The much higher average values for the samples from the b y e s can also be
understood if one assumes that the cattle were preferentially fed fodder fiom the infield.
(A reasonable expectation given that cows were unable to graze over the long winter
months (Albrethsen and Keller, 1986)). If the past 6 1 5 ~ values for the infield grasses
were the same as those observed today, the cattle dung would have had values of -8%o
which corresponds very well with the average values for the byes , which fall within the
range of 8.5 *I .O%O.
The data for the pen at 0 198 provide a possible exception to these observations,
as they are closer to those for the b y e s than to the pens at other sites. Is this a
fundamental difference, or simply an indication that this structure was used to stall cattle
rather than sheep or goats?
For the middens, one would expect the soil nitrogen to be highly ' 5 ~ enriched due
to deposition of large amounts of seal remains (seal bones typically make up about half
the faunal assemblage of excavated sites). Seals are high trophic level marine animals,
and as such have high 6 1 5 ~ values (Kelly, 2000). In each of these middens, plant 6 1 5 ~
values > I O%O were found. Is the observed variability in the average values of the middens
reflecting the relative amounts of seal versus domestic animal remains within these
deposits? Or, as we have suggested for 0 4 where the average value was much less than
those of the other middens, does this reflect a loss of the anthropogenic N.
102
In this proposed explanation for the phenomenon, modern plant values are
determined not only by the unusual 6 1 5 ~ values of the material originally deposited, but
by the relative amount of this nitrogen admixed and conserved in the natural soil nitrogen
pool. For our quantitative arguments above to be correct, the amount of nitrogen added to
the soil in the byres, pens and middens must have been much greater than the natural
amount originally present, as would be expected for these structures. One also would then
expect that sites subject to less human activity would have lower values.
The data for the site interpreted as a sater are consistent with this expectation. In
two of the three features tested, the 6 1 5 ~ values were not significantly different, at the
present level of analysis, from those of plants growing in natural circumstances. For the
third feature, the pen, the differences were small. Szters functioned as temporary summer
stations for the management of grazing domestic herds. Since the purpose was to exploit
the natural vegetation, the animals would be confined to the pens and stalls only for
gathering and milking purposes. In comparison to the farms, there would be much less
nitrogen input within the structures. The isotopic data indicate that for most contexts this
amount was too small to significantly alter the isotopic composition of the existing soil N
pool, or result in relatively small alterations.
The churchyard at 035 provides further evidence to support these interpretations.
In this feature, the only expected anthropogenic N input would be that derived from the
interred human bodies as the nature of the site and the surrounding wall would proscribe
other human or animal activity. As the churchyard is only a few meters in diameter and
should contain only a few human bodies, it is intriguing that the data for this feature do
lie above the natural range. Since the Norse diet included much seal meat, their flesh
would have high 6I5N values and so the lower plant values must reflect the smaller
original admixture of human-derived nitrogen into the natural soil nitrogen pool. Of equal
interest are the natural values obtained fiom the specimens immediately outside the
surrounding wall, which indicate that the impact of this introduced nitrogen remains very
localized.
The data for the farm infields provides information on a much larger spatial scale.
While there is considerable variability within each infield, the average values for the
farms are remarkably consistent. These elevated values reflect larger-scale
alterations of the soil nitrogen pools that are difficult to explain without invoking some
form of fertilization in the past. (Recent measures of plants from controlled plots support
for this argument, as plants from plots treated with farmyard manure are comparatively
I5N enriched as compared to those from un-treated plots (Bogaard et al., 2007; Choi et
al., 2003)). We cannot yet say which of several fertilizers (animal manure, seaweed,
midden refuse, and fish are all possibilities (discussed in Fenton (1 981)) is the source of
these elevated plant 6'" values, but the similarity in results fiom farm to farm suggest
that a common strategy was in use and that the isotopic outcome was not haphazard and
dependent on local circumstance. For all, there are clear isotopic differences between
managed and un-managed areas.
In summary, the observations above are consistent with a very simple but rather
surprising interpretation - that isotopically-unusual nitrogen introduced to the soil by
human action many centuries ago is still there, and that it hasn't moved more than a few
metres or been further modified since its deposition.
There is some indication that this simple interpretation may not apply in all
circumstances, as a few grass specimens had 6 1 5 ~ values greatly at odds with those of the
nitrogen that one would expect to have been deposited at that location. For example,
while the average value found for the 0 4 byre samples (9.5%0) is close to that one would
predict for the cattle dung based on the values of the infield samples (average 5.5%0, to
which must be added -3%0 (Kerley and Jarvis, l996)), several samples have values above
12%0, some as high as 16%0. It is difficult to explain such high values without invoking
very localized deposition of some high trophic-level marine nitrogen (i.e. from using fish
as fodder, a practice known elsewhere in the North (Amorosi et a!., 1998)), or presuming
that isotopic fractionation processes were in play either at the time or during subsequent
soil development. There is evidence that the byres were infrequently cleaned (discussed
in McGovern et al. (1 98O)), and so large amounts of cattle dung would have accumulated
over the winter within these structures. In these circumstances, N losses through
ammonia volatization could "N enrich the manure as the lighter 1 4 ~ isotopes are
preferentially volatized (Hogberg, 1997). Alternatively, ' 5 ~ enriclment may have
occurred after site abandonment. Thick organic layers are found in excavated byres
(Roussell, 1936) and the nitrogen content of these layers may exceed the requirements of
the vegetation subsequently established within these ruins. Mineralized nitrogen,
particularly nitrate, not taken up by plants and lost through leaching, can result in 1 5 ~
enriched nitrogen pools (Hogberg, 1997). The information we have at present is not
sufficient to determine whether any of these fractionation processes are a factor in
interpreting the isotopic results, and i t will be important to carefully examine these
possibilities, given the consequences for archaeological reconstruction.
5.8 Conclusion
We can now say with certainty that human activity in the past has resulted in
clearly evident isotopic signatures in the plants presently growing on Norse
archaeological sites in Greenland. We have found unnaturally high plant 6 1 5 ~ values at
each of the six Norse farms tested, and can confidently predict that these isotopic
signatures are present at all Norse farms in Greenland's Eastern Settlement. We anticipate
that they will also be found at archaeological sites in other regions, and especially the
farms of the more northern Western Settlement.
The isotopic variation we previously observed at the Norse faim 037 (Commisso
and Nelson, 2007) was neither fortuitous nor unique to that farm. Rather, plants growing
in like features of these farms have very similar average 6 1 5 ~ values. Further, these
average values can be correlated with the isotopic ratios of the nitrogenous materials
deposited centuries ago; apparently showing the very strong and localized conservation
of the isotopic composition of these materials in the soil. In some circumstances, the
magnitude of the plant 6 ' ' ~ values appears to reflect the amount of this material admixed
into the soil nitrogen pool, and possibly, subsequent fractionation processes.
These statements are supported by data from a site interpreted as a sater, and a
churchyard cemetery. No unusually high isotopic values were observed at the sater, as is
consistent with the expected low impact at such a site, and the cemetery had slightly
elevated values, as might be expected for the deposition within a small area of a limited
amount of highly ' 5 ~ enriched nitrogen from human tissue.
While the signatures are not unique, and the values thus cannot be used as a
unique identifier of specific contexts, they do place limits on the types of activities which
106
took place at these areas. For example, although these are only the first measures of a
sater, the data provoke speculation that the signature, or lack thereof, can be used to
differentiate between high altitude farms and these seasonally occupied stations.
We continue to find isotopic differences over distances of at most a meter or two
which clearly reflect the features from which the samples were taken. It yet remains
unknown whether this spatial resolution is even finer, but already, these measurements
can be used to initiate and guide excavation, as the values clearly identify and delineate
activity areas.
Even at the present limited level of understanding, there are obvious
archaeological applications. An immediate example is in the study of the Norse infields.
For many farms, the infields are either not apparent or are poorly defined. Information on
the productivity of individual farms is therefore of limited accuracy. The simple tests
conducted here, not only demonstrate that the method can identify and define managed
infields, but have shown that, at least for this particular region, fertilizing was a common
practice.
Further study of this newly-observed phenomenon is likely to prove very
rewarding.
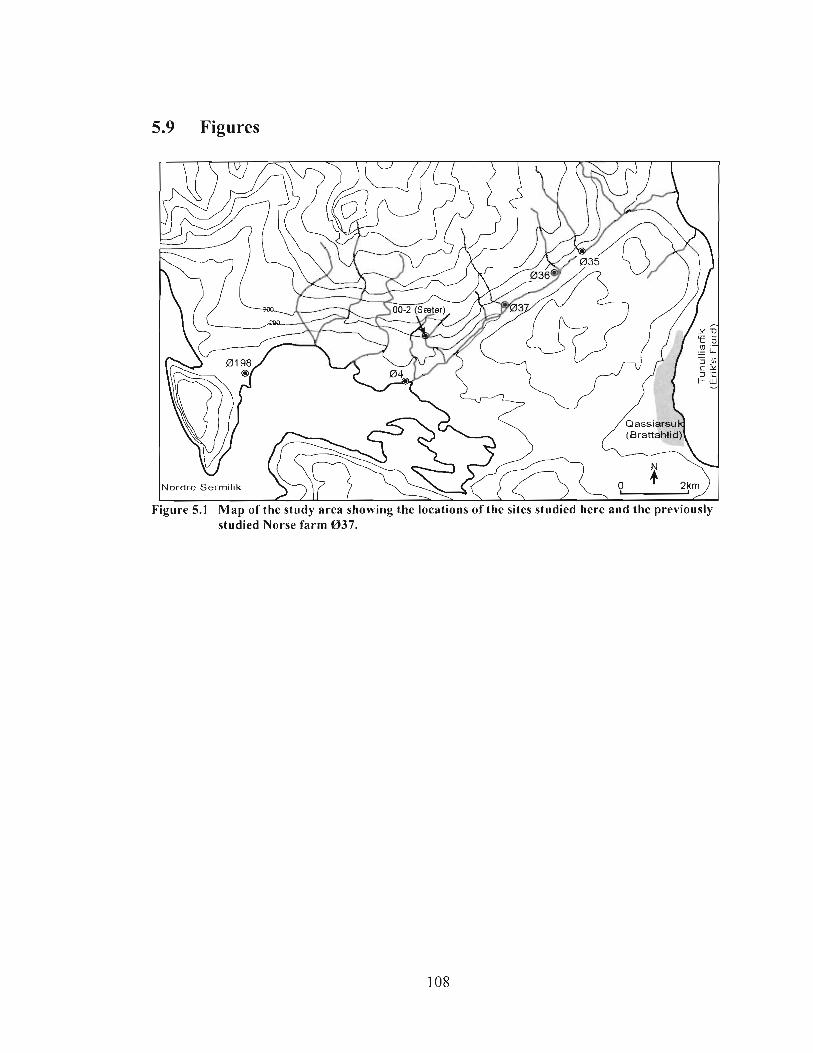
5.9 Figures
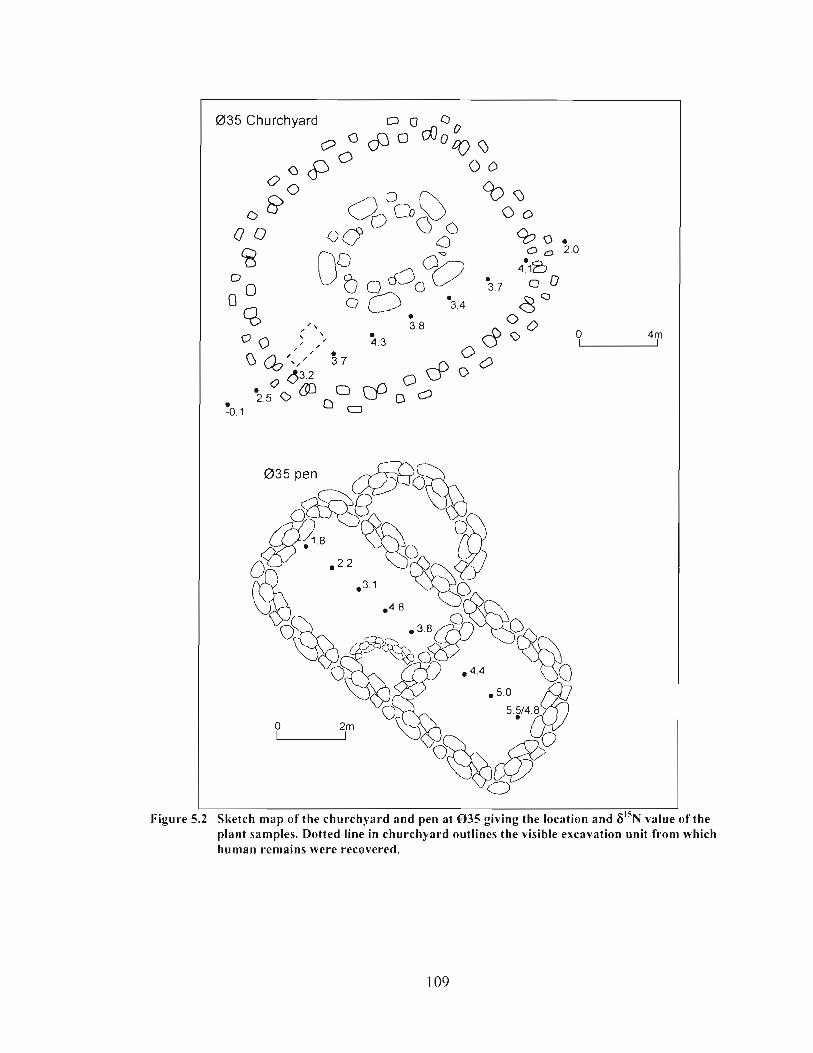
0 3 5 Churchyard Q 0 -0,.
I
Figure 5.2 Sketch map of the churchyard and pen at 0 3 5 giving the location and 6 ' ' ~ value of the plant samples. Dotted line in churchyard outlines the visible excavation unit from which human remains were recovered.
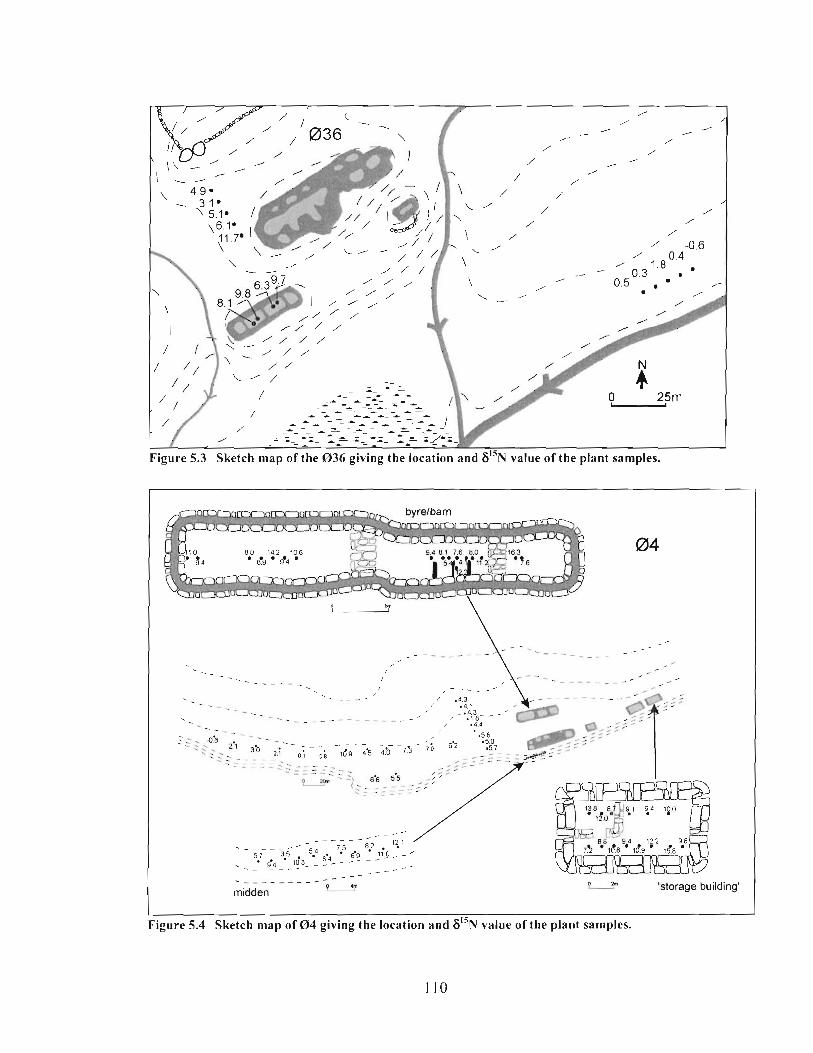
L
Figure 5.3 Sketch map of the 036 giving the location and 6'" value of the plant samples.
, - I
I - - / - _ - . - * - - _ . . ,
I , - - - - . - ' > - -. - .- - / .4.3
- - - . ' -4.1 - -_ . _ _ _ - - - - - _ _ - - , ,.'I3 - .+
' . 1 -18 - - -. - _ , . 4 4
::. 4% - - - - I - - - - . .,. 23 3b ..- .. . 1.1 0.; 5.8 . - . - . . - -- . _ _-.- - . - - - > - A - -.. - . - 0 - i- ' 2; 6'6 5.5
, L . - . - - - - - T
- - - _ - - - - - - ._--_--_ 7.5 882 . 'il 5.7 . 3.5 . 5.4 6.9- - 21s - - '
- - . -92 - -10_3- - 9- - - # _ - - - - - - - - - - - - _ _ - - - - 0 4m 0 %
,- midden 'storage building'
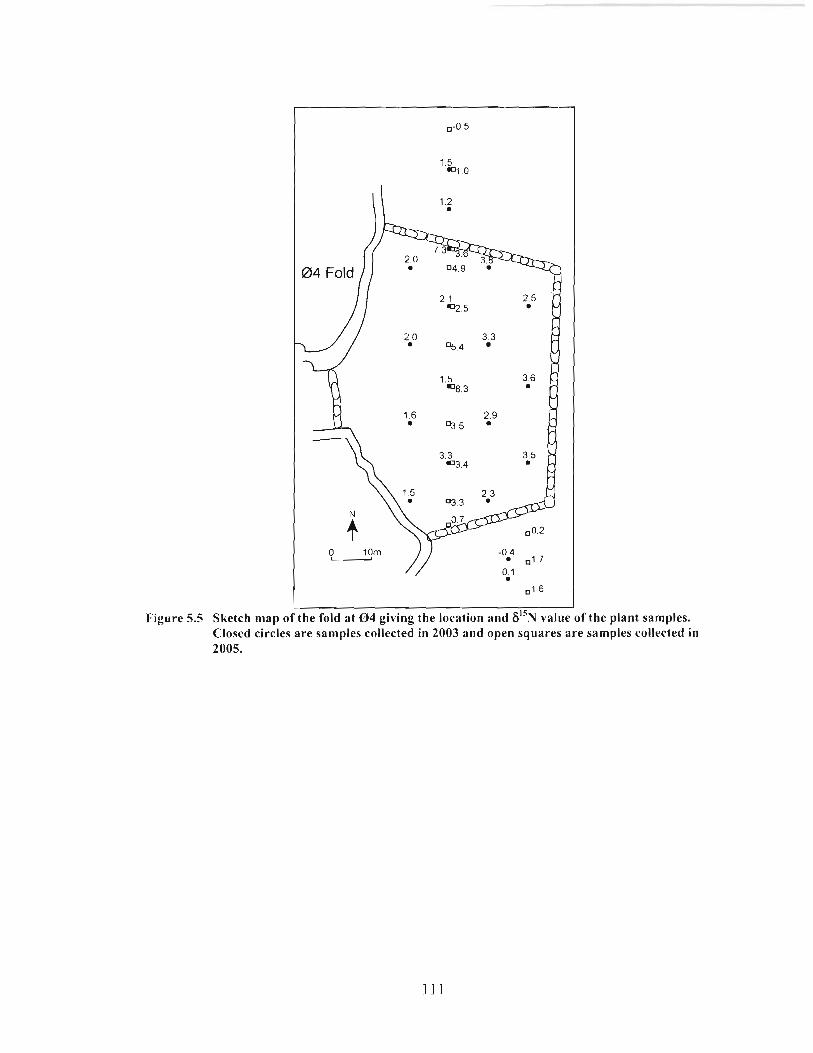
I 1 Figure 5.5 Sketch map of the fold at 0 4 giving the location and 6% value of the plant samples.
Closed circles are samples collected in 2003 and open squares are samples collected in 2005.
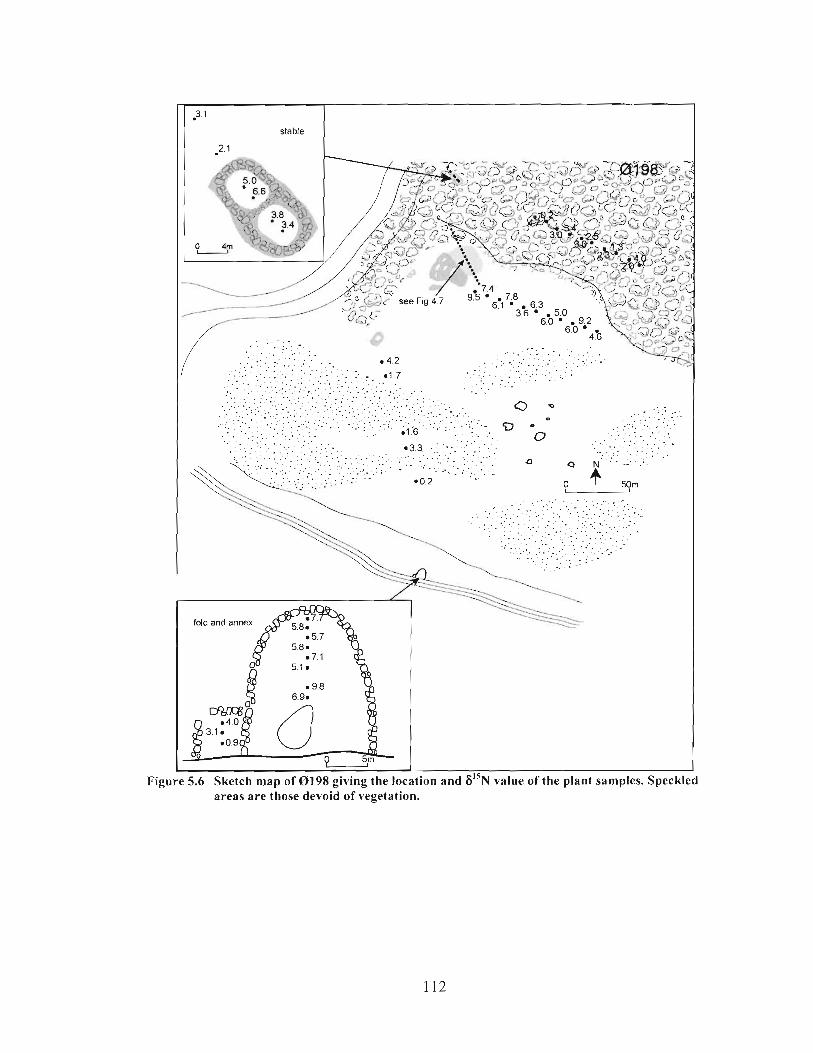
I Figure 5.6 Sketch map of 8 1 9 8 giving the location and 6'" value of the plant samples. Speckle
areas are those devoid of vegetation.
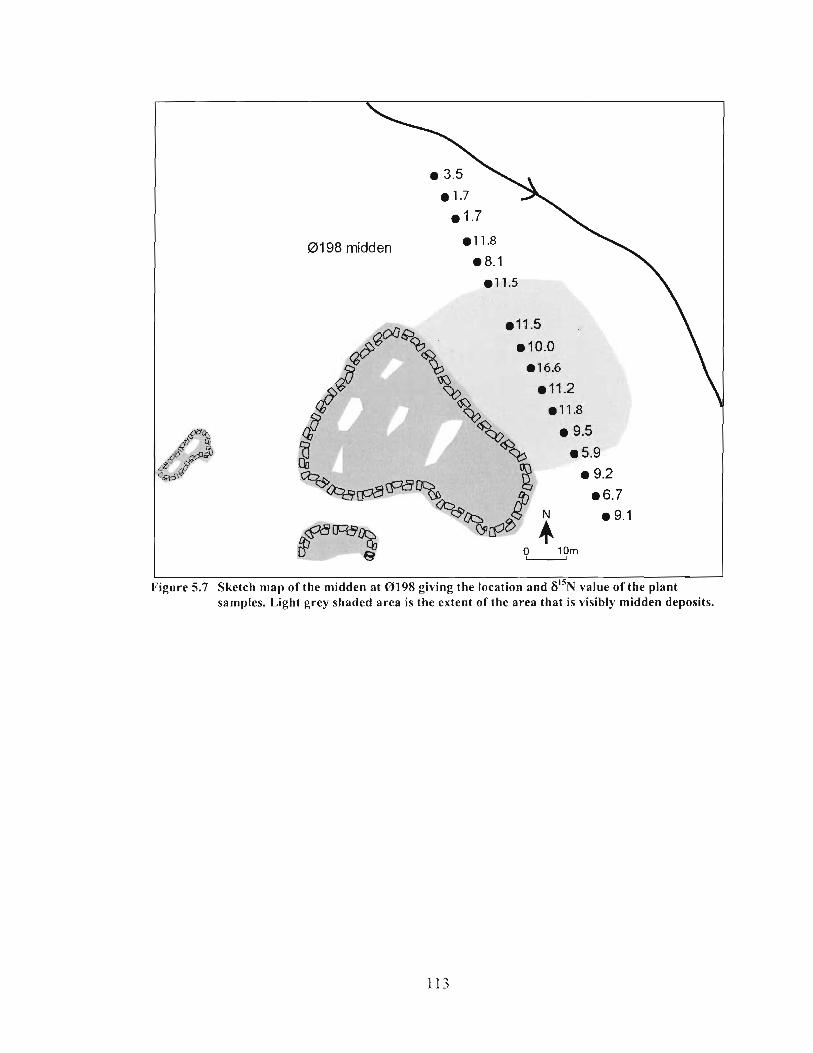
Figure 5.7 Sketch map of the midden at 0198 giving the location and 6% value of the plant samples. Light grey shaded area is the extent of the area that is visibly midden deposits.
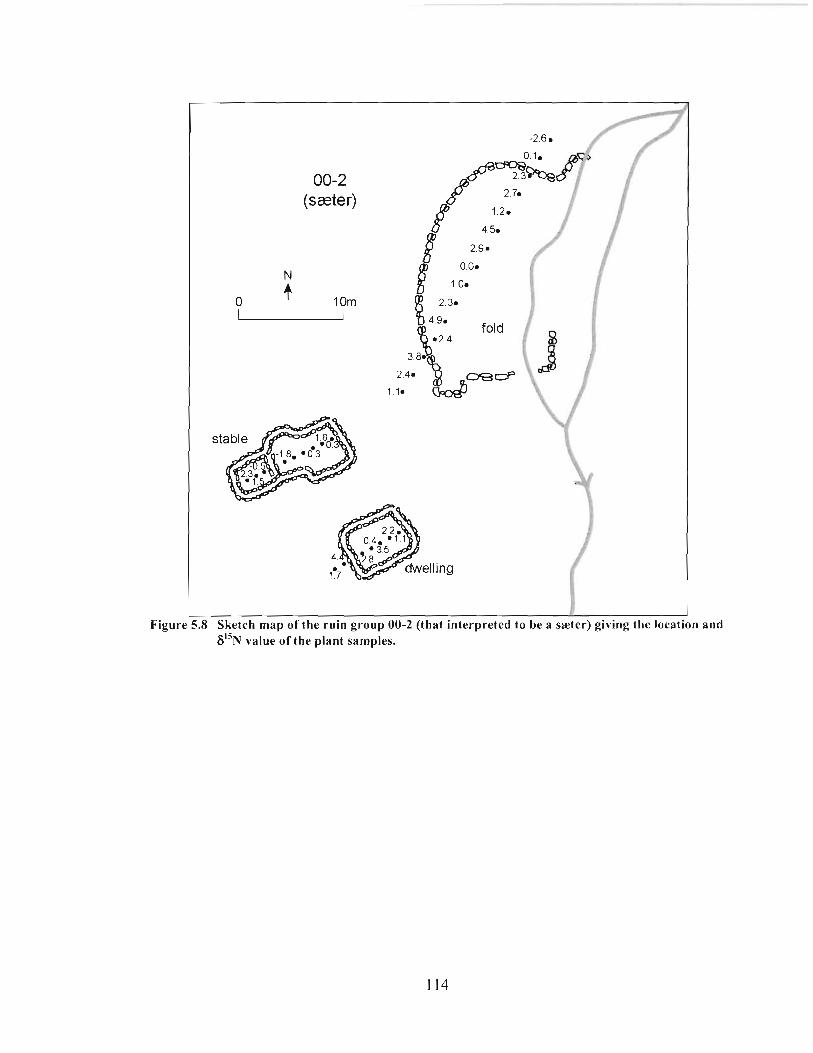
Figur .8 Sketch map of the ruin group 00-2 (that interpreted to be a szter) giving the locat 6% value of the plant samples.
In and
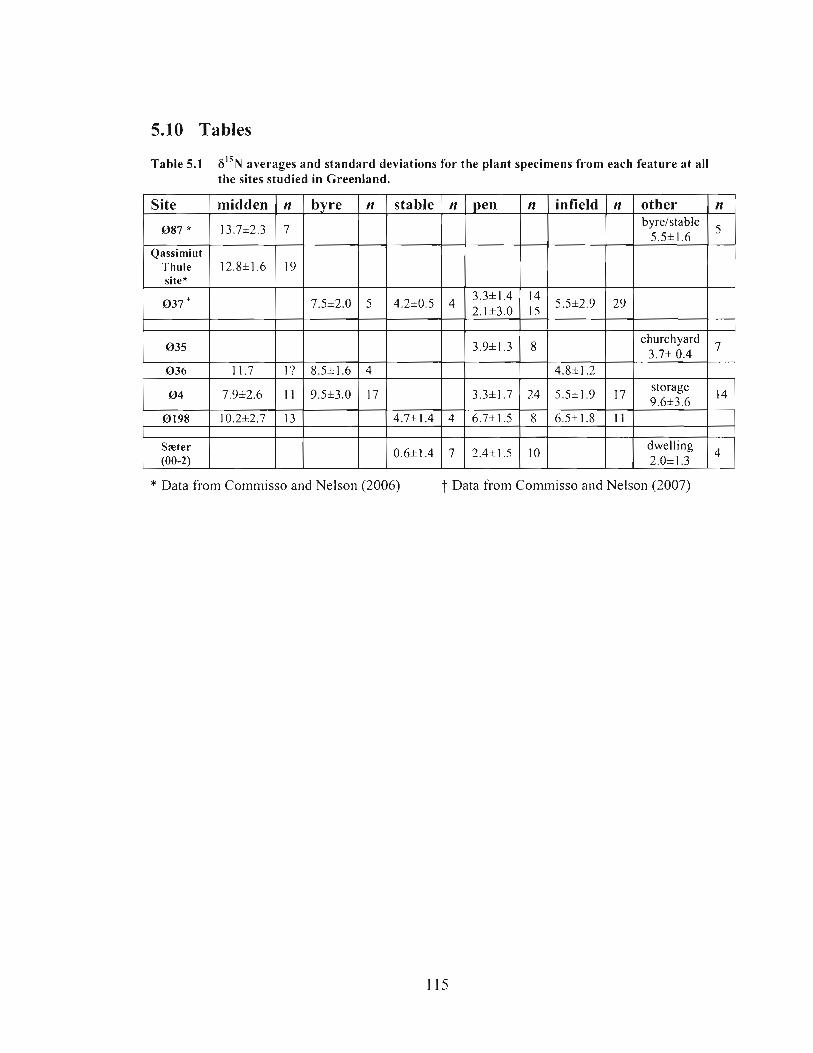
5.10 Tables
Table 5.1 6'" averages and standard deviations for the plant specimens from each feature at all the sites studied in Greenland.
Site midden n byre
0 8 7 * 13.7k2.3 7
Qassimiut Thule 12.8f 1.6 19 site*
0 3 7 7.5+2.0
n I stable ( n
2.4*1.5 10 dwelling 2.0*1.3
4
* Data from Commisso and Nelson (2006) t Data from Cornrnisso and Nelson (2007)
5.1 1 Reference List
Albrethsen,S.E., Keller,C., 1986. The use of the saeter in medieval Norse farming in Greenland. Arctic Anthropology. 23, 91 -1 07.
Albrethsen,S.E., Olafsson,G., 1998, A vjking age hall in: J. Ameborg, H. C. Gullov (Eds.), Man, Culture and Environment in Ancient Greenland, The Danish National Museum and Danish Polar Center, Copenhagen, pp. 19-26.
Amorosi,T., Buckland,P., Edwards,K.J., Mainland,I., McGovem,T.H., Sadler,J.P., Skidmore,P., 1998. They did not live by grass alone: the politics and paleoecology of animal fodder in the North Atlantic region. Environmental Archaeology. 1, 41 - 54.
Arneborg,J., 2004, Nordboeme i Grsnland jn: Gullrav H.C. (Ed.), Grsnlands forhistorie, Gyldendal, Karbenhavn, pp. 22 1-272.
Arneborg,J., Hansen,J., Paulsen,T., Paulsen,C., 200 1 . Kirkearkaeologiske underssgelser. Ruingrupp 60V2-1V-6201048 - Igaliku, Narsaq, ruingruppe 61 V3-111-5221033 - Qorlortoq, Narsaq, ruingruppe 61 VI-111-5291035 - Qorlortup Itinnera, Narsaq. Fel trapport 3.
Bogaard,A., Heaton,T.H.E., Poulton,P., Merbach,I., 2007. The impact of manuring on nitrogen isotope ratios in cereals: archaeological implications for reconstruction of diet and crop management practices. Journal of Archaeological Science. 34, 335-343.
Bruun,D., 1928. Fortidsminder og nutidshjem paa Island; , Gyldendal, Nordisk forlag, K~benhavn.
Choi,W.J., Ro,H.M., Hobbie,E.A., 2003. Patterns of natural N-15 in soils and plants from chemically and organically fertilized uplands. Soil Biology & Biochemistry. 35, 1493- 1500.
Commisso,R.G., Nelson,D.E., 2007. Patterns of plant 6 1 5 ~ values on a Greenland Norse farm. Journal of Archaeological Science. 34,440-450.
Commisso,R.G., Nelson,D.E., 2006. Modern plant 6 1 5 ~ values reflect ancient human activity. Journal of Archaeological Science. 33, 1 167-1 176.
Erskine,P.D., Bergstrom,D.M., Schmidt,S., Stewart,G.R., Tweedie,C.E., Shaw,J.D., 1998. Subantartic Macquarie Island - a model ecosystem for studying animal- derived nitrogen sources using '% natural abundance. Oecologia. 1 17, 1 87- 193.
Fenton,A., 1981, Early manuring techniques in: R. Mercer (Ed.), Farming Practices in British Prehistory, Edinburgh University Press, Edinburgh, pp. 21 0-2 17.
Guldager,O., Hansen,S.S., Gleie,S., 2002. Medieval Farmsteads in Greenland: The Brattahild region 1999-2000. Danish Polar Centre, Copenhagen.
Handley,L.L., Austin,A.T., Robison,D., Scrimgeour,C.M., Raven,J.A., Heaton,T.H.E., Schrnidt,S., Stewart,G.R., 1999. The ''N natural abundance of ecosystem samples reflects measures of water availability. Aust.J.Plant Physiol. 26, 185-1 99.
Handley,L.L., Raven,J.A., 1992. The use of natural abundance of nitrogen isotopes in plant physiology and ecology. Plant, Cell and Environment. 15,965-985.
Hawke,D.J., Holdaway,R.N., Causer,J.E., Ogden,S., 1999. Soil indicators of pre- European seabird breeding in New Zealand at sites identified by predator deposits. Aust. J. Soil Res. 37, 103-1 13.
Hogberg,P., 1997. I5N natural abundance in soil-plant systems. New Phytol. 137, 179- 203.
Kameda,K., Koba,K., Hobara,S., Osono,T., Terai,M., 2006. Pattern of natural N-15 abundance in lakeside forest ecosystem affected by cormorant-derived nitrogen. Hydrobiologia. 567, 69-86.
Kelly,J.F., 2000. Stable Isotopes of carbon and nitrogen in the study of avian and mammalian trophic ecology. Can. J. Zool. 78, 1-27.
Kerley,S.J., Jarvis,S.C., 1996. Preliminary studies of the impact of excreted N on cycling and uptake of N in pasture systems using natural abundance stable isotopic discrimination. Plant Soil. 178,287-294.
Liu,X.D., Sun,L.G., Yin,X.B., Zhu,R.B., 2004. Paleoecological implications of the nitrogen isotope signatures in the sediments amended by Antarctic seal excrements. Progress in Natural Science. 14, 786-792.
McGovern,T.H., 1980. Cows, harp seals, and churchbells: Adaptation and extinction in Norse Greenland. Hum. Ecol. V8,245-275.
McGovern,T.H., Bigelow,G., Amold,T., Russell,D., 1988. Northern Islands, Human Error, and Environmental Degradation: A View of Social and Ecological Change in the Medieval North Atlantic. Human Ecology. 16,225-270.
Michelsen,A., Quarmby,C., Sleep,D., Jonasson,S., 1998. Vascular plant ' 5 ~ natural abundance in heath and forest tundra ecosystems is closely correlated with presence and type of mycorrhizal fungi in roots. Oecologia. 1 15,406-41 8.
Nadelhoffer,K., Shaver,G., Fry,B., Giblin,A., Johnson,L., McKane,R., 1996. "N natural abundances and N use by tundra plants. Oecologia. 107, 386-394.
Roussell,A., 1936. Sandnes and the neighbouring farms. , C.A. Reitzel, IOabenhavn.
Schimel,J.P., Kielland,K., Chapin III,F.S., 1996, Nutrient availability and uptake by tundra plants in: Reynolds J.F., Tenhunen J.D. (Eds.), Landscape hnction and disturbance in Arctic tundra, Springer-Verlag, Berlin, pp. 203-221.
Schulze,E.D., III,F.S., Gebauer,G., 1994. Nitrogen nutrition and isotope differences among life forms at the northern treeline of Alaska. Oecologia. 406-412.
Sutoh,M., Obara,Y., Miyamoto,S., 1996. The effect of sucrose supplementation on kinetics of nitrogen, ruminal propionate and plasma glucose in sheep. J. Agric. Sci. 126, 99-105.
Wainright,S.C., Haney,J.C., Kerr,C., Golovkin,A.N., Flint,M.V., 1998. Utilization of nitrogen derived from seabird guano by terrestrial and marine plants at St. Paul, Pribilof Islands, Bering Sea, Alaska. Mar. Biol. 13 I, 63-71.

Welker,J.M., Jonsdottir,l.S., Fahnestock,J.T., 2003. Leaf isotopic (delta C-I 3 and delta N-15) and nitrogen contents of Carex plants along the Eurasian Coastal Arctic: results from the Northeast Passage expedition. Polar Biol. 27, 29-37.
CHAPTER 6 STABLE NITROGEN ISOTOPIC EXAMINATION OF NORSE SITES I N T H E WESTERN SETTLEMENT OF GREENLAND
6.1 Abstract
In this study we continue to explore the affect of past human activity on the stable
nitrogen isotope ratios of modem vegetation by examining the F"N of plants now
growing on another suite of Norse farmsteads, some 400krn north of the study areas
previously examined. Again, we found a clear isotopic signature that is directly correlated
to activity areas on these farms, and especially for the ancient infields. The magnitude of
the plant 6 1 5 ~ values was found to be similar for the two study areas, indicating that the
same interpretative framework can be applied in widely separate geographic regions.
Also, very different plant species were found to give the same information. These
observations provide further information on the applicability of this new tool.
6.2 Introduction
At the end of the tenth century the Norse founded two settlements in southwest
Greenland: the so-called Eastern Settlement, and the more northern Western Settlement.
These were pastoral farming communities in which most farms were located along the
relatively warm inner-fjords and in the low valleys. Even in these areas, climatic
conditions were such that cereal crops could not be brought to maturity and thus farming
The following chapter is under review in the Journal of Archaeological Science under the co-authorship of R.G. Comniisso and D.E. Nelson.
centered on livestock: primarily sheep, goats, and cattle (McGovem, et al., 1988). These
most distant European settlements persisted for several centuries before they were finally
abandoned. Historic documents and the archaeological record indicate that the Western
Settlement was the first abandoned in the second half of the 14Ih century, and the Eastern
Settlement later, by about the mid 1 5'h century (Arneborg, 2004).
We recently reported the results of a series of empirical studies in which we
examined the stable nitrogen isotope ratio ( 6 1 5 ~ ) of plants now growing on several Norse
farms in the Eastern settlement (Commisso and Nelson, 2006, 2007, in press). We had
postulated that in areas where humans had discarded 1 5 ~ enriched organic materials, the
impact of this anthropogenically introduced-nitrogen would somehow be reflected in the
of plants now growing there. The data obtained clearly confirm this, as grass
specimens taken from a variety of features at each of the farms had F ' ~ N values that were
markedly higher than those of grasses growing on the surrounding naturally formed soils.
This isotopic impact was directly correlated to spatially-defined activity areas with
differences detected over distances of as little as a metre.
These first tests demonstrate the potential for this natural phenomenon to be used
as a non-invasive tool to identify and delineate past human activity. The data in hand also
show that the signature can provide functional information for archaeological features. As
an example, it is difficult to explain the above-natural 6% values found for plants on the
infields of the Norse farms without presuming active and persistent fertilization of the
fields in the past (Commisso and Nelson, 2007, in press).
There are a number of natural processes that can alter the isotopic composition of
nitrogen both in soils and the plants themselves (excellent reviews are given in Handley
and Scrimgeour, (1997) and Hogberg (1997)). Thus, the exact source of the very high
plant 6"N values is not h l ly understood. Yet, we observed a recurring pattern in which
the 6 1 5 ~ for plants from like features were found to be approximately the same from farm
to farm (Cornrnisso and Nelson, inpress). Further, these values were consistent with the
6 " ~ of the materials expected to have been deposited at these locales in the past. In these
contexts then, the high 6 ' ' ~ plant values are best explained by the strong conservation of
the isotopic composition of the introduced-nitrogen in the local soil system. These
observations suggest that this isotopic effect may be general in nature, and one might
then expect the same patterning and magnitude of values in other regions.
The goal of this present study was to test this proposition by moving some 400km
north and examining the 6I5N values for plants now growing on Norse farmsteads in the
Western Settlement. The questions addressed were: I ) Would we find the same general
isotopic effect for the plants growing on these sites, and if so; 2) Would the magnitude of
the plant 6 1 5 ~ values, both on-site and in the natural setting, be similar to that found in
the Eastern Settlement. Conclusions for either would provide further information on the
applicability and constraints of this new tool, and would specifically address whether
interpretations would require a 're-calibration' to reflect the circumstances of different
regions.
In the summer of 2004, we systematically collected plants from five Norse farms
in the Western Settlement. The farms studied are in the Ameragdla fjord region which is
east-southeast of the city of Nuuk (Fig 6.1). Four are coastal farms, located along the
fjord, and the fifth is a short distance inland (=; 2kn1). The farms range in size, from a
very large church farm which was likely the religious and political centre for this region,
to a very small one in which caribou and seal hunting may have been the primary
economic focus.
Previously we were able to obtain samples from various spatially-defined features
for which the function was relatively well known, but here the sampling contexts were
much more limited. Many of the features of these farms had been previously excavated or
were so poorly-defined that specific activity areas could not be identified with any
certainty. Yet, a common feature which we could reasonably identify and which have
also lain undisturbed since abandonment was the ancient infields. Sampling thus focused
on these features and a few specimens were taken from other contexts for more general
inference.
Plant selection was limited to a few grass species to ensure the data were
generally comparable to those of the Eastern Settlement. We did however obtain a few
samples of a deciduous shrub (Salix glauca), both on- and off-site, to get a first estimate
of how the F ' ~ N values of these plants may differ from those of the grasses.
6.3 Sampling and measurement methodology
Sampling, both on-site and in natural areas, consisted of collecting the above-
ground portions of an individual plant at each sampling locale. Species selection was
constrained by those present, but we were able to limit the grasses collected to three
species: Festuca bruchyphylla, Poa arctica, and Calumagrotis langsdorfii. We had
collected these same grass species in the Eastern Settlement and at the present level of
analysis did not find that the variation in the 6 ' ' ~ values of the specimens was a result of
a species effect (Commisso and Nelson, 2007). As such, we treat all grasses as a single
!PUP.
In the lab, 4 to 8 basal leaves were selected from the Festuca brachyphylla and
Poa arctica specimens, and 1 or 2 stem leaves from the Calamagrotis Iangsdor-f-i
specimens. For the Salix glauca, 6 to 8 leaves were taken from a single branch. The
leaves were air-dried, cleaned with ultra-pure water, dried again under vacuum and then
ground to a fine powder in a ball mill. About 4mg of the powder were sealed in an
analytical tin capsule. Stable nitrogen isotope measurements were made by CFIRMS
(Europa Scientific 20-20) at a commercial laboratory (Iso-analytical Limited, Sandbach,
UK). To ensure quality control, each analysis run included International standards (IA-
ROO1 (wheat flour) traceable to IAEA-N-1 (ammonium sulphate)), IAEA-N-2
(ammonium sulphate)), a calibrated laboratory grass sample (#2842, traceable to JAEA-
N-I), and blind repeat samples. The laboratory quotes an instrumental measurement
precision of *0.2 '% (at one standard deviation). This was verified by blind repeat
measurements. As in our previous studies we estimate measurement error at about *0.5%0
(discussed in Commisso and Nelson (2006, 2007)).
6.4 Natural vegetation
Grasses growing on naturally formed soils in the inner-fjord region of the Eastern
Settlement have values in the range -2.7!?60 to 4.6%0, with an average value of 1.1*1.8%0
(Commisso and Nelson, 2007). These values are consistent with other published data for
graminoids at high latitudes (Michelsen, et al., 1998; Nadelhoffer, et al., 1996; Schulze,
et a1 ., 1994; We1 ker, et al., 2003), and we expected similar values would be found for
'natural' grasses in this study area. To confirm this, we collected 35 grass specimens
I23
fi-om arbitrarily selected locations across the region where there were no indications of
human impact. We also collected 10 'natural' samples of Salix glauca to get a first
estimate of the range of values for these deciduous shrubs. For direct measure of possible
species difference, at 8 of the locations where we collected Salix glauca, a grass
specimen was also taken (plants were within 30cm of each other).
The range of values obtained for the natural grasses was -3.4 to 5.2%0, with an
average and standard deviation of 1.4*2.1 %o. These values are not significantly different
(>0.5 Student's T-test) than those of the natural samples from the Eastern Settlement. In
both data sets most values fall between -2 to 3%0 with a few having values as great as
-5%o.
The few deciduous shrub samples (Salix glauca) had much lower values than
those of the grasses. The range was -4.9 to 0.7%0, with an average and standard deviation
of -2.3*1.8%0. The degree to which the F ' ~ N values differed between these plant types
was clearly evident at the paired locations. At each location where a grass and Salix
specimen was taken, the Salix had a value ~2 to 8%0 lower than that of the respective
grass sample (Fig 6.2).
6.5 Farms studied and results for the samples taken
The farms studied are located short distances from each other, either by land or
water. For the purposes of this paper we refer to the farms by the traditional site
designations as it is used in the referenced literature, rather than the current numerical
designations. As noted, these farms range in size, and there are also considerable
differences in the setting and layout. Brief descriptions of each farm are provided below,
but in general, V5 1 (the church farm), V59, and V52 are located on landscapes and have
a layout which can be considered typical of most Norse farms in Greenland. In
comparison, the farms V48 and V52a are somewhat unusual. Both are situated in
locations that at first appearances do not seem to be favourable for farming. We present
the results obtained for the typical farms first, and then turn to these unusual farms.
6.5.1 V51 (Sandnes)
This farm is located on a large alluvial plain at the head of the Ameragdla fjord. It
was likely a political and religious centre, as it was not only the largest farm in the region
but also the only one with a church (the church ruins are currently below the high tide
line) (McGovern, 1985). The farm has been investigated several times and all of the main
buildings (the unattached dwelling and two cattle byelbarns) were excavated, as well as
portions of the midden (Bruun, 1928; McGovern and Jordan, 1981 ; Roussell, 1936). A
finding from the latter was significantly higher ratio of cattle bones as compared to other
farms in this region (McGovem and Jordan, 1982). The ability of this farm to maintain
large number of domesticates, particularly cattle, is evidenced by two large byrelbarns,
and the surrounding alluvial plain, which potentially may have formed a very large
infield. Additionally, a large, low valley to the north would have provided extensive
grasslands for grazing.
Grass samples were collected along two transects arbitrarily placed across what
was believed to have been the infield of this farm. The first of these (Transect A)
extended from a point a few metres north of one of the byrebarns, out across the plain to
a distance of 100m. Samples were taken at 1 Om intervals on this transect. The second
transect (Transect B) was placed about 25 metres west of the other barnbyre and
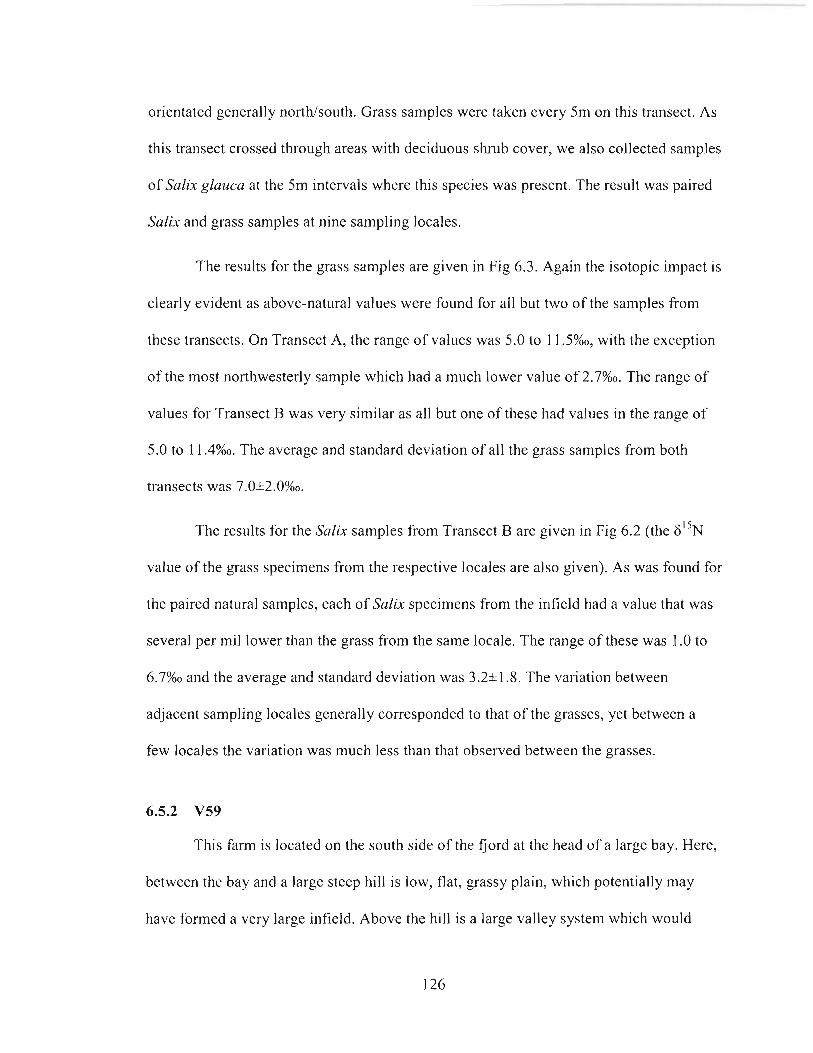
orientated generally northkouth. Grass samples were taken every 5m on this transect. As
this transect crossed through areas with deciduous shrub cover, we also collected samples
of Salix glauca at the 51n intervals where this species was present. The result was paired
Salix and grass samples at nine sampling locales.
The results for the grass samples are given in Fig 6.3. Again the isotopic impact is
clearly evident as above-natural values were found for all but two of the samples from
these transects. On Transect A, the range of values was 5.0 to 1 1.5%0, with the exception
of the most northwesterly sample which had a much lower value of 2.7%0. The range of
values for Transect B was very similar as all but one of these had values in the range of
5.0 to 11.4%0. The average and standard deviation of all the grass samples from both
transects was 7.0*2.0%0.
The results for the Salix samples from Transect B are given in Fig 6.2 (the
value of the grass specimens from the respective locales are also given). As was found for
the paired natural samples, each of Salix specimens from the infield had a value that was
several per mil lower than the grass from the same locale. The range of these was 1.0 to
6.7%0 and the average and standard deviation was 3.2=t1.8. The variation between
adjacent sampling locales generally corresponded to that of the grasses, yet between a
few locales the variation was much less than that observed between the grasses.
6.5.2 V59
This farm is located on the south side of the fjord at the head of a large bay. Here,
between the bay and a large steep hill is low, flat, grassy plain, which potentially may
have formed a very large infield. Above the hill is a large valley system which would
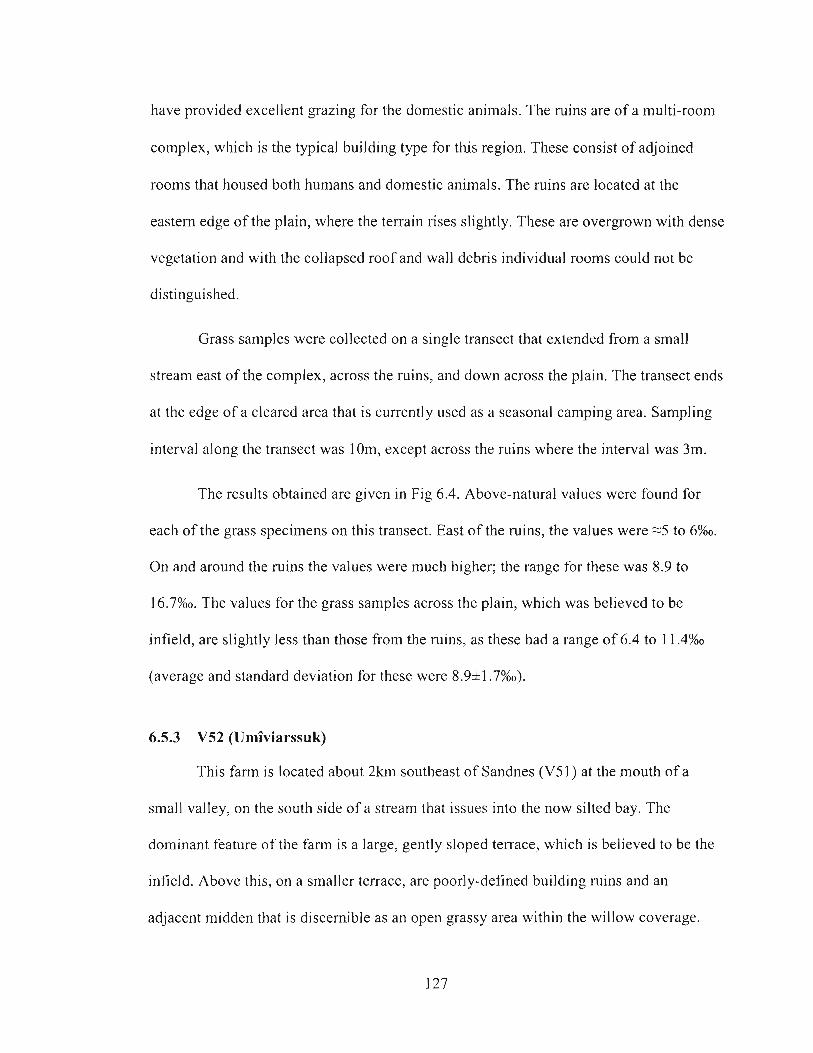
have provided excellent grazing for the domestic animals. The ruins are of a multi-room
complex, which is the typical building type for this region. These consist of adjoined
rooms that housed both humans and domestic animals. The ruins are located at the
eastern edge of the plain, where the terrain rises slightly. These are overgrown with dense
vegetation and with the collapsed roof and wall debris individual rooms could not be
distinguished.
Grass samples were collected on a single transect that extended from a small
stream east of the complex, across the ruins, and down across the plain. The transect ends
at the edge of a cleared area that is currently used as a seasonal camping area. Sampling
interval along the transect was 1 Om, except across the ruins where the interval was 3m.
The results obtained are given in Fig 6.4. Above-natural values were found for
each of the grass specimens on this transect. East of the ruins, the values were -5 to 6%0.
On and around the ruins the values were much higher; the range for these was 8.9 to
16.7%0. The values for the grass samples across the plain, which was believed to be
infield, are slightly less than those from the ruins, as these had a range of 6.4 to 1 1.4%0
(average and standard deviation for these were 8.9*1.7%0).
6.5.3 V52 (Umiviarssuk)
This farm is located about 2km southeast of Sandnes (V51) at the mouth of a
small valley, on the south side of a stream that issues into the now silted bay. The
dominant feature of the farm is a large, gently sloped terrace, which is believed to be the
infield. Above this, on a smaller terrace, are poorly-defined building ruins and an
adjacent midden that is discernible as an open grassy area within the willow coverage.
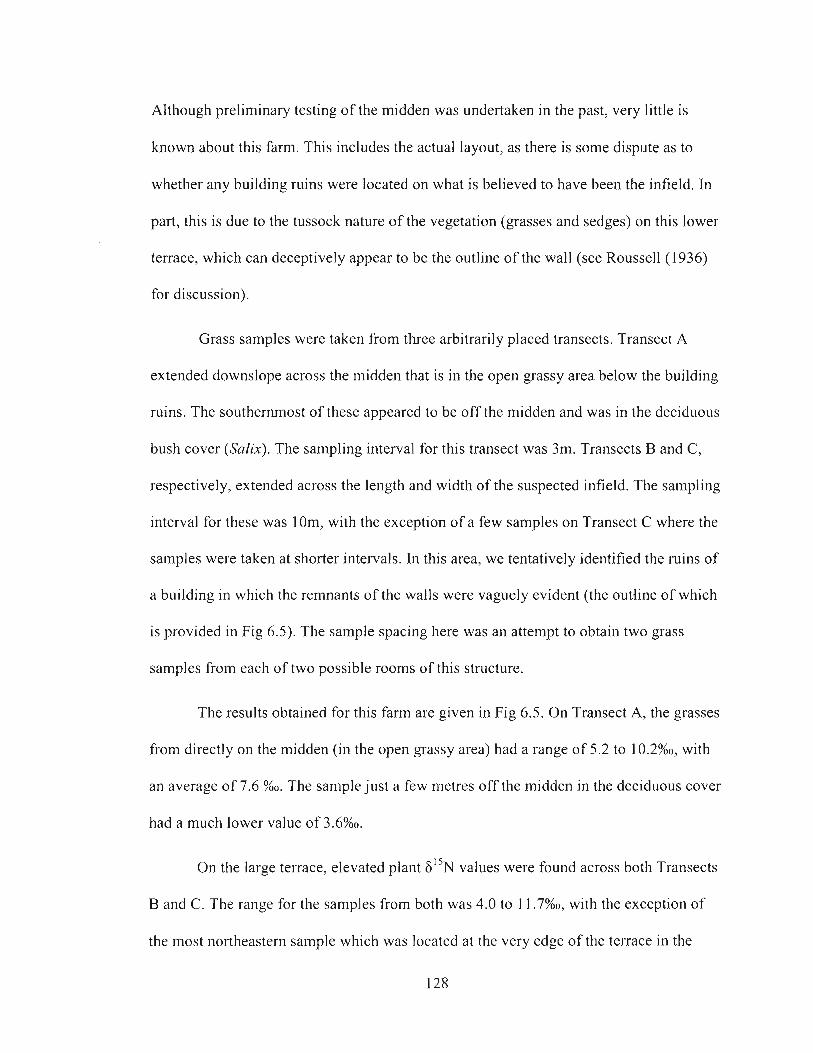
Although preliminary testing of the midden was undertaken in the past, very little is
known about this farm. This includes the actual layout, as there is some dispute as to
whether any building ruins were located on what is believed to have been the infield. In
part, this is due to the tussock nature of the vegetation (grasses and sedges) on this lower
terrace, which can deceptively appear to be the outline of the wall (see Roussell (1 936)
for discussion).
Grass samples were taken from three arbitrarily placed transects. Transect A
extended downslope across the midden that is in the open grassy area below the building
ruins. The southernmost of these appeared to be off the midden and was in the deciduous
bush cover (Salix). The sampling interval for this transect was 3m. Transects 3 and C,
respectively, extended across the length and width of the suspected infield. The sampling
interval for these was 1 Om, with the exception of a few samples on Transect C where the
samples were taken at shorter intervals. In this area, we tentatively identified the ruins of
a building in which the remnants of the walls were vaguely evident (the outline of which
is provided in Fig 6.5). The sample spacing here was an attempt to obtain two grass
samples from each of two possible rooms of this structure.
The results obtained for this farm are given in Fig 6.5. On Transect A, the grasses
from directly on the midden (in the open grassy area) had a range of 5.2 to 10.2%0, with
an average of 7.6 %o. The sample just a few metres off the midden in the deciduous cover
had a much lower value of 3.6%0.
On the large terrace, elevated plant 6 " ~ values were found across both Transects
B and C. The range for the samples from both was 4.0 to 1 1.7%0, with the exception of
the most northeastern sample which was located at the very edge of the terrace in the
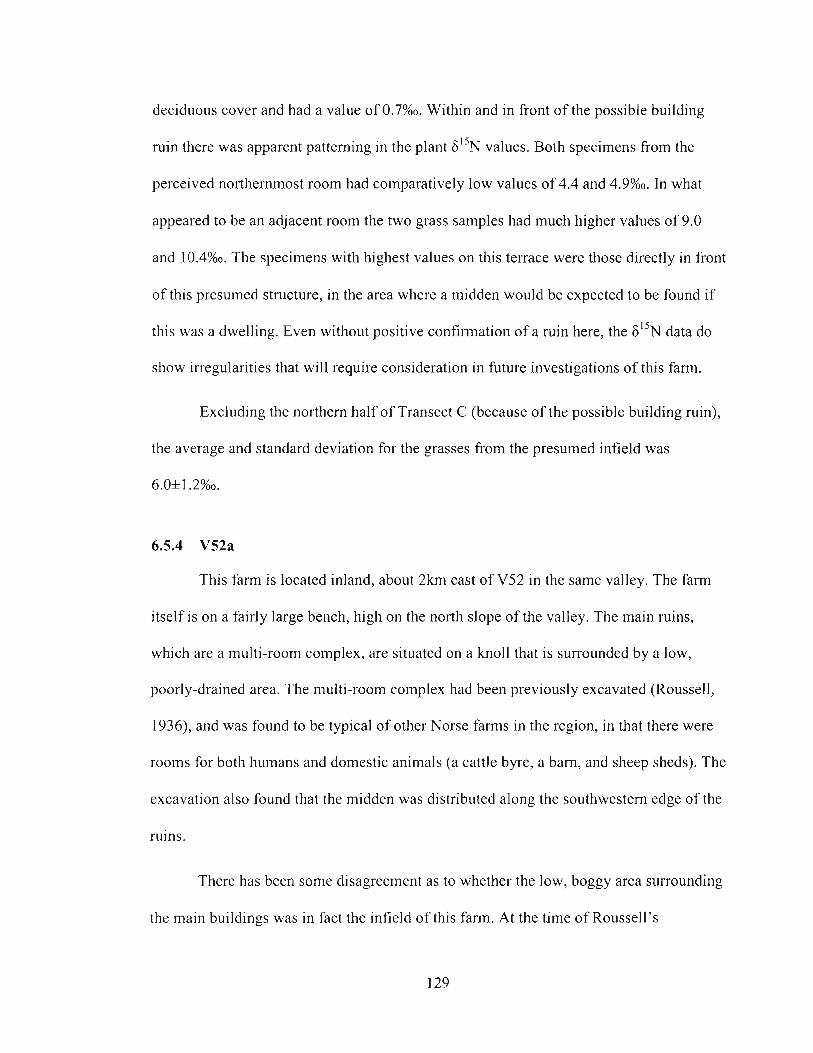
deciduous cover and had a value of 0.7%0. Within and in front of the possible building
ruin there was apparent patterning in the plant F ' ~ N values. Both specimens from the
perceived northernmost room had comparatively low values of 4.4 and 4.9%0. In what
appeared to be an adjacent room the two grass samples had much higher values of 9.0
and 10.4%0. The specimens with highest values on this terrace were those directly in front
of this presumed structure, in the area where a midden would be expected to be found if
this was a dwelling. Even without positive confirmation of a ruin here, the F ' ~ N data do
show irregularities that will require consideration in future investigations of this farm.
Excluding the northern half of Transect C (because of the possible building ruin),
the average and standard deviation for the grasses from the presumed infield was
6.0*1.2%0.
6.5.4 V52a
This farm is located inland, about 2krn east of V52 in the same valley. The farm
itself is on a fairly large bench, high on the north slope of the valley. The main ruins,
which are a multi-room complex, are situated on a knoll that is surrounded by a low,
poorly-drained area. The multi-room complex had been previously excavated (Roussell,
1936), and was found to be typical of other Norse farms in the region, in that there were
rooms for both humans and domestic animals (a cattle byre, a barn, and sheep sheds). The
excavation also found that the midden was distributed along the southwestern edge of the
ruins.
There has been some disagreement as to whether the low, boggy area surrounding
the main buildings was in fact the infield of this farm. At the time of Roussell's
investigation in the 1930's the vegetation cover in this low area was primarily mosses,
and he had concluded that this area was not an infield (Roussell, 1936). McGovern
visited the site later (McGovern and Jordan, 1981), and like ourselves, found this to be
rich wet-meadow covered in tall grass. Although not typical of other infields, we believed
this low area to be the most likely locale for the infield, as the terrain is steeply sloped
and there seemed no other explanation for the placement of the buildings, on a knoll
surrounded by a low, wet area, if the latter was not to be utilized as an infield.
West of the main farm buildings is another knoll on which there are the ruins of a
stone-built structure. The loose stone-built construction and location of this building
suggest it was a storage house (Roussell, 1936).
Grass samples were taken on two arbitrarily placed transects. Transect A,
extended from the northern edge of the knoll on which the main ruins sit, southwest
through the excavated stable, down the knoll and across where the midden would be
located, and then across the presumed infield. Sampling interval was 5m on this transect,
except for odd spacing at the stable to obtain samples in this building. Transect B was
placed southeast of the main ruins and extended 100m across the low-lying area, again
presumed to be infield. Three grass samples were taken from the storage building. As it
was built on bed-rock there was only a small amount of vegetation growing inside the
walls. One grass specimen was taken from inside and two more just outside the southwest
wall.
The results are given in Fig 6.6. On Transect A, above-natural values were found
for the grass specimens taken around the main ruins and also for those just off the knoll
in the location of the midden. The exception to this was the two samples from within the
stable which had significantly lower values (2.9 and 4.6%0) than the adjacent specimens
outside this building.
Approximately 15m southeast of the ruins and further across the presumed infield,
the values of the samples were within the range of those of the natural samples
(range for these was 0.2 to 4.2%0). The other infield samples from Transect B also had
values within the natural range (range of 0.7 to 4.8%0), with one exception which had a
value of 6.1 %o.
Above-natural values were found for each of the samples taken from the within
and outside the storage building. The range for these was 6.2 to 8.0%0.
6.5.5 V48 (Niaqussat)
This farm, as compared to others in the region, is unusual. The ruins, which
consist of a poorly defined multi-room complex, are situated on the eastern edge of a
small, sloping hollow formed between two rock outcrops. To the north are steep, rocky
slopes. With the exception of this small hollow, there is very little pasturelgrazing land
around this farm. Another distinguishing characteristic is that the midden of this farm was
found to contain a much higher percentage of wild fauna remains than those of other
farms in the region. Given these characteristics, it has been suggested that the main
economic focus of this site was caribou and seal hunting rather than farming
(Schledermann, 1976).
Due to the poor conditions of the ruins and some recent disturbance of the midden
deposits, sampling contexts at this site were limited. Yet, if this farm had an infield it
would necessarily have been situated in the hollow even though much of this is currently
overgrown by deciduous shrubs. We collected grass samples along a transect that ran
downslope approximately through the centre of the hollow.
The results obtained are given in Fig 6.7. The 6I5N of the grass specimens on the
northern half of the transect, highest on the slope, ranged between 0.9 to 4 . 7 % ~ ~ These
values are within the range of the natural samples. The specimens from the lower half of
the transect had much higher values. For these the range was 4.6 to 8.4%0 (average and
standard deviation of 6.7*1.3%0).
6.6 Discussion
6.6.1 The isotopic effect
As for the sites in the Eastern Settlement, the data obtained clearly show the effect
past human activity has on modem plant 615N values. At each of the farms we found
grass specimens with values that were markedly higher than those of grasses growing on
naturally formed soils in this region. For some specimens the values were several
standard deviations higher than the average of the natural samples. Even though there
were few well-defined contexts from which the plant specimens were collected, the
isotopic impact was unmistakably correlated to ancient activity areas on these farms. In
each case where the sample was from the ruins of a structure or a midden, the specimens
had 6I5N values that were well above those of the natural grasses. The few circumstances
where adjacent samples were taken on and off these features, again demonstrates that the
isotopic impact reflects differences at metre scale distances, as large variation in 6I5N
was observed between these samples.
At each of the coastal farms, above-natural values were also found across those
areas considered to be infields. As in our previous studies (Commisso and Nelson, 2007,
in press) we can only explain the unnaturally high values by the introduction of ' S ~
enriched nitrogen sources into the soil in the past. Given the spatial extent and
consistency in which the unnatural values were observed, it is unlikely that this was the
result of accidental deposition. Rather the most likely explanation for the observed data is
that these areas were managed infields and the isotopic signature in the modem plants
reflects the purposeful application of ''N enriched sources of fertilizer in the past.
The consistency with which we have observed "N enriched plants on Norse
infields in both settlements shows that fertilizing must have been a common field
management practice. Importantly, this is seen for farms of various size and status,
including the small farm of V48. Even though the faunal assemblage fiom this site
indicates caribou and seal hunting was perhaps the primary economic focus, the isotopic
data show that at least a portion of the arable land was fertilized, and that pastoral
farming still formed a component of this farm's economy.
The isotopic data for the infield at V52a stand in contrast. The grass specimens
taken across the presumed infield of this farm had an average value of 2.0?4!; an average
only slightly higher than that of the natural vegetation and several per mil lower than
those of the other infields. We considered that the high water content of this area could
account for the comparatively low values. Mineralized nitrogen (NO3 and NH4) is
soluble, and over the centuries any nitrogen added to the infield through fertilizing may
have been transported in solution from the soils. Although this is a feasible explanation,
the data from the midden suggest that this process cannot fully account for the relatively
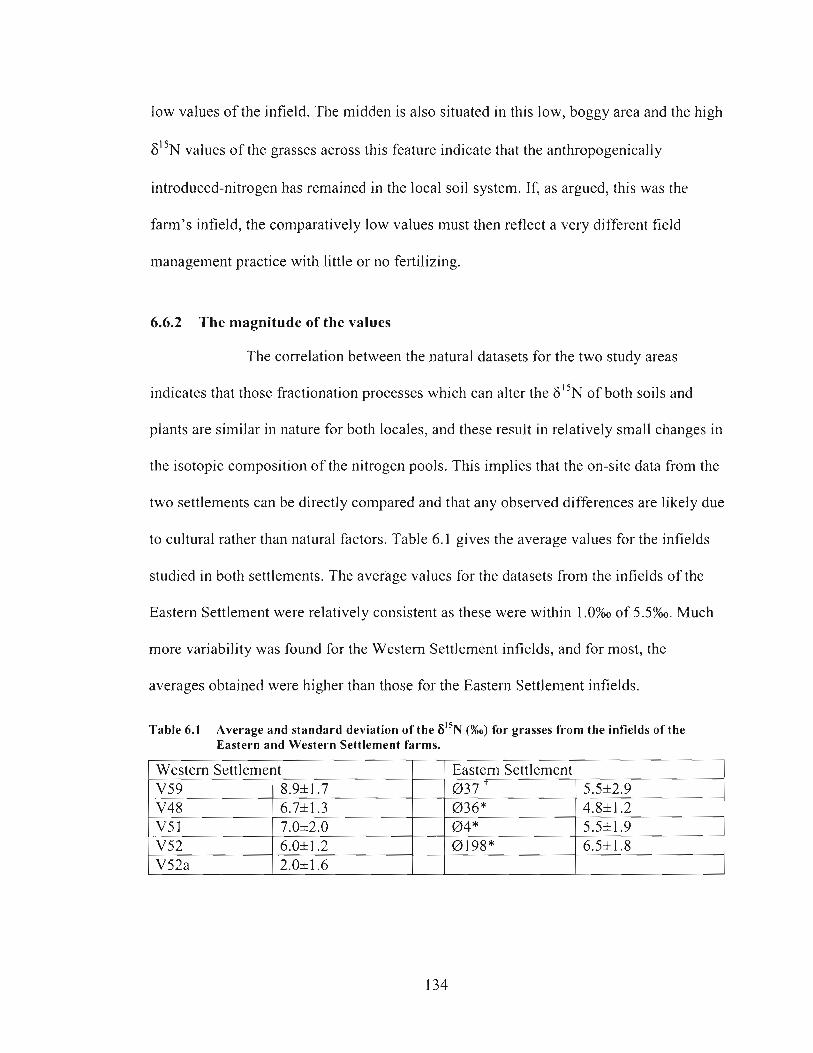
low values of the infield. The midden is also situated in this low, boggy area and the high
6 ' ' ~ values of the grasses across this feature indicate that the anthropogenically
introduced-nitrogen has remained in the local soil system. If, as argued, this was the
farm's infield, the comparatively low values must then reflect a very different field
management practice with little or no fertilizing.
6.6.2 The magnitude of the values
The correlation between the natural datasets for the two study areas
indicates that those fractionation processes which can alter the 6 ' ' ~ of both soils and
plants are similar in nature for both locales, and these result in relatively small changes in
the isotopic composition of the nitrogen pools. This implies that the on-site data from the
two settlements can be directly compared and that any observed differences are likely due
to cultural rather than natural factors. Table 6.1 gives the average values for the infields
studied in both settlements. The average values for the datasets from the infields of the
Eastern Settlement were relatively consistent as these were within 1.0%0 of 5.5%0. Much
more variability was found for the Western Settlement infields, and for most, the
averages obtained were higher than those for the Eastern Settlement infields.
Table 6.1 Average and standard deviation of the (%o) for grasses from the infields of the Eastern and Western Settlement farms.
Western settlement- V59 ( 8.9*1.7
Eastern Settlement 0 3 7 1 5.5h2.9
The patterns observed at the Eastern Settlement farms indicate that the magnitude
of the plant 6I5N values reflects both the 6j5N of the introduced-nitrogen and the amount
admixed into the soil (Commisso and Nelson, in press). As such, the comparatively
higher values and variation found for the Western Settlement infields may indicate that
individual farms utilized different sources of fertilizer, or that the amount of fertilizer
applied varied considerably between farms. We cannot yet say which factor or whether a
combination of the two has resulted in the apparent differences, although the data for
V52a suggest that the latter may be the more the likely source of the variation. Of
particular import though, is the comparative nature of the data. These results indicate that
the same interpretative framework can be used even for widely separated geographic
regions, and that the magnitude of the plant 6 " ~ values can provide important cultural
information.
6.6.3 Species effect
The paired grass and Salix specimens importantly show that the isotopic effect is
not limited to a particular plant type. As shown in Fig 6.2, the 6I5N values for these plant
types were markedly different. At each sampling locale, both on- and off-site, the Salix
specimens had values several per mil lower than those of the respective grasses. The
comparatively lower values of deciduous shrubs as compared to grasses have been
observed elsewhere (Michelsen, et a]., 1998; Nadelhoffer, et al., 1996; Schulze, et al.,
1994), but significant to this study is the I5N enrichment found for both plant types on the
infield. For the Salix glauca, the average value of the natural specimens was -2.4%0, and
the average for those from the infield was 3.2%0. The paired grasses had an average value
of 1.5%0 in the natural setting, and those from infield had an average value of 6.9%0.
Thus, the differences between the average values on- and off-site for these two plant
types were 5.6%0 and 5.4%0, respectively. The strong correlation in the relative amount of
15 N enrichment clearly indicates that the same information can be obtained even for very
different plant species. Of note, is that whereas the general amount of ' 5 ~ enrichment was
similar for these two plant types, much less variability was found between the adjacent
Salix glauca samples than the grass specimens. This may be due to the much wider
rooting system of these shrubs which are likely integrating N from a larger area than that
of the grasses.
6.7 Conclusions
With these data we can now state with certainty that this isotopic effect is not a
regional phenomenon. The concept has been tested in two widely separated areas and an
evident isotopic signature was found in both. It is apparent that this natural phenomenon
is broadly present, and predictably in Greenland where human activity in the last 600
years has resulted in the deposition of ' 5 ~ enriched nitrogenous substances, non-natural
plant values should be found. Whether this isotopic signature will be found on sites
of greater antiquity remains unknown, but it is anticipated that it will be, given the
strength of the signature on the sites studied thus far.
The off-site data from the two regions show that the magnitude of the 6 1 5 ~ for
similar plant species is directly comparable and that same interpretative framework can
be applied. Even without a thorough understanding of the exact source of the isotopic
signature the observed variability provides apparent information that must reflect
differences in cultural practice. Here, the regularity in which unnaturally high values
are found on the infields shows that fertilizing was a common practice for the Norse in
136
Greenland. Yet, the differences in the average values, especially the very low values
found at V52a, somehow represent real variability in this practice. Future assessment of
the relative sustainability of farming practices both at the local and regional levels will
need to take this isotopic data in to consideration.
Further information on the applicability of the tool was obtained from the paired
grass and Salix glauca specimens. The correlation in the relative amount of ' 5 ~
enrichment for both shows that the effect is not restricted to a specific plant type and that
the same general information can be obtained. Given the heterogeneity of the vegetation
cover on archaeological sites this is an important finding for future application.
These findings again show that continued study of this natural phenomenon may
lead to a very useful tool in archaeology.
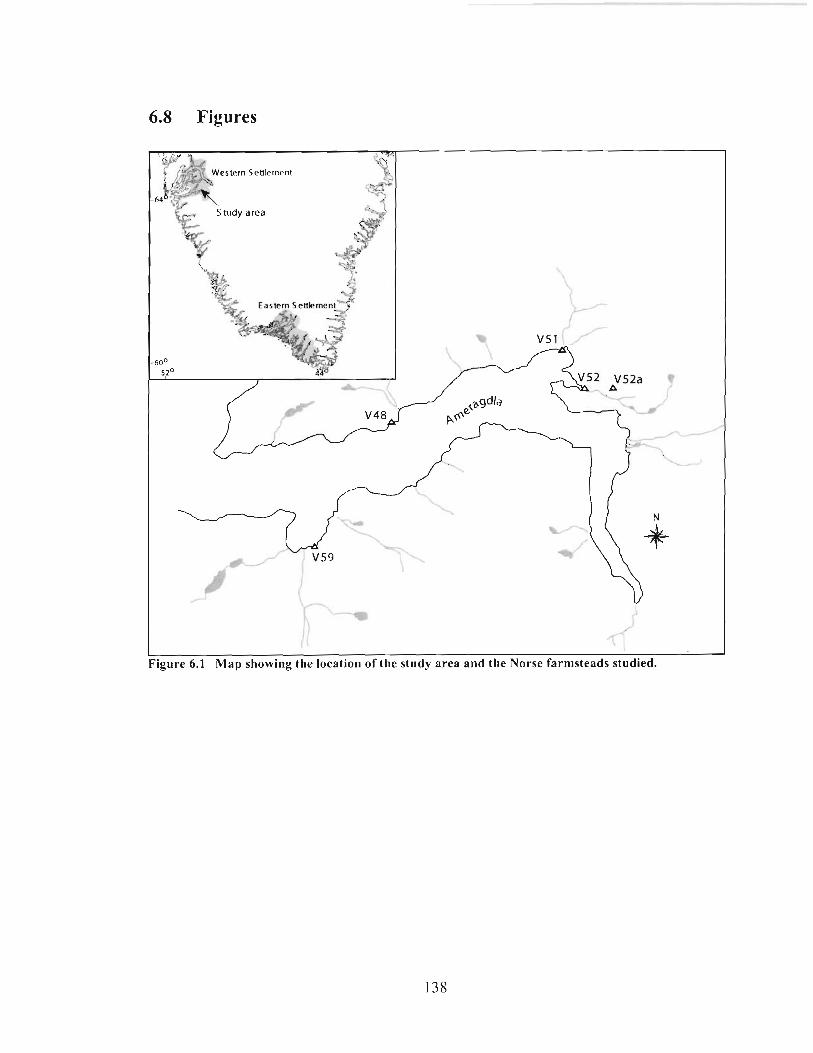
6.8 Figures
Figure 6.1 Map showing the location of the study area and the Norse farmsteads studied.
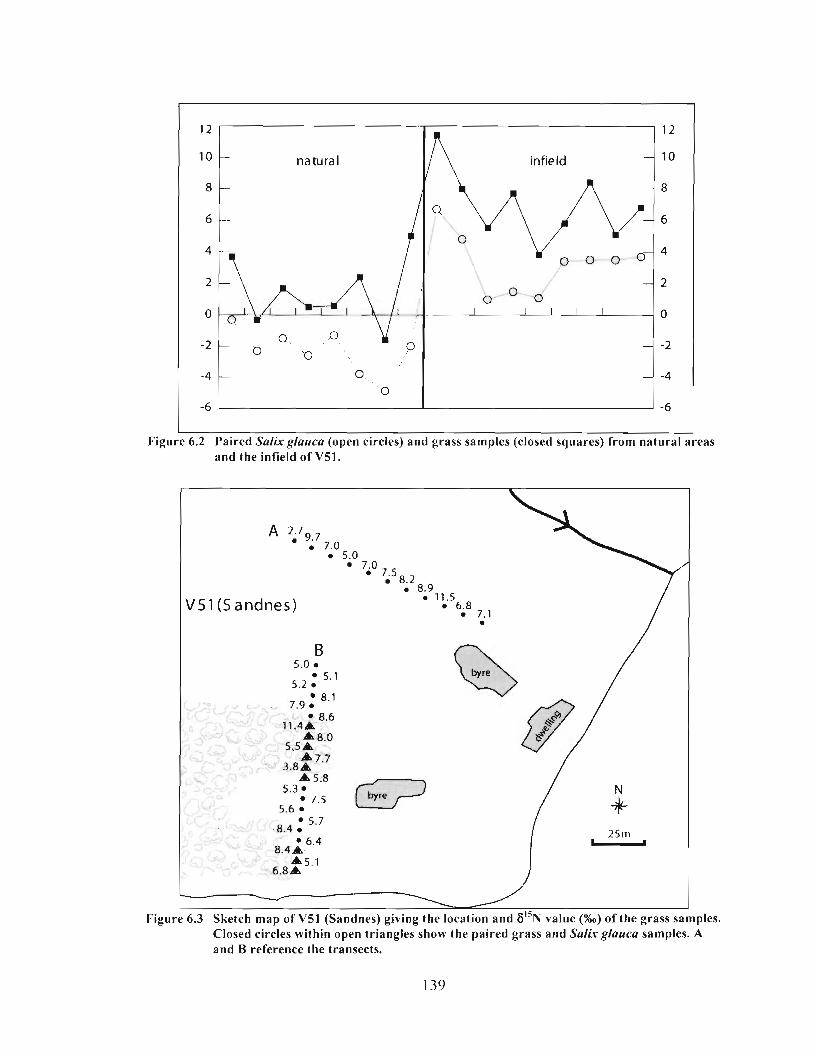
- natural I\-] infield ::
Figure 6.2 Paired Salixglauca (open circles) and grass samples (closed squares) from natural areas and the infield of V51.
V 5 1 ( S andnes)
Figure 6.3 Sketch map of V51 (Sandnes) giving the location and 6''~ value (%) of the grass samples. Closed circles within open triangles show the paired grass and Salrjrglauca samples. A and B reference the transects.
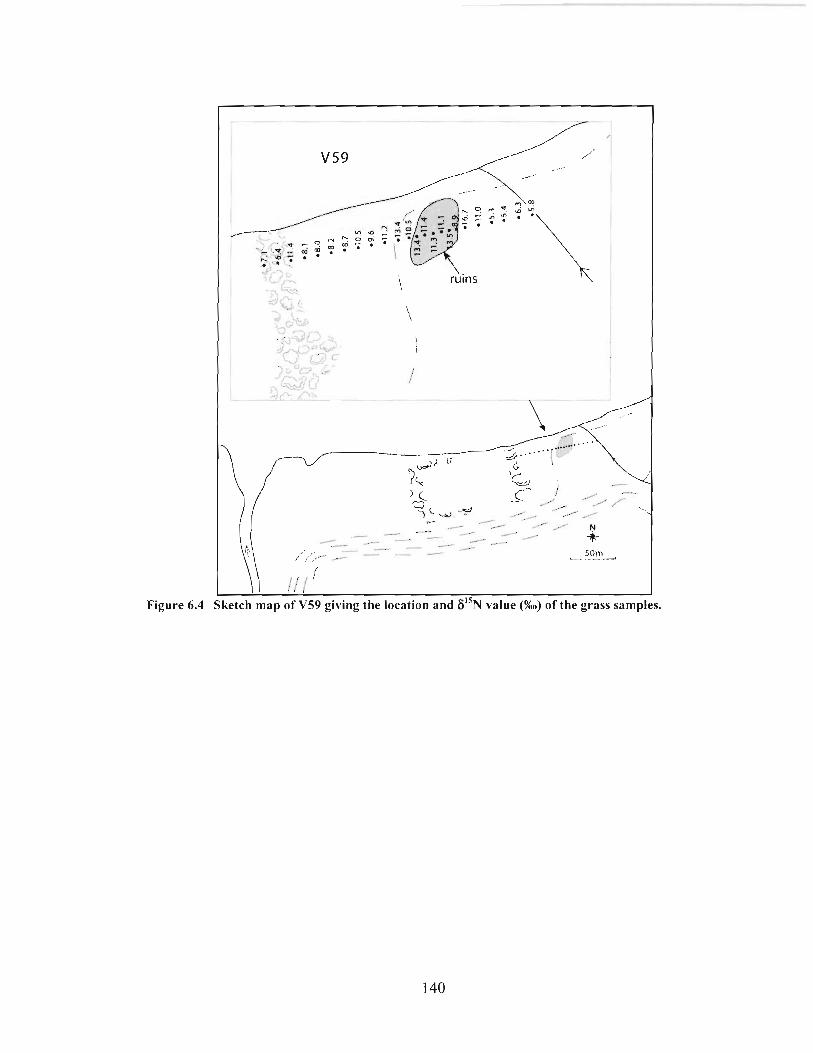
Figure 6.4
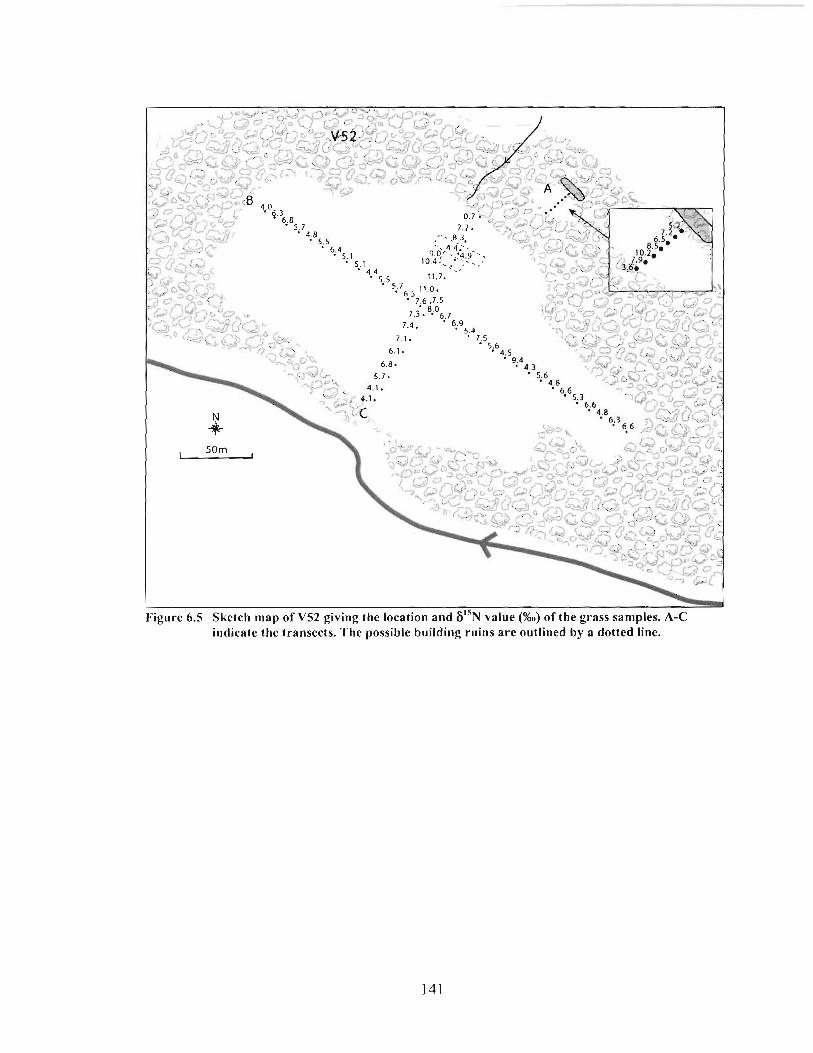
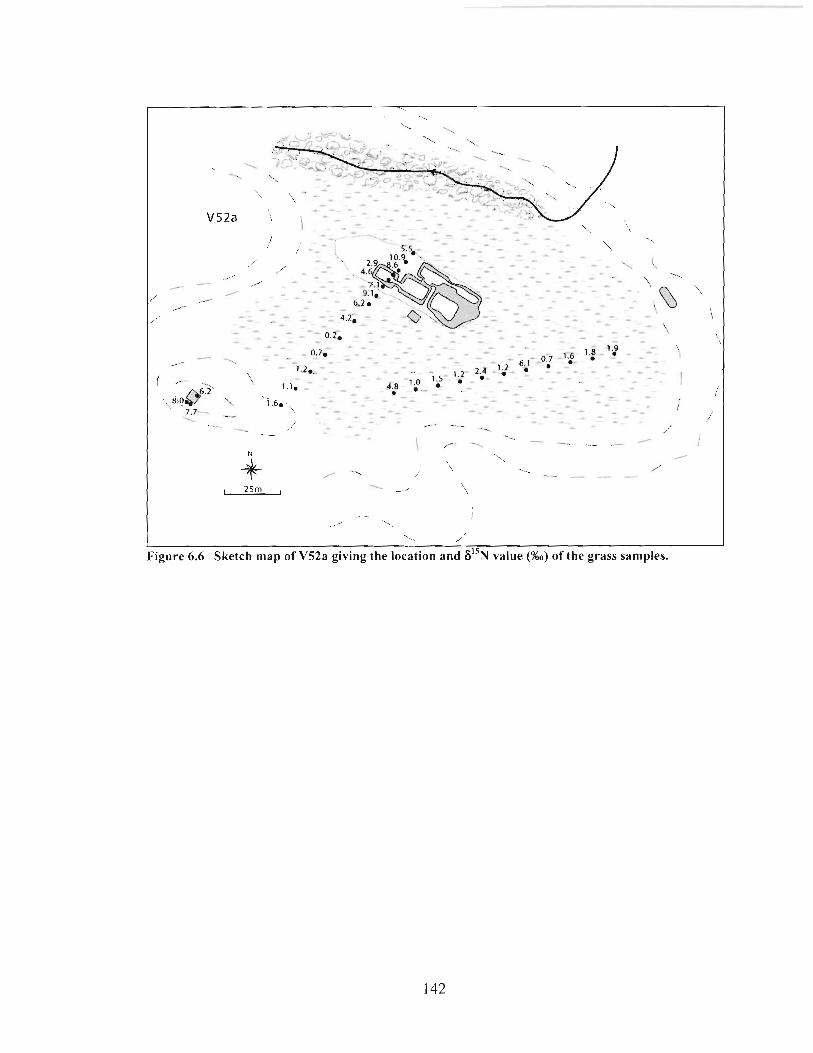
..--/ -1%
.I. Figure 6.6 Sketch map of\%?a giving the location and 6 ' ' ~ value (%o) of the grass samples.
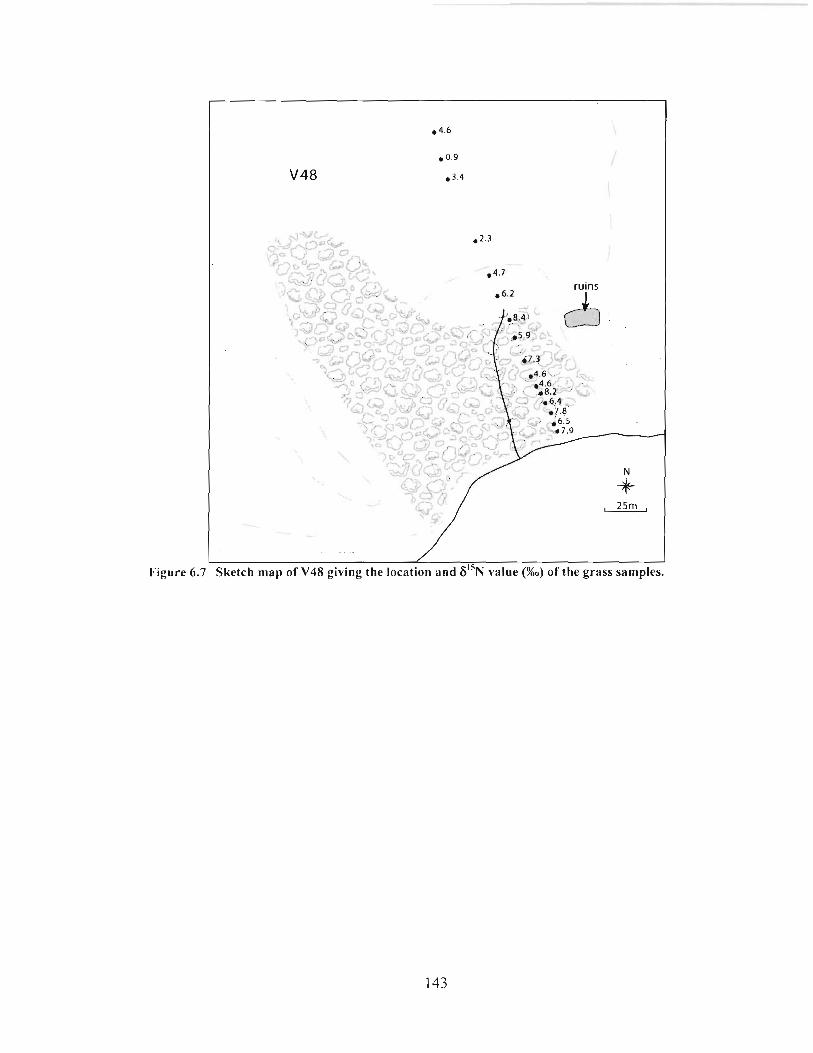
Figure
6.9 Reference list
Arneborg, J., 2004, Nordboerne i Grsnland in: Gullrav H.C. (Ed.), Grsnlands forhistorie, 1. udg ed., Gyldendal, Ksbenhavn, pp. 221 -272.
Bruun, D., 1928. Fortidsminder og nutidshjem paa Island. Gyldendal, Nordisk forlag, Copenhagen.
Commisso, R.G., Nelson, D.E., 2006. Modern plant values reflect ancient human activity. Journal of Archaeological Science 33, I 167-1 176.
Cornmisso, R.G., Nelson, D.E., 2007. Patterns of plant 6I5N values on a Greenland Norse farm. Journal of Archaeological Science 34,440-450.
Commisso, R.G., Nelson, D.E., In Press. Correlation between modem plant 6"N values and activity areas of Medieval Norse farms. Journal of Archaeological Science (2007) doi: 10.1016/j.jas.2007.05.012
Handley, L.L., Scrimgeour, C.M., 1997. Terrestrial plant ecology and I5N natural abundance: The present limits to interpretation for uncultivated systems with original data from a Scottish Old Field. Adv. Ecol. Res. 27, 133-212.
Hagberg, P., 1997. "N natural abundance jn soil-plant systems. New Phytol. 137, 179- 203.
McGovern, T.H., Bigelow, G., Arnold, T., Russell, D., 1988. Northern islands, human error, and environmental degradation: A view of social and ecological change in the Medieval North Atlantic. Human Ecology 16, 225-270.
McGovern, T.H., Jordan, R., 1981. Report on the 1981 inner fjord survey, Gothaab District, Greenland. Manuscript of file National Museum of Greenland, Nuuk.
McGovern, T.H., 1985. Contributions to the paeleoeconomy of Norse Greenland. Acta Archaeologica 54,73-122.
McGovern, T.H., Jordan, R.H., 1982. Settlement and land use in the inner fjords of Godthaab District, West Greenland. Arctic Anthropology 19, 63-80.
Michelsen, A., Quarmby, C., Sleep, D., Jonasson, S., 1998. Vascular plant ' 5 ~ natural abundance in heath and forest tundra ecosystems is closely correlated with presence and type of mycorrhizal fungi in roots. Oecologia 1 15,406-41 8.
Nadelhoffer, K., Shaver, G., Fry, B., Giblin, A., Johnson, L., McKane, R., 1996. ' 5 ~
natural abundances and N use by tundra plants. Oecologia 107, 386-394.
Roussell, A,, 1936. Sandnes and the neighbouring farms. Meddelelser om Grsnland 88 (2).
Schledermann, P., 1976. The Inuit/Norse project. Report to The Canada Council.
Schulze, E.D., Chapin Ill , F.S., Gebauer, G., 1994. Nitrogen nutrition and isotope differences among life forms at the northern treeline of Alaska. Oecologia 406- 41 2.

Welker, J.M., Jonsdottir, I.S., Fahnestock, J.T., 2003. Leaf isotopic (delta C-13 and delta N-15) and nitrogen contents of Carex plants along the Eurasian Coastal Arctic: results from the Northeast Passage expedition. Polar Biol. 27, 29-37.
CHAPTER 7 SUMMARY AND CONCLUSIONS
7.1 Overview
This empirical study began with the simple and somewhat unlikely postulate that
in circumstances where humans had discarded I5N enriched organic materials in the past,
the distinctive nitrogen isotopic ratio of these materials would somehow be reflected in
the 6 1 5 ~ values of the plants currently growing on the deposits. The data obtained clearly
confirm this postulate. At each of the archaeological sites studied unnaturally high 6I5N
values were found for the plants now growing there; despite the sites being in widely
separated regions and of varying ages. The unusual values were directly correlated to
spatially defined archaeological features which remain clearly evident at the sites today.
As the nature of many of these features is known from previous archaeological research,
not only the patterning but the magnitudes of the 615N values could be evaluated relative
to their function. Consistent explanations were found for the data, both for features in
which highly ' 5 ~ enriched nitrogen sources had been deposited (i.e. midden deposits
containing large accumulations of high trophic level marine animal remains) and even for
those where it can reasonably be assumed that the nitrogen deposited was from terrestrial
sources, such as in the domestic animal stables and pens. Of particular importance was
that the magnitude of the plant F"N values for functionally-like contexts was very
similar, and these values were correlated to the expected 6I5N of the nitrogen deposited at
these locales in the past.
These observations lead to the simple but somewhat surprising conclusion that
despite the complexity of soil nitrogen cycling, the isotopic composition of the nitrogen
deposited centuries ago has been strongly conserved in the local soillplant system and
that this has not moved more than a few tens of centimetres since it was deposited. The
primary importance of this conclusion to archaeology, is that the discipline now has a
new, non-invasive tool to identify and delineate past human activity on the landscape.
Further, the magnitude of the plant values may also provide information on the
nature of those activities.
As noted in the introduction, the original intent of this study was to make
empirical observations to determine whether an isotopic effect could be found, and if so,
to begin to provide a fi-amework for a new tool in archaeology. Yet, it was found that the
data also contained important cultural information. The study thus ended with two
components: the testing and development of the technique, and a basic application of the
tool to demonstrate the extent to which the tool has application in archaeology. The
following first outlines the framework for the method and then turns to the cultural
information for the Greenland Norse.
7.2 Methodological framework
At the outset of this study there were several basic questions which could not be
answered from the current knowledge of 6 1 5 ~ in plant/soil systems.
Would an isotopic signature be found and if so, would it be limited to specific
contexts? For example, would the signature only be evident in circumstances
where very ''N enriched nitrogen was deposited?
Would the isotopic effect be spatially limited?
What influence would time have on the signature?
Would the isotopic effect only be evident for certain plant species?
To what extent would natural fractionation processes alter the signature in the
archaeological contexts?
Comprehensive answers to these questions were beyond the scope of the study,
but as is summarized in the beginning of this chapter, definitive answers were obtained
for a few and first responses for the others. The following outlines what is now known
about the isotopic effect and discusses the basis, applicability, and potential limitations of
the tool.
7.2.1 Source of the isotopic effect
The data from each of the archaeological sites provide compelling evidence that
the isotopic composition of the nitrogen deposited centuries ago has remained locally
conserved in the soillplant system. And, it is the conservation of the isotopic signature
which results in the above-natural 6 ' 5 ~ of the plants now growing on these sites. These
conclusions result from several lines of evidence:
1 . Comparison of the measured values for the anthropogenic features with those
from the surrounding landscape.
2. The very high spatial correlation of the isotopic data with the defined features.
3. The similarity of the average plant 6 ' 5 ~ values for functionally-like features.
4. The correlation of the values with the expected 6'" of the materials deposited
within the different contexts.
5. The observations from different sampling years, which show that the average
value of the plant specimens for an individual feature remains consistent despite
differences in growing conditions.
This apparent conservation of the introduced-nitrogen in the soil system does
however stand in contrast to the results expected from consideration of nitrogen cycling
and isotopic fractionation, as discussed in Chapter 2. A first attempt to resolve this
contradiction is needed, beginning with isotopic fractionation.
7.2.2 Fractionation processes
In the introduction to this study much discussion centred on various fractionation
processes and the potential for these to alter the isotopic composition of the
anthropogenically introduced-nitrogen. Yet, the data obtained in this study show that
these processes have a relatively minor affect, and any fractionation resulting from these
processes is small. Nevertheless, there are a few examples where the 6 " ~ values of
individual plant specimens were at odds with the expected of the introduced-
nitrogen. These examples are difficult to explain without invoking significant
fractionation either at the time of deposition or during subsequent soil development.
The extent to which fractionation processes are contributing to the observed plant
6 " ~ values both in the natural system and the archaeological contexts is of critical
importance to the understanding of this isotopic effect. Beginning with the natural
system, the off-site grasses from each of the study areas were found to have very similar
values. The observed range for these was -3.4 to 5.2%0, which is consistent with data
from other high northern latitude regions (Hobbie et al., 2009; Michelsen et al., 1998;
Nadelhoffer et al., 1996; Schulze el al., 1994; Welker el al., 2003). Some of the variation
149
found in the natural system may be explained by differences in source nitrogen. The few
samples with values on the upper end of this range may represent localized deposition of
' 5 ~ enriched sources, perhaps through the incorporation of animal faeces or carcasses
into the soil system. On the other hand, those samples with values below that of
atmospheric nitrogen (< O%O) show that fractionation does occur locally in the soillplant
system. The observed differences in F"N within the natural system are thus more likely
the result of local fractionation processes rather than significant differences in 8 1 5 ~ of
source nitrogen. Whatever processes may be reflected in the data, of importance is that
the overall impact is relatively small, as most natural grass samples had values between
-2 to 3%0. Even at the few locations where the grass specimens had values outside this
range, the amount of fractionation is at most =5%0.
Whereas the amount of fractionation in the natural system is small, it was
considered that the very different physical and chemical properties of the anthropogenic
soils could result in much larger fractionation. This is examined by comparing the
variability of the data for those features which are most likely to have had an input of
nitrogen from a single source (i.e. the animal pens and stables in which the nitrogen
sources were largely from the dung of the animals) with that of the natural samples.
Table 7. I gives the average and standard deviation for each of the pens, stables,
and byresharns. The standard deviation provides a measure of the variability for each of
these features, and thus a rough estimate of the extent to which fractionation processes
may have altered the nitrogen source. Comparing the standard deviation for these features
with that of the natural samples shows that the variation within most of these features is
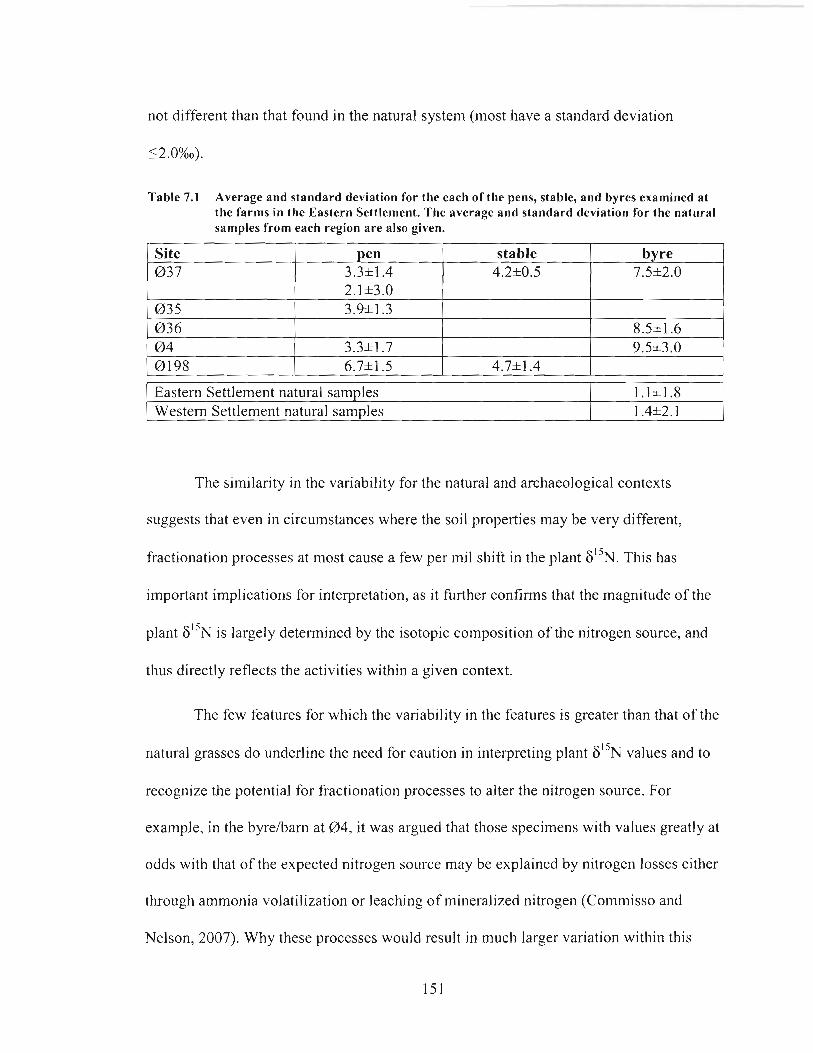
not different than that found in the natural system (most have a standard deviation
Table 7.1 Average and standard deviation for the each o l the pens, stable, and byres examined at the farms in the Eastern Settlement. The average and standard deviation for the natural samples from each region are also given.
/ Eastern Settlement natural samoles l.lk1.8
Site 0 3 7
The similarity in the variability for the natural and archaeological contexts
suggests that even in circumstances where the soil properties may be very different,
fractionation processes at most cause a few per mil shift in the plant 6 1 5 ~ . This has
pen 3.32t1.4 2.1*3.0
1 Western Settlement natural samples
important implications for jnterpretatjon, as it further confirms that the magnitude of the
1 .4*2.1
plant is largely determined by the isotopic composition of the nitrogen source, and
stable 4.2*0.5
thus directly reflects the activities within a given context.
byre 7.5*2.0
The few features for which the variability in the features is greater than that of the
natural grasses do underline the need for caution in interpreting plant F ' ~ N values and to
recognize the potential for fractionation processes to alter the nitrogen source. For
example, in the byreharn at 04 , it was argued that those specimens with values greatly at
odds with that of the expected nitrogen source may be explained by nitrogen losses either
through ammonia volatilization or leaching of mineralized nitrogen (Commisso and
Nelson, 2007). Why these processes would result in much larger variation within this

byre as compared to the other b y e s studied is unclear. But, the apparent differences
between these like features further highlights the need for careful examination of
fractionation processes in particular contexts given the consequences for archaeological
reconstruction.
7.2.3 Spatial resolution
It could be expected from the discussion in Chapter 2, that the introduced-
nitrogen may have moved significant distances through the soil system since the time of
deposition. But, the observed patterns indicate that this is not the case. At each site where
samples were taken beyond a defined feature or across very different activity areas, the
magnitudes of the plant 8 " ~ values show clear differentiation from one context to the
next. As these differences were observed over distances of a meter or two, it would
appear that the introduced-nitrogen has not moved more than a few tens of centimetres
from the point of deposition.
It remains uncertain just what spatial resolution can be obtained and detailed
sampling in accurately defined contexts is still needed to determine whether the
resolution is finer than the metre scale. Yet even at this scale, plant 6 1 5 ~ values provide a
relatively high degree of accuracy for the identification and delineation of activity areas.
This raises the real possibility of using the tool to guide excavation or other research
objectives. Certainly, in this study there were a few instances in which the plant 6 1 5 ~
values suggested the presence of features which were not readily evident from visual
examinations of the sites. Even without positive confirmation of such features, the
isotopic data strongly indicates that further investigation of these areas may produce very
interesting findings.
7.2.4 Species effect
As noted in the introduction, large differences in 6 1 5 ~ have been observed
between functionally different plants. This species effect is attributed to a number of
factors including: rooting depth, temporal acquisition of nitrogen, forms of nitrogen
assimilated, and the type of mycorrhizal association (Nadelhoffer el al., 1996). For the
purposes of the study - which included minimizing any possible species effect - sample
collection mainly focused on a few grass species. At the present level of analysis, there is
no apparent species effect between these grasses, nor between the few other graminoids
sampled (sedges and other grasses). This is consistent with other observations which
indicate that species which share functional traits tend to have relatively similar F ' ~ N
values (Michelsen et al., 1998).
As expected, very different 6 1 5 ~ values were observed for the few plant
specimens which were functionally different than the graminoids. In each circumstance
where either an ericaceous or deciduous shrub was taken fi-om the same locale as a
graminoid, the shrubs had significantly lower 8 1 5 ~ values than that of the respective
paired sample. This was observed both in the natural and archaeological contexts. The
same pattern has been observed elsewhere in the Arctic (Michelsen, et al., 1998;
Nadelhoffer, et al., 1996; Schulze, et al., 1994), but of importance to the discussion are
the of the ericaceous and deciduous specimens collected on-site. For both of these
plant types, the isotopic effect was clearly evident. The on-site specimens had F ' ~ N
values that were notably higher than those from the natural setting. At V5 1, the paired
data from the infield further show that the relative amount of ' 5 ~ enrichment in the
deciduous plants is equal to that of the grasses. Even though this is a first test of a limited
number of species it does show that the isotopic effect is not limited to specific plant
types. Rather, the results suggest that while the magnitude of the values may differ
between functionally different plant types the same information can be obtained.
This conclusion references the broad pattern, but of particular relevance for the
application of the tool, was the disparity in the level of ' 5 ~ enrichment at individual
sample locations. Both the Vaccinium specimens at Kujallerpaat, and the Salix at V5 I ,
showed much less variation between sampling locales than did the grass specimens. The
very different patterns for the respective species likely reflect differences in rooting, as
the shrubs may be assimilating nitrogen from a much larger area as well as from different
soil horizons. Again, this factor may have significant consequence for archaeological
reconstruction and the species effect needs careful examination particularly considering
the heterogeneity of the vegetation cover in some archaeological contexts.
7.2.5 The effect of time
Consideration of soil nitrogen cycling, as reviewed in Chapter 2, further
suggested that the isotopic signature of any introduced-nitrogen may diminish over time
as it was continually cycled through the soil/plant system. Again, the data show that this
is not the case within this study area. Rather, time appears to have had little or no effect
on the signature; at least at the centuries-long scale examined here.
Although it would be most informative to compare the signature for like features
of different ages in which the introduced-nitrogen would be presumably the same (i.e.
animal pens and stalls), this was not possible. Yet, general comparisons of similar
features give no indication that the signature has significantly changed over time. The
plant 6 1 5 ~ values of the Norse middens were as high as those from the Thule middens,
even though the former are at least two centuries older. Likewise, the values found for the
potentially older farms of the Western Settlement were not less than those of the Eastern
Settlement.
That time has had no apparent influence on the signature again emphasizes the
strong preservation of the 6 1 5 ~ of the introduced-nitrogen in the soillplant system. The
slow nutrient cycling, high nitrogen conservation, and low nitrogen input in this
environment (Nadelhoffer et al., 1996; Schimel et al., 1996) are likely determining
factors for the permanence of the signature.
It is noteworthy that the minimal affect time has on the isotopic signature has
been observed elsewhere at the centuries scale. Data from sea-bird rookeries which were
abandoned at different times in the past show a pattern of a slight decrease in the soil
615N values immediately after abandonment and then a stabilization of the values
(Mizutani et al., 1991). The initial decrease is thought to represent an initial loss of
nitrogen, as the large influx of nitrogen likely exceeds the capacity of the system. As the
soil system reaches a state of equilibrium, it is believed that the 6I5N values then
stabilize. If this interpretation is correct it would suggest that a signature could be
observed on archaeological sites of great antiquity in some environments. Given the
strength of the signature on the sites examined here, this can be reasonably expected for
Greenland, and perhaps other Arctic environments. Further, recent work by Shahack-
Gross et al. (in press) indicates that the isotopic effect may be measurable at a millennia
scale. In their study, F I ~ N measures of soils from 2000 year old Neolithic cattle
enclosures in Kenya showed significantly higher soil 6 1 5 ~ within the enclosures as
compared to beyond the site's perimeter. These findings suggest that this tool may have a
greater spatial and temporal application than first expected.
7.2.6 General considerations for the tool
The previous discussions largely centre on the strong conservation of the
introduced-nitrogen in the local soil system. Even though this appears to contradict the
general understanding of nitrogen cycling and isotopic fractionation, it can be understood
by the particular characteristic of the study area. As mentioned the slow nutrient cycling,
high nitrogen conservation, and low nitrogen input are likely determining factors for the
conservation of the signature in this environment. It is important to note though that the
isotopic effect is not limited to a specific region. It has now been observed at two widely
separated regions in Greenland, a high Arctic Thule site, and at several prehistoric sites
on Canada's Pacific coast (Commisso, 2002). Further, and as noted in the previous
section, soil 6 1 5 ~ measures in other archaeological contexts indicate that the effect may
be much more broadly present.
How widely applicable the tool may be is still unknown, and empirical tests are
needed to fully determine the geographic limits. Still, it is possible to predict some
environmental characteristics which may limit the application. As discussed in Chapter 5,
the signature is not only dependant on the conservation of the introduced-nitrogen, but
also the amount of anthropogenic nitrogen admixed into the soil, the size of the existing
soil nitrogen pools, and the respective 6 1 5 ~ of each. All of these factors will determine in
which circumstances I ) an isotopic signal can be observed, and 2) what cultural
information may be obtained.
The 6I5N values of the natural system may provide a first approximation of
applicability. The natural range of values within a given region will indicate which
sources of anthropogenically introduced-nitrogen may be identifiable. For this study, the
low values and small variability of the natural grasses provide a circumstance in which
even slightly I5N enriched sources of nitrogen (for example, the single trophic level shift
for the sheep and goat dung) were distinguishable from that of the natural system. In
warmer or more arid regions where the natural vegetation has much higher values
(Martinelli et al., 1999; Heaton, 1987), the method will likely be limited to the
identification of very "N enriched nitrogen sources. Yet, even these may not be detected
in such environments. Naturally high values are found for active systems which
have significant nitrogen loss. In these circumstances it can be expected that the
signature, if present, will only be evident for relatively short periods of time.
There may also be limited application in regions which have comparatively large
soil nitrogen pools, as the amount of nitrogen introduced into the soil through most
human activities may be too small to effectively alter the isotopic composition of these.
The level of anthropogenic impact needed to produce an isotopic signature that is distinct
from the natural background can be quantified through measures of the nitrogen
concentrations in naturally formed soils, but pre-determining when this will be the case
will be less straightforward. Obviously, many factors control the amount of nitrogen that
becomes incorporated into the soil system through particular human activities. It is thus
unlikely that one can predict where and when a detectable change in plant 6 1 5 ~ can be
found. Such determinations will likely need to be made through empirical observations.
Environments in which there is a continual influx of relatively large amounts of
nitrogen may also pose limitations for the tool. Nitrogen is added to the soil mainly
through biological fixation by a few classes of micro-organisms and through ammonia
gas and nitrates dissolved in precipitation (Brady and Weil, 1996). These processes vary
greatly between and even within ecosystems, and accordingly so does the annual nitrogen
input. Predictably, the continual input of large amounts of nitrogen will quickly dilute
any anthropogenic nitrogen sources. As such, there may be considerable variation in the
permanence of the signature between regions.
Of further importance to future application is the heterogeneity of within a
single plant. The approach taken here of measuring either a single stem leaf or several
leaves from a single plant gave a reasonable estimate of uncertainty of either *I %O or
*0.5%0, respectively. For this study, these uncertainties were small as compared to the
differences observed between the natural and archaeological contexts. But, future work
will require more careful consideration of sampling, particularly in circumstances where
small differences in between contexts may require quantitative statistical
comparisons.
7.3 Cultural information
7.3.1 Background
Over the last few decades much of the discussion of the Greenland Norse has
focused on the detrimental impacts of the Norse pastoral farming on the relatively fragile
environment of southwest Greenland (Amorosi et al., 1997; Barlow et al., 1997;
Berglund, 1986; Buckland et al., 1996; Fredskild, 1988; McGovern el al., 1988) and how
this environmental impact in combination with cooler climatic conditions and poor farm
management strategies likely resulted in the abandonment of these settlements
(McGovern, 2000). Whereas the negative impacts of Greenland Norse farming have been
examined in several studies, the conservation or management practices the Norse may
have undertaken during the settlement period have only begun to be specifically
addressed (for example, Adderley and Simpson, 2006; Schweger, 1998). However, we
can now add a substantial amount of isotopic data to these discussions which begin to
form a detailed view of Norse farming management practices both for the Eastern and
Western Settlements of Greenland.
The acquisition of a sufficient supply of fodder to over-winter stock would have
been a primary concern of Norse farmers to maintain domestic stocks over the long cold
winters; as it was through the historic period of Jceland and remains today for sheep
farms in southern Greenland (Eggertsson, 1998; Fredskild, 1988). The fodder collected
would need to be balanced against the number and composition of the stock and decisions
would have to be made in the fall as to how many animals could be kept for the yet
unknown length of the winter season (Amorosi et al., 1998). Low production levels or
miscalculations in the length of winter would have severe consequences and there are
fiequent historic examples that demonstrate the disastrous results (in Iceland an estimated
187, 000 sheep were lost during the cold spell of AD 1881 to 1883 (Eggertsson, 1998)).
Fodder production is thus key to understanding both the sustainability and perhaps the
failure of the Norse settlements in s re en land'.
5 The importance of fodder, economically, socially, and politically for the North Atlantic has been discussed by Amorosi et at. ( 1 998).
Quantitative estimates of the carrying capacity of both the Eastern and Western
Settlements have been made by Albrethsen and Keller ( I 986), McGovem et al. (1 988)
and Christensen (1991). In each, estimates of pasture productivity were derived from
production data of unfertilized, traditionally-managed hay fields of Icelandic farms and
modem pasture areas in southern Greenland. Even though the productivity estimates
differed between the studies, each model predicted short-falls in fodder production based
on the estimated number of stock kept on the individual farms6. In part, the discrepancy
between the estimated number of stock and the carrying capacity of pasture areas within
the examined regions likely underestimates fodder resources since neither high altitude
grazing nor alternative fodders such as seaweed7 or woody plants are considered in the
models. An alternative possibility is that the Norse were able to off-set the predicted
shortfalls by greatly increasing productivity levels on the infields surrounding the farms
(Albrethsen and Keller, 1986).
7.3.2 Previous evidence of fertilizing
Large-scale fertilizing does not appear to have been widespread during the early
medieval period, however there was both accidental and deliberate use of manure and
other organics in the North Atlantic to improve yields (Fenton, 1981 ; Simpson, 1997).
There is very little data to support an argument for deliberate manuring in Greenland,
although several researchers have suggested that the lush modem plant cover typically
evident on Norse farms is an indication that it was both practiced and resulted in
increased productivity over time (Arneborg, 1998; Fredskild, 1988; Krogh, 1967;
McGovern el al.'s (1988) model indicates that the shortfall would have been most pronounced on mid- sized farms in the cooling period after A D 1300. 7 The isotopic data from domestic animals does not support its use as a fodder (Buckland et al., 1996, D.E. Nelson, personal communication).
Schweger, 1998). Possible sources of fertilizers available to the Norse have been
discussed by Fenton (1 981). These include seaweed, fish, animal manure, and household
waste, and there is sparse evidence that at least a few farms were utilizing some of these
materials.
At 'The farm beneath the sand' (GUS), household debris, animal droppings and
turves were identified in soil cores taken up to -1 30m from the farm ruins. This mix of
materials is interpreted to represent the application of a plaggen type fertilizer (Schweger,
1998). Yet, as these deposits thin further from the buildings and there is a corresponding
decrease in soil nutrient content, it is argued that there was little consideration for
systematic fertilizing across the entire infield (Cameron, 2004).
The only other evidence of fertilizing has been found at the Western Settlement
church-farm of Sandnes where a small of amount of household debris was observed in
soils -200m from the ruins. But, it is unclear whether this material indicates deliberate,
widespread distribution of the midden deposits or simply the accidental spreading of
some household waste (McGovern et al., 1988).
There has been no attempt to identify seaweed manure in Greenlandic fields,
however, Dockrill et al. ( 1 996) and Simpson (1 997) have, in their respective studies of
Iron Age and Medieval fields in the Orkneys, tentatively suggested that the slightly lower
6 1 3 ~ soil values in some soil profiles provide some indication that seaweed was used as a
fertilizer. Whether its use as a fertilizer was known to the Greenland Norse is unknown
but, seaweed as fertilizer was used historically throughout the North Atlantic and i t is
plausible that i t was used earlier in Greenland.
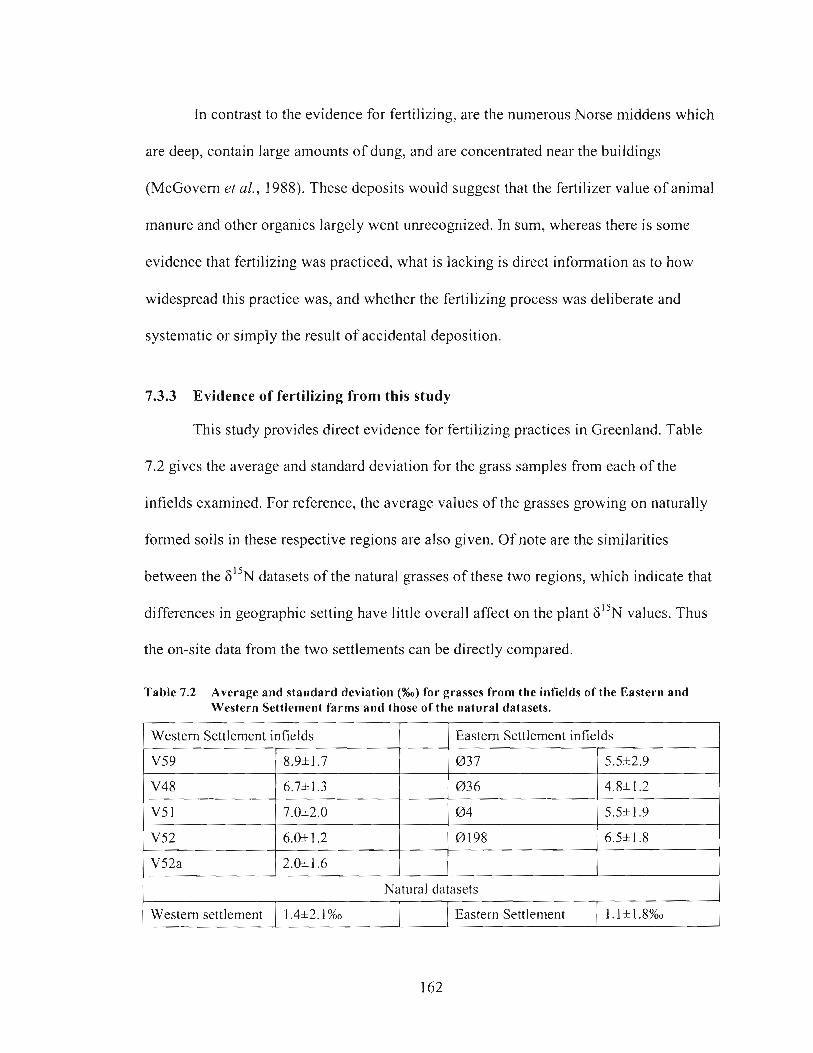
In contrast to the evidence for fertilizing, are the numerous Norse middens which
are deep, contain large amounts of dung, and are concentrated near the buildings
(McGovern el al., 1 988). These deposits would suggest that the fertilizer value of animal
manure and other organics largely went unrecognized. In sum, whereas there is some
evidence that fertilizing was practiced, what is lacking is direct information as to how
widespread this practice was, and whether the fertilizing process was deliberate and
systematic or simply the result of accidental deposition.
7.3.3 Evidence of fertilizing from this study
This study provides direct evidence for fertilizing practices in Greenland. Table
7.2 gives the average and standard deviation for the grass samples from each of the
infields examined. For reference, the average values of the grasses growing on naturally
formed soils in these respective regions are also given. Of note are the similarities
between the 6 1 5 ~ datasets of the natural grasses of these two regions, which indicate that
differences in geographic setting have little overall affect on the plant values. Thus
the on-site data from the two settlements can be directly compared.
Table 7.2 Average and standard deviation ( O h ) for grasses from the infields of the Eastern and Western Settlement farms and those of the natural datasets.
Western Settlement infields
Natural datasets
V59
V48
V5 1
V52
V52a
Eastern Settlement infields
Western settlement
8.9*1.7
6.7* 1.3
7.0*2.0
6.0* 1.2
2.0*1.6
037
0 3 6
0 4
0198
5.5h2.9
4.8* 1.2
5.5*1.9
6.5h1.8
1.4*2.1 %O Eastern Settlement I.l*l.S%o
With the exception of V52a, what is immediately apparent is that the average
values for the infield samples were markedly higher than that of the natural samples. In
the Eastern Settlement the averages ranged from 4.8 to 6.5%0. Those for the infields in the
Western Settlement were even higher with averages of 6.0 to 8.9%0. As previously
discussed, the very high plant 6 1 5 ~ values observed on the fields can only be explained
by a substantial alteration of the soil nitrogen pools through the addition of large amounts
of nitrogen or a more limited deposition of highly ' 5 ~ enriched nitrogen (Commisso and
Nelson, 2007, In press). Either scenario indicates some form of fertilization, and support
for this argument is found on modem and historical fields which show increased plant
F ' ~ N values with the application of organic manure (Bogaard et al., 2007; Choi et al.,
2003). Important, is that high plant 6 1 5 ~ values were consistently found across the fields,
which indicates that the fertilization process was deliberate rather than accidental. As
above-natural values were found for the infields in both settlements, it is further evident
that this practice was common and widespread.
The data from the infield of the farm V52a was notably different. With the
exception of two samples which had slightly elevated values, all were in the range of the
natural vegetation. If this was the infield, the isotopic data show that it was managed in a
very different way as the 6 1 5 ~ values show no indication of purposeful fertilization.
Although a certain amount of caution is needed in interpreting these results, the absence
of a consistent isotopic signature at this farm suggests that whereas most farms were
applying some form of fertilizer there were different approaches to field management.
Variability in field management practices may also be seen in the intriguing
differences between the settlements. The average values for the datasets from the infields
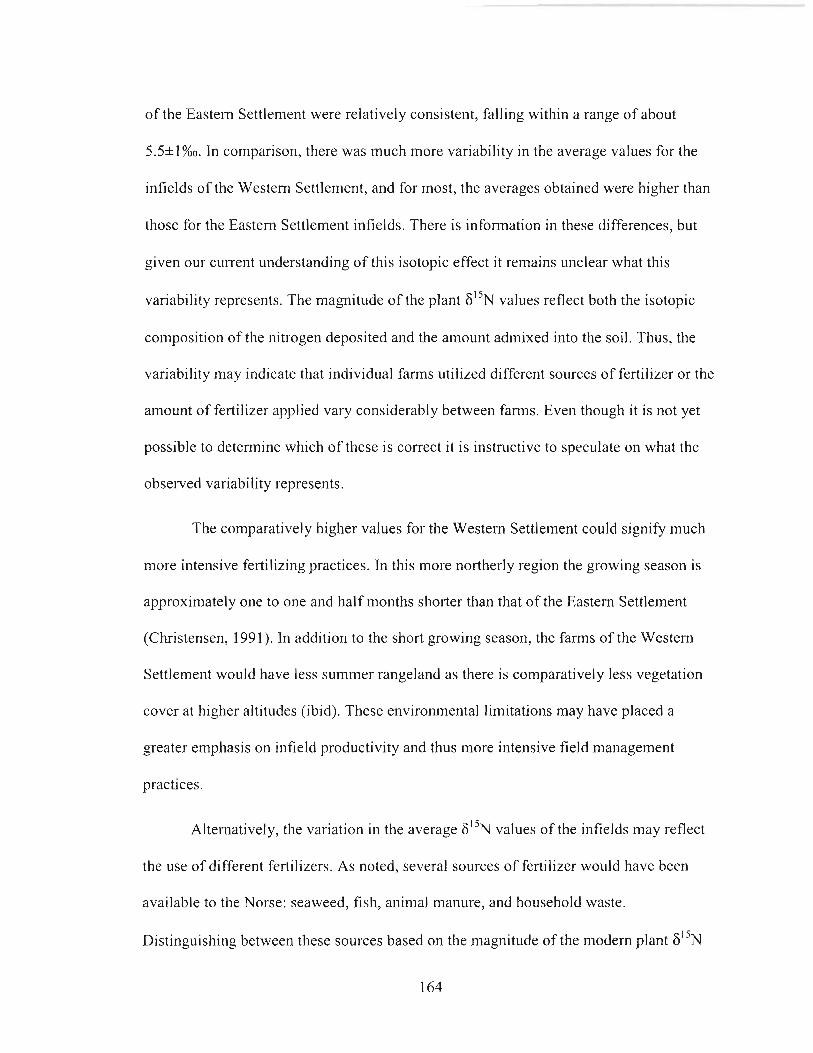
of the Eastern Settlement were relatively consistent, falling within a range of about
5.551 %o. In comparison, there was much more variability in the average values for the
infields of the Western Settlement, and for most, the averages obtained were higher than
those for the Eastern Settlement infields. There is information in these differences, but
given our current understanding of this isotopic effect it remains unclear what this
variability represents. The magnitude of the plant $'N values reflect both the isotopic
composition of the nitrogen deposited and the amount admixed into the soil. Thus, the
variability may indicate that individual farms utilized different sources of fertilizer or the
amount of fertilizer applied vary considerably between farms. Even though it is not yet
possible to determine which of these is correct it is instructive to speculate on what the
observed variability represents.
The comparatively higher values for the Western Settlement could signify much
more intensive fertilizing practices. In this more northerly region the growing season is
approximately one to one and half months shorter than that of the Eastern Settlement
(Christensen, 1991). In addition to the short growing season, the farms of the Western
Settlement would have less summer rangeland as there is comparatively less vegetation
cover at higher a1 ti tudes (ibid). These environmental limitations may have placed a
greater emphasis on infield productivity and thus more intensive field management
practices.
Alternatively, the variation in the average 8 ' 5 ~ values of the infields may reflect
the use of different fertilizers. As noted, several sources of fertilizer would have been
available to the Norse: seaweed, fish, animal manure, and household waste.
Distinguishing between these sources based on the magnitude of the modern plant
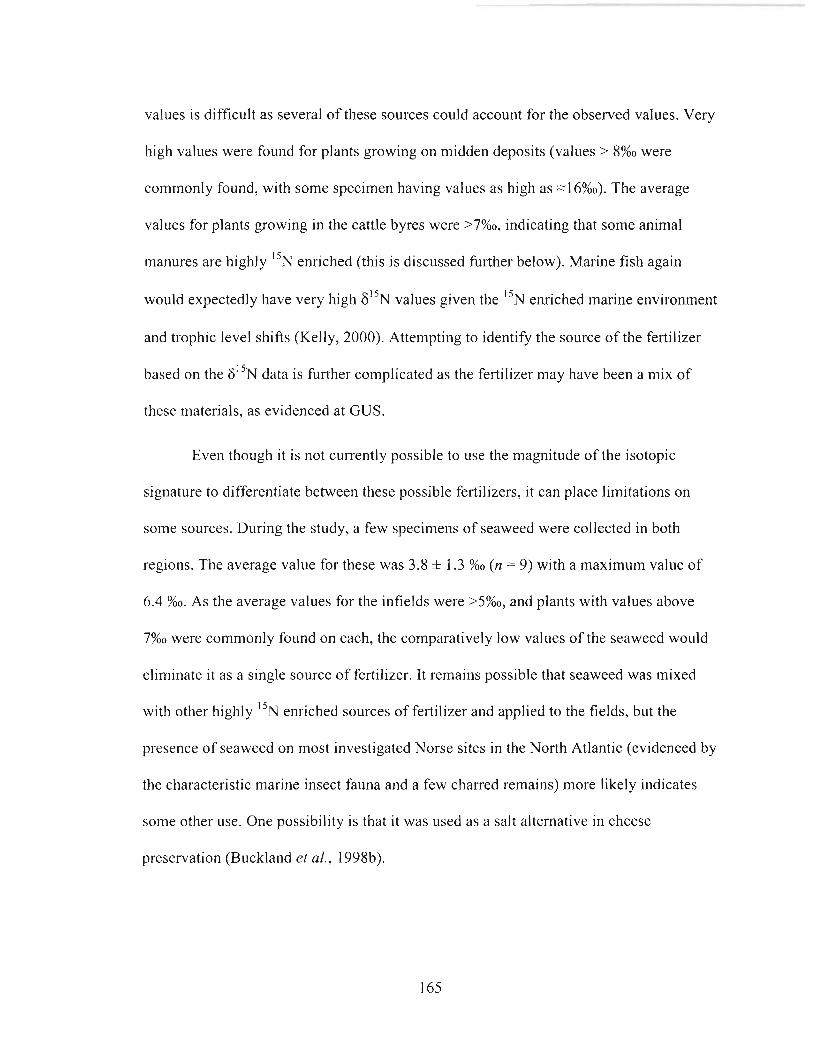
values is difficult as several of these sources could account for the observed values. Very
high values were found for plants growing on midden deposits (values > 8%0 were
commonly found, with some specimen having values as high as ~ 1 6 % 0 ) . The average
values for plants growing in the cattle b y e s were >7%0, indicating that some animal
manures are highly I5N enriched (this js discussed further below). Marine fish again
would expectedly have very high values given the "N enriched marine environment
and trophic level shifts (Kelly, 2000). Attempting to identify the source of the fertilizer
based on the F"N data is further complicated as the fertilizer may have been a mix of
these materials, as evidenced at GUS.
Even though it is not currently possible to use the magnitude of the isotopic
signature to differentiate between these possible fertilizers, it can place limitations on
some sources. During the study, a few specimens of seaweed were collected in both
regions. The average value for these was 3.8 I .3 %O (n = 9) with a maximum value of
6.4 %o. As the average values for the infields were >5%0, and plants with values above
7%0 were commonly found on each, the comparatively low values of the seaweed would
eliminate it as a single source of fertilizer. It remains possible that seaweed was mixed
with other highly ' 5 ~ enriched sources of fertilizer and applied to the fields, but the
presence of seaweed on most investigated Norse sites in the North Atlantic (evidenced by
the characteristic marine insect fauna and a few charred remains) more likely indicates
some other use. One possibility is that it was used as a salt alternative in cheese
preservation (Buckland el al., 1998b).
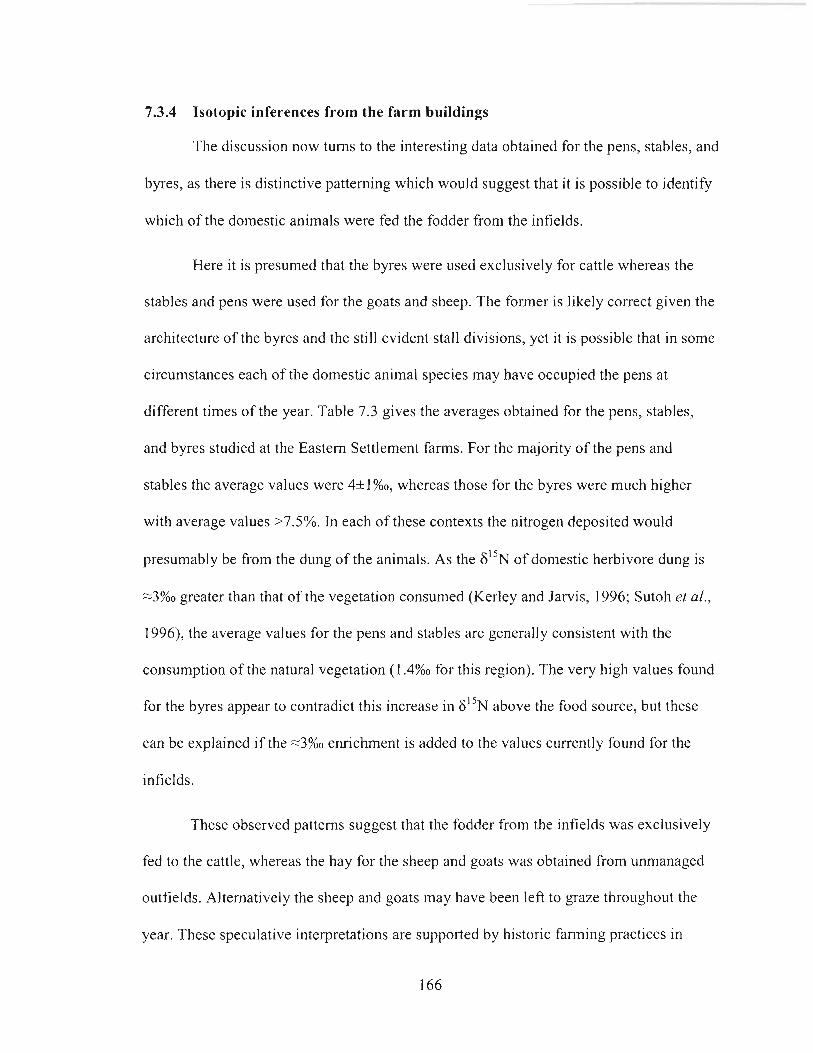
7.3.4 Isotopic inferences from the farm buildings
The discussion now turns to the interesting data obtained for the pens, stables, and
byres, as there is distinctive patterning which would suggest that it is possible to identify
which of the domestic animals were fed the fodder from the infields.
Here it is presumed that the byres were used exclusively for cattle whereas the
stables and pens were used for the goats and sheep. The former is likely correct given the
architecture of the byres and the still evident stall divisions, yet it is possible that in some
circumstances each of the domestic animal species may have occupied the pens at
different times of the year. Table 7.3 gives the averages obtained for the pens, stables,
and byres studied at the Eastern Settlement farms. For the majority of the pens and
stables the average values were 4*1%0, whereas those for the byres were much higher
with average values X'S%. In each of these contexts the nitrogen deposited would
presumably be from the dung of the animals. As the 6 ' ' ~ of domestic herbivore dung is
-3%0 greater than that of the vegetation consumed (Kerley and Jarvis, 1996; Sutoh el al.,
1996), the average values for the pens and stables are generally consistent with the
consumption of the natural vegetation (1.4%0 for this region). The very high values found
for the byres appear to contradict this increase in F ' ~ N above the food source, but these
can be explained if the -3%0 enrichment is added to the values currently found for the
infields.
These observed patterns suggest that the fodder from the infields was exclusively
fed to the cattle, whereas the hay for the sheep and goats was obtained from unmanaged
outfields. Alternatively the sheep and goats may have been left to graze throughout the
year. These speculative interpretations are supported by historic farming practices in
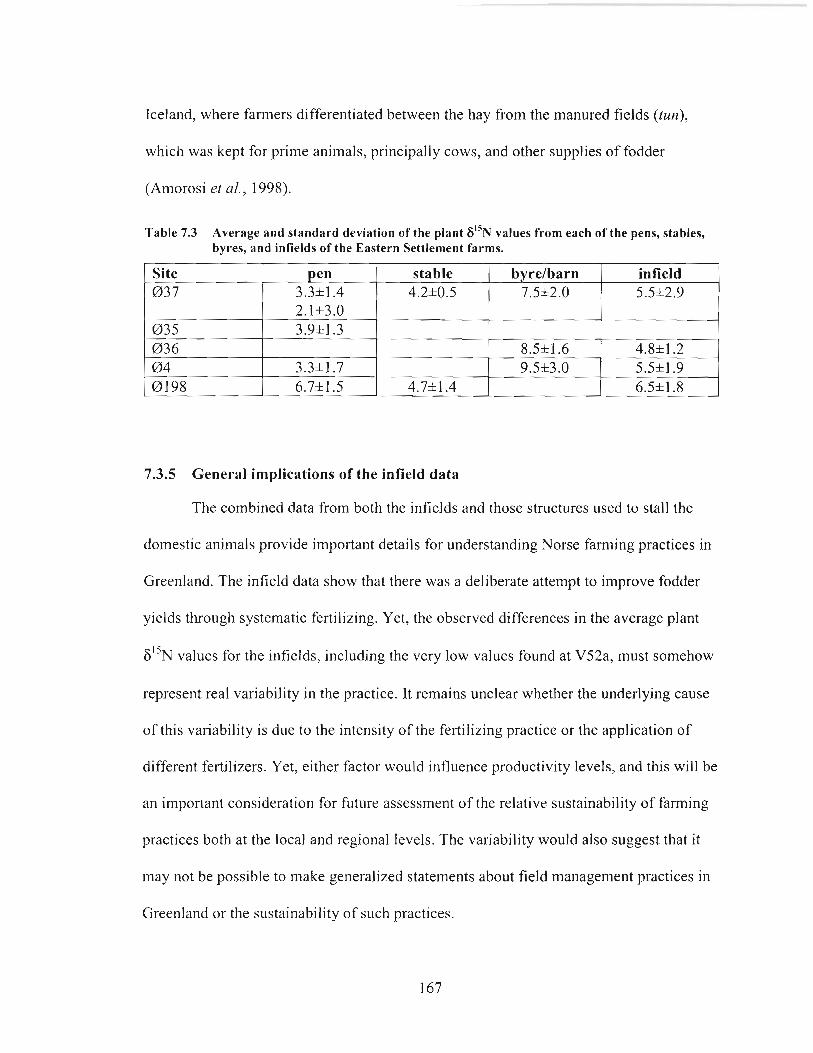
Iceland, where farmers differentiated between the hay from the manured fields (tun),
which was kept for prime animals, principally cows, and other supplies of fodder
(Amorosi el al., 1998).
Table 7.3 Average and standard deviation of the plant 6% values from each of the pens, stables, byres, and infields o f the Eastern Settlement farms.
7.3.5 General implications of the infield data
The combined data from both the infields and those structures used to stall the
domestic animals provide important details for understanding Norse farming practices in
Greenland. The infield data show that there was a deliberate attempt to improve fodder
yields through systematic fertilizing. Yet, the observed differences in the average plant
6 1 5 ~ values for the infields, including the very low values found at V52a, must somehow
represent real variability in the practice. It remains unclear whether the underlying cause
of this variability is due to the intensity of the fertilizing practice or the application of
different fertilizers. Yet, either factor would influence productivity levels, and this will be
an important consideration for future assessment of the relative sustainability of farming
practices both at the local and regional levels. The variability would also suggest that it
may not be possible to make generalized statements about field management practices in
Greenland or the sustainability of such practices.
Site 037
pen 3.3k1.4 2.1+3.0
stable 4.2k0.5
byre/barn 7.5i2.0
infield 5.5*2.9
The distinctive patterning observed for the structures will also need to be
considered when assessing the sustainability of Norse farming in southwest Greenland.
The apparent distinction between the fodder derived from the infields and that fi-om other
sources will be a concern for estimates of carrying capacity. The results suggest that
future models will need to correlate the productivity of defined infields with cattle stock,
and pasture land with the numbers of sheep and goats. The data in hand limits this to the
farms of the Eastem Settlement, but presumably the same pattern will be found for these
structures in the Western Settlement. This assumption does need to be tested though, as
the shorter growing season and limited rangeland in this region may have resulted in
different farming strategies.
Fertilizing undoubtedly increased yields at least for a period of the settlement, yet
it is important to note that this alone does not attest to the sustainability of the Norse
farming practices. Plant growth is determined by a number of factors including:
temperature, soil moisture content, the nutrient content of the soils, and the availability of
those nutrients. If we are to reach a detailed understanding of productivity levels on these
farms, these and others factors will need careful consideration.
7.4 Final concl~~sions of the study
These empirical observations firmly establish the affect past human activity has
on modem plant 6 ' j ~ values. Even though we have only begun to study this natural
phenomenon it is already clear that plant 6 1 5 ~ provides archaeology with a new non-
invasive tool to identify and define past human activity on the landscape, and to some
extent to characterize that activity or at least put constraints on interpretation.
The important cultural information already obtained for Norse farming practices
highlights the usefulness of the tool. Details of field and stock management provide
important insights for examining the sustainability of pastoral farming in the marginal
environment of southwest Greenland. It is expected that this same information could be
obtained for other Norse colonies throughout the North Atlantic, and the results obtained
here more broadly imply that the tool may be most applicable to the study of agricultural
societies.
Unquestionably, the ' 5 ~ enrichment for plants on the infields has direct relevance
to dietary reconstruction. The upward shift in the 6I5N of the terrestrial food chain base is
of direct importance to isotopic studies of agricultural populations. The data obtained
provide some indication of how large this shift may be in specific environments and
circumstances, and the magnitude of the "N enrichment may have a profound influence
on currently held beliefs in isotopic dietary reconstructions.
Are there other sub-disciplines which may benefit from this tool? The signature
within the churchyard would suggest that there may be applications in forensic
examination. However, this will depend on a much more detailed understanding of the
phenomenon and its limitations in some environments.
How wide an application this tool may find is yet unknown and empirical studies
need to be conducted in a wide variety of ecozones and archaeological contexts to begin
to define the geographic, temporal, and cultural contexts in which it can be applied. It is
expected that an ancillary result of these exploratory studies will be information of
relevance to soil science. The isotopic signature is a direct measure of the conservation of
nitrogen in the soil system. Archaeological sites may then provide ideal laboratories to
I69

begin to examine nitrogen conservation both in time and space. Further, the permanence
of the signature speaks more broadly to the continued role humans play in the ecology of
an area, and the lasting impact of their presence.
Continued study of the natural phenomenon will likely provide many applications
in archaeology and be of further interest to other disciplines.
7.5 Reference List
Adderley,W.P., Simpson,I., 2006. Soils and palaeo-climate based evidence for irrigation requirements in Norse Greenland. Journal of Archaeological Science. 33, 1666- 1679.
Albrethsen,S.E., Keller,C., 1986. The use of the saeter in medieval Norse farming in Greenland. Arctic Anthropology. 23,91-107.
Amorosi,T., Buckland,P., Dugmore,A., Ingimundarson,J.H., McGovern,T.H., 1997. Raiding the landscape: Human impact in the Scandinavian North Atlantic. Human Ecology. 25,491-5 18.
Amorosi,T., Buckland,P., Edwards,K.J., Mainland,I., McGovern,T.H., Sadler,J.P., Skidmore,P., 1998. They did not live by grass alone: the politics and paleoecology of animal fodder in the North Atlantic region. Environmental Archaeology. 1,41- 54.
Arneborg,J., 1998, The farm beneath the sand summary in: Arneborg, J., Gullarv, H.C. (Eds.), Man, Culture and Environment in Ancient Greenland, Danish Polar Centre and Danish National Museum, Copenhagen, pp. 80-89.
Barlow,L.K., Sadler,J.P., Ogilvie,A.E.J., Buckland,P.C., Amorosi,T., Ingimundarson,J.H., Skidmore,P., Dugmore,A.J., McGovern,T.H., 1997. Interdisciplinary investigation of the end of the Norse Western Settlement in Greenland. The Holocene. 7,489-499.
Berglund,J., 1986. The decline of the Norse settlements in Greenland. Artic Anthropology. 23, 109- 135.
Bogaard,A., Heaton,T.H.E., Poulton,P., Merbach,I., 2007. The impact of manuring on nitrogen isotope ratios in cereals: archaeological implications for reconstruction of diet and crop management practices. Journal of Archaeological Science. 34, 335-343.
Brady,N.C., Weil,R.R., 1996. The nature and properties of soil. Prentice Hall Inc, New Jersey.
Buckland,P., Dugmore,P., Sadler,A., 1998. Palaeological evidence for human impact on the North Atlantic Islands. Boletim do Museu Municipal do Funchal. 5, 89-108.
Buckland,P.C., Amorosi,T., Barlow,L.K., Dugmore,A.J., Mayewski,P.A., McGovem,T.H., Ogilvie,A.E.J., Sadler,J.P., Skidmore,P., 1996. Bioarchaeological and climatological evidence for the fate of Norse farmers in medieval Greenland. Antiquity. 70, 88-96.
Cameron,C., 2004. Anthropogenic soils at two Norse farms in Greenland and Iceland. Unpublished Masters Thesis, University of Alberta, Edmonton.
Christensen,K.M.B., 1991. Aspects of the Norse economy in the Western Settlement in Greenland. Acta Archaeologica. 61, 158-1 65.
Choi,W.J., Ro,H.M., Hobbie,E.A., 2003. Patterns of natural N-15 in soils and plants from chemically and organically fertilized uplands. Soil Biology & Biochemistry. 35, 1493-1 500.
Commisso,R.G., 2002, Foliar 6 1 5 ~ values as an indicator of anthropogenic sediments. Unpublished Masters Thesis, Simon Fraser University, Bumaby.
Cornrnisso,R.G., Nelson,D.E., 2007. Patterns of plant 6 1 5 ~ values on a Greenland Norse farm. Joumal of Archaeological Science. 34,440-450.
Commisso,R.G., Nelson,D.E., 2006. Modem plant 6 1 5 ~ values reflect ancient human activity. Journal of Archaeological Science. 33, 1 167-1 176.
Commisso,R.G., Nelson,D.E., In Press. Correlation between modern plant 6 1 5 ~ values and activity areas of Medieval Norse farms. Journal of Archaeological Science.
Dochll,S.J., Bond,J.M., Milles,A., Simpson,I., Ambers,J., 1994. Tofts Ness, Sanday, Orkney. An integrated study of a buried Orcadian landscape in: Luff, R., Rowley- Conwy, P. (Eds.), Whither Environmental Archaeology? Oxbow Books, Oxford, pp. 1 15-1 32.
Eggertsson,T., 1998. Sources of risk, institutions for survival, and a game against nature in premodern Iceland. Explorations in Economic History. 35, 1-30.
Fenton,A.J., 198 1, Early manuring techniques in: Mercer, R.J. (Ed.), Farming practice in British prehistory, University Press, Edinburgh, pp. 21 0-21 7.
Fredskild,B., 1988, Agriculture in a marginal area - south Greenland from Norse landnam (A.D. 985) to the present (A.D. 1985) in: Birks, H.H., Birks, H.J.B., Kaland, P. E., Dagfinn, M. (Eds.), The Cultural Landscape - Past, Present and Future, Cambridge University Press, Cambridge, pp. 38 1-394.
Heaton,T.H.E., 1987. The ' 5 ~ / ' 4 ~ ratios of plants in South Africa and Nambia: relationship to climate and coastal/saline environments. Chemical Geology. 59, 87- 102.
Hobbie,E.A., Macko,S.A., Williams,M., 2000. Correlations between foliar 6 1 5 ~ and nitrogen concentrations may indicate plant-mycorrhizal interactions. Oecologia. 273-283.
Kelly,J.F., 2000. Stable Isotopes of carbon and nitrogen in the study of avian and mammalian trophic ecology. Can. J. Zool. 78, 1-27.
Kerley,S.J., Jarvis,S.C., 1996. Preliminary studies of the impact of excreted N on cycling and uptake of N in pasture systems using natural abundance stable isotopic discrimination. Plant and Soil. 178,287-294.
Krogh,K.J., 1982. Erik den Rodes Grranland. Nationalmuseets, Copenhagen.
McGovem,T.H., Bigelow,G., Arnold,T., Russell,D., 1988. Northern islands, human error, and environmental degradation: A view of social and ecological change in the Medieval North Atlantic. Human Ecology. 16, 225-270.
McGovern,T.H., 2000, The demise of Norse Greenland in: William W. Fitzhugh, Elisabeth I. Ward (Eds.), Vikings : the North Atlantic Saga, Smithsonian Institution Press, Washington London, pp. 327-339.
Michelsen,A., Quarmby,C., Sleep,D., Jonasson,S., 1998. Vascular plant ''N natural abundance in heath and forest tundra ecosystems is closely correlated with presence and type of mycorrhizal fungi in roots. Oecologia. 1 15,406-41 8.
Mizutani,H., Kabaya,Y., Moors,P.J., Speir,T.W., Lyon,G.L., 1991. Nitrogen isotope ratios identify deserted seabird colonies. Auk. 108, 960-964.
Nadelhoffer,K., Shaver,G., Fry,B., Giblin,A., Johnson,L., McKane,R., 1996. ' 5 ~ natural abundances and N use by tundra plants. Oecologia. 107, 386-394.
Nadelhoffer,K.J., Giblin,A.E., Shaver,G.R., Linkins,A.E., 1992, Microbial Processes and Plant Nutrient Availability in Arctic Soils in: Chapin 111, F.S., Reynolds, J.F., Jefferies, R.L. (Eds.), Arctic Ecosystems in a Changing Climate, Academic Press, San Diego, pp. 28 1-295.
Schimel,J.P., Kielland,K., Chapin III,F.S., 1996, Nutrient availability and uptake by tundra plants in: Reynolds, J.F., Tenhunen, J.D. (Eds.), Landscape function and disturbance in Arctic tundra, Springer-Verlag, Berlin, pp. 203-221.
Schulze,E.D., Chapin III,F.S., Gebauer,G., 1994. Nitrogen nutrition and isotope differences among life forms at the northem treeline of Alaska. Oecologia. 406- 412.
Schweger,C.E., 1998, Geoarchaeology of the GUS site: A preliminary framework in: Ameborg, J., Gullrav, H.C. (Eds.), Man, Culture and Environment in Ancient Greenland, Danish Polar Centre and Danish National Museum, Copenhagen, pp. 14-18.
Shahack-Gross,R., Simons,A., Ambrose,S., 2007. Identification of pastoral sites using stable nitrogen and carbon isotopes from bulk sediment samples: a case study in modem and archaeological pastoral settlements in Kenya. Journal of Archaeological Science. In Press.
Simpson,I.A., 1997. Relict properties of anthropogenic deep top soils as indicators of infield management in Manvick, West Mainland, Orkney. Journal of Archaeological Science. 24, 380.
Sutoh,M., Obara,Y., Miyamoto,S., 1996. The effect of sucrose supplementation on kinetics of nitrogen, ruminal propionate and plasma glucose in sheep. J. Agric. Sci. 1 26,99- I 05.
Welker,J.M., Jonsdottir,I.S., Fahnestock,J.T., 2003. Leaf isotopic (delta C-I 3 and delta N-15) and nitrogen contents of Carex plants along the Eurasian Coastal Arctic: results from the Northeast Passage expedition. Polar Biol. 27, 29-37.


![[815][Llévame Contigo]](https://img.pdfslide.net/doc/110x75/56d6bdf01a28ab30168fea74/815llevame-contigo.jpg)