Embed Size (px)
Citation preview

GLEN INNES SEVERN COUNCIL
PLANT AND FLEET
ASSET MANAGEMENT PLAN
PART 8
Version 1.0
June 2011

GLEN INNES SEVERN COUNCIL – PLANT & FLEET ASSET MANAGEMENT PLAN
Document Control
Document ID: 59_07_070909_nams.plus_amp template v11
Rev No Date Revision Details Author Reviewer Approver
Draft 18/4/11 For public exhibition VM MD
1.0 22/06/2011 Incorporates Community Strategic Plan 2011-2021
outcomes
VM MD VM
© Copyright 2007 – All rights reserved.
The Institute of Public Works Engineering Australia.

GLEN INNES SEVERN COUNCIL – PLANT & FLEET ASSET MANAGEMENT PLAN
TABLE OF CONTENTS
ABBREVIATIONS ................................................................................................................................................................................... i
GLOSSARY ............................................................................................................................................................................................ ii
1. EXECUTIVE SUMMARY ........................................................................................................................................................... 1
2. INTRODUCTION ....................................................................................................................................................................... 2
2.1 Background ..................................................................................................... 2
2.2 Goals and Objectives of Asset Management ................................................... 2
2.3 Plan Framework ............................................................................................... 3
2.4 Core and Advanced Asset Management .......................................................... 4
3. LEVELS OF SERVICE .............................................................................................................................................................. 4
3.1 Customer Research and Expectations ............................................................. 4
3.2 Legislative Requirements ................................................................................. 4
3.3 Current Levels of Service ................................................................................. 4
3.4 Desired Levels of Service ................................................................................ 4
4. FUTURE DEMAND .................................................................................................................................................................... 7
4.1 DEMAND FORECAST .................................................................................... 7
4.2 Changes in Technology ................................................................................... 7
4.3 Demand Management Plan ............................................................................. 7
4.4 New Assets from Growth ................................................................................. 8
5. LIFECYCLE MANAGEMENT PLAN ......................................................................................................................................... 9
5.1 Background Data ............................................................................................. 9
5.1.1 Physical parameters ................................................................................. 9
5.1.2 Asset capacity and performance ............................................................ 10
5.1.3 Asset condition ....................................................................................... 11
5.1.4 Asset valuations ..................................................................................... 11
5.2 Risk Management Plan .................................................................................. 12
5.3 Routine Maintenance Plan ............................................................................. 13
5.3.1 Maintenance plan ................................................................................... 13
5.3.2 Standards and specifications.................................................................. 14
5.3.3 Summary of future maintenance expenditures ....................................... 14

GLEN INNES SEVERN COUNCIL – PLANT & FLEET ASSET MANAGEMENT PLAN
5.4 Renewal/Replacement Plan ........................................................................... 15
5.4.1 Renewal plan ......................................................................................... 15
5.4.2 Renewal standards ................................................................................ 16
5.4.3 Summary of future renewal expenditure ................................................. 17
5.5 Creation/Acquisition/Upgrade Plan ................................................................ 18
5.5.1 Selection criteria..................................................................................... 18
5.5.2 Standards and specifications.................................................................. 18
5.5.3 Summary of future upgrade/new assets expenditure .............................. 18
5.6 Disposal Plan ................................................................................................. 19
6. FINANCIAL SUMMARY .......................................................................................................................................................... 21
6.1 Financial Statements and Projections ............................................................ 21
6.1.1 Sustainability of service delivery ............................................................. 21
6.2 Funding Strategy ........................................................................................... 24
6.3 Valuation Forecasts ....................................................................................... 24
6.4 Key Assumptions made in Financial Forecasts .............................................. 26
7. ASSET MANAGEMENT PRACTICES .................................................................................................................................... 28
7.1 Accounting/Financial Systems ....................................................................... 28
7.2 Asset Management Systems ......................................................................... 28
7.3 Information Flow Requirements and Processes ............................................. 28
7.4 Standards and Guidelines .............................................................................. 28
7.5 Data Confidence Level ................................................................................. 28
8. PLAN IMPROVEMENT AND MONITORING .......................................................................................................................... 29
8.1 Performance Measures .................................................................................. 29
8.2 Improvement Plan .......................................................................................... 29
8.3 Monitoring and Review Procedures ............................................................... 29
REFERENCES ...................................................................................................................................................................................... 30
APPENDICES ....................................................................................................................................................................................... 31
Appendix A Maintenance Response Levels of Service ....................................... 31
Appendix B PLANNED EXPENDITURES FOR LONG TERM FINANCIAL PLAN (PLANT AND FLEET) ................................................................................. 32
Appendix c Projected 10 year Capital Works Program ....................................... 34

GLEN INNES SEVERN COUNCIL – PLANT & FLEET ASSET MANAGEMENT PLAN

- i -
GLEN INNES SEVERN COUNCIL – PLANT & FLEET ASSET MANAGEMENT PLAN
ABBREVIATIONS
AAAC Average annual asset consumption
AMP Asset management plan
ARI Average recurrence interval
BOD Biochemical (biological) oxygen demand
CRC Current replacement cost
CWMS Community wastewater management systems
DA Depreciable amount
DoH Department of Health
EF Earthworks/formation
IRMP Infrastructure risk management plan
LCC Life Cycle cost
LCE Life cycle expenditure
MMS Maintenance management system
PCI Pavement condition index
RV Residual value
SS Suspended solids
vph Vehicles per hour

- ii -
GLEN INNES SEVERN COUNCIL – PLANT & FLEET ASSET MANAGEMENT PLAN
GLOSSARY
Annual service cost (ASC)
An estimate of the cost that would be tendered, per
annum, if tenders were called for the supply of a service
to a performance specification for a fixed term. The
Annual Service Cost includes operating, maintenance,
depreciation, finance/ opportunity and disposal costs,
less revenue.
Asset class
Grouping of assets of a similar nature and use in an
entity's operations (AASB 166.37).
Asset condition assessment
The process of continuous or periodic inspection,
assessment, measurement and interpretation of the
resultant data to indicate the condition of a specific asset
so as to determine the need for some preventative or
remedial action.
Asset management
The combination of management, financial, economic,
engineering and other practices applied to physical
assets with the objective of providing the required level
of service in the most cost effective manner.
Assets
Future economic benefits controlled by the entity as a
result of past transactions or other past events
(AAS27.12).
Property, plant and equipment including infrastructure
and other assets (such as furniture and fittings) with
benefits expected to last more than 12 month.
Average annual asset consumption (AAAC)*
The amount of a local government’s asset base
consumed during a year. This may be calculated by
dividing the Depreciable Amount (DA) by the Useful Life
and totalled for each and every asset OR by dividing the
Fair Value (Depreciated Replacement Cost) by the
Remaining Life and totalled for each and every asset in
an asset category or class.
Brownfield asset values**
Asset (re)valuation values based on the cost to replace
the asset including demolition and restoration costs.
Capital expansion expenditure
Expenditure that extends an existing asset, at the same
standard as is currently enjoyed by residents, to a new
group of users. It is discretional expenditure, which
increases future operating, and maintenance costs,
because it increases council’s asset base, but may be
associated with additional revenue from the new user
group, eg. extending a drainage or road network, the
provision of an oval or park in a new suburb for new
residents.
Capital expenditure
Relatively large (material) expenditure, which has
benefits, expected to last for more than 12 months.
Capital expenditure includes renewal, expansion and
upgrade. Where capital projects involve a combination of
renewal, expansion and/or upgrade expenditures, the
total project cost needs to be allocated accordingly.
Capital funding
Funding to pay for capital expenditure.
Capital grants
Monies received generally tied to the specific projects for
which they are granted, which are often upgrade and/or
expansion or new investment proposals.
Capital investment expenditure
See capital expenditure definition
Capital new expenditure
Expenditure which creates a new asset providing a new
service to the community that did not exist beforehand.
As it increases service potential it may impact revenue
and will increase future operating and maintenance
expenditure.
Capital renewal expenditure
Expenditure on an existing asset, which returns the
service potential or the life of the asset up to that which it
- ii -
GLEN INNES SEVERN COUNCIL – PLANT & FLEET ASSET MANAGEMENT PLAN
had originally. It is periodically required expenditure,
relatively large (material) in value compared with the
value of the components or sub-components of the asset
being renewed. As it reinstates existing service potential,
it has no impact on revenue, but may reduce future
operating and maintenance expenditure if completed at
the optimum time, eg. resurfacing or resheeting a
material part of a road network, replacing a material
section of a drainage network with pipes of the same
capacity, resurfacing an oval. Where capital projects
involve a combination of renewal, expansion and/or
upgrade expenditures, the total project cost needs to be
allocated accordingly.
Capital upgrade expenditure
Expenditure, which enhances an existing asset to
provide a higher level of service or expenditure that will
increase the life of the asset beyond that which it had
originally. Upgrade expenditure is discretional and often
does not result in additional revenue unless direct user
charges apply. It will increase operating and
maintenance expenditure in the future because of the
increase in the council’s asset base, eg. widening the
sealed area of an existing road, replacing drainage pipes
with pipes of a greater capacity, enlarging a grandstand
at a sporting facility. Where capital projects involve a
combination of renewal, expansion and/or upgrade
expenditures, the total project cost needs to be allocated
accordingly.
Carrying amount
The amount at which an asset is recognised after
deducting any accumulated depreciation / amortisation
and accumulated impairment losses thereon.
Class of assets
See asset class definition
Component
An individual part of an asset which contributes to the
composition of the whole and can be separated from or
attached to an asset or a system.
Cost of an asset
The amount of cash or cash equivalents paid or the fair
value of the consideration given to acquire an asset at
the time of its acquisition or construction, plus any costs
necessary to place the asset into service. This includes
one-off design and project management costs.
Current replacement cost (CRC)
The cost the entity would incur to acquire the asset on
the reporting date. The cost is measured by reference to
the lowest cost at which the gross future economic
benefits could be obtained in the normal course of
business or the minimum it would cost, to replace the
existing asset with a technologically modern equivalent
new asset (not a second hand one) with the same
economic benefits (gross service potential) allowing for
any differences in the quantity and quality of output and
in operating costs.
Current replacement cost “As New” (CRC)
The current cost of replacing the original service
potential of an existing asset, with a similar modern
equivalent asset, i.e. the total cost of replacing an
existing asset with an as NEW or similar asset
expressed in current dollar values.
Cyclic Maintenance**
Replacement of higher value components/sub-
components of assets that is undertaken on a regular
cycle including repainting, building roof replacement,
cycle, replacement of air conditioning equipment, etc.
This work generally falls below the capital/ maintenance
threshold and needs to be identified in a specific
maintenance budget allocation.
Depreciable amount
The cost of an asset, or other amount substituted for its
cost, less its residual value (AASB 116.6)
Depreciated replacement cost (DRC)
The current replacement cost (CRC) of an asset less,
where applicable, accumulated depreciation calculated
on the basis of such cost to reflect the already consumed
or expired future economic benefits of the asset
Depreciation / amortisation
The systematic allocation of the depreciable amount
(service potential) of an asset over its useful life.
Economic life
See useful life definition.
Expenditure
The spending of money on goods and services.
Expenditure includes recurrent and capital.

- iii -
GLEN INNES SEVERN COUNCIL – PLANT & FLEET ASSET MANAGEMENT PLAN
Fair value
The amount for which an asset could be exchanged, or a
liability settled, between knowledgeable, willing parties,
in an arms length transaction.
Greenfield asset values **
Asset (re)valuation values based on the cost to initially
acquire the asset.
Heritage asset
An asset with historic, artistic, scientific, technological,
geographical or environmental qualities that is held and
maintained principally for its contribution to knowledge
and culture and this purpose is central to the objectives
of the entity holding it.
Impairment Loss
The amount by which the carrying amount of an asset
exceeds its recoverable amount.
Infrastructure assets
Physical assets of the entity or of another entity that
contribute to meeting the public's need for access to
major economic and social facilities and services, eg.
roads, drainage, footpaths and cycleways. These are
typically large, interconnected networks or portfolios of
composite assets The components of these assets may
be separately maintained, renewed or replaced
individually so that the required level and standard of
service from the network of assets is continuously
sustained. Generally the components and hence the
assets have long lives. They are fixed in place and are
often have no market value.
Investment property
Property held to earn rentals or for capital appreciation or
both, rather than for:
(a) use in the production or supply of goods or services
or for administrative purposes; or
(b) sale in the ordinary course of business (AASB 140.5)
Level of service
The defined service quality for a particular service
against which service performance may be measured.
Service levels usually relate to quality, quantity,
reliability, responsiveness, environmental, acceptability
and cost).
Life Cycle Cost **
The life cycle cost (LCC) is average cost to provide the
service over the longest asset life cycle. It comprises
annual maintenance and asset consumption expense,
represented by depreciation expense. The Life Cycle
Cost does not indicate the funds required to provide the
service in a particular year.
Life Cycle Expenditure **
The Life Cycle Expenditure (LCE) is the actual or
planned annual maintenance and capital renewal
expenditure incurred in providing the service in a
particular year. Life Cycle Expenditure may be
compared to Life Cycle Expenditure to give an initial
indicator of life cycle sustainability.
Loans / borrowings
Loans result in funds being received which are then
repaid over a period of time with interest (an additional
cost). Their primary benefit is in ‘spreading the burden’
of capital expenditure over time. Although loans enable
works to be completed sooner, they are only ultimately
cost effective where the capital works funded (generally
renewals) result in operating and maintenance cost
savings, which are greater than the cost of the loan
(interest and charges).
Maintenance and renewal gap
Difference between estimated budgets and projected
expenditures for maintenance and renewal of assets,
totalled over a defined time (eg 5, 10 and 15 years).
Maintenance and renewal sustainability index
Ratio of estimated budget to projected expenditure for
maintenance and renewal of assets over a defined time
(eg 5, 10 and 15 years).
Maintenance expenditure
Recurrent expenditure, which is periodically or regularly
required as part of the anticipated schedule of works
required to ensure that the asset achieves its useful life
and provides the required level of service. It is
expenditure, which was anticipated in determining the
asset’s useful life.
Materiality
An item is material is its omission or misstatement could
influence the economic decisions of users taken on the
basis of the financial report. Materiality depends on the

- iv -
GLEN INNES SEVERN COUNCIL – PLANT & FLEET ASSET MANAGEMENT PLAN
size and nature of the omission or misstatement judged
in the surrounding circumstances.
Modern equivalent asset.
A structure similar to an existing structure and having the
equivalent productive capacity, which could be built
using modern materials, techniques and design.
Replacement cost is the basis used to estimate the cost
of constructing a modern equivalent asset.
Non-revenue generating investments
Investments for the provision of goods and services to
sustain or improve services to the community that are
not expected to generate any savings or revenue to the
Council, eg. parks and playgrounds, footpaths, roads
and bridges, libraries, etc.
Operating expenditure
Recurrent expenditure, which is continuously required
excluding maintenance and depreciation, eg power, fuel,
staff, plant equipment, on-costs and overheads.
Pavement management system
A systematic process for measuring and predicting the
condition of road pavements and wearing surfaces over
time and recommending corrective actions.
Planned Maintenance**
Repair work that is identified and managed through a
maintenance management system (MMS). MMS
activities include inspection, assessing the condition
against failure/breakdown criteria/experience, prioritising
scheduling, actioning the work and reporting what was
done to develop a maintenance history and improve
maintenance and service delivery performance.
PMS Score
A measure of condition of a road segment determined
from a Pavement Management System.
Rate of annual asset consumption*
A measure of average annual consumption of assets
(AAAC) expressed as a percentage of the depreciable
amount (AAAC/DA). Depreciation may be used for
AAAC.
Rate of annual asset renewal*
A measure of the rate at which assets are being renewed
per annum expressed as a percentage of depreciable
amount (capital renewal expenditure/DA).
Rate of annual asset upgrade*
A measure of the rate at which assets are being
upgraded and expanded per annum expressed as a
percentage of depreciable amount (capital
upgrade/expansion expenditure/DA).
Reactive maintenance
Unplanned repair work that carried out in response to
service requests and management/supervisory
directions.
Recoverable amount
The higher of an asset's fair value, less costs to sell and
its value in use.
Recurrent expenditure
Relatively small (immaterial) expenditure or that which
has benefits expected to last less than 12 months.
Recurrent expenditure includes operating and
maintenance expenditure.
Recurrent funding
Funding to pay for recurrent expenditure.
Rehabilitation
See capital renewal expenditure definition above.
Remaining life
The time remaining until an asset ceases to provide the
required service level or economic usefulness. Age plus
remaining life is economic life.
Renewal
See capital renewal expenditure definition above.
Residual value
The net amount which an entity expects to obtain for an
asset at the end of its useful life after deducting the
expected costs of disposal.
Revenue generating investments
Investments for the provision of goods and services to
sustain or improve services to the community that are

- v -
GLEN INNES SEVERN COUNCIL – PLANT & FLEET ASSET MANAGEMENT PLAN
expected to generate some savings or revenue to offset
operating costs, eg public halls and theatres, childcare
centres, sporting and recreation facilities, tourist
information centres, etc.
Risk management
The application of a formal process to the range of
possible values relating to key factors associated with a
risk in order to determine the resultant ranges of
outcomes and their probability of occurrence.
Section or segment
A self-contained part or piece of an infrastructure asset.
Service potential
The capacity to provide goods and services in
accordance with the entity's objectives, whether those
objectives are the generation of net cash inflows or the
provision of goods and services of a particular volume
and quantity to the beneficiaries thereof.
Service potential remaining*
A measure of the remaining life of assets expressed as a
percentage of economic life. It is also a measure of the
percentage of the asset’s potential to provide services
that is still available for use in providing services
(DRC/DA).
Strategic Management Plan (SA)**
Documents Council objectives for a specified period (3-5
yrs), the principle activities to achieve the objectives, the
means by which that will be carried out, estimated
income and expenditure, measures to assess
performance and how rating policy relates to the
Council’s objectives and activities.
Sub-component
Smaller individual parts that make up a component part.
Useful life
Either:
(a) the period over which an asset is expected to be
available for use by an entity, or
(b) the number of production or similar units expected to
be obtained from the asset by the entity.
It is estimated or expected time between placing the
asset into service and removing it from service, or the
estimated period of time over which the future economic
benefits embodied in a depreciable asset, are expected
to be consumed by the council. It is the same as the
economic life.
Value in Use
The present value of estimated future cash flows
expected to arise from the continuing use of an asset
and from its disposal at the end of its useful life. It is
deemed to be depreciated replacement cost (DRC) for
those assets whose future economic benefits are not
primarily dependent on the asset's ability to generate
new cash flows, where if deprived of the asset its future
economic benefits would be replaced.
Source: DVC 2006, Glossary
Note: Items shown * modified to use DA instead of CRC
Additional glossary items shown **

- 1 -
GLEN INNES SEVERN COUNCIL – PLANT & FLEET ASSET MANAGEMENT PLAN
1. EXECUTIVE SUMMARY
Refer Part 1.

- 2 -
GLEN INNES SEVERN COUNCIL – PLANT & FLEET ASSET MANAGEMENT PLAN
2. INTRODUCTION
2.1 BACKGROUND
This asset management plan is to demonstrate responsive management of assets (and
services provided from assets), compliance with regulatory requirements, and to communicate
funding required to provide the required levels of service.
The asset management plan is to be read with the following associated planning documents:
Asset Management Policy
Asset Management Strategy
This asset management plan covers all fleet and plant assets
Table 2.1. Assets covered by this Plan
TRANSPORT ASSET CLASS QUANTITY
Light Vehicles 60
Earthmoving plant 25
Trucks & trailers 38
Mowers & tractors 37
Minor plant & equipment 269
TOTAL 429
2.2 GOALS AND OBJECTIVES OF ASSET MANAGEMENT
Relevant Council goals and objectives and how these are addressed in this asset management
plan are:
- 3 -
GLEN INNES SEVERN COUNCIL – PLANT & FLEET ASSET MANAGEMENT PLAN
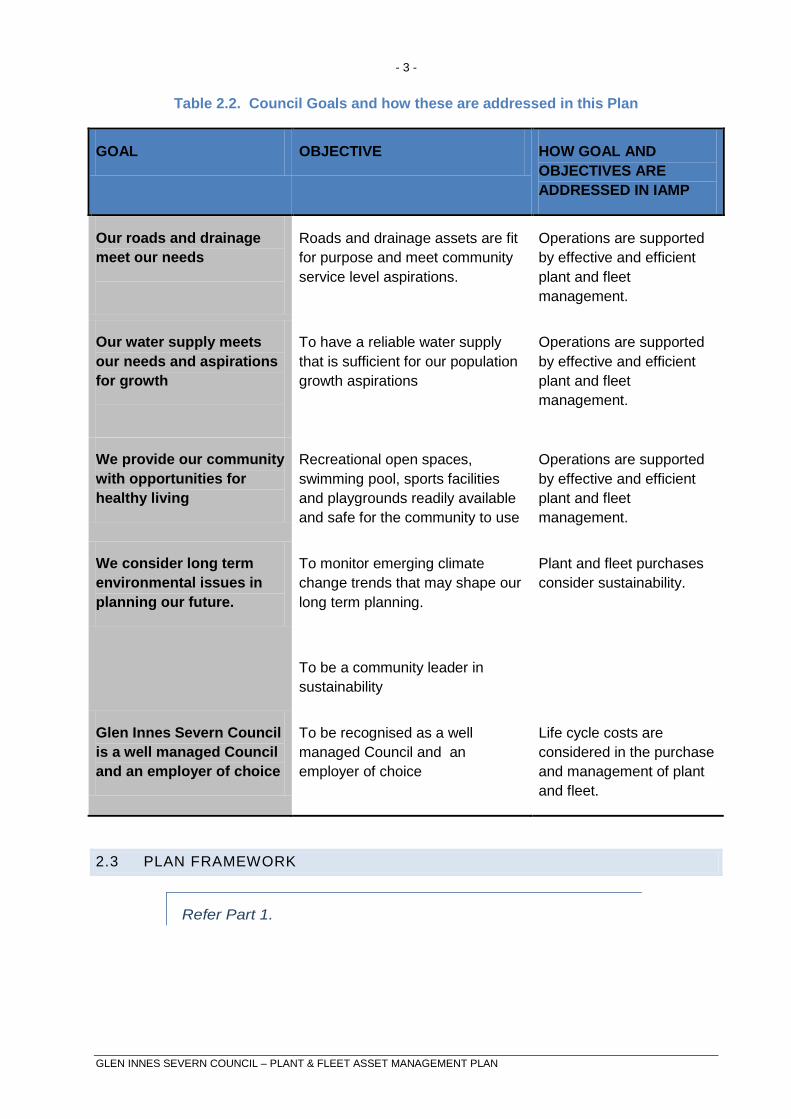
Table 2.2. Council Goals and how these are addressed in this Plan
GOAL OBJECTIVE HOW GOAL AND
OBJECTIVES ARE
ADDRESSED IN IAMP
Our roads and drainage
meet our needs
Roads and drainage assets are fit
for purpose and meet community
service level aspirations.
Operations are supported
by effective and efficient
plant and fleet
management.
Our water supply meets
our needs and aspirations
for growth
To have a reliable water supply
that is sufficient for our population
growth aspirations
Operations are supported
by effective and efficient
plant and fleet
management.
We provide our community
with opportunities for
healthy living
Recreational open spaces,
swimming pool, sports facilities
and playgrounds readily available
and safe for the community to use
Operations are supported
by effective and efficient
plant and fleet
management.
We consider long term
environmental issues in
planning our future.
To monitor emerging climate
change trends that may shape our
long term planning.
To be a community leader in
sustainability
Plant and fleet purchases
consider sustainability.
Glen Innes Severn Council
is a well managed Council
and an employer of choice
To be recognised as a well
managed Council and an
employer of choice
Life cycle costs are
considered in the purchase
and management of plant
and fleet.
2.3 PLAN FRAMEWORK
Refer Part 1.

- 4 -
GLEN INNES SEVERN COUNCIL – PLANT & FLEET ASSET MANAGEMENT PLAN
2.4 CORE AND ADVANCED ASSET MANAGEMENT
Refer Part 1.
3. LEVELS OF SERVICE
3.1 CUSTOMER RESEARCH AND EXPECTATIONS
Council has not carried out any research on customer expectations. This will be investigated
for future updates of the asset management plan. Staff involved in plant operation and
maintenance have input into levels of service in the process of fleet, plant and equipment
replacement.
3.2 LEGISLATIVE REQUIREMENTS
Refer Part 1.
3.3 CURRENT LEVELS OF SERVICE
Refer Part 1.
Council's current levels of service are set out in Table 3.1.
Where table entries are shown as '#' data are unavailable. Future IAMP revisions will include
this information, as it becomes available.
3.4 DESIRED LEVELS OF SERVICE
Refer Part 1.

- 5 -
GLEN INNES SEVERN COUNCIL – PLANT & FLEET ASSET MANAGEMENT PLAN
PLANT AND FLEET
Table 3.2 : Technical Levels of Service
KEY
PERFORMANCE
INDICATOR
COMMUNITY LEVEL OF
SERVICE
PERFORMANCE
MEASUREMENT PROCESS
TARGET
PERFORMANCE
CURRENT
PERFORMANCE
Condition Fleet Plant and Equipment are
maintained to Manufacturers
specification
Scheduled maintenance, reactive
repairs, regular inspection by
operator and fleet staff
Compliant with
manufacturers
recommendations
Compliant with
manufacturers
recommendations.
Planned maintenance.
Equipment available for
operational and designed
use.
Cost
effectiveness
Cost effective fleet, with low
whole of life costs.
Proactive replacement program.
Forecasted whole of life costs.
Policy on renewal and selection
criteria.
Replacement as per long
term financial plan and
replacement policy
Forecasted replacement
plan for Asset
Management, operational
and long term financial
plan.

- 6 -
GLEN INNES SEVERN COUNCIL – PLANT & FLEET ASSET MANAGEMENT PLAN
Safety Asset Compliance Roadworthy Compliance
Inspections during scheduled
and non scheduled maintenance
and repairs
Operators inspections and
reporting defects and faults
100% Compliant with
Legislation
100% Inspections during
scheduled and non
scheduled maintenance
and repairs
Operators inspections and
reporting defects
Function Function Modern equipment that meet the
user requirements
Consultation with end
users when renewal is
due.
100% satisfaction that end
user are happy with fleet
design and selection
process.

- 7 -
GLEN INNES SEVERN COUNCIL – PLANT & FLEET ASSET MANAGEMENT PLAN
4. FUTURE DEMAND
4.1 DEMAND FORECAST
Refer Part 1.
4.1.2 DEMAND FACTORS – TRENDS AND IMPACTS
Changes to the size and scope of Council’s fleet is an ongoing issue that can be driven by
changes in work practices, technology or increasing or decreasing work loads due to a number
of factors. At this time the fleet is relatively stable with further assessment and analysis being
required to meaningfully shape future cost projections.
There are a number of unique factors that directly impact the demand for Fleet Assets and
services. These factors include:
Population Growth,
Increased Council Service Provision,
Increased Resource Demands for above, and
Council Staff Growth.
4.2 CHANGES IN TECHNOLOGY
Technology changes are forecast to affect the delivery of services covered by this plan in the
following areas.
Table 4.2. Changes in Technology and Forecast effect on Service Delivery
TECHNOLOGY CHANGE EFFECT ON SERVICE DELIVERY
Specialised Fleet Equipment Improve efficiency in service delivery, and reduce
costs.
Alternative Fuel and Hybrid Vehicles No effect on service delivery but reduction of
emission.
4.3 DEMAND MANAGEMENT PLAN
Demand management strategies and techniques provide alternatives to the creation of new, or
the modification of existing assets in order to meet demand. Instead, these strategies and
techniques look at ways to modify customer demand so that there are increased opportunities
to maximise the utilisation rate of existing assets and therefore the need for new or modified
assets is deferred or reduced.

- 8 -
GLEN INNES SEVERN COUNCIL – PLANT & FLEET ASSET MANAGEMENT PLAN
Demand analysis of utilisation rates and availability are still to be undertaken. Demand
management strategies will be developed as this analysis is undertaken.
Table 4.3. Demand Management Plan Summary
SERVICE ACTIVITY DEMAND MANAGEMENT PLAN
Financial Developing long term financial plan to ensure financial
sustainability.
Service Delivery To ensure services required and utilisation are driving
demand for Fleet Assets.
Environmental Anticipated increasing legislative requirements for
reduction in green house gas emissions are expected to
result in changes to plant & fleet purchasing and
management practices into the future
4.4 NEW ASSETS FROM GROWTH
Changes to the size and scope of GISC fleet is an ongoing issue that can be driven by changes
in work practices, technology, staffing or increasing workloads due to a number of factors.
Current strategies to address this are triggered when the item of fleet is due for renewal and
consultation with the users of the plan occurs.
At this time the fleet is relatively stable with further assessment and analysis being required to
shape future cost projections associated with growth.
Future revision of this plan will include new assets from growth. Acquiring these new assets will
commit GISC to fund ongoing operations and maintenance costs for the period that the service
provided from the assets is required. These future costs are identified and considered in
developing forecasts of future operating and maintenance costs.
- 9 -
GLEN INNES SEVERN COUNCIL – PLANT & FLEET ASSET MANAGEMENT PLAN
5. LIFECYCLE MANAGEMENT PLAN
The lifecycle management plan details how Council plans to manage and operate the assets at
the agreed levels of service (defined in section 3) while optimising life cycle costs.
5.1 BACKGROUND DATA
5.1.1 PHYSICAL PARAMETERS
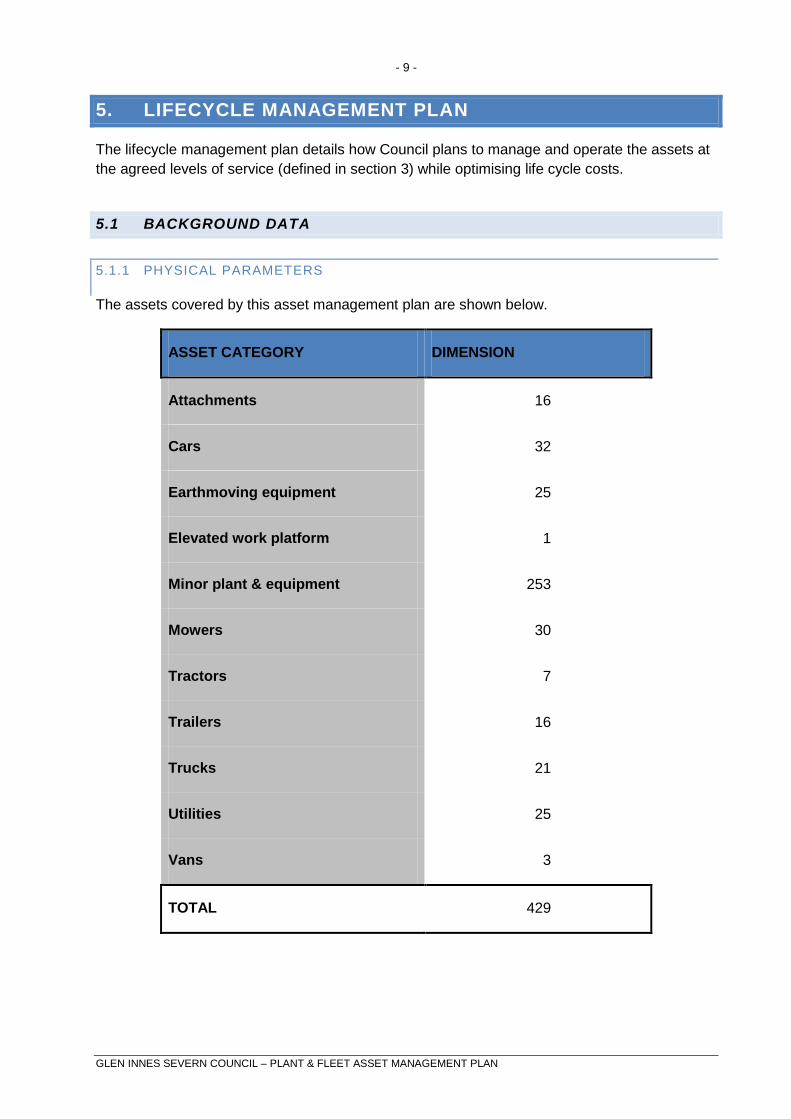
The assets covered by this asset management plan are shown below.
ASSET CATEGORY DIMENSION
Attachments 16
Cars 32
Earthmoving equipment 25
Elevated work platform 1
Minor plant & equipment 253
Mowers 30
Tractors 7
Trailers 16
Trucks 21
Utilities 25
Vans 3
TOTAL 429

- 10 -
GLEN INNES SEVERN COUNCIL – PLANT & FLEET ASSET MANAGEMENT PLAN
GISC has quite a diverse range of fleet due to the number of services provided, these services
are all linked to fleet management but are only a piece of equipment to provide the service and
at no time should they be driving any service levels.
The age profile of Council’s assets is shown below.
Fig 2. Asset Age Profile
5.1.2 ASSET CAPACITY AND PERFORMANCE
Council’s services are generally provided to meet design standards where these are available.
Locations where deficiencies in service performance are known are detailed in Table 5.1.2.
Table 5.1.2. Known Service Performance Deficiencies
LOCATION SERVICE DEFICIENCY
Operator damage Operator damage to Fleet equipment which has a significant
effect on scheduled maintenance, recourses and availability of
equipment which effect service delivery and customer
satisfaction.
- 11 -
GLEN INNES SEVERN COUNCIL – PLANT & FLEET ASSET MANAGEMENT PLAN
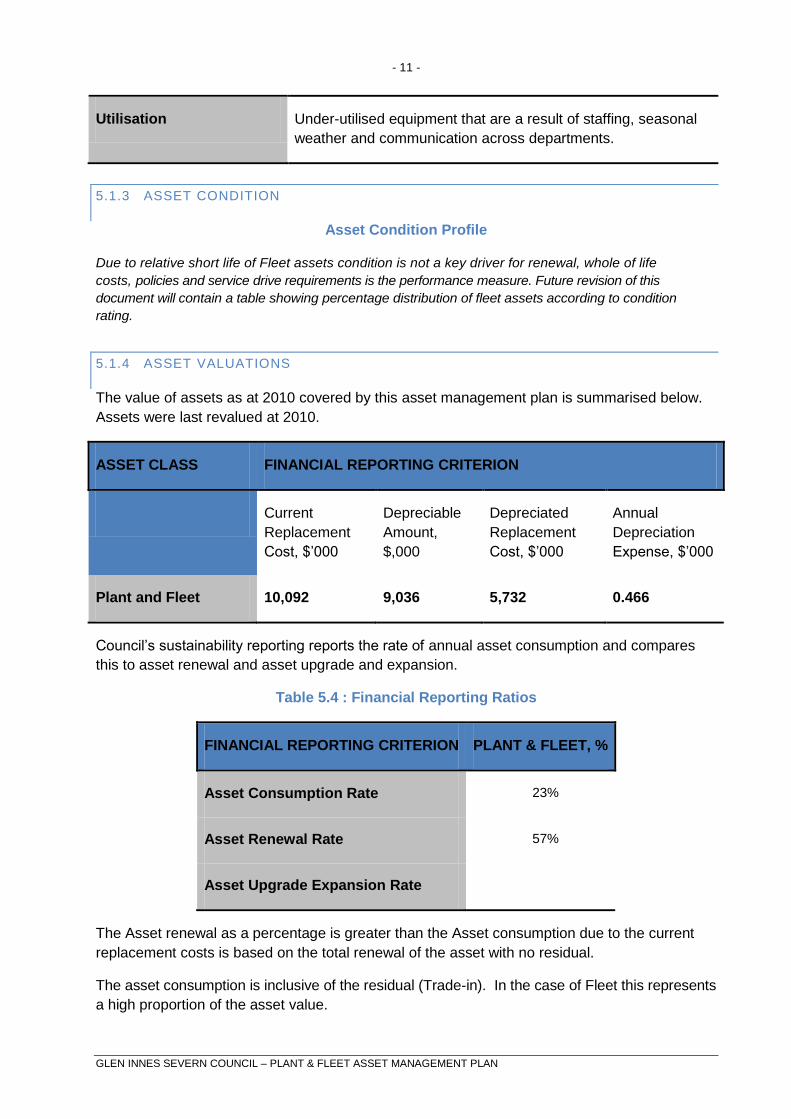
Utilisation Under-utilised equipment that are a result of staffing, seasonal
weather and communication across departments.
5.1.3 ASSET CONDITION
Asset Condition Profile
Due to relative short life of Fleet assets condition is not a key driver for renewal, whole of life
costs, policies and service drive requirements is the performance measure. Future revision of this
document will contain a table showing percentage distribution of fleet assets according to condition
rating.
5.1.4 ASSET VALUATIONS
The value of assets as at 2010 covered by this asset management plan is summarised below.
Assets were last revalued at 2010.
ASSET CLASS FINANCIAL REPORTING CRITERION
Current
Replacement
Cost, $’000
Depreciable
Amount,
$,000
Depreciated
Replacement
Cost, $’000
Annual
Depreciation
Expense, $’000
Plant and Fleet 10,092 9,036 5,732 0.466
Council’s sustainability reporting reports the rate of annual asset consumption and compares
this to asset renewal and asset upgrade and expansion.
Table 5.4 : Financial Reporting Ratios
FINANCIAL REPORTING CRITERION PLANT & FLEET, %
Asset Consumption Rate 23%
Asset Renewal Rate 57%
Asset Upgrade Expansion Rate
The Asset renewal as a percentage is greater than the Asset consumption due to the current
replacement costs is based on the total renewal of the asset with no residual.
The asset consumption is inclusive of the residual (Trade-in). In the case of Fleet this represents
a high proportion of the asset value.

- 12 -
GLEN INNES SEVERN COUNCIL – PLANT & FLEET ASSET MANAGEMENT PLAN
It is unlikely that there will be correlation between these ratios due to the difference in Gross
replacement costs and the net replacement costs.
5.2 RISK MANAGEMENT PLAN
An assessment of risks1 associated with service delivery from plant and fleet assets has
identified critical risks to Council. The risk assessment process identifies credible risks, the
likliehood of the risk event occurring, the consequences should the event occur, develops a risk
rating, evaluates the risk and develops a risk treatment plan for non-acceptable risks.
Critical risks, being those assessed as ‘Very High’ - requiring immediate corrective action and
‘High’ – requiring prioritised corrective action identified in the infrastructure risk management
plan are summarised in Table 5.2. There are no critical risks for plant at this time. Although not
identified as critical, medium and low risks have also been included in this table.
Table 5.2. Critical Risks and Treatment Plans
ASSET AT RISK WHAT CAN HAPPEN RISK
RATING
(VH, H)
RISK TREATMENT PLAN
Fleet Physical injury to
staff, public or assets
M Safety inspections, signage,
engineering, personal protective
equipment and training
Fleet Excessive downtime
for repairs effecting
user productivity and
increase whole of life
costs
M A change in the use of the machine.
Operator training, communication
between Workshop and Users
Fleet Inadequate or
unsuitable plant and
equipment
L Consultation process to ensure
provision of plant matches the needs
of the user and is of design and
standard that is fit for the purpose of
intended use.

- 13 -
GLEN INNES SEVERN COUNCIL – PLANT & FLEET ASSET MANAGEMENT PLAN
5.3 ROUTINE MAINTENANCE PLAN
Routine maintenance is the regular on-going work that is necessary to keep assets operating,
including instances where portions of the asset fail and need immediate repair to make the
asset operational again.
5.3.1 MAINTENANCE PLAN
Maintenance includes reactive, planned and cyclic maintenance work activities.
Reactive maintenance is unplanned repair work carried out in response to service requests and
management/supervisory directions.
Planned maintenance is repair work that is identified and managed through a maintenance
management system (MMS). MMS activities include inspection, assessing the condition
against failure/breakdown experience, prioritising, scheduling, actioning the work and reporting
what was done to develop a maintenance history and improve maintenance and service
delivery performance.
Cyclic maintenance is replacement of higher value components/sub-components of assets that
is undertaken on a regular cycle including repainting, building roof replacement, etc. This work
generally falls below the capital/maintenance threshold.
Maintenance expenditure trends are shown in Table 5.3.1
Table 5.3.1. Maintenance Expenditure Trends
YEAR MAINTENANCE
EXPENDITURE
2007/08 $545,268
2008/09 $388,375
2009/10 $411,957
2010/11 $222,878 (6 months)
Maintenance expenditure levels are considered to be adequate to meet required service levels.
Future revision of this will include linking required maintenance expenditures with required
service levels.

- 14 -
GLEN INNES SEVERN COUNCIL – PLANT & FLEET ASSET MANAGEMENT PLAN
Assessment and prioritisation of reactive maintenance is undertaken by GISC staff using
experience and judgement. Future plans will differentiate between the expenditure on reactive,
planned and cyclic maintenance.
5.3.2 STANDARDS AND SPECIFICATIONS
Maintenance work is carried out in accordance with the following Standards and Specifications.
All vehicles are provided with fuel cards and odometer reading must be supplied to the service
station attendant. Drivers must also regularly check the oil and coolant levels and tyre pressure.
Periodic servicing of vehicles shall be in accordance with the manufacturer specifications or
lease agreement specifications for the particular vehicle. The driver of the vehicle is responsible
to notify and book in the vehicle for servicing with the Plant & Fleet Coordinator. The
department manager, in collaboration with the workshops, is responsible for ensuring that the
service schedule is maintained.
Accidents must be reported promptly using the appropriate accident report form. Any damage,
malfunction or incorrect operation of equipment within the vehicle must be reported and rectified
as soon as practicable.
5.3.3 SUMMARY OF FUTURE MAINTENANCE EXPENDITURES
Future maintenance expenditure is forecast to trend in line with the value of the asset stock as
shown in Fig 4. Note that all costs are shown in current 2010 dollar values.
Fig 4. Planned Maintenance Expenditure
$0.00
$200.00
$400.00
$600.00
$800.00
$1,000.00
$1,200.00
$1,400.00
$1,600.00
20
11
20
12
20
13
20
14
20
15
20
16
20
17
20
18
20
19
20
20
20
21
20
22
20
23
20
24
20
25
20
26
20
27
20
28
20
29
20
30
($,0
00
)
Year
Planned Maintenance Expenditure (Plant and Fleet)

- 15 -
GLEN INNES SEVERN COUNCIL – PLANT & FLEET ASSET MANAGEMENT PLAN
Deferred maintenance, ie works that are identified for maintenance and unable to be funded are
to be included in the risk assessment process in the infrastructure risk management plan.
Maintenance is funded from Council’s operating budget and grants where available. This is
further discussed in Section 6.2.
5.4 RENEWAL/REPLACEMENT PLAN
Renewal expenditure is major work which does not increase the asset’s design capacity but
restores, rehabilitates, replaces or renews an existing asset to its original service potential.
Work over and above restoring an asset to original service potential is upgrade/expansion or
new works expenditure.
5.4.1 RENEWAL PLAN
Assets requiring renewal are identified from estimates of remaining life obtained from the asset
register through the ‘Renewal Model’. Candidate proposals are inspected to verify accuracy of
remaining life estimate and to develop a preliminary renewal estimate. Verified proposals are
ranked by priority and available funds and scheduled in future works programmes. The priority
ranking criteria is detailed in Table 5.4.1
Table 5.4.1 Renewal Priority Ranking Criteria
CRITERIA WEIGHTING
Alignment with GISC Plan and Goal
Committee Priorities
No Current weighting or ranking against other
Asset Classes
Funding within Log Term Financial Plan No Current weighting or ranking against other
Asset Classes
Current Service Level No Current weighting or ranking against other
Asset Classes
Legislative OHS No Current weighting or ranking against other
Asset Classes
Renewal will be undertaken using ‘low-cost’ renewal methods where practical. The aim of ‘low-
cost’ renewals is to restore the service potential or future economic benefits of the asset by
renewing the assets at a cost less than replacement cost.
Examples of low cost renewal include 4cyl vehicle for the renewal of a 6cyl vehicle.
- 16 -
GLEN INNES SEVERN COUNCIL – PLANT & FLEET ASSET MANAGEMENT PLAN
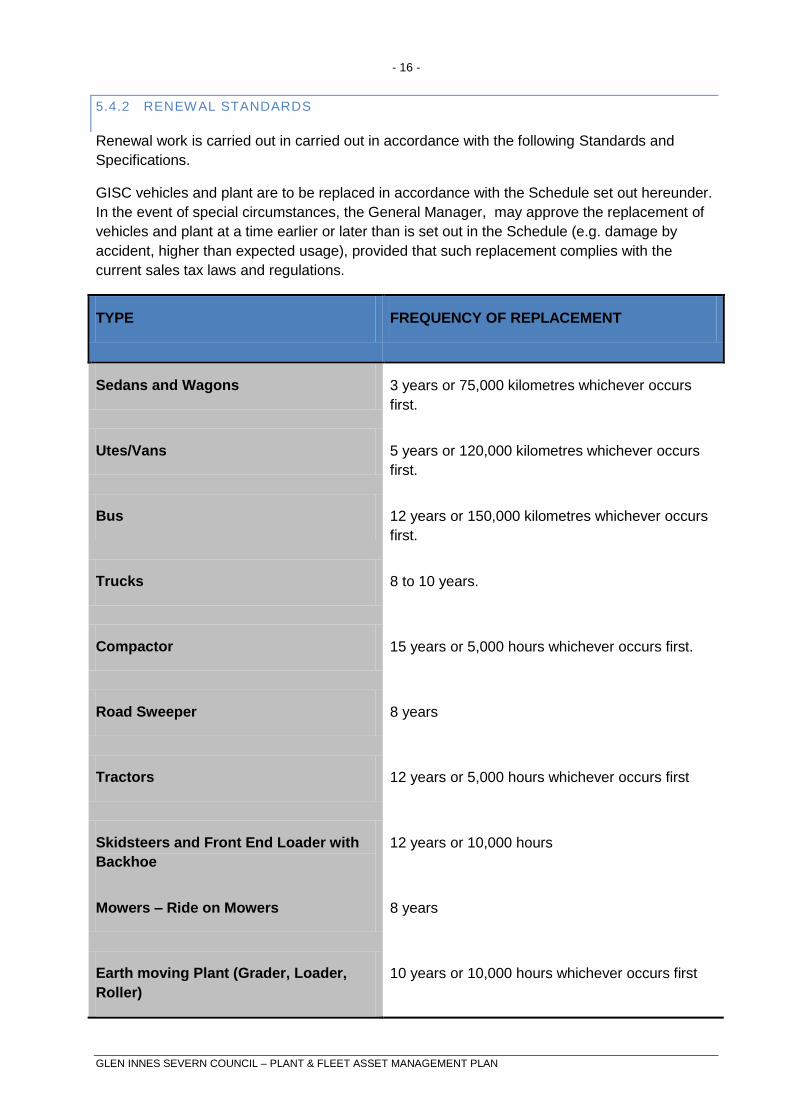
5.4.2 RENEWAL STANDARDS
Renewal work is carried out in carried out in accordance with the following Standards and
Specifications.
GISC vehicles and plant are to be replaced in accordance with the Schedule set out hereunder.
In the event of special circumstances, the General Manager, may approve the replacement of
vehicles and plant at a time earlier or later than is set out in the Schedule (e.g. damage by
accident, higher than expected usage), provided that such replacement complies with the
current sales tax laws and regulations.
TYPE FREQUENCY OF REPLACEMENT
Sedans and Wagons 3 years or 75,000 kilometres whichever occurs
first.
Utes/Vans 5 years or 120,000 kilometres whichever occurs
first.
Bus 12 years or 150,000 kilometres whichever occurs
first.
Trucks 8 to 10 years.
Compactor 15 years or 5,000 hours whichever occurs first.
Road Sweeper 8 years
Tractors 12 years or 5,000 hours whichever occurs first
Skidsteers and Front End Loader with
Backhoe
12 years or 10,000 hours
Mowers – Ride on Mowers 8 years
Earth moving Plant (Grader, Loader,
Roller)
10 years or 10,000 hours whichever occurs first

- 17 -
GLEN INNES SEVERN COUNCIL – PLANT & FLEET ASSET MANAGEMENT PLAN
Other Plant As required
5.4.3 SUMMARY OF FUTURE RENEWAL EXPENDITURE
Projected future renewal expenditures are forecast to increase over time as the asset stock
ages. The costs are summarised in Fig 5. Note that all costs are shown in current 2010 dollar
values.
The projected capital renewal program is shown in Appendix B.
Fig 5. Projected Capital Renewal Expenditure
Expenditure prior to the year 2011 indicates the value of plant assets which are overdue for
replacement, based on the original purchase date of the plant item, and its target replacement
frequency.
Deferred renewal, ie those assets identified for renewal and not scheduled for renewal in capital
works programs are to be included in the risk assessment process in the risk management plan.
Renewals are to be funded from Council’s self-funding plant reserve and grants where
available. This is further discussed in Section 6.2.
- 18 -
GLEN INNES SEVERN COUNCIL – PLANT & FLEET ASSET MANAGEMENT PLAN
5.5 CREATION/ACQUISITION/UPGRADE PLAN
New assets are those items of fleet, plant and equipment that did not previously exist, or items
which are upgraded or improved beyond their existing capacity. They may result from growth,
social or environmental needs. These assets from growth are considered in Section 4.4.
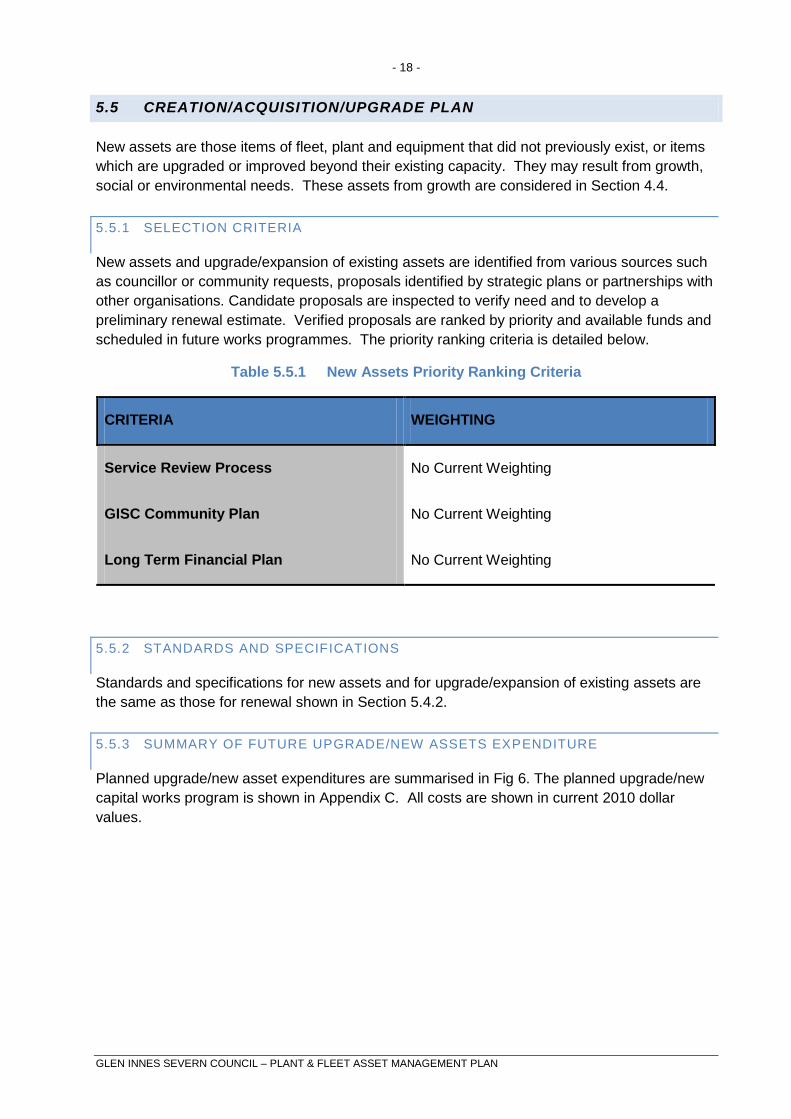
5.5.1 SELECTION CRITERIA
New assets and upgrade/expansion of existing assets are identified from various sources such
as councillor or community requests, proposals identified by strategic plans or partnerships with
other organisations. Candidate proposals are inspected to verify need and to develop a
preliminary renewal estimate. Verified proposals are ranked by priority and available funds and
scheduled in future works programmes. The priority ranking criteria is detailed below.
Table 5.5.1 New Assets Priority Ranking Criteria
CRITERIA WEIGHTING
Service Review Process No Current Weighting
GISC Community Plan No Current Weighting
Long Term Financial Plan No Current Weighting
5.5.2 STANDARDS AND SPECIFICATIONS
Standards and specifications for new assets and for upgrade/expansion of existing assets are
the same as those for renewal shown in Section 5.4.2.
5.5.3 SUMMARY OF FUTURE UPGRADE/NEW ASSETS EXPENDITURE
Planned upgrade/new asset expenditures are summarised in Fig 6. The planned upgrade/new
capital works program is shown in Appendix C. All costs are shown in current 2010 dollar
values.

- 19 -
GLEN INNES SEVERN COUNCIL – PLANT & FLEET ASSET MANAGEMENT PLAN
Fig 6. Planned Capital Upgrade/New Asset Expenditure
New assets and services are to be funded from Council’s capital works program and grants
where available. This is further discussed in Section 6.2.
Note: there are no current new or upgrade of fleet items identified in this version of the plan,
future revisions of this plan may included these assets indentified from service reviews and growth
analysis.
5.6 DISPOSAL PLAN
Disposal includes any activity associated with disposal of a decommissioned asset including
sale, demolition or relocation. Assets identified for possible decommissioning and disposal are
shown in Table 5.6. These assets will be further reinvestigated to determine the required levels
of service and see what options are available for alternate service delivery, if any.

- 20 -
GLEN INNES SEVERN COUNCIL – PLANT & FLEET ASSET MANAGEMENT PLAN
Table 5.6 Assets identified for Disposal
ASSET REASON FOR
DISPOSAL
TIMING CASHFLOW
FROM DISPOSAL
Fleet Trade in On renewal of
plant this is
identified in
the capital
project and
team plans
Three (3) cockerels for gravel
trucks
Obsolete – now use full
service contract for
laying bitumen
2011/12 2,000
Bulldozer Declining utilisation Est. 2015/16 90,000
Pacific Roadbroom 1384 Declining utilisation 2011/12
Where cashflow projections from asset disposals are not available, these will be developed in
future revisions of this asset management plan.
- 21 -
GLEN INNES SEVERN COUNCIL – PLANT & FLEET ASSET MANAGEMENT PLAN
6. FINANCIAL SUMMARY
This section contains the financial requirements resulting from all the information presented in
the previous sections of this asset management plan. The financial projections will be improved
as further information becomes available on desired levels of service and current and projected
future asset performance.
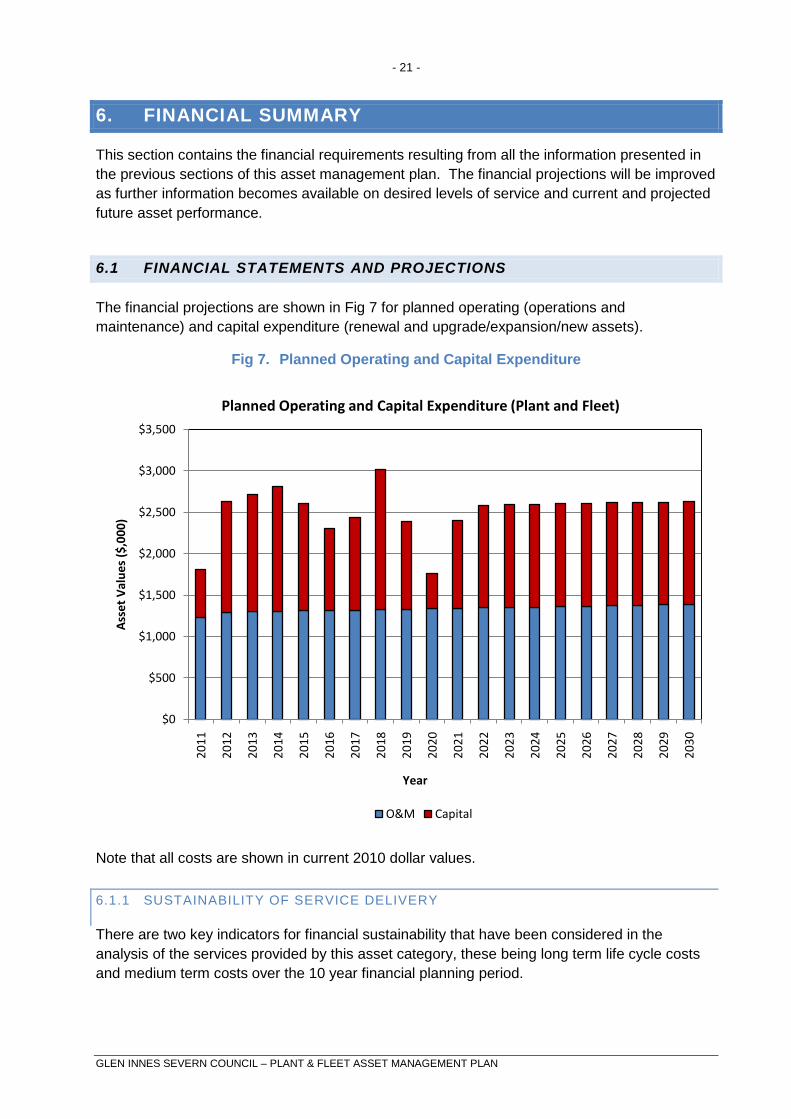
6.1 FINANCIAL STATEMENTS AND PROJECTIONS
The financial projections are shown in Fig 7 for planned operating (operations and
maintenance) and capital expenditure (renewal and upgrade/expansion/new assets).
Fig 7. Planned Operating and Capital Expenditure
Note that all costs are shown in current 2010 dollar values.
6.1.1 SUSTAINABILITY OF SERVICE DELIVERY
There are two key indicators for financial sustainability that have been considered in the
analysis of the services provided by this asset category, these being long term life cycle costs
and medium term costs over the 10 year financial planning period.
$0
$500
$1,000
$1,500
$2,000
$2,500
$3,000
$3,500
20
11
20
12
20
13
20
14
20
15
20
16
20
17
20
18
20
19
20
20
20
21
20
22
20
23
20
24
20
25
20
26
20
27
20
28
20
29
20
30
Ass
et
Val
ue
s ($
,00
0)
Year
Planned Operating and Capital Expenditure (Plant and Fleet)
O&M Capital

- 22 -
GLEN INNES SEVERN COUNCIL – PLANT & FLEET ASSET MANAGEMENT PLAN
Medium term – 10 year financial planning period
This asset management plan identifies the estimated maintenance and capital expenditures
required to provide an agreed level of service to the community over a 20 year period for input
into a 10 year financial plan and funding plan to provide the service in a sustainable manner.
This may be compared to existing or planned expenditures in the 20 year period to identify any
gap. In a core asset management plan, a gap is generally due to increasing asset renewals.
Fig 8 shows the projected asset renewals in the 20 year planning period from the asset register.
The projected asset renewals are compared to planned renewal expenditure in the capital
works program and capital renewal expenditure in year 1 of the planning period as shown in Fig
8. Table 6.1.1 shows the annual and cumulative funding gap between projected and planned
renewals.
Fig 8. Projected and Planned Renewals and Current Renewal Expenditure

- 23 -
GLEN INNES SEVERN COUNCIL – PLANT & FLEET ASSET MANAGEMENT PLAN
Table 6.1.1 shows the gap between projected and planned renewals.
Table 6.1.1 Projected and Planned Renewals and Expenditure Gap
YEAR PROJECTED
RENEWALS
($'000)
PLANNED
RENEWALS
($'000)
RENEWAL
FUNDING GAP
($'000)
CUMULATIVE
GAP
($'000)
2011 $3,430.28 $476.20 $2,954.08 $2,954.08
2012 $257.90 $1,091.00 -$833.10 $2,120.98
2013 $360.55 $1,425.00 -$1,064.45 $1,056.53
2014 $772.10 $1,507.00 -$734.90 $321.63
2015 $429.40 $1,301.00 -$871.60 -$549.97
2016 $864.85 $987.00 -$122.15 -$672.12
2017 $410.90 $1,124.00 -$713.10 -$1,385.22
2018 $1,082.75 $1,695.00 -$612.25 -$1,997.47
2019 $1,011.00 $1,054.00 -$43.00 -$2,040.47
2020 $406.85 $424.00 -$17.15 -$2,057.62
2021 $1,429.25 $1,067.00 $362.25 -$1,695.37
2022 $297.80 $1,238.00 -$940.20 -$2,635.57
2023 $622.40 $1,238.00 -$615.60 -$3,251.17
2024 $509.00 $1,238.00 -$729.00 -$3,980.17
2025 $507.47 $1,238.00 -$730.53 -$4,710.70
2026 $1,605.00 $1,238.00 $367.00 -$4,343.70

- 24 -
GLEN INNES SEVERN COUNCIL – PLANT & FLEET ASSET MANAGEMENT PLAN
2027 $752.00 $1,238.00 -$486.00 -$4,829.70
2028 $854.75 $1,238.00 -$383.25 -$5,212.95
2029 $239.40 $1,238.00 -$998.60 -$6,211.55
2030 $318.50 $1,238.00 -$919.50 -$7,131.05
Providing services in a sustainable manner will require matching of projected asset renewals to
meet agreed service levels with planned capital works programs and available revenue.
A gap between projected asset renewals, planned asset renewals and funding indicates that
further work is required to manage required service levels and funding to eliminate any funding
gap.
Council will manage the ‘gap’ by developing this asset management plan to provide guidance
on future service levels and resources required to provide these services.
Council’s long term financial plan covers the first 10 years of the 20 year planning period.
6.2 FUNDING STRATEGY
Projected expenditure identified in Section 6.1 is to be funded from Council’s operating and
capital budgets. The funding strategy is detailed in the Council’s 10 year long term financial
plan.
Achieving the financial strategy will require internal plant and fleet hire rates to be set at a level
commensurate with projected average capital and maintenance expenditure. A plant
replacement reserve is to be maintained to buffer against variations against the average income
and expenditure from year to year.
6.3 VALUATION FORECASTS
Asset values are forecast to increase as additional assets are added to the asset stock from
construction and acquisition by Council and from assets constructed by land developers and
others and donated to Council. Fig 9 shows the projected replacement cost asset values over
the planning period in current 2010/11 dollar values.

- 25 -
GLEN INNES SEVERN COUNCIL – PLANT & FLEET ASSET MANAGEMENT PLAN
Fig 9. Projected Asset Values
Depreciation expense values are forecast in line with asset values as shown in Fig 10.
Fig 10. Projected Depreciation Expense
- 26 -
GLEN INNES SEVERN COUNCIL – PLANT & FLEET ASSET MANAGEMENT PLAN
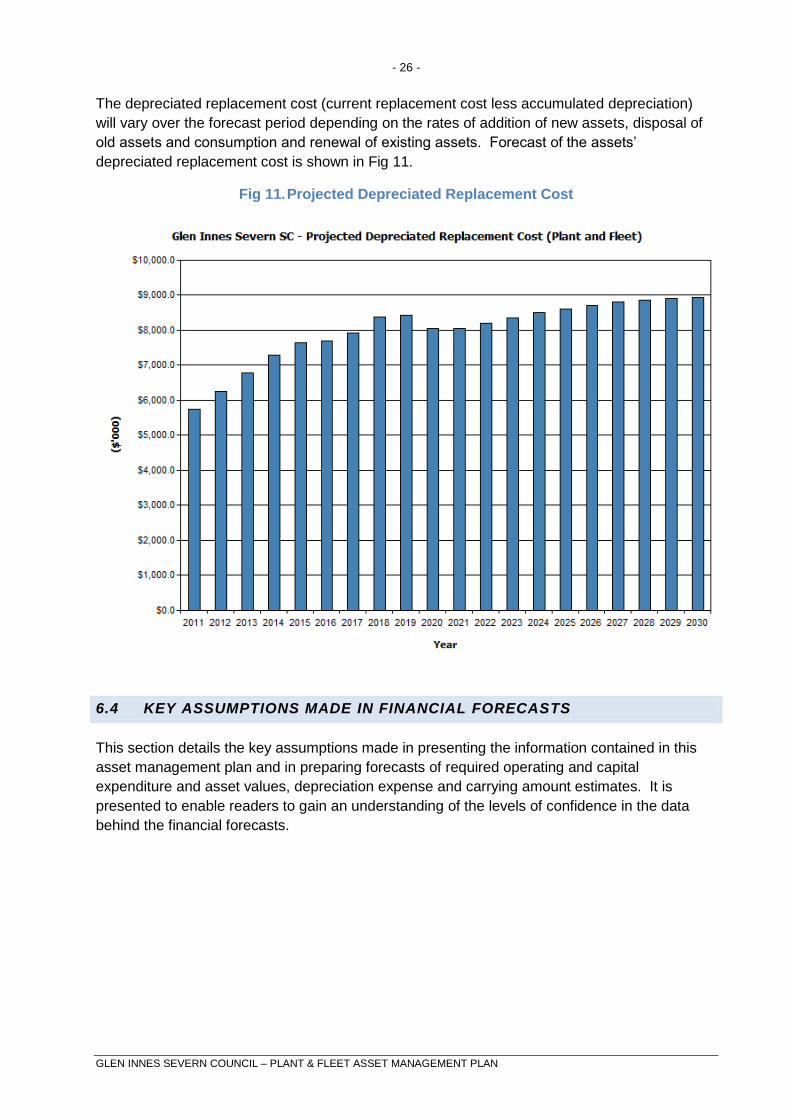
The depreciated replacement cost (current replacement cost less accumulated depreciation)
will vary over the forecast period depending on the rates of addition of new assets, disposal of
old assets and consumption and renewal of existing assets. Forecast of the assets’
depreciated replacement cost is shown in Fig 11.
Fig 11. Projected Depreciated Replacement Cost
6.4 KEY ASSUMPTIONS MADE IN FINANCIAL FORECASTS
This section details the key assumptions made in presenting the information contained in this
asset management plan and in preparing forecasts of required operating and capital
expenditure and asset values, depreciation expense and carrying amount estimates. It is
presented to enable readers to gain an understanding of the levels of confidence in the data
behind the financial forecasts.

- 27 -
GLEN INNES SEVERN COUNCIL – PLANT & FLEET ASSET MANAGEMENT PLAN
Table 6.4 : Key Assumptions
PARAMETER DOCUMENT
SECTION
ASSUMPTION
Asset Values Part 1,
Section 5
Recorded quantities and reviewed unit rates, as
at June 30 of previous year
That Trade-in of Fleet is approximately 60% of
the current replacement costs of the item
identified for replacement
Depreciation Part 1,
Section 7
Straight-line method as AASB116 with reviewed
useful lives applicable as at June 30 of previous
year
Levels of service 3 That our current fleet activities are our current
service level
Demand 4 That our current Fleet replacement program is
based on replacement of existing fleet
Maintenance and Renewal
Expenditure
5 Similar pattern to previous years, with regular
increases to recognise larger asset stock
Accuracy of future financial forecasts may be improved in future revisions of this asset
management plan by the following actions.
Undertaking regular inspections and evaluation of conditions, utilisation.
Undertake analysis of the growth, and build this into future revisions of this Asset
Management Plan.
Improved information systems on maintenance, usage and operating expenditures.
Assumptions have been made as to the average useful lives and remaining lives of the
asset groups based on current local knowledge and experience and historical trends. These
need to be reviewed and the accuracy improved based on real time assessment of asset
deterioration.
Review of the effective economic life which has the potential for greatest variance in
cost predictions.
Changes in the desired level of service and service standards from those identified in
this plan

- 28 -
GLEN INNES SEVERN COUNCIL – PLANT & FLEET ASSET MANAGEMENT PLAN
7. ASSET MANAGEMENT PRACTICES
7.1 ACCOUNTING/FINANCIAL SYSTEMS
Refer Part 1.
7.2 ASSET MANAGEMENT SYSTEMS
Refer Part 1.
7.3 INFORMATION FLOW REQUIREMENTS AND PROCESSES
Refer Part 1.
7.4 STANDARDS AND GUIDELINES
Refer Part 1.
7.5 DATA CONFIDENCE LEVEL
Data confidence levels for this IAMP are rated as B or C.

- 29 -
GLEN INNES SEVERN COUNCIL – PLANT & FLEET ASSET MANAGEMENT PLAN
8. PLAN IMPROVEMENT AND MONITORING
8.1 PERFORMANCE MEASURES
Refer Part 1.
8.2 IMPROVEMENT PLAN
The asset management improvement plan generated from this asset management plan is shown in Table
8.2.
Table 8.2 Improvement Plan
TASK
NO
TASK RESPONSIBILITY RESOURCES
REQUIRED
TIMELINE
1 Investigate utilisation and
develop benchmarks.
MAS Staff June
2011
2 Undertake a major review of
this Asset management plan
on a 2 year cycle.
MAS Staff March
2012
3 Review of risk management
plan detailed in Section 5.2.
MAS Staff March
2012
4 Review cost and maintenance
histories
MAS Staff Sep 2011
5 Lifecycle Costing MAS Staff Sept 2011
6 Improved data collection to
assist in life cycle cost
reduction.
MAS Staff ongoing
8.3 MONITORING AND REVIEW PROCEDURES
Refer Part 1.

- 30 -
GLEN INNES SEVERN COUNCIL – PLANT & FLEET ASSET MANAGEMENT PLAN
REFERENCES
Refer Part 1.
- 31 -
GLEN INNES SEVERN COUNCIL – PLANT & FLEET ASSET MANAGEMENT PLAN
APPENDICES
APPENDIX A MAINTENANCE RESPONSE LEVELS OF SERVICE
Not available at this time

- 32 -
GLEN INNES SEVERN COUNCIL – PLANT & FLEET ASSET MANAGEMENT PLAN
APPENDIX B PLANNED EXPENDITURES FOR LONG TERM FINANCIAL PLAN (PLANT AND FLEET)
YEAR
END
JUN-
30
TOTAL
OPERATIONS
&
MAINTENANCE
EXPENDITURE
($'000)
TOTAL
MAINTENANCE
EXPENDITURE
($'000)
PROJECTED
CAPITAL
RENEWAL
EXPENDITURE
($'000)
PLANNED
CAPITAL
UPGRADE/NEW
EXPENDITURE
($'000)
PLANNED
DISPOSALS
($'000)
PLANNED
CAPITAL
RENEWAL
EXPENDITURE
($'000)
SHORTFALL
IN RENEWAL
EXPENDITURE
(PROJECTED -
PLANNED)
($'000)
CUMULATIVE
RENEWAL
FUNDING
SHORTFALL
($'000)
2011 $594.00 $634.80 $3,430.28 $100.00 $88.00 $476.20 $2,954.08 $2,954.08
2012 $744.33 $546.50 $257.90 $251.00 $364.00 $1,091.00 -$833.10 $2,120.98
2013 $748.05 $548.14 $360.55 $0.00 $393.00 $1,425.00 -$1,064.45 $1,056.53
2014 $751.79 $549.78 $772.10 $0.00 $473.00 $1,507.00 -$734.90 $321.63
2015 $755.55 $551.43 $429.40 $0.00 $420.00 $1,301.00 -$871.60 -$549.97
2016 $759.32 $553.09 $864.85 $0.00 $365.00 $987.00 -$122.15 -$672.12
2017 $763.12 $554.75 $410.90 $0.00 $326.00 $1,124.00 -$713.10 -$1,385.22
2018 $766.94 $556.41 $1,082.75 $0.00 $626.00 $1,695.00 -$612.25 -$1,997.47

- 33 -
GLEN INNES SEVERN COUNCIL – PLANT & FLEET ASSET MANAGEMENT PLAN
2019 $770.77 $558.08 $1,011.00 $0.00 $377.00 $1,054.00 -$43.00 -$2,040.47
2020 $774.62 $559.75 $406.85 $0.00 $167.00 $424.00 -$17.15 -$2,057.62
2021 $778.50 $561.43 $1,429.25 $0.00 $434.00 $1,067.00 $362.25 -$1,695.37
2022 $782.39 $563.12 $297.80 $0.00 $397.00 $1,238.00 -$940.20 -$2,635.57
2023 $786.30 $564.81 $622.40 $0.00 $397.00 $1,238.00 -$615.60 -$3,251.17
2024 $790.23 $566.50 $509.00 $0.00 $397.00 $1,238.00 -$729.00 -$3,980.17
2025 $794.18 $568.20 $507.47 $0.00 $397.00 $1,238.00 -$730.53 -$4,710.70
2026 $798.16 $569.91 $1,605.00 $0.00 $397.00 $1,238.00 $367.00 -$4,343.70
2027 $802.15 $571.62 $752.00 $0.00 $397.00 $1,238.00 -$486.00 -$4,829.70
2028 $806.16 $573.33 $854.75 $0.00 $397.00 $1,238.00 -$383.25 -$5,212.95
2029 $810.19 $575.05 $239.40 $0.00 $397.00 $1,238.00 -$998.60 -$6,211.55
2030 $814.24 $576.78 $318.50 $0.00 $397.00 $1,238.00 -$919.50 -$7,131.05

- 34 -
GLEN INNES SEVERN COUNCIL – PLANT & FLEET ASSET MANAGEMENT PLAN
APPENDIX C PROJECTED 10 YEAR CAPITAL WORKS PROGRAM
Draft 10-Year Fleet Capital Program 2011/12 to 2021/22
TOTAL TOTAL TOTAL TOTAL TOTAL TOTAL TOTAL TOTAL TOTAL TOTAL Comment/Warrant
Plant No.
Project Description 2011/12 2012/13 2013/14 2014/15 2015/16 2016/17 2017/18 2018/19 2019/20 2020/21
PLANT & FLEET 983,000
1,032,000
1,034,000
881,000
712,000
798,000
1,069,000
657,000
257,000
633,000
MAJOR PLANT 575,000
630,000
690,000
650,000
480,000
420,000
710,000
360,000
60,000
320,000
New Screening attachment for Loader/Excavator
40,000
Improve natural gravels / recycling
New Tandem grader roller attachment 125,000
Reduce mtce costs from drawn rollers
New Slip-on water tanks 10,000L x2 60,000
Reduce contractor water costs
1103 Hino F182 Tipping Truck 95,000
Plant age
1212 CASE 621C Loader.
150,000
150,000
1306 Massey Ferguson Tractor 3690 - 20,000
Operating lease - industrial tractor
1361 Roller Multipac VP200 130,000
1405 Projet Muni Sewer Cleaning Machine
Operating lease
1102 Hino Ranger Nine
110,000
1106 Hino Ranger 10
110,000
1112 Hino Ranger 50
150,000
1213 Kubota Thomas Skid Steer Loader
60,000
Reliability
1301 John Deere 6110 Tractor
90,000
1308 Kubota Tractor 25HP
40,000
1312 Kubota 4WD Mower
40,000
1313 Kubota F3560 Outfront Mower
30,000
1701 Pump De-watering
1929 Flo-tote Flow Meter
20,000

- 35 -
GLEN INNES SEVERN COUNCIL – PLANT & FLEET ASSET MANAGEMENT PLAN
2311 Kubota 3560 Outfront Mower
30,000
1104 Hino Ranger FD2JLLA
70,000
1107 Hino Ranger 14. FM1JLPM
130,000
1202 Cat 12H Series II VHP+ Grader
240,000
1222 Komatsu D65EX Bulldozer
-
Consider contracted/leased plant
1303 John Deere Tractor 110,000
1383 Pacific Road Broom (Newer)
20,000
1401 Cherry Picker
40,000
1111 Lorry 11 (Toyota Dyna) BU212
40,000
Consider low hour 2nd hand unit
1114 Hino Ranger 10
110,000
-
1116 Mitsubishi FK415
90,000
1302 New Holland. TS115
80,000
1305 New Holland. TD85D
50,000
1307 New Holland TD55D
40,000
1362 Dynapac CA302D Roller
120,000
1366 Drawn Vib Sheepsfoot
20,000
1384 Pacific Road Broom
-
1617 Hydor Compressor 3 Point
50,000
1618 Atlas Compressor 158 L/S
40,000
1941 Pearpoint ELS Flexiprobe Camera
40,000
2105 Hino Ranger Pro 6
50,000
2158 Jetpatcher Unit (truck is plant 2110)
140,000
1113 Hino Street Sweeper 75,000
Replace with 2nd hand unit
1156 Low Loader
40,000
1211 Loader Cat 916-1986
160,000

- 36 -
GLEN INNES SEVERN COUNCIL – PLANT & FLEET ASSET MANAGEMENT PLAN
1215 JCB 3CX Backhoe - 40,000
-
Replace with leased unit
1224 Hyster Forklift
20,000
1225 Forklift Mitsubishi
20,000
2204 John Deere Grader
220,000
1252 Roller Free-Roll Cat12G 202
40,000
2110 Isuzu
90,000
1117 Cabstar Truck 3T/88
40,000
1217 Skid Steer New Holland L175
50,000
1314 Toro Groundmaster 5900
60,000
1797 Wacker Rammer (New)
20,000
2117 Isuzu FRR500 Long Sewer Truck
60,000
2203 Volvo G930 (HTE1160) Grader
240,000
2205 Volvo G930 (HTE1160) Grader
240,000
2214 KOMATSU WB93R-2 Loader
120,000
1121 Hino 3007B
40,000
1258 Stickrake
50,000
1365 Pannell DW Vib S 10T Roller
40,000
1369 Hyster Impact Roller
50,000
2221 Komatsu Excavator
140,000
1367 Pacific Vibrating Flat Roller
20,000
1368 Hyster Model D Grid Roller
40,000
1370 Pacific Vibrating Sheepsfoot Roller
20,000
2116 Isuzu FRR500 Long
60,000
1418 A1 Roadlines Portable Traffic Lights Lead Trailer
20,000
1419 A1 Roadlines Portable Traffic Lights B Trailer
20,000

- 37 -
GLEN INNES SEVERN COUNCIL – PLANT & FLEET ASSET MANAGEMENT PLAN
2157 Hockney Water Tanker 25kL
50,000
LIGHT VEHICLES (In plant system) 284,000
201,000
248,000
121,000
102,000
282,000
249,000
202,000
101,000
168,000
LIGHT VEHICLES - Community Services 104,000
181,000
76,000
90,000
110,000
76,000
90,000
75,000
76,000
125,000
MINOR PLANT & EQUIPMENT 20,000
20,000
20,000
20,000
20,000
20,000
20,000
20,000
20,000
20,000