Embed Size (px)
Citation preview
Ecology, 91(2), 2010, pp. 485–496� 2010 by the Ecological Society of America
Plant diversity effects on soil microorganisms supportthe singular hypothesis
N. EISENHAUER,1,8 H. BEßLER,2 C. ENGELS,2 G. GLEIXNER,3 M. HABEKOST,3 A. MILCU,4 S. PARTSCH,1 A. C. W. SABAIS,1
C. SCHERBER,5 S. STEINBEISS,3,6 A. WEIGELT,7 W. W. WEISSER,7 AND S. SCHEU1
1Darmstadt University of Technology, Institute of Zoology, Schnittspahnstrasse 3, 64287 Darmstadt, Germany2Humboldt University of Berlin, Department of Plant Nutrition and Fertilization, Albrecht-Thaer-Weg 4, 14195 Berlin, Germany
3Max Planck Institute for Biogeochemistry, POB 100164, 07701 Jena, Germany4NERC Centre for Population Biology, Division of Biology, Imperial College London, Silwood Park Campus,
Ascot, Berkshire, United Kingdom5University of Goettingen, Institute of Agroecology, Waldweg 26, 37073 Goettingen, Germany
6Helmholtz Center Munich, Institute of Groundwater Ecology, Ingolstaedter Landstraße 1, 85764 Neuherberg, Germany7University of Jena, Institute of Ecology, Dornburger Strasse 159, 07743 Jena, Germany
Abstract. The global decline in biodiversity has generated concern over the consequencesfor ecosystem functioning and services. Although ecosystem functions driven by soilmicroorganisms such as plant productivity, decomposition, and nutrient cycling are ofparticular importance, interrelationships between plant diversity and soil microorganisms arepoorly understood. We analyzed the response of soil microorganisms to variations in plantspecies richness (1–60) and plant functional group richness (1–4) in an experimental grasslandsystem over a period of six years. Major abiotic and biotic factors were considered forexploring the mechanisms responsible for diversity effects. Further, microbial growthcharacteristics were assessed following the addition of macronutrients. Effects of plantdiversity on soil microorganisms were most pronounced in the most diverse plant communitiesthough differences only became established after a time lag of four years. Differences inmicrobial growth characteristics indicate successional changes from a disturbed (zymoge-neous) to an established (autochthonous) microbial community four years after establishmentof the experiment. Supporting the singular hypothesis for plant diversity, the results suggestthat plant species are unique, each contributing to the functioning of the belowground system.The results reinforce the need for long-term biodiversity experiments to fully appreciateconsequences of current biodiversity loss for ecosystem functioning.
Key words: above- and belowground interrelationships; biodiversity–ecosystem functioning relationship;Jena Experiment; microbial biomass; microbial nutrient limitation; microbial respiration; redundancyhypothesis.
INTRODUCTION
One of the most dramatic consequences of contem-
porary global change is the rapid decline of biodiversity
in many ecosystems (Vitousek et al. 1997, Tilman 2000,
Loreau et al. 2001). This unprecedented loss of
biodiversity has generated concern over the consequenc-
es for ecosystem functioning and services (Sala et al.
2000, Loreau et al. 2001, Jenkins 2003, Millenium
Ecosystem Assessment 2005), in particular those related
to nutrient cycling which form vital agricultural pro-
visioning services. Plants as producers acquire nutrients
from inorganic sources that are supplied primarily by
decomposers, whereas decomposers, mostly soil micro-
organisms, acquire carbon from organic resources that
are supplied primarily by producers. Therefore, declin-
ing biodiversity has profound impacts on this producer–
decomposer codependency that governs essential eco-
system processes (Naeem et al. 2000). Plant-derived
inputs enter the belowground system via leaf and root
litter, rhizodeposits, and exudates (Naeem et al. 2000,
Wardle et al. 2004). Since plant species differ in their
biochemical composition, changes in plant diversity
likely alter the quantity and quality of these resources,
thereby controlling the composition and functioning of
soil microbial communities (Zak et al. 2003, Nilsson et
al. 2008). Moreover, plant diversity impacts microcli-
matic conditions (Lorentzen et al. 2008) and these are
major driving factors of microbial processes (Freiberg
1998), such as carbon and nitrogen cycling, thereby
linking plant diversity and ecosystem functioning
(Naeem et al. 2000, Zak et al. 2003).
Changes in plant diversity are known to affect
aboveground ecosystem functioning (Tilman et al.
2001, Cardinale et al. 2007, Hector and Bagchi 2007),
Manuscript received 19 December 2008; revised 31 March2009; accepted 15 May 2009. Corresponding Editor: B. J. M.Bohannan.
8 Present address: J. F. Blumenbach Institute of Zoologyand Anthropology, Georg-August-University Gottingen,Berliner Strasse 28, 37073 Gottingen, Germany.E-mail: [email protected]
485
but it is increasingly recognized that it also alters the
structure and functioning of belowground systems
(Naeem et al. 2000, Zak et al. 2003, Wardle et al.
2004, Bardgett et al. 2005). Previous studies investigat-
ing the impact of plant diversity on soil microorganisms
reported either positive (Bardgett and Shine 1999, Spehn
et al. 2000, Zak et al. 2003, Liu et al. 2008, Milcu et al.
2008) or no effects (Gastine et al. 2003, Hedlund et al.
2003, Habekost et al. 2008). Most studies supported the
redundancy hypothesis of plant diversity, assuming that
more than one species performs a given role within an
ecosystem (Walker 1992, Naeem and Li 1997), and not
the singular hypothesis, assuming that each species
contributes to ecosystem functioning (Naeem et al.
2002). In addition, results of a number of studies
suggested particular significance of certain plant func-
tional groups such as legumes, with the impact on soil
microorganisms being primarily due to changes in plant
productivity (Spehn et al. 2000, Zak et al. 2003, Milcu et
al. 2008). Moreover, the existence of key plant
functional groups argue for sampling effects of biodi-
versity, i.e., increased probability of presence of certain
plant functional groups or species at high diversity levels
(Huston 1997). In contrast, complementarity effects
refer to positive species interactions and to differences
among species in resource exploitation resulting in a
linear relationship between diversity and ecosystem
functioning (Loreau 2000, Naeem et al. 2002). Similarly,
the singular hypothesis also suggests that loss or
addition of species causes detectable changes in ecosys-
tem functioning (Naeem et al. 2002); however, a linear
relationship is not postulated since species might differ
in their contribution to ecosystem functioning.
The recent review on effects of plant diversity on
productivity by Cardinale et al. (2007) suggests that
effects of diversity increase with time because of species
complementarity. The authors concluded that due to the
short duration of most biodiversity experiments the
impact of species extinctions on ecosystem functioning
likely has been underestimated. Since microbial com-
munities respond to changes in land-use and plant
diversity with a time lag (Hedlund et al. 2003, Bartelt-
Ryser et al. 2005, Habekost et al. 2008, Kulmatiski and
Beard 2008), plant diversity effects on soil microorgan-
isms and processes mediated by them likely also have
been underestimated.
Previous biodiversity–ecosystem functioning studies
suffered from limitations such as singular measure-
ments, lack of explanatory variables, and an inability to
separate effects of plant species from that of functional
groups (Spehn et al. 2000, Hedlund et al. 2003, Zak et al.
2003). Consequently, results have been disputed and
little is known on how soil microorganisms respond to
differences in plant species and functional group
richness. To overcome these deficiencies, we investigated
the functioning of microbial communities over a period
of six years in a grassland experiment (the Jena
Experiment), where plant species richness (1–60),
functional group richness (1–4), and the presence of
particular plant functional groups (grasses, legumes,small herbs, and tall herbs) were varied systematically.
Furthermore, a wide range of ecosystem parameterswere determined and considered as potential explanato-
ry variables during statistical analyses and data inter-pretation. We hypothesized that (1) the effects of plant
diversity on soil microorganisms increase with time, (2)plant diversity affects soil microorganisms mainly byincreased plant productivity and the presence of key
plant functional groups, and (3) plant functional grouprichness is more important for soil microorganisms than
plant species richness.
METHODS
Experimental setup
The study was conducted in the framework of the
Jena Experiment, a large field experiment investigatingthe role of biodiversity for element cycling and trophic
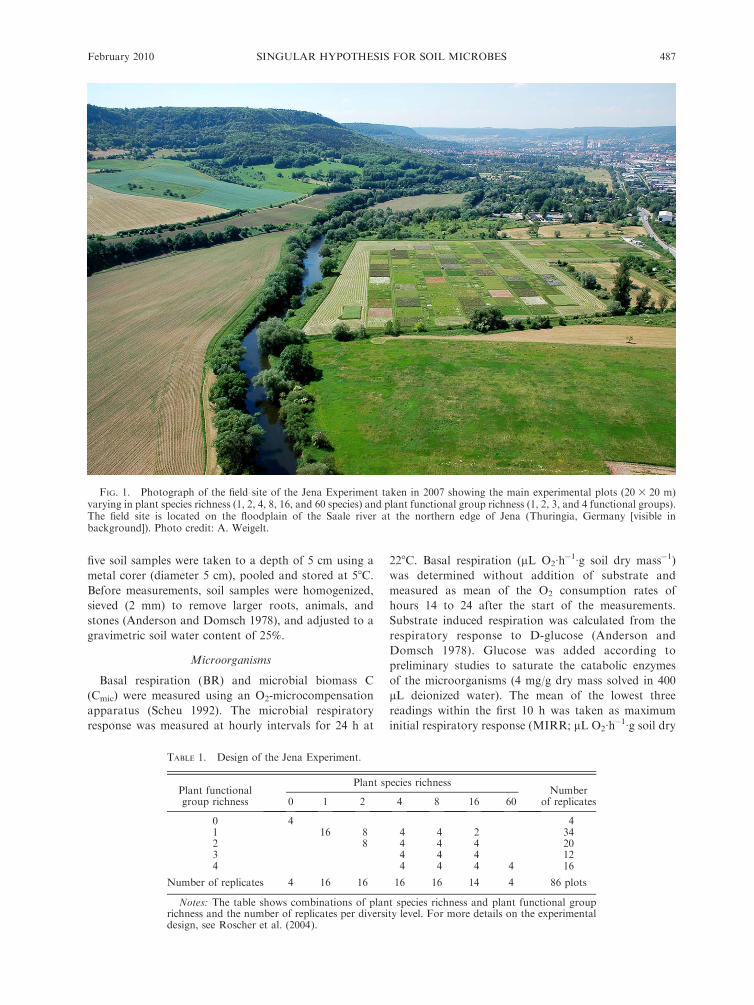
interactions in grassland communities (Roscher et al.2004). The study site is located on the floodplain of the
Saale River at the northern edge of Jena (Thuringia,Germany; Fig. 1). Mean annual air temperature 3 kmsouth of the field site is 9.38C and annual precipitation is
587 mm (Kluge and Muller-Westermeier 2000). The sitehad been used as an arable field for the last 40 years and
the soil is an Eutric Fluvisol. The experiment wasestablished in May 2002 and the studied system
represents Central European mesophilic grassland tra-ditionally used as hay meadow (Arrhenatherion com-
munity). A pool of 60 native plant species was used toestablish a gradient of plant species (1, 2, 4, 8, 16, and
60) and plant functional group richness (1, 2, 3, and 4) ina total of 82 plots of 20 3 20 m (Table 1; Roscher et al.
2004). Further, bare ground plots were establishedwithout plants (0 species). Using above- and below-
ground morphological traits (growth form, canopyheight, rooting depth and capacity for clonal growth),
phenological traits (occupancy of seasonal niches, lifecycle and seasonality of foliage) and N2 fixation ability,
plant species were aggregated into four plant functionalgroups: grasses (16 species), small herbs (12 species), tall
herbs (20 species), and legumes (12 species). More detailson the classification of plant functional groups are givenin Roscher et al. (2004). Experimental plots were mown
twice a year (June and September), as is typical for haymeadows, and weeded twice a year (April and July) to
maintain the target species composition. Plots wereassembled into four blocks following a gradient in soil
characteristics, each block containing an equal numberof plots of plant species and plant functional group
richness levels. Further information on the design andsetup of the Jena Experiment is given in Roscher et al.
(2004).
Sampling
Soil samples were taken from all plots in May 2003,
2004, 2006, 2007, and 2008. At each sampling campaign,
N. EISENHAUER ET AL.486 Ecology, Vol. 91, No. 2
five soil samples were taken to a depth of 5 cm using a
metal corer (diameter 5 cm), pooled and stored at 58C.
Before measurements, soil samples were homogenized,
sieved (2 mm) to remove larger roots, animals, and
stones (Anderson and Domsch 1978), and adjusted to a
gravimetric soil water content of 25%.
Microorganisms
Basal respiration (BR) and microbial biomass C
(Cmic) were measured using an O2-microcompensation
apparatus (Scheu 1992). The microbial respiratory
response was measured at hourly intervals for 24 h at
228C. Basal respiration (lL O2�h�1�g soil dry mass�1)
was determined without addition of substrate and
measured as mean of the O2 consumption rates of
hours 14 to 24 after the start of the measurements.
Substrate induced respiration was calculated from the
respiratory response to D-glucose (Anderson and
Domsch 1978). Glucose was added according to
preliminary studies to saturate the catabolic enzymes
of the microorganisms (4 mg/g dry mass solved in 400
lL deionized water). The mean of the lowest three
readings within the first 10 h was taken as maximum
initial respiratory response (MIRR; lL O2�h�1�g soil dry
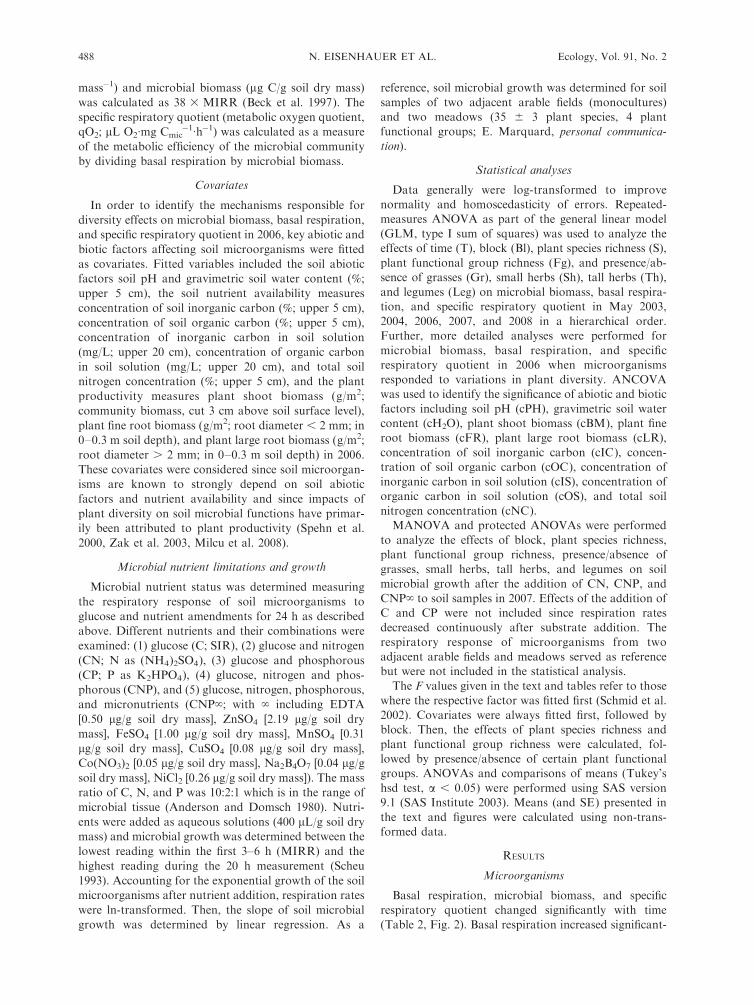
FIG. 1. Photograph of the field site of the Jena Experiment taken in 2007 showing the main experimental plots (20 3 20 m)varying in plant species richness (1, 2, 4, 8, 16, and 60 species) and plant functional group richness (1, 2, 3, and 4 functional groups).The field site is located on the floodplain of the Saale river at the northern edge of Jena (Thuringia, Germany [visible inbackground]). Photo credit: A. Weigelt.
TABLE 1. Design of the Jena Experiment.
Plant functionalgroup richness
Plant species richnessNumber
of replicates0 1 2 4 8 16 60
0 4 41 16 8 4 4 2 342 8 4 4 4 203 4 4 4 124 4 4 4 4 16
Number of replicates 4 16 16 16 16 14 4 86 plots
Notes: The table shows combinations of plant species richness and plant functional grouprichness and the number of replicates per diversity level. For more details on the experimentaldesign, see Roscher et al. (2004).
February 2010 487SINGULAR HYPOTHESIS FOR SOIL MICROBES
mass�1) and microbial biomass (lg C/g soil dry mass)
was calculated as 38 3 MIRR (Beck et al. 1997). The
specific respiratory quotient (metabolic oxygen quotient,
qO2; lL O2�mg Cmic�1�h�1) was calculated as a measure
of the metabolic efficiency of the microbial community
by dividing basal respiration by microbial biomass.
Covariates
In order to identify the mechanisms responsible for
diversity effects on microbial biomass, basal respiration,
and specific respiratory quotient in 2006, key abiotic and
biotic factors affecting soil microorganisms were fitted
as covariates. Fitted variables included the soil abiotic
factors soil pH and gravimetric soil water content (%;
upper 5 cm), the soil nutrient availability measures
concentration of soil inorganic carbon (%; upper 5 cm),
concentration of soil organic carbon (%; upper 5 cm),
concentration of inorganic carbon in soil solution
(mg/L; upper 20 cm), concentration of organic carbon
in soil solution (mg/L; upper 20 cm), and total soil
nitrogen concentration (%; upper 5 cm), and the plant
productivity measures plant shoot biomass (g/m2;
community biomass, cut 3 cm above soil surface level),
plant fine root biomass (g/m2; root diameter , 2 mm; in
0–0.3 m soil depth), and plant large root biomass (g/m2;
root diameter . 2 mm; in 0–0.3 m soil depth) in 2006.
These covariates were considered since soil microorgan-
isms are known to strongly depend on soil abiotic
factors and nutrient availability and since impacts of
plant diversity on soil microbial functions have primar-
ily been attributed to plant productivity (Spehn et al.
2000, Zak et al. 2003, Milcu et al. 2008).
Microbial nutrient limitations and growth
Microbial nutrient status was determined measuring
the respiratory response of soil microorganisms to
glucose and nutrient amendments for 24 h as described
above. Different nutrients and their combinations were
examined: (1) glucose (C; SIR), (2) glucose and nitrogen
(CN; N as (NH4)2SO4), (3) glucose and phosphorous
(CP; P as K2HPO4), (4) glucose, nitrogen and phos-
phorous (CNP), and (5) glucose, nitrogen, phosphorous,
and micronutrients (CNP‘; with ‘ including EDTA
[0.50 lg/g soil dry mass], ZnSO4 [2.19 lg/g soil dry
mass], FeSO4 [1.00 lg/g soil dry mass], MnSO4 [0.31
lg/g soil dry mass], CuSO4 [0.08 lg/g soil dry mass],
Co(NO3)2 [0.05 lg/g soil dry mass], Na2B4O7 [0.04 lg/gsoil dry mass], NiCl2 [0.26 lg/g soil dry mass]). The mass
ratio of C, N, and P was 10:2:1 which is in the range of
microbial tissue (Anderson and Domsch 1980). Nutri-
ents were added as aqueous solutions (400 lL/g soil dry
mass) and microbial growth was determined between the
lowest reading within the first 3–6 h (MIRR) and the
highest reading during the 20 h measurement (Scheu
1993). Accounting for the exponential growth of the soil
microorganisms after nutrient addition, respiration rates
were ln-transformed. Then, the slope of soil microbial
growth was determined by linear regression. As a
reference, soil microbial growth was determined for soil
samples of two adjacent arable fields (monocultures)and two meadows (35 6 3 plant species, 4 plant
functional groups; E. Marquard, personal communica-tion).
Statistical analyses
Data generally were log-transformed to improve
normality and homoscedasticity of errors. Repeated-measures ANOVA as part of the general linear model
(GLM, type I sum of squares) was used to analyze theeffects of time (T), block (Bl), plant species richness (S),
plant functional group richness (Fg), and presence/ab-sence of grasses (Gr), small herbs (Sh), tall herbs (Th),
and legumes (Leg) on microbial biomass, basal respira-tion, and specific respiratory quotient in May 2003,
2004, 2006, 2007, and 2008 in a hierarchical order.Further, more detailed analyses were performed for
microbial biomass, basal respiration, and specificrespiratory quotient in 2006 when microorganisms
responded to variations in plant diversity. ANCOVAwas used to identify the significance of abiotic and biotic
factors including soil pH (cPH), gravimetric soil watercontent (cH2O), plant shoot biomass (cBM), plant fineroot biomass (cFR), plant large root biomass (cLR),
concentration of soil inorganic carbon (cIC), concen-tration of soil organic carbon (cOC), concentration of
inorganic carbon in soil solution (cIS), concentration oforganic carbon in soil solution (cOS), and total soil
nitrogen concentration (cNC).MANOVA and protected ANOVAs were performed
to analyze the effects of block, plant species richness,plant functional group richness, presence/absence of
grasses, small herbs, tall herbs, and legumes on soilmicrobial growth after the addition of CN, CNP, and
CNP‘ to soil samples in 2007. Effects of the addition ofC and CP were not included since respiration rates
decreased continuously after substrate addition. Therespiratory response of microorganisms from two
adjacent arable fields and meadows served as referencebut were not included in the statistical analysis.
The F values given in the text and tables refer to thosewhere the respective factor was fitted first (Schmid et al.
2002). Covariates were always fitted first, followed byblock. Then, the effects of plant species richness and
plant functional group richness were calculated, fol-lowed by presence/absence of certain plant functionalgroups. ANOVAs and comparisons of means (Tukey’s
hsd test, a , 0.05) were performed using SAS version9.1 (SAS Institute 2003). Means (and SE) presented in
the text and figures were calculated using non-trans-formed data.
RESULTS
Microorganisms
Basal respiration, microbial biomass, and specificrespiratory quotient changed significantly with time
(Table 2, Fig. 2). Basal respiration increased significant-
N. EISENHAUER ET AL.488 Ecology, Vol. 91, No. 2
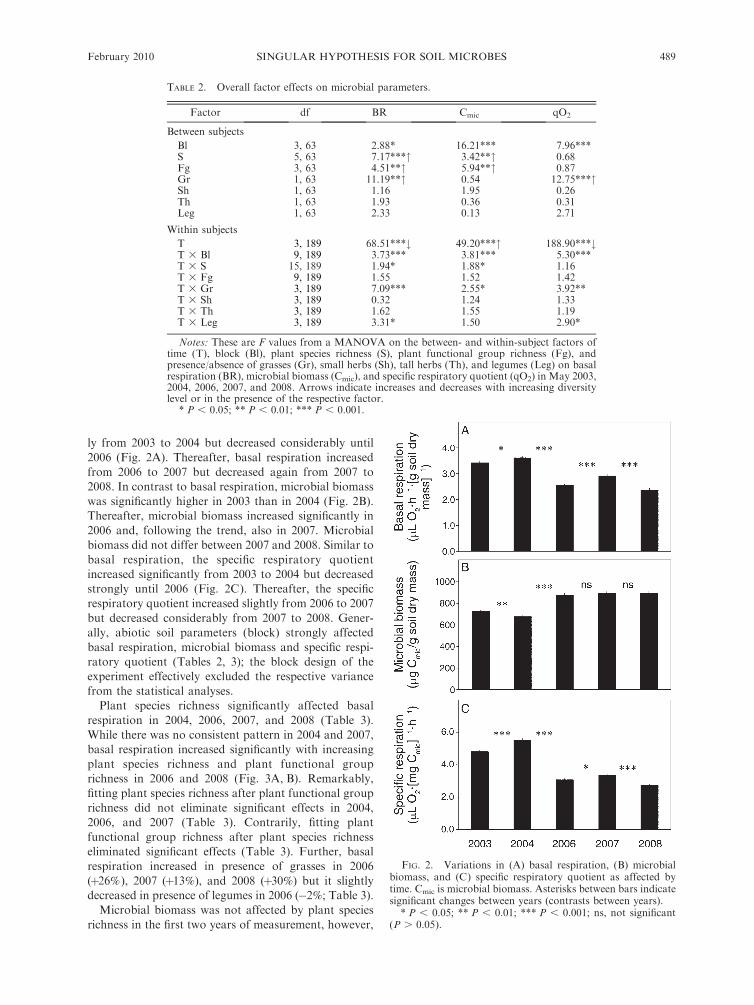
ly from 2003 to 2004 but decreased considerably until
2006 (Fig. 2A). Thereafter, basal respiration increased
from 2006 to 2007 but decreased again from 2007 to2008. In contrast to basal respiration, microbial biomass
was significantly higher in 2003 than in 2004 (Fig. 2B).Thereafter, microbial biomass increased significantly in
2006 and, following the trend, also in 2007. Microbial
biomass did not differ between 2007 and 2008. Similar tobasal respiration, the specific respiratory quotient
increased significantly from 2003 to 2004 but decreasedstrongly until 2006 (Fig. 2C). Thereafter, the specific
respiratory quotient increased slightly from 2006 to 2007
but decreased considerably from 2007 to 2008. Gener-ally, abiotic soil parameters (block) strongly affected
basal respiration, microbial biomass and specific respi-ratory quotient (Tables 2, 3); the block design of the
experiment effectively excluded the respective variance
from the statistical analyses.Plant species richness significantly affected basal
respiration in 2004, 2006, 2007, and 2008 (Table 3).
While there was no consistent pattern in 2004 and 2007,basal respiration increased significantly with increasing
plant species richness and plant functional grouprichness in 2006 and 2008 (Fig. 3A, B). Remarkably,
fitting plant species richness after plant functional group
richness did not eliminate significant effects in 2004,2006, and 2007 (Table 3). Contrarily, fitting plant
functional group richness after plant species richnesseliminated significant effects (Table 3). Further, basal
respiration increased in presence of grasses in 2006
(þ26%), 2007 (þ13%), and 2008 (þ30%) but it slightlydecreased in presence of legumes in 2006 (�2%; Table 3).
Microbial biomass was not affected by plant species
richness in the first two years of measurement, however,
TABLE 2. Overall factor effects on microbial parameters.
Factor df BR Cmic qO2
Between subjects
Bl 3, 63 2.88* 16.21*** 7.96***S 5, 63 7.17***" 3.42**" 0.68Fg 3, 63 4.51**" 5.94**" 0.87Gr 1, 63 11.19**" 0.54 12.75***"Sh 1, 63 1.16 1.95 0.26Th 1, 63 1.93 0.36 0.31Leg 1, 63 2.33 0.13 2.71
Within subjects
T 13, 189 68.51***# 49.20***" 188.90***#T 3 Bl 19, 189 3.73*** 3.81*** 5.30***T 3 S 15, 189 1.94* 1.88* 1.16T 3 Fg 19, 189 1.55 1.52 1.42T 3 Gr 13, 189 7.09*** 2.55* 3.92**T 3 Sh 13, 189 0.32 1.24 1.33T 3 Th 13, 189 1.62 1.55 1.19T 3 Leg 13, 189 3.31* 1.50 2.90*
Notes: These are F values from a MANOVA on the between- and within-subject factors oftime (T), block (Bl), plant species richness (S), plant functional group richness (Fg), andpresence/absence of grasses (Gr), small herbs (Sh), tall herbs (Th), and legumes (Leg) on basalrespiration (BR), microbial biomass (Cmic), and specific respiratory quotient (qO2) in May 2003,2004, 2006, 2007, and 2008. Arrows indicate increases and decreases with increasing diversitylevel or in the presence of the respective factor.
* P , 0.05; ** P , 0.01; *** P , 0.001.
FIG. 2. Variations in (A) basal respiration, (B) microbialbiomass, and (C) specific respiratory quotient as affected bytime. Cmic is microbial biomass. Asterisks between bars indicatesignificant changes between years (contrasts between years).
* P , 0.05; ** P , 0.01; *** P , 0.001; ns, not significant(P . 0.05).
February 2010 489SINGULAR HYPOTHESIS FOR SOIL MICROBES
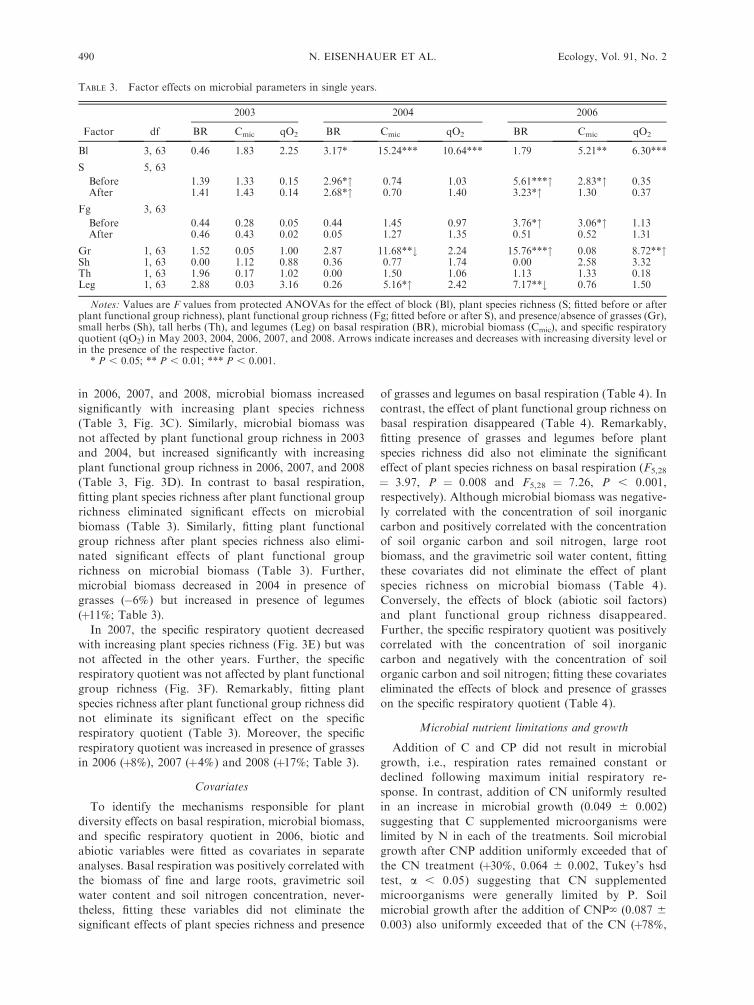
in 2006, 2007, and 2008, microbial biomass increased
significantly with increasing plant species richness
(Table 3, Fig. 3C). Similarly, microbial biomass was
not affected by plant functional group richness in 2003
and 2004, but increased significantly with increasing
plant functional group richness in 2006, 2007, and 2008
(Table 3, Fig. 3D). In contrast to basal respiration,
fitting plant species richness after plant functional group
richness eliminated significant effects on microbial
biomass (Table 3). Similarly, fitting plant functional
group richness after plant species richness also elimi-
nated significant effects of plant functional group
richness on microbial biomass (Table 3). Further,
microbial biomass decreased in 2004 in presence of
grasses (�6%) but increased in presence of legumes
(þ11%; Table 3).
In 2007, the specific respiratory quotient decreased
with increasing plant species richness (Fig. 3E) but was
not affected in the other years. Further, the specific
respiratory quotient was not affected by plant functional
group richness (Fig. 3F). Remarkably, fitting plant
species richness after plant functional group richness did
not eliminate its significant effect on the specific
respiratory quotient (Table 3). Moreover, the specific
respiratory quotient was increased in presence of grasses
in 2006 (þ8%), 2007 (þ4%) and 2008 (þ17%; Table 3).
Covariates
To identify the mechanisms responsible for plant
diversity effects on basal respiration, microbial biomass,
and specific respiratory quotient in 2006, biotic and
abiotic variables were fitted as covariates in separate
analyses. Basal respiration was positively correlated with
the biomass of fine and large roots, gravimetric soil
water content and soil nitrogen concentration, never-
theless, fitting these variables did not eliminate the
significant effects of plant species richness and presence
of grasses and legumes on basal respiration (Table 4). In
contrast, the effect of plant functional group richness on
basal respiration disappeared (Table 4). Remarkably,
fitting presence of grasses and legumes before plant
species richness did also not eliminate the significant
effect of plant species richness on basal respiration (F5,28
¼ 3.97, P ¼ 0.008 and F5,28 ¼ 7.26, P , 0.001,
respectively). Although microbial biomass was negative-
ly correlated with the concentration of soil inorganic
carbon and positively correlated with the concentration
of soil organic carbon and soil nitrogen, large root
biomass, and the gravimetric soil water content, fitting
these covariates did not eliminate the effect of plant
species richness on microbial biomass (Table 4).
Conversely, the effects of block (abiotic soil factors)
and plant functional group richness disappeared.
Further, the specific respiratory quotient was positively
correlated with the concentration of soil inorganic
carbon and negatively with the concentration of soil
organic carbon and soil nitrogen; fitting these covariates
eliminated the effects of block and presence of grasses
on the specific respiratory quotient (Table 4).
Microbial nutrient limitations and growth
Addition of C and CP did not result in microbial
growth, i.e., respiration rates remained constant or
declined following maximum initial respiratory re-
sponse. In contrast, addition of CN uniformly resulted
in an increase in microbial growth (0.049 6 0.002)
suggesting that C supplemented microorganisms were
limited by N in each of the treatments. Soil microbial
growth after CNP addition uniformly exceeded that of
the CN treatment (þ30%, 0.064 6 0.002, Tukey’s hsd
test, a , 0.05) suggesting that CN supplemented
microorganisms were generally limited by P. Soil
microbial growth after the addition of CNP‘ (0.087 6
0.003) also uniformly exceeded that of the CN (þ78%,
TABLE 3. Factor effects on microbial parameters in single years.
Factor df
2003 2004 2006
BR Cmic qO2 BR Cmic qO2 BR Cmic qO2
Bl 3, 63 0.46 1.83 2.25 3.17* 15.24*** 10.64*** 1.79 5.21** 6.30***
S 5, 63
Before 1.39 1.33 0.15 2.96*" 0.74 1.03 5.61***" 2.83*" 0.35After 1.41 1.43 0.14 2.68*" 0.70 1.40 3.23*" 1.30 0.37
Fg 3, 63
Before 0.44 0.28 0.05 0.44 1.45 0.97 3.76*" 3.06*" 1.13After 0.46 0.43 0.02 0.05 1.27 1.35 0.51 0.52 1.31
Gr 1, 63 1.52 0.05 1.00 2.87 11.68**# 2.24 15.76***" 0.08 8.72**"Sh 1, 63 0.00 1.12 0.88 0.36 0.77 1.74 0.00 2.58 3.32Th 1, 63 1.96 0.17 1.02 0.00 1.50 1.06 1.13 1.33 0.18Leg 1, 63 2.88 0.03 3.16 0.26 5.16*" 2.42 7.17**# 0.76 1.50
Notes: Values are F values from protected ANOVAs for the effect of block (Bl), plant species richness (S; fitted before or afterplant functional group richness), plant functional group richness (Fg; fitted before or after S), and presence/absence of grasses (Gr),small herbs (Sh), tall herbs (Th), and legumes (Leg) on basal respiration (BR), microbial biomass (Cmic), and specific respiratoryquotient (qO2) in May 2003, 2004, 2006, 2007, and 2008. Arrows indicate increases and decreases with increasing diversity level orin the presence of the respective factor.
* P , 0.05; ** P , 0.01; *** P , 0.001.
N. EISENHAUER ET AL.490 Ecology, Vol. 91, No. 2
Tukey’s hsd test, a , 0.05) and the CNP treatment
(þ36%, Tukey’s hsd test, a , 0.05) suggesting that other
nutrients were limiting growth of CNP supplemented
microorganisms. Soil microbial growth after nutrient
addition depended strongly on soil abiotic characteris-
tics (block) but the respective variance was excluded
from statistical analyses (Table 5).
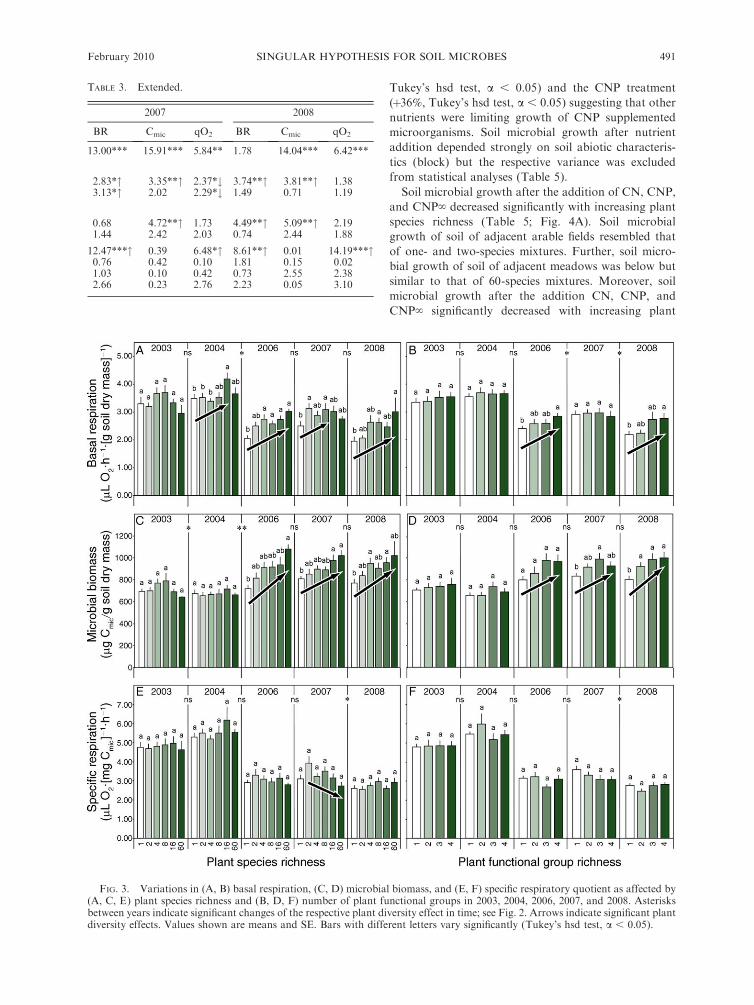
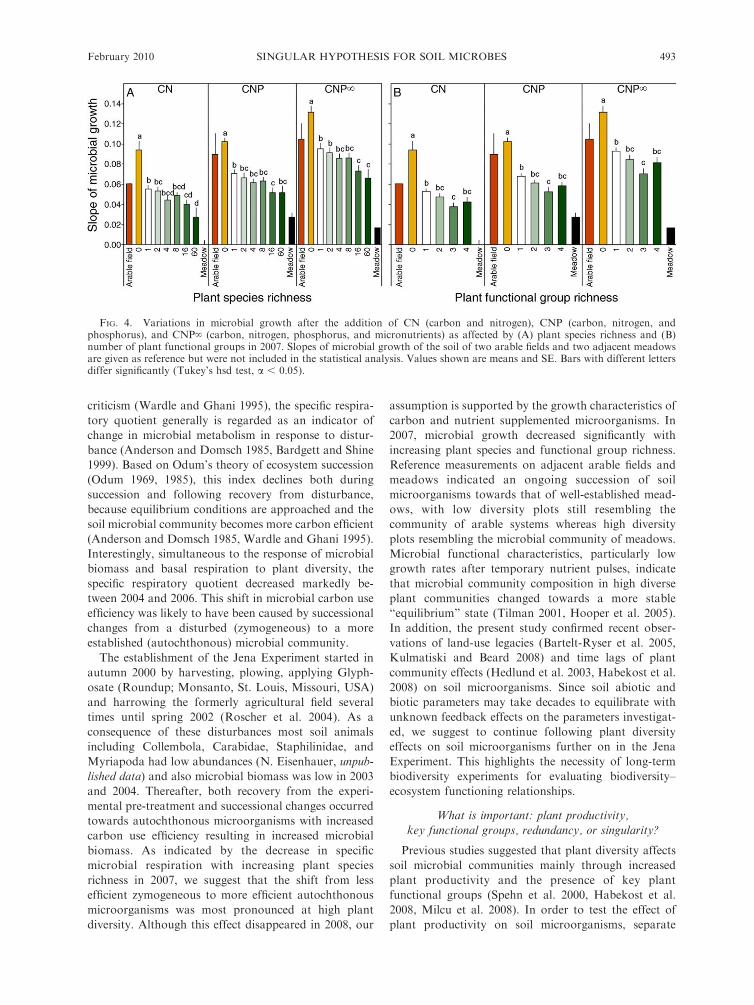
Soil microbial growth after the addition of CN, CNP,
and CNP‘ decreased significantly with increasing plant
species richness (Table 5; Fig. 4A). Soil microbial
growth of soil of adjacent arable fields resembled that
of one- and two-species mixtures. Further, soil micro-
bial growth of soil of adjacent meadows was below but
similar to that of 60-species mixtures. Moreover, soil
microbial growth after the addition CN, CNP, and
CNP‘ significantly decreased with increasing plant
TABLE 3. Extended.
2007 2008
BR Cmic qO2 BR Cmic qO2
13.00*** 15.91*** 5.84** 1.78 14.04*** 6.42***
2.83*" 3.35**" 2.37*# 3.74**" 3.81**" 1.383.13*" 2.02 2.29*# 1.49 0.71 1.19
0.68 4.72**" 1.73 4.49**" 5.09**" 2.191.44 2.42 2.03 0.74 2.44 1.88
12.47***" 0.39 6.48*" 8.61**" 0.01 14.19***"0.76 0.42 0.10 1.81 0.15 0.021.03 0.10 0.42 0.73 2.55 2.382.66 0.23 2.76 2.23 0.05 3.10
FIG. 3. Variations in (A, B) basal respiration, (C, D) microbial biomass, and (E, F) specific respiratory quotient as affected by(A, C, E) plant species richness and (B, D, F) number of plant functional groups in 2003, 2004, 2006, 2007, and 2008. Asterisksbetween years indicate significant changes of the respective plant diversity effect in time; see Fig. 2. Arrows indicate significant plantdiversity effects. Values shown are means and SE. Bars with different letters vary significantly (Tukey’s hsd test, a , 0.05).
February 2010 491SINGULAR HYPOTHESIS FOR SOIL MICROBES
functional group richness, with lowest values in
mixtures containing three plant functional groups
(Table 5; Fig. 4B). Again, soil microbial growth from
soil of adjacent arable fields resembled that of mixtures
with one plant functional group and soil microbial
growth of adjacent meadows was lower than that of
mixtures with three plant functional groups. Soil
microbial growth after the addition of CN (�29%) and
CNP‘ (�17%) was significantly lower in presence of
legumes (Table 5). Further, soil microbial growth after
the addition of CNP decreased slightly in presence of
tall herbs (�2%; Table 5).
DISCUSSION
Do diversity effects increase with time?
Previous studies reported a time-lag in the response of
soil microorganisms to changes in plant community
composition and land-use management (Hedlund et al.
2003, Bartelt-Ryser et al. 2005, Habekost et al. 2008,
Kulmatiski and Beard 2008). Consistent to these
findings and hypothesis 1, plant diversity effects on soil
microorganisms manifested only after a time lag of years
after establishment of the Jena Experiment.
The initial effects of the presence of certain plant
functional groups (grasses and legumes) on soil micro-
organisms occurred two years after the experiment was
set up; however, both microbial biomass and basal
respiration only increased with plant functional group
richness four years after establishment. Similarly,
microbial biomass and basal respiration increased with
increasing plant species richness at four years and
thereafter although basal respiration was already
significantly increased in 16 species mixtures after two
years.
As predominantly heterotrophic organisms, soil mi-
croorganisms essentially depend on plant-derived re-
sources entering the belowground system (Naeem et al.
2000, Wardle et al. 2004). Presumably, after establish-
ment of the experiment in 2002, dead plant materials
and root exudates needed to accumulate before differ-
ences in plant community composition became manifest
in specific microbial communities. Further, as indicated
by specific microbial respiration, microorganisms be-
came more energy efficient with time. Despite some
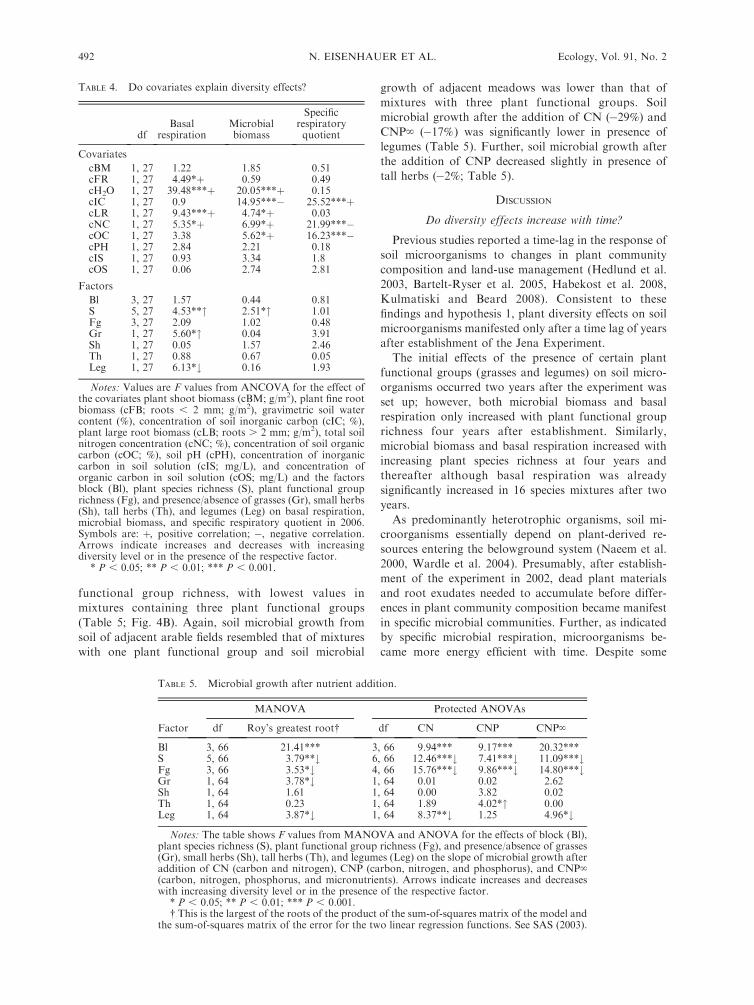
TABLE 4. Do covariates explain diversity effects?
dfBasal
respirationMicrobialbiomass
Specificrespiratoryquotient
Covariates
cBM 1, 27 1.22 1.85 0.51cFR 1, 27 4.49*þ 0.59 0.49cH2O 1, 27 39.48***þ 20.05***þ 0.15cIC 1, 27 0.9 14.95***� 25.52***þcLR 1, 27 9.43***þ 4.74*þ 0.03cNC 1, 27 5.35*þ 6.99*þ 21.99***�cOC 1, 27 3.38 5.62*þ 16.23***�cPH 1, 27 2.84 2.21 0.18cIS 1, 27 0.93 3.34 1.8cOS 1, 27 0.06 2.74 2.81
Factors
Bl 3, 27 1.57 0.44 0.81S 5, 27 4.53**" 2.51*" 1.01Fg 3, 27 2.09 1.02 0.48Gr 1, 27 5.60*" 0.04 3.91Sh 1, 27 0.05 1.57 2.46Th 1, 27 0.88 0.67 0.05Leg 1, 27 6.13*# 0.16 1.93
Notes: Values are F values from ANCOVA for the effect ofthe covariates plant shoot biomass (cBM; g/m2), plant fine rootbiomass (cFB; roots , 2 mm; g/m2), gravimetric soil watercontent (%), concentration of soil inorganic carbon (cIC; %),plant large root biomass (cLB; roots . 2 mm; g/m2), total soilnitrogen concentration (cNC; %), concentration of soil organiccarbon (cOC; %), soil pH (cPH), concentration of inorganiccarbon in soil solution (cIS; mg/L), and concentration oforganic carbon in soil solution (cOS; mg/L) and the factorsblock (Bl), plant species richness (S), plant functional grouprichness (Fg), and presence/absence of grasses (Gr), small herbs(Sh), tall herbs (Th), and legumes (Leg) on basal respiration,microbial biomass, and specific respiratory quotient in 2006.Symbols are: þ, positive correlation; �, negative correlation.Arrows indicate increases and decreases with increasingdiversity level or in the presence of the respective factor.
* P , 0.05; ** P , 0.01; *** P , 0.001.
TABLE 5. Microbial growth after nutrient addition.
Factor
MANOVA Protected ANOVAs
df Roy’s greatest root� df CN CNP CNP‘
Bl 3, 66 21.41*** 3, 66 9.94*** 9.17*** 20.32***S 5, 66 3.79**# 6, 66 12.46***# 7.41***# 11.09***#Fg 3, 66 3.53*# 4, 66 15.76***# 9.86***# 14.80***#Gr 1, 64 3.78*# 1, 64 0.01 0.02 2.62Sh 1, 64 1.61 1, 64 0.00 3.82 0.02Th 1, 64 0.23 1, 64 1.89 4.02*" 0.00Leg 1, 64 3.87*# 1, 64 8.37**# 1.25 4.96*#
Notes: The table shows F values from MANOVA and ANOVA for the effects of block (Bl),plant species richness (S), plant functional group richness (Fg), and presence/absence of grasses(Gr), small herbs (Sh), tall herbs (Th), and legumes (Leg) on the slope of microbial growth afteraddition of CN (carbon and nitrogen), CNP (carbon, nitrogen, and phosphorus), and CNP‘(carbon, nitrogen, phosphorus, and micronutrients). Arrows indicate increases and decreaseswith increasing diversity level or in the presence of the respective factor.
* P , 0.05; ** P , 0.01; *** P , 0.001.� This is the largest of the roots of the product of the sum-of-squares matrix of the model and
the sum-of-squares matrix of the error for the two linear regression functions. See SAS (2003).
N. EISENHAUER ET AL.492 Ecology, Vol. 91, No. 2
criticism (Wardle and Ghani 1995), the specific respira-
tory quotient generally is regarded as an indicator of
change in microbial metabolism in response to distur-
bance (Anderson and Domsch 1985, Bardgett and Shine
1999). Based on Odum’s theory of ecosystem succession
(Odum 1969, 1985), this index declines both during
succession and following recovery from disturbance,
because equilibrium conditions are approached and the
soil microbial community becomes more carbon efficient
(Anderson and Domsch 1985, Wardle and Ghani 1995).
Interestingly, simultaneous to the response of microbial
biomass and basal respiration to plant diversity, the
specific respiratory quotient decreased markedly be-
tween 2004 and 2006. This shift in microbial carbon use
efficiency was likely to have been caused by successional
changes from a disturbed (zymogeneous) to a more
established (autochthonous) microbial community.
The establishment of the Jena Experiment started in
autumn 2000 by harvesting, plowing, applying Glyph-
osate (Roundup; Monsanto, St. Louis, Missouri, USA)
and harrowing the formerly agricultural field several
times until spring 2002 (Roscher et al. 2004). As a
consequence of these disturbances most soil animals
including Collembola, Carabidae, Staphilinidae, and
Myriapoda had low abundances (N. Eisenhauer, unpub-
lished data) and also microbial biomass was low in 2003
and 2004. Thereafter, both recovery from the experi-
mental pre-treatment and successional changes occurred
towards autochthonous microorganisms with increased
carbon use efficiency resulting in increased microbial
biomass. As indicated by the decrease in specific
microbial respiration with increasing plant species
richness in 2007, we suggest that the shift from less
efficient zymogeneous to more efficient autochthonous
microorganisms was most pronounced at high plant
diversity. Although this effect disappeared in 2008, our
assumption is supported by the growth characteristics of
carbon and nutrient supplemented microorganisms. In
2007, microbial growth decreased significantly with
increasing plant species and functional group richness.
Reference measurements on adjacent arable fields and
meadows indicated an ongoing succession of soil
microorganisms towards that of well-established mead-
ows, with low diversity plots still resembling the
community of arable systems whereas high diversity
plots resembling the microbial community of meadows.
Microbial functional characteristics, particularly low
growth rates after temporary nutrient pulses, indicate
that microbial community composition in high diverse
plant communities changed towards a more stable
‘‘equilibrium’’ state (Tilman 2001, Hooper et al. 2005).
In addition, the present study confirmed recent obser-
vations of land-use legacies (Bartelt-Ryser et al. 2005,
Kulmatiski and Beard 2008) and time lags of plant
community effects (Hedlund et al. 2003, Habekost et al.
2008) on soil microorganisms. Since soil abiotic and
biotic parameters may take decades to equilibrate with
unknown feedback effects on the parameters investigat-
ed, we suggest to continue following plant diversity
effects on soil microorganisms further on in the Jena
Experiment. This highlights the necessity of long-term
biodiversity experiments for evaluating biodiversity–
ecosystem functioning relationships.
What is important: plant productivity,
key functional groups, redundancy, or singularity?
Previous studies suggested that plant diversity affects
soil microbial communities mainly through increased
plant productivity and the presence of key plant
functional groups (Spehn et al. 2000, Habekost et al.
2008, Milcu et al. 2008). In order to test the effect of
plant productivity on soil microorganisms, separate
FIG. 4. Variations in microbial growth after the addition of CN (carbon and nitrogen), CNP (carbon, nitrogen, andphosphorus), and CNP‘ (carbon, nitrogen, phosphorus, and micronutrients) as affected by (A) plant species richness and (B)number of plant functional groups in 2007. Slopes of microbial growth of the soil of two arable fields and two adjacent meadowsare given as reference but were not included in the statistical analysis. Values shown are means and SE. Bars with different lettersdiffer significantly (Tukey’s hsd test, a , 0.05).
February 2010 493SINGULAR HYPOTHESIS FOR SOIL MICROBES
analyses were performed fitting plant productivity
parameters (shoot biomass, fine root biomass, large root
biomass) as covariates. In contrast to our hypothesis 2,
shoot biomass was not correlated and fine and large root
biomass only weakly correlated with soil microbial
biomass and respiration, and therefore did not affect
the significance of plant species richness effects. Thus,
the results support the conclusions of the recent
laboratory experiment of Milcu et al. (2006) suggesting
that the quality of rhizodeposits rather than plant pro-
ductivity per se and the quantity of resources affects the
functioning of microorganisms in soil.
Unexpectedly, the presence of grasses and legumes,
which are regarded as key plant functional groups for
soil microbial communities (Spehn et al. 2000, Hedlund
et al. 2003, Milcu et al. 2008), had inconsistent effects on
soil microbial functioning. Although grasses produce
large amounts of fine roots thereby providing large
amounts of root-derived resources and legumes increase
nitrogen availability in soil (Oelmann et al. 2007,
Temperton et al. 2007), the effects of grasses and le-
gumes generally were of minor importance. Moreover,
the significant increase in microbial biomass and basal
respiration with increasing plant species richness was not
due to the presence of particular plant functional
groups; the effect did not disappear when presence of
grasses and legumes were fitted before plant species
richness. This indicates that plant diversity effects on the
functioning of belowground systems likely were due to
species complementarity rather than due to certain plant
functional group characteristics.
Previously, the soil system has been considered to be
affected mainly by the number and identity of plant
functional groups rather than by plant species richness
per se (Bardgett and Shine 1999, Spehn et al. 2000,
Milcu et al. 2008, Scherer-Lorenzen 2008), which is
conform to the redundancy hypothesis of biodiversity
suggesting that only a small number of species are
needed to maintain ecosystem functioning (Walker
1992, Naeem and Li 1997). In contrast, the singular
hypothesis of biodiversity, assuming that each species
contributes to ecosystem functioning, has received little
experimental support (Naeem et al. 2002). The design of
the Jena Experiment offers the possibility to disentangle
effects of plant species richness and plant functional
group richness (Roscher et al. 2004). In contrast to
prevalent view and our hypothesis 3, results of the
present study highlight the importance of plant species
richness for soil microbial functioning. Microbial
respiration, biomass, carbon use efficiency, and respira-
tory response to nutrients changed significantly with
increasing plant species richness, whereas plant func-
tional group richness and presence of certain key plant
functional groups were of minor importance. Remark-
ably, including abiotic and biotic factors as covariates
into the statistical analysis strengthened rather than
reduced the significance of the plant species richness
effect, whereas the effect of plant functional group
richness was eliminated. In particular, although mea-
sures of soil nutrient availability and plant productivity
were positively correlated with soil microbial parameters
(significant correlations between BR and concentration
of soil nitrogen, fine root biomass, and large root
biomass and between Cmic and concentration of soil
organic carbon, soil nitrogen, and large root biomass),
this did not eliminate plant species richness effects
indicating that the quality of resources was more
important than the quantity. Moreover, fitting plant
species richness after plant functional group richness did
not eliminate significant effects of plant species richness
on basal respiration in 2004, 2006, and 2007. On the
contrary, the effect of plant functional group richness on
basal respiration disappeared when fitted second. This
indicates that diversity effects on soil microbial func-
tioning were not only due to differences between plant
functional groups but most likely due to impacts of
single plant species. The results therefore suggest that
plant litter materials and root exudates that govern the
succession of microbial communities and their function-
ing are plant species specific rather than plant functional
group specific. Since the biochemical composition of
plant litter and root exudates differs among plant
species, changes in plant diversity likely altered the
quality of resources entering the decomposer system,
thereby controlling microbial biomass, respiration, and
community composition (Zak et al. 2003, Milcu et al.
2006, Nilsson et al. 2008). This is in stark contrast to the
redundancy hypothesis and supports the singular
hypothesis for soil microorganisms highlighting that
species are unique and affect ecosystem functioning
(Naeem et al. 2002).
Conclusions
The present study suggests for the first time that
microbial community functioning is driven by plant
species specific characters, i.e., responds conform to the
singular hypothesis of biodiversity. This contrasts the
dominant view that the functioning of decomposer
systems is rather insensitive to changes in plant species
and characterized by high redundancy among species.
We conclude that the quality of litter and rhizodeposits
rather than plant productivity, i.e., the amount of
resources entering the decomposer system, affects the
soil microbial community. As the decomposer system
provides essential ecosystem services, such as litter
decomposition and nutrient mineralization, plant–de-
composer interrelationships need closer consideration
for managing agricultural and forestry systems in a
sustainable way. The results reinforce the need for long-
term biodiversity experiments to fully appreciate the
consequences of current biodiversity loss.
ACKNOWLEDGMENTS
We thank numerous people who helped to establish andmanage the experimental field site, particularly, the formercoordinator C. Roscher and the gardeners S. Eismann, S.Hengelhaupt, S. Junghans, H. Scheffler, and U. Wehmeier.
N. EISENHAUER ET AL.494 Ecology, Vol. 91, No. 2
Further, we thank T. Volovei, A. Jousset, and K. Pfisterer forhelp during respiration measurements. Constructive commentsof B. Schmid, M. Scherer-Lorenzen, and V. Temperton helpedto improve the manuscript. Finally, we thank two anonymousreferees for their helpful critiques, which helped to improve themanuscript. The Jena Experiment is funded by the GermanScience Foundation (FOR 456).
LITERATURE CITED
Anderson, J. P. E., and K. H. Domsch. 1978. A physiologicalmethod for the quantitative measurement of microbialbiomass in soil. Soil Biology and Biochemistry 10:215–221.
Anderson, J. P. E., and K. H. Domsch. 1980. Quantities ofplant nutrients in the microbial biomass of selected soils. SoilScience 130:211–216.
Anderson, T.-H., and K. H. Domsch. 1985. Determination ofecophysiological maintenance carbon requirements of soilmicroorganisms in a dormant state. Biology and Fertility ofSoils 1:81–89.
Bardgett, R. D., W. D. Bowman, R. Kaufmann, and S. K.Schmidt. 2005. A temporal approach to linking abovegroundand belowground ecology. Trends in Ecology and Evolution20:634–641.
Bardgett, R. D., and A. Shine. 1999. Linkages between plantlitter diversity, soil microbial biomass and ecosystem functionin temperate grasslands. Soil Biology and Biochemistry 31:317–321.
Bartelt-Ryser, J., J. Joshi, B. Schmid, H. Brandl, and T. Balser.2005. Soil feedbacks of plant diversity on soil microbialcommunities and subsequent plant growth. Perspectives inPlant Ecology, Evolution and Systematics 7:27–49.
Beck, T., R. G. Joergensen, E. Kandeler, F.Makeschin, E. Nuss,H. R. Oberholzer, and S. Scheu. 1997. An inter-laboratorycomparison of ten different ways of measuring soil microbialbiomass C. Soil Biology and Biochemistry 29:1023–1032.
Cardinale, B. J., J. P. Wright, M. W. Cadotte, I. T. Carroll, A.Hector, D. S. Srivastava, M. Loreau, and J. J. Weis. 2007.Impacts of plant diversity on biomass production increasethrough time because of species complementarity. Proceedingsof theNationalAcademy of Sciences (USA) 104:18123–18128.
Freiberg, E. 1998. Microclimatic parameters influencing nitro-gen fixation in the phyllosphere in a Costa Rican premontanerain forest. Oecologia 17:9–18.
Gastine, A., M. Scherer-Lorenzen, and P. W. Leadley. 2003.No consistent effects of plant diversity on root biomass, soilbiota and soil abiotic conditions in temperate grasslandcommunities. Applied Soil Ecology 24:101–111.
Habekost, M., N. Eisenhauer, S. Scheu, W. Weigelt, and G.Gleixner. 2008. Seasonal changes in the soil microbialcommunity in a grassland plant diversity gradient four yearsafter establishment. Soil Biology and Biochemistry 40:2588–2595.
Hector, A., and R. Bagchi. 2007. Biodiversity and ecosystemmultifunctionality. Nature 448:188–191.
Hedlund, K., et al. 2003. Plant species diversity, plant biomassand responses of the soil community on abandoned landacross Europe: idiosyncracy or above–belowground timelags. Oikos 103:45–58.
Hooper, D. U., et al. 2005. Effects of biodiversity on ecosystemfunctioning: a consensus of current knowledge. EcologicalMonographs 75:3–35.
Huston, M. A. 1997. Hidden treatments in ecological experi-ments: re-evaluating the ecosystem function of biodiversity.Oecologia 108:449–460.
Jenkins, M. 2003. Prospects for biodiversity. Science 302:1175–1177.
Kluge, G., and G. Muller-Westermeier. 2000. Das Klimaausgewahlter Orte der Bundesrepublik Deutschland: Jena.Berichte des Deutschen Wetterdienstes, 213, Offenbach/Main, Germany.
Kulmatiski, A., and K. H. Beard. 2008. Decoupling plant-growth from land-use legacies in soil microbial communities.Soil Biology and Biochemistry 40:1059–1068.
Liu, Z., G. Liu, B. Fu, and X. Zheng. 2008. Relationshipbetween plant species diversity and soil microbial functionaldiversity along a longitudal gradient in temperate grasslandsof Hulunbeir, Inner Mongolia, China. Ecological Research23:511–518.
Loreau, M. 2000. Biodiversity and ecosystem functioning:recent theoretical advances. Oikos 91:3–17.
Loreau, M., S. Naeem, P. Inchausti, J. Bengtsson, J. P. Grime,A. Hector, D. U. Hooper, M. A. Huston, D. Raffaelli, B.Schmid, D. Tilman, and D. A. Wardle. 2001. Biodiversityand ecosystem functioning: current knowledge and futurechallenges. Science 294:804–808.
Lorentzen, S., C. Roscher, J. Schumacher, E.-D. Schulze, andB. Schmid. 2008. Species richness and identity affect the useof aboveground space in experimental grasslands. Perspec-tives in Plant Ecology, Evolution and Systematics 10:73–87.
Milcu, A., S. Partsch, R. Langel, and S. Scheu. 2006. Theresponse of decomposers (earthworms, springtails andmicroorganisms) to variations in species and functionalgroup diversity of plants. Oikos 112:513–524.
Milcu, A., S. Partsch, C. Scherber, W. W. Weisser, and S.Scheu. 2008. Earthworms and legumes control litter decom-position in a plant diversity gradient. Ecology 89:1872–1882.
Millenium Ecosystem Assessment. 2005. Ecosystems andhuman well-being: biodiversity synthesis. World ResourcesInstitute, Washington, D.C., USA.
Naeem, S., D. R. Hahn, and G. Schuurman. 2000. Producer–decomposer co-dependency influences biodiversity effects.Nature 403:762–764.
Naeem, S., and S. Li. 1997. Biodiversity enhances ecosystemreliability. Nature 390:507–509.
Naeem, S., M. Loreau, and P. Inchausti. 2002. Biodiversity andecosystem functioning: the emergence of a synthetic ecolog-ical framework. Pages 3–11 in M. Loreau, S. Naeem, and P.Inchausti, editors. Biodiversity and ecosystem functioning.Oxford University Press, Oxford, UK.
Nilsson, M.-C., D. A. Wardle, and T. H. DeLuca. 2008.Belowground and aboveground consequences of interactionsbetween live plant species mixtures and dead organicsubstrate mixtures. Oikos 117:439–449.
Odum, E. P. 1969. The strategy of ecosystem development.Science 164:262–270.
Odum, E. P. 1985. Trends expected in stressed ecosystems.BioScience 35:419–422.
Oelmann, Y., Y. Kreutziger, V. M. Temperton, N. Buchmann,C. Roscher, J. Schumacher, E.-D. Schulze, W. W. Weisser,and W. Wilcke. 2007. Nitrogen and phosphorus budgets inexperimental grasslands of variable diversity. Journal ofEnvironmental Quality 36:396–407.
Roscher, C., J. Schumacher, J. Baade, W. Wilcke, G. Gleixner,W. W. Weisser, B. Schmid, and E.-D. Schulze. 2004. The roleof biodiversity for element cycling and trophic interactions:an experimental approach in a grassland community. Basicand Applied Ecology 5:107–121.
Sala, O. E., et al. 2000. Global biodiversity scenarios for theyear 2100. Science 287:1770–1774.
SAS Institute. 2003. SAS version 9.1. SAS Institute, Inc., Cary,North Carolina, USA.
Scherer-Lorenzen, M. 2008. Functional diversity affects de-composition processes in experimental grasslands. Function-al Ecology 22:547–555.
Scheu, S. 1992. Automated measurement of the respiratoryresponse of soil microcompartments: active microbial bio-mass in earthworm faeces. Soil Biology and Biochemistry 24:1113–1118.
Scheu, S. 1993. Analysis of the microbial nutrient status in soilmicrocompartments: earthworm faeces from a basalt-lime-stone gradient. Geoderma 56:575–586.
February 2010 495SINGULAR HYPOTHESIS FOR SOIL MICROBES
Schmid, B., A. Hector, M. A. Huston, P. Inchausti, I. Nijs,P. W. Leadley, and D. Tilman. 2002. The design and analysisof biodiversity experiments. Pages 61–75 in M. Loreau, S.Naeem, and P. Inchausti, editors. Biodiversity and ecosystemfunctioning. Oxford University Press, Oxford, UK.
Spehn, E. M., J. Joshi, B. Schmid, J. Alphei, and C. Korner.2000. Plant diversity effects on soil heterotrophic activity inexperimental grassland ecosystems. Plant and Soil 224:217–230.
Temperton, V. M., P. N. Mwangi, M. Scherer-Lorenzen, B.Schmid, and N. Buchmann. 2007. Positive interactionsbetween nitrogen-fixing legumes and four different neigh-bouring species in a biodiversity experiment. Oecologia 151:190–205.
Tilman, D. 2000. Causes, consequences and ethics of biodiver-sity. Nature 405:208–211.
Tilman, D. 2001. Effects of diversity and composition ongrassland stability and productivity. Pages 183–207 in M. C.Press, N. J. Huntly, and S. Levin, editors. Ecology:achievement and challenge. Blackwell Science, Oxford, UK.
Tilman, D., P. B. Reich, M. H. Knops, D. Wedin, T. Mielke,and C. Lehman. 2001. Diversity and productivity in a long-term grassland experiment. Science 294:843–845.
Vitousek, P. M., H. A. Mooney, J. Lubchenco, and J. M.Melillo. 1997. Human domination of earth’s ecosystems.Science 277:494–499.
Walker, B. H. 1992. Biodiversity and ecological redundancy.Conservation Biology 6:18–23.
Wardle, D. A., R. D. Bardgett, J. N. Klironomos, H. Setala,W. H. van der Putten, and D. H. Wall. 2004. Ecologicallinkages between aboveground and belowground biota.Science 304:1629–1633.
Wardle, D. A., and A. Ghani. 1995. A critique of the microbialmetabolic quotient (qCO2) as a bioindicator of disturbanceand ecosystem development. Soil Biology and Biochemistry27:1601–1610.
Zak, D. R., W. E. Holmes, D. C. White, A. D. Peacock, and D.Tilman. 2003. Plant diversity, soil microbial communities,and ecosystem function: Are there any links? Ecology 84:2042–2050.
N. EISENHAUER ET AL.496 Ecology, Vol. 91, No. 2